Title Page Improved Natural Gas Storage Well Remediation FINAL REPORT BUDGET PERIOD TWO FOR THE NATIONAL ENERGY TECHNOLOGY LABORATORY Reporting Period Start Date: December 1999 Reporting Period End Date: December 2004 Principal Authors: Paul David Paulsen, Furness-Newburge, Inc. James C. Furness, Furness-Newburge, Inc. Lynn Furness, Furness-Newburge, Inc. Donald O. Johnson, TechSavants, Inc. Michael L. Wilkey, TechSavants, Inc. Report Issue Date : January 2005 DOE Award Number: DE-FC26-99FT40704 Name and Address of Submitting Organization: Furness-Newburge, Inc. 376 Crossfield Drive Versailles, KY 40383-1449 Subcontractor: TechSavants, Inc. 211 E. Illinois Street Lower Level Wheaton, IL 60187
Transcript
Title Page
Improved Natural Gas Storage Well Remediation FINAL REPORT BUDGET PERIOD TWO
FOR THE NATIONAL ENERGY TECHNOLOGY LABORATORY
Reporting Period Start Date: December 1999 Reporting Period End Date: December 2004 Principal Authors: Paul David Paulsen, Furness-Newburge, Inc.
James C. Furness, Furness-Newburge, Inc. Lynn Furness, Furness-Newburge, Inc. Donald O. Johnson, TechSavants, Inc. Michael L. Wilkey, TechSavants, Inc.
Report Issue Date: January 2005 DOE Award Number: DE-FC26-99FT40704 Name and Address of Submitting Organization: Furness-Newburge, Inc.
376 Crossfield Drive Versailles, KY 40383-1449
Subcontractor: TechSavants, Inc.
211 E. Illinois Street Lower Level Wheaton, IL 60187
2
DISCLAIMER This report was prepared as an account of work sponsored by an agency of the United States Government. Neither the United States Government nor any agency thereof, nor any of their employees, makes any warranty, express or implied, or assumes any legal liability or responsibility for the accuracy, completeness, or usefulness of any information, apparatus, product, or process disclosed, or represents that its use would not infringe privately owned rights. Reference herein to any specific commercial product, process, or service by trade name, trademark, manufacturer, or otherwise does not necessarily constitute or imply its endorsement, recommendation, or favoring by the United States Government or any agency thereof. The views and opinions of authors expressed herein do not necessarily state or reflect those of the United States Government or any agency thereof.
3
ABSTRACT Project # DE-FC26-99FT40704
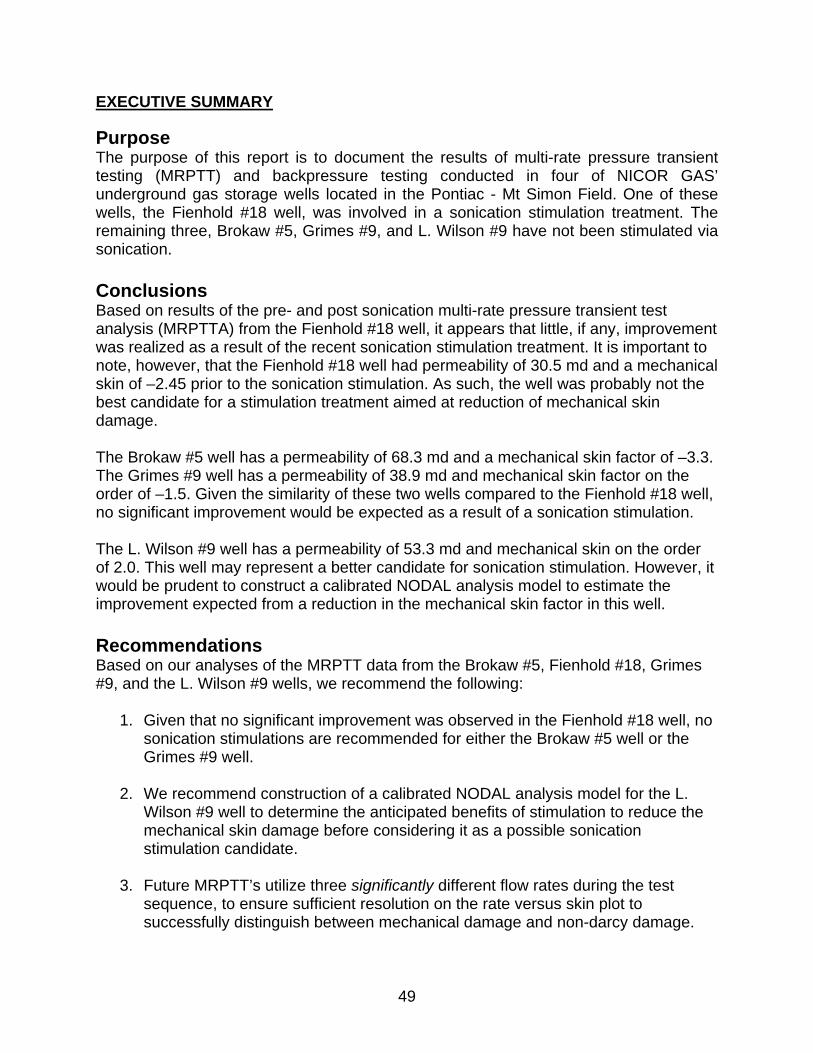
The project team of Furness-Newburge, Inc. (FNI), TechSavants, Inc. (TSI) and Nicor Gas was engaged in DOE sponsored research to develop a sonic tool to treat underground natural gas storage wells. One of the primary damage mechanisms for these wells is the formation of scale at the perforations or at the sand face through which the gas flows during gas injection and withdrawal. During well evaluation with backpressure and multi-rate pressure transient tests, this blockage exhibits itself as mechanical skin. The sonic treatment concept is to apply high intensity sound waves to help dissolve and break-up this scale and improve gas flow. In budget period 1, the project team developed a down-hole sonic tool, performed pilot testing above ground, and performed a brief field test. In this second budget period, the project team further developed the tool and performed two extended field tests (Field Tests A & B) with subsequent well productivity evaluation. To prepare for both field tests, the sonic tool was re-designed to increase its power and to make it more robust. This hardening of the sonic tool resulted in more than 20 hours of operation in Field Test A and more than 28 hours of operation in Field Test B without failure. The prior tool design had failed after 3 hours of field operation. The project team performed pilot testing at FNI’s facility prior to each field test in order to troubleshoot and optimize the tool’s field deployment. In Field Test A, the tool was deployed and operated in the perforation zone (3005 to 3115) of Nicor Gas’ Fienhold #18 well in Illinois. The sonic tool treated every 5-foot increment of this zone for 45 minutes over a three-day period. Backpressure and pressure transient tests on this well displayed no change or a slight decrease in well productivity. However, large changes in the well water chemical composition indicated that sonication did alter the well environment. Post-test analysis indicated that this well had a negative mechanical skin of -2.45 prior to sonication. Thus, this well was a poor candidate for a stimulation treatment aimed at the reduction of mechanical skin damage from scale formation. Learning from Field Test A, the project team made several improvements in the sonic tool operation and deployment for Field Test B. The tool was modified and re-tested so it could be deployed through the well tubing. This tool modification saved the cost of removing and re-inserting the tubing. The operating power of the tool in the perforation zone was increased by reducing the wire line losses and increasing the power supplied to the wire line at the surface. The project team deployed and operated the tool in the perforation zone (3559 to 3674) over four days at Nicor Gas’ L. Wilson #9 well. Comparisons of pre- and post- sonication data from both backpressure and pressure transient tests indicated that sonication improved this well’s productivity. The mechanical skin coefficient dropped from +2.5 to -1.3 after the sonication treatment of the well and the absolute open flow potential increased 28% from 110 to 141 MMscf/D. These results helped to validate the hypothesis that sonication would be an effective tool in removing well damage due to scale formation. The project team proposes that the L. Wilson well be re-evaluated with future pressure transient tests to document the lasting effect of this sonic treatment and believes that this report will encourage additional testing and use of sonication technology in the energy industry.
4
Table of Contents
TITLE PAGE 1
DISCLAIMER 2
ABSTRACT 3
Table of Contents 4
List of Graphical Materials 6 Tables 6 Figures 6
Introduction 8
Executive Summary 9
FIELD TEST A 11
Experimental 11 Task 5: Building a Second Field Hardened Tool 11
Task 6: Develop Comprehensive Field Test Plan (FTP) 11 Subtask 6A: Site Selection/Safety Review 11 Subtask 6B: Site Engineering/Preparation 11 Subtask 6C: Tasking and Protocols 12
Task 7: Field Test 12 Subtask 7A: Determine Baseline Conditions 12 Subtask 7B: Sonic Tool Testing 12 Subtask 7C: Post-Field Test Operations 14
Results and Discussion 15 Task 8: Data Analysis & Final Report Preparation 15
Water Chemistry 15 Flow Prover Test 17 Pressure Transient Tests 18 Gamma Ray and Neutron Logs 21
Conclusion 22 Task 9: Project Review & Technical Paper 22
FIELD TEST B 24
Experimental 24 Task 10: Develop Comprehensive Field Test Plan (FTP) 24
Subtask 10A: Site Selection/Safety Review 25 Subtask 10B: Site Engineering/Preparation 26
5
Subtask 10C: Tasking and Protocols 26 Task 11: Field Test 26
Subtask 11A: Determine Baseline Conditions 26 Subtask 11B: Sonic Tool Testing 26 Subtask 11C: Post Field-Test Operations 34
Results and Discussion 34 Task 12: Data Analysis & Final Report Preparation 34
Backpressure Tests 35 Pressure Transient Tests 36
Conclusion 39 Task 13: Project Review & Technical Paper 39
References 40
APPENDIX A: FIELD TEST PLAN 41
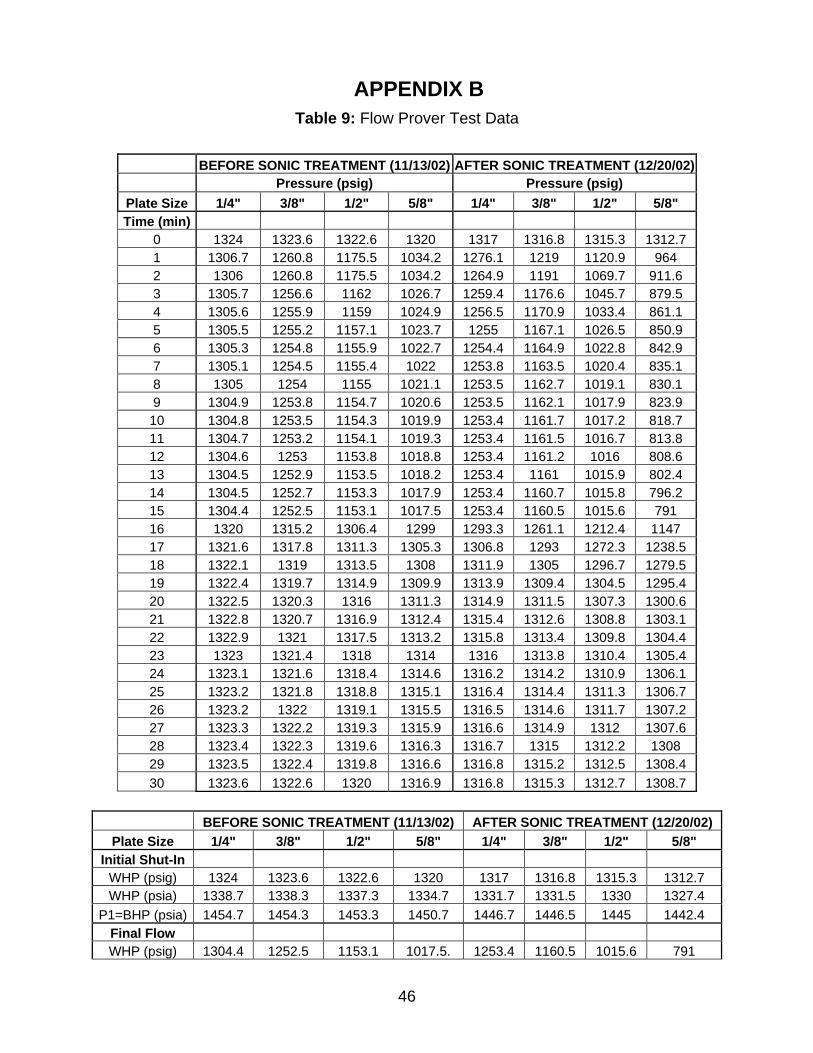
APPENDIX B: FLOW PROVER TEST DATA 46
APPENDIX C: SCHLUMBERGER DATA & CONSULTING SERVICES ANALYSIS DEC 2003 48
APPENDIX D: GAMMA RAY AND NEUTRON LOGS 63
APPENDIX E: SCHLUMBERGER DATA & CONSULTING SERVICES ANALYSIS DEC 2004 65
6
List of Graphical Materials
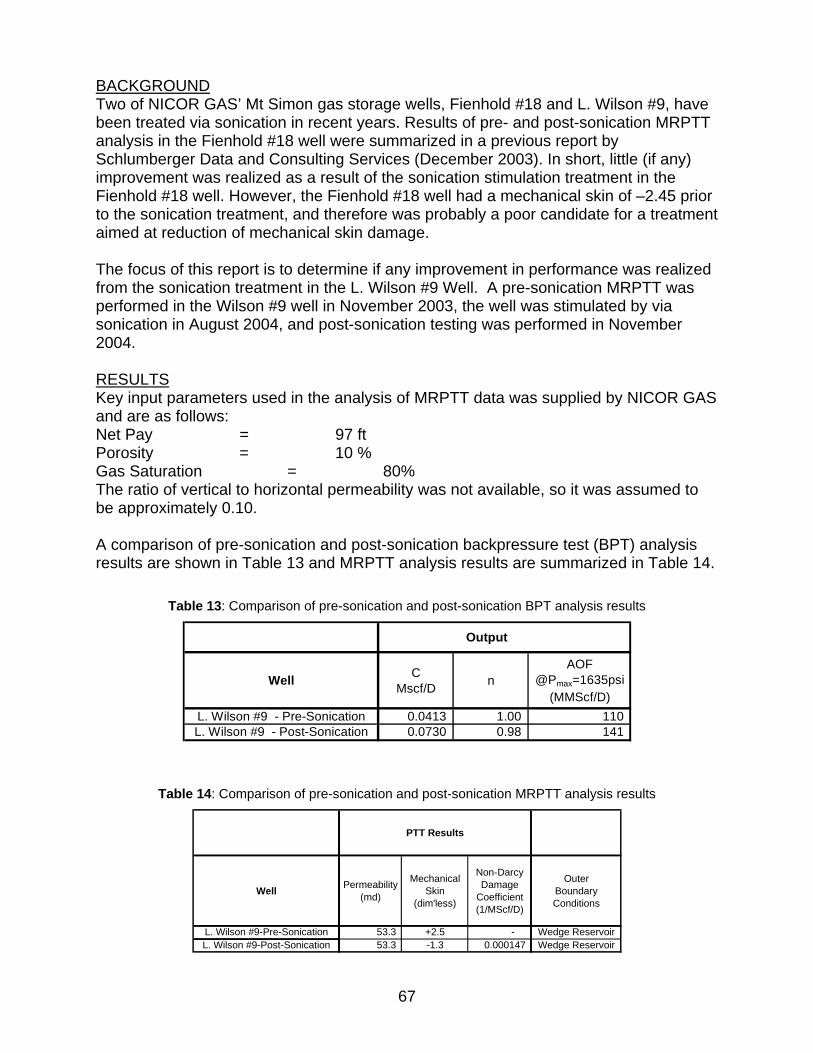
Tables Table 1: Field Test A Treatment Conditions .................................................................. 13 Table 2: Water Chemistry Analyses Before and After Sonication at 3 Different Depths 15 Table 3: Water Chemistry Changes from Sonic Treatment ........................................... 16 Table 4: Summary of Schlumberger analysis results .................................................... 19 Table 5: Comparison of Water Chemistry Changes for the Two Initial Field Tests ....... 23 Table 6: MRPTT Analysis of Candidate Wells............................................................... 25 Table 7: Summary of Field Test B Treatment Conditions.............................................. 32 Table 8: Summary of Schlumberger analysis for L. Wilson #9 ...................................... 36 Table 9: Flow Prover Test Data..................................................................................... 46 Table 10: Summary of key input parameters................................................................. 50 Table 11: Summary of BPT analysis results.................................................................. 51 Table 12: Summary of MRPTT analysis results ............................................................ 51 Table 13: Comparison of pre-sonication and post-sonication BPT analysis results ...... 67 Table 14: Comparison of pre-sonication and post-sonication MRPTT analysis results . 67 Figures Figure 1: Pressure-Time Data for Fienhold #18 Well Pre- and Post-Sonication............ 17 Figure 2: Pressure-Flow Calculation Data for Fienhold #18 Well Pre- and Post-
Sonication ................................................................................................ 18 Figure 3: Backpressure Data for Fienhold #18 after Second Post Sonication Test....... 19 Figure 4: Type Curve Analysis of Falloff Period #3 From PTTA in Fienhold #18 Well for
Post Sonication Analysis.......................................................................... 20 Figure 5: Semi-Log PTT analysis (post-sonication) - Fienhold #18............................... 20 Figure 6: Rate vs Total Skin from MRPTT in Fienhold #18 ........................................... 21 Figure 7: Acoustic horns on the downhole tool.............................................................. 27 Figure 8: Acoustic power supplies................................................................................. 28 Figure 9: Wire line truck and separate external power generator.................................. 29 Figure 10: Acoustic tool with connectors ....................................................................... 30 Figure 11: Insertion of acoustic tool into well................................................................. 31 Figure 12: Water Depth of L. Wilson #9 Well During Treatment.................................... 34 Figure 13: Bottom hole pressure during post-sonication test in L. Wilson #9 ................ 35 Figure 14: L. Wilson #9 backpressure plots for Pre- and Post-sonication ..................... 35 Figure 15: Type curve analysis plot of falloff period #2 in L. Wilson #9 Well (Post-
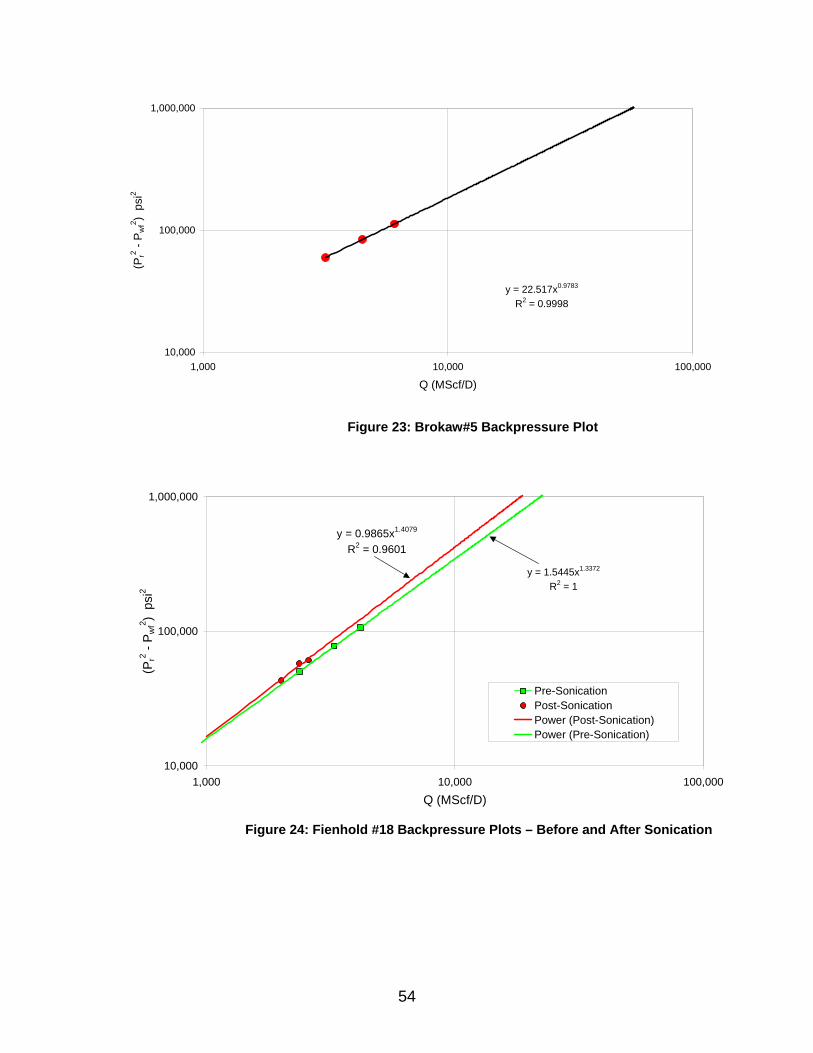
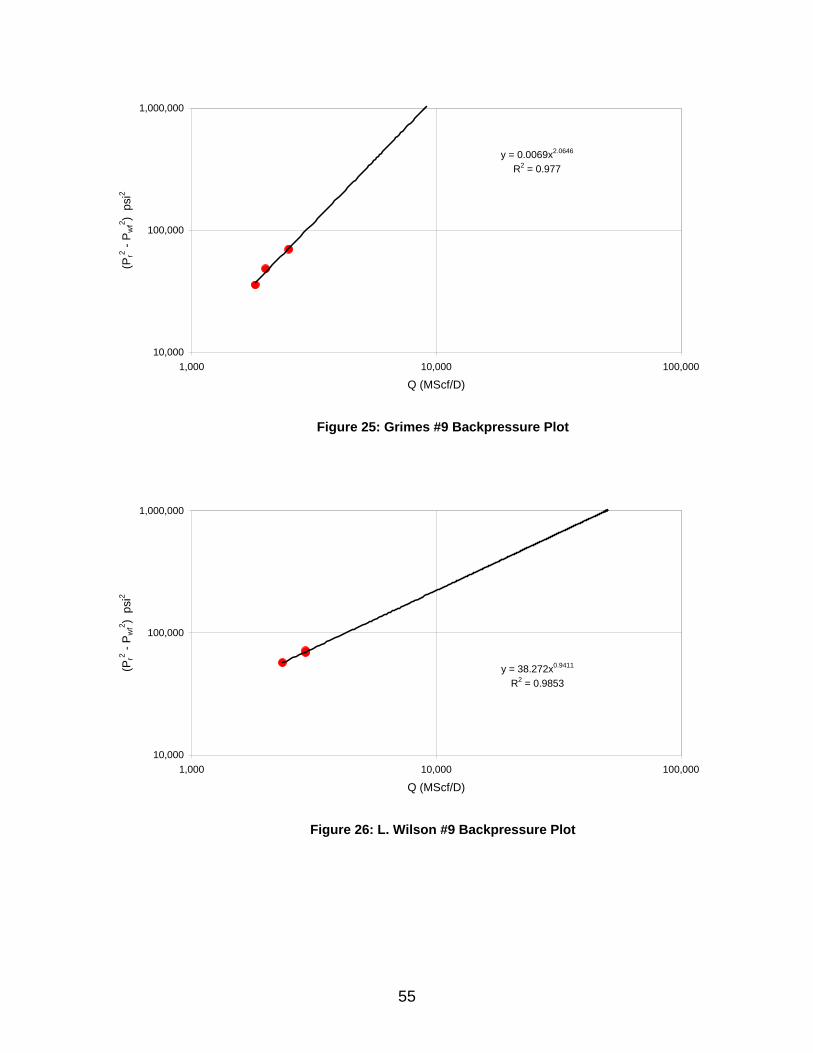
Sonication)............................................................................................... 37 Figure 16: Semi-Log PTT analysis (Post-Sonication) for L. Wilson #9.......................... 37 Figure 17: Diagnostic plot PTT analysis (Post-Sonication) for L. Wilson #9.................. 38 Figure 18: Rate vs Total Skin from MRPTT in L. Wilson #9 .......................................... 38 Figure 19: Bottom Hole Pressure During Test in Brokaw #5 ......................................... 52 Figure 20: Bottom Hole Pressure During Post-Stimulation Test in Fienhold #18 .......... 52 Figure 21: Bottom Hole Pressure During Test in Grimes #9 ......................................... 53 Figure 22: Bottom Hole Pressure During Test in L. Wilson #9 ...................................... 53 Figure 23: Brokaw#5 Backpressure Plot ....................................................................... 54 Figure 24: Fienhold #18 Backpressure Plots – Before and After Sonication ................. 54 Figure 25: Grimes #9 Backpressure Plot....................................................................... 55 Figure 26: L. Wilson #9 Backpressure Plot ................................................................... 55
7
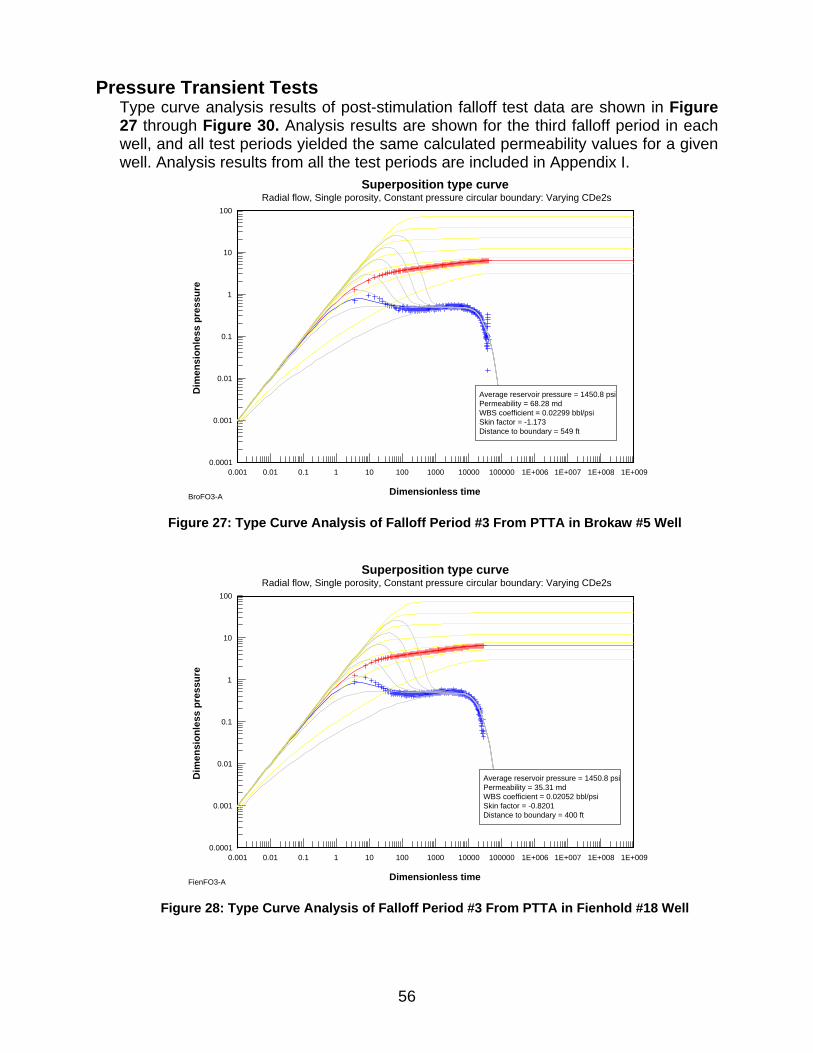
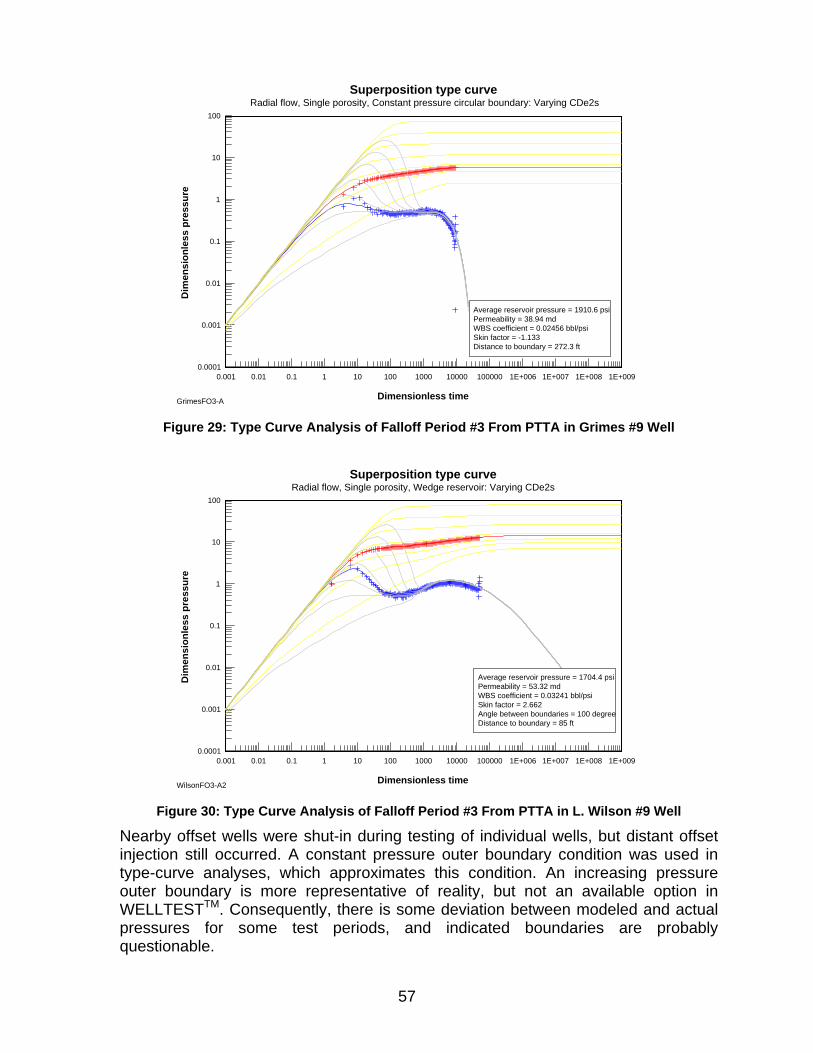
Figure 27: Type Curve Analysis of Falloff Period #3 From PTTA in Brokaw #5 Well .... 56 Figure 28: Type Curve Analysis of Falloff Period #3 From PTTA in Fienhold #18 Well. 56 Figure 29: Type Curve Analysis of Falloff Period #3 From PTTA in Grimes #9 Well..... 57 Figure 30: Type Curve Analysis of Falloff Period #3 From PTTA in L. Wilson #9 Well.. 57 Figure 31: Semi-Log PTT analysis - Brokaw #5 ............................................................ 58 Figure 32: Semi-Log PTT analysis (post-sonication) - Fienhold #18............................. 58 Figure 33: Semi-Log PTT analysis - Grimes #9 ............................................................ 59 Figure 34: Semi-Log PTT analysis - L. Wilson #9 ........................................................ 59 Figure 35: Rate vs Total Skin from MRPTT in Brokaw #5 ............................................. 60 Figure 36: Rate vs Total Skin from MRPTT in Fienhold #18 ......................................... 60 Figure 37: Rate vs Total Skin from MRPTT in Grimes #9 ............................................. 61 Figure 38: Rate vs Total Skin from MRPTT in L. Wilson #9 .......................................... 61 Figure 39: Pre-Sonication Gamma Ray/Neutron Log.................................................... 63 Figure 40: Post-Sonication Gamma Ray/Neutron Log .................................................. 64 Figure 41: Bottom hole pressure during post-sonication test in L. Wilson #9 ................ 68 Figure 42: L. Wilson #9 backpressure plots for pre- and post-somication tests ............ 68 Figure 43: Type curve analysis plot of falloff period #1 in L. Wilson #9 Well ................. 69 Figure 44: Type curve analysis plot of falloff period #2 in L. Wilson #9 Well ................. 69 Figure 45: Type curve analysis plot of falloff period #3 in L. Wilson #9 Well ................. 70 Figure 46: Rate vs Total Skin from MRPTT in L Wilson #9 ........................................... 70
8
Introduction The project team for this research was Furness-Newburge, Inc. (FNI), TechSavants, Inc. (TSI) and Nicor Gas. During Budget Period 1, the project team:
• Developed, fabricated, and tested prototype laboratory devices that used sonication and underwater plasma technologies to remove scale from natural gas storage well piping and perforations.
• Modified the laboratory sonication device into a hardened tool that could be deployed in a natural gas storage well.
• Performed an initial field test using this hardened sonication tool. The project team used the laboratory sonication tests to develop the best possible sonic horn shapes to distribute the sound energy and to determine the best frequencies of operation for this application. The complete review and analysis of this work is provided in the Final Report for Budget Period 1 filed with NETL on August 11, 2003 [Furness et al, 2003] as well as a paper presented at the AGA Operating Section Proceedings [Ammer et al, 2002]. This report details the work of Tasks 1 through 4. Under Budget Period 2, the team:
• Further developed the field sonication tool by increasing its power and making it more robust to survive field use.
• Performed two different field trials at two Nicor Gas wells in natural gas storage fields near Pontiac, IL (Field Test A, Fienhold #18) and near Bloomington, IL (Field Test B, L. Wilson #9).
In Field Test A, the team sonically treated the well with the tubing removed. In Field Test B, the team sonically treated the well without removing the tubing – the tool was fed through the tubing to reach the well’s perforation zones. The other differences in Field Test B are related to improvements in sonic tool application developed from the operational experience gained in Field Test A. For clarity, this report presents the information and analysis of these two field tests sequentially and by their task listings. Field Test A work is covered in Tasks 5 through 9 of this document. Field Test B work is covered in Tasks 10 through 13 of this document.
9
Executive Summary The project team deployed the sonic tool in two Field Tests, labeled A and B, to demonstrate its effectiveness for remediation of natural gas injection/withdrawal (I/W) wells. Prior to these field tests, the project team re-designed the sonic tool to be more rugged and better able to survive field use and then retested the new tool before field deployment. The project team conducted Field Test A at Nicor Gas’ I/W well Fienhold #18 located in the Pontiac Mt. Simon Gas Storage Field in Livingston County, IL. This well’s perforation zone was located between depths 3020 and 3100 feet. Prior to the sonic treatment on November 22-24, 2002, the project team met with the wire line service company (Baker-Atlas) to finalize details to deploy the tool. This work included modifying the centering device to fit the tool and mating the tool’s power supply electrically to the wire line transmitting power to the tool. Pre- and post- sonication evaluation of the well was developed using the following tests: flow prover, multi-rate pressure transient analysis and gamma ray/neutron logs. In addition, well water samples were taken at three different depths in the perforation zone for chemical analysis and a down hole video was run in the selected well to complete the well evaluation. Over the 3 days of treatment, the sonic tool treated the well’s perforation zone in 5-foot increments for 45 minutes each with a supplied power of 600-900 watts. In Field Test A, the power delivered by the tool was restricted by the size and multiple duties of the electric generator as well as the excessive length of the wire line. During Field Test A, the sonication tool operated for more than 20 hours during a 3-day period without any damage. As a result, the field test validated the sonic tool’s new design for field use. Furthermore, this field test allowed the project team to develop valuable practical experience in integrating the sonication equipment and operations with standard well service truck equipment and operations. Regarding the treatment’s effectiveness, the backpressure and pressure transient test data indicated little or no change in well productivity. However, analysis of these data indicated that this well had negative mechanical skin damage (-2.45) prior to treatment. Since the proposed remediation value of sonication is to reduce mechanical skin damage, in hindsight the Fienhold #18 well was a poor candidate for sonication. Comparison of pre- and post- sonication well water chemistry did however show large changes in the well’s water chemistry. Most notably, large decreases (>20%) in the iron, nitrates, and sulphates suggested that sonication increased precipitation and settling. These chemical changes provided evidence that this technology has the potential to improve well production, but only if applied to a proper well, i.e. a well with significant mechanical skin damage. When the project team turned its attention to Field Test B, it wanted to deploy the sonic tool without pulling the tubing from the well. This improvement would eliminate the need for a second field truck with associated equipment and crew thereby saving approximately $10,000 -$15,000. The team thought that such savings directly affect the
10
commercial potential of sonication use down hole. To accomplish the deployment without pulling the tubing, the tool was modified to fit inside the tubing at the L. Wilson #9 pressurized/injection well located at Nicor Gas’ Lake Bloomington Gas Storage Field in central Illinois. The work on the tool involved modifying the horns and adding a cone to facilitate maneuvering the tool through the tubing and its seating nipple. To prevent well damage during testing, the well water additions in Field Test B were limited to the amount needed to flood the perforation zones being treated. The team also increased the power delivered to the tool down-hole through equipment and operational changes. Specifically, an independent power generator of 3250 watts was devoted as the tool’s power supply. Additionally, the wire line connecting the tool to its power supply was shortened to 8,000 ft instead of the 25,000 ft used in Field Test A. This change resulted in greatly reducing the resistive and capacitive losses between the tool and its power supply for Field Test B. The power supplied to the tool in Field Test B ranged between 1450 to 1600 watts. The estimated wire line losses in this test were approximately 300 watts. The project team treated the well over a four-day period in all perforation zones between 3558 and 3676 feet in a similar manner as Field Test A. During Field Test B, the team decided to reduce the length of treatment at each depth in order to treat at more depths. This process change reduced the gaps between treatment depths and, therefore, reduced the likelihood of missing important perforations. Over the 4-day deployment, the sonic tool operated for more than 28 hours without failure – further establishing the field serviceability of the tool design. Post- treatment evaluation of the L. Wilson #9 well using backpressure and pressure transient test data indicated that sonication improved this well’s productivity. Modeling of the pre- and post- sonication backpressure data determined that sonication increased the well’s absolute open flow potential (AOF) by 28% (110 to 141 MMscf/D) and the backpressure equation’s intercept coefficient increased from 0.041 to 0.073 Mscf/D. Modeling of the multi-rate pressure transient test data showed a calculated decrease in the mechanical skin from +2.5 to -1.3. As expected, little or no changes were observed in the well permeability (53.3) or the non-Darcy damage coefficient (0.000147). The decrease in mechanical skin was the best evidence for demonstrating that sonication successfully removed damage to enable greater gas flow. The project team recommends further testing and evaluation of L. Wilson #9 well to more thoroughly document the effect of sonication. We believe that the results from this project will encourage additional development and use of this technology.
11
FIELD TEST A
On well site November 21-25, 2002
Experimental
Task 5: Building a Second Field Hardened Tool Subtask 5A: Fabrication Based upon past experience in Budget Period 1 and elsewhere, the project team determined that a third sonic tool was needed to make the planned Field Tests more practicable. Thus, a third sonic tool was ordered from the supplier with specification requests and input from FNI and TSI. The sonic tool previously developed under Extension 2 to Budget Period 1 also became a field-hardened unit for use in the Field Tests. Thus, two hardened field units were available for deployment for both Field Tests A and B. Subtask 5B: Laboratory Testing The purchase of a third tool relegated the original tool used in the field to laboratory use. Thus, at the beginning of Budget Period 2, it was used by FNI/TSI to test approaches to treating well pipe supplied by SoCal Gas and Puget Sound Energy (both potential industrial partners at that time) in the FNI facility in Versailles, KY. Upon receipt of the third sonic tool, FNI/TSI conducted tests with the tool to document its field hardiness and its ability to go down hole into an injection/withdrawal (I/W) well. These tests were conducted at the simulated test well facility located at FNI’s facility in Versailles, KY. Task 6: Develop Comprehensive Field Test Plan (FTP) The project team of FNI, TSI and Nicor Gas prepared a comprehensive plan for the field test at the Nicor Gas Storage Field near Pontiac, IL, with information as follows: Subtask 6A: Site Selection/Safety Review Nicor Gas selected its Pontiac Mt. Simon Gas Storage Field in Livingston County, IL as the site and identified the candidate well as Fienhold #18. This well was selected based upon its need for remediation based primarily on its production history. The perforation zone for this well was located between depths 3020 and 3100 feet. Nicor Gas identified the safety and other basic operational procedures and requirements for going down hole into an injection/withdrawal well for incorporation into the FTP. Subtask 6B: Site Engineering/Preparation Nicor Gas coordinated and integrated the project’s proposed field test dates with the ongoing activities of its Pontiac Storage Field personnel to develop the final project schedule and timeline. Sonication treatment for Field Test A was scheduled for November 22 through 24, 2002. Nicor Gas obtained the services of Baker-Atlas as the wire line service company for the test period. On November 21, 2002, the project team met with the Nicor Gas staff at the site for safety instruction and a review of procedures and logistics prior to down hole testing. The team met with Baker-Atlas field personnel
12
to finalize remaining details and the work necessary to deploy the tool. This work included the modification of the centering device to fit the tool and the tool’s power supply was mated electrically to the wire line transmitting electrical power to the down-hole sonic tool. Subtask 6C: Tasking and Protocols The project team assigned tasking responsibility matrices for all team members regarding the field test. This tasking included the logistics and scheduling for the mobilization and de-mobilization of the field rigs. Additionally, the team developed the sampling and analytical protocols for the field test, as well as prepared a responsibility matrix for all the test sampling, analytical and chain-of-custody subtasks. As noted above, the FTP also incorporated all site-specific safety and operational procedures and protocols. The complete field test plan is located in Appendix A of this document. Field conditions and observations necessitated some minor operational changes in the FTP. Task 7 documents the actual field test operations. Task 7: Field Test Subtask 7A: Determine Baseline Conditions Prior to Field Test “A”, Nicor Gas developed baseline data for comparison with post- field testing data. The FTP documents the sampling procedures for these baseline tests. Flow prover tests (FPT), multi-rate pressure transient tests (MRPTT), segmented bond logs, and gamma ray/neutron logs were run as part of the baseline characterization. The water level and water chemistry of the selected I/W well was measured and a down-hole video was run within the selected I/W well.
Baseline Test Analysis Dates
Flow Prover Test November 13, 2002 Multi-Rate Pressure Transient Tests (MRPTT) November 15, 2002
Segmented Bond Logs, Gamma Ray/Neutron Logs November 21, 2002 Water Analysis at 3020, 3060 & 3100 ft November 21, 2002
Pre-sonication test results are reported alongside post-sonication results under Task 8. Subtask 7B: Sonic Tool Testing After connection with the Baker-Atlas wire line, the sonic tool was cycled through a series of operational tests to check for electrical and mechanical integrity both above ground and after lowering tool into a section of the perforation zone 3020 to 3030 feet deep. These initial tests used three different operating modes:
• Sine wave stimulation where the power supplied to the sonic tool had the signal shape of a sine wave at a fixed frequency.
• Square Wave stimulation where the power supplied to the sonic tool had the signal shape of a square wave at a fixed frequency.
• Pulsed sine wave stimulation where the power supplied to the sonic tool had the signal shape of a sine wave and a function generator pulsed or swept the signal frequency in a narrow range about the frequency set-point.
13
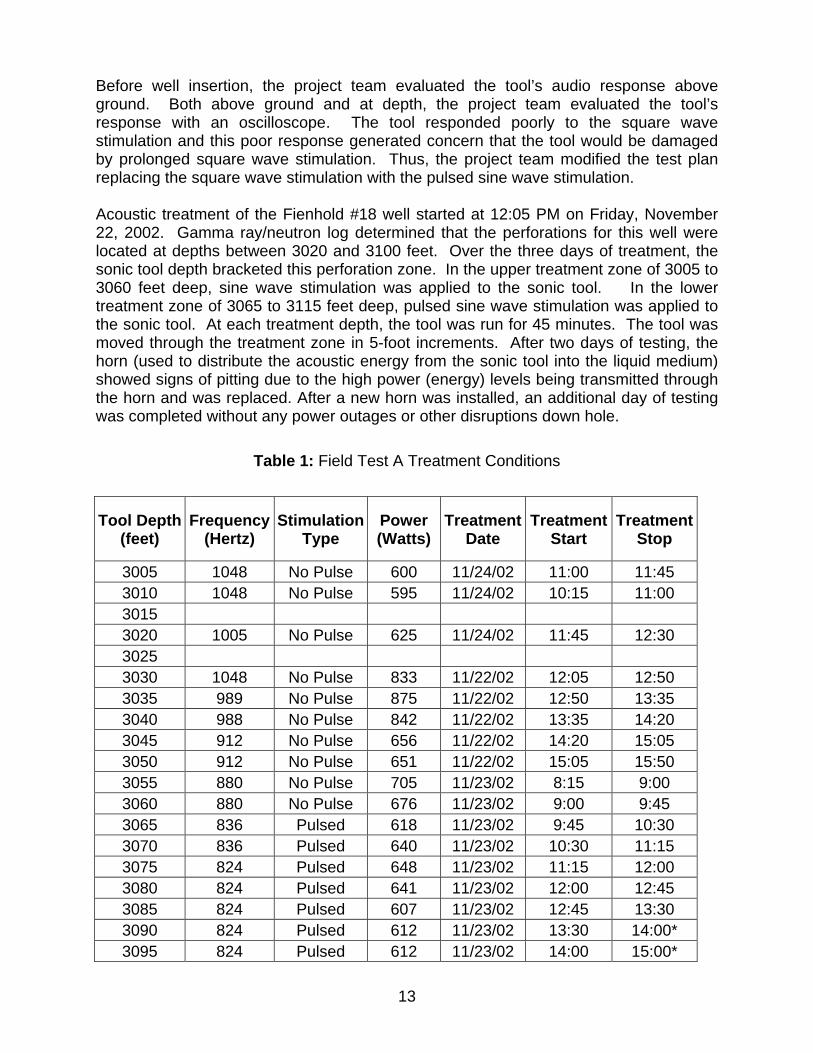
Before well insertion, the project team evaluated the tool’s audio response above ground. Both above ground and at depth, the project team evaluated the tool’s response with an oscilloscope. The tool responded poorly to the square wave stimulation and this poor response generated concern that the tool would be damaged by prolonged square wave stimulation. Thus, the project team modified the test plan replacing the square wave stimulation with the pulsed sine wave stimulation. Acoustic treatment of the Fienhold #18 well started at 12:05 PM on Friday, November 22, 2002. Gamma ray/neutron log determined that the perforations for this well were located at depths between 3020 and 3100 feet. Over the three days of treatment, the sonic tool depth bracketed this perforation zone. In the upper treatment zone of 3005 to 3060 feet deep, sine wave stimulation was applied to the sonic tool. In the lower treatment zone of 3065 to 3115 feet deep, pulsed sine wave stimulation was applied to the sonic tool. At each treatment depth, the tool was run for 45 minutes. The tool was moved through the treatment zone in 5-foot increments. After two days of testing, the horn (used to distribute the acoustic energy from the sonic tool into the liquid medium) showed signs of pitting due to the high power (energy) levels being transmitted through the horn and was replaced. After a new horn was installed, an additional day of testing was completed without any power outages or other disruptions down hole.
* -- Indicates a treatment time different than 45 minutes.
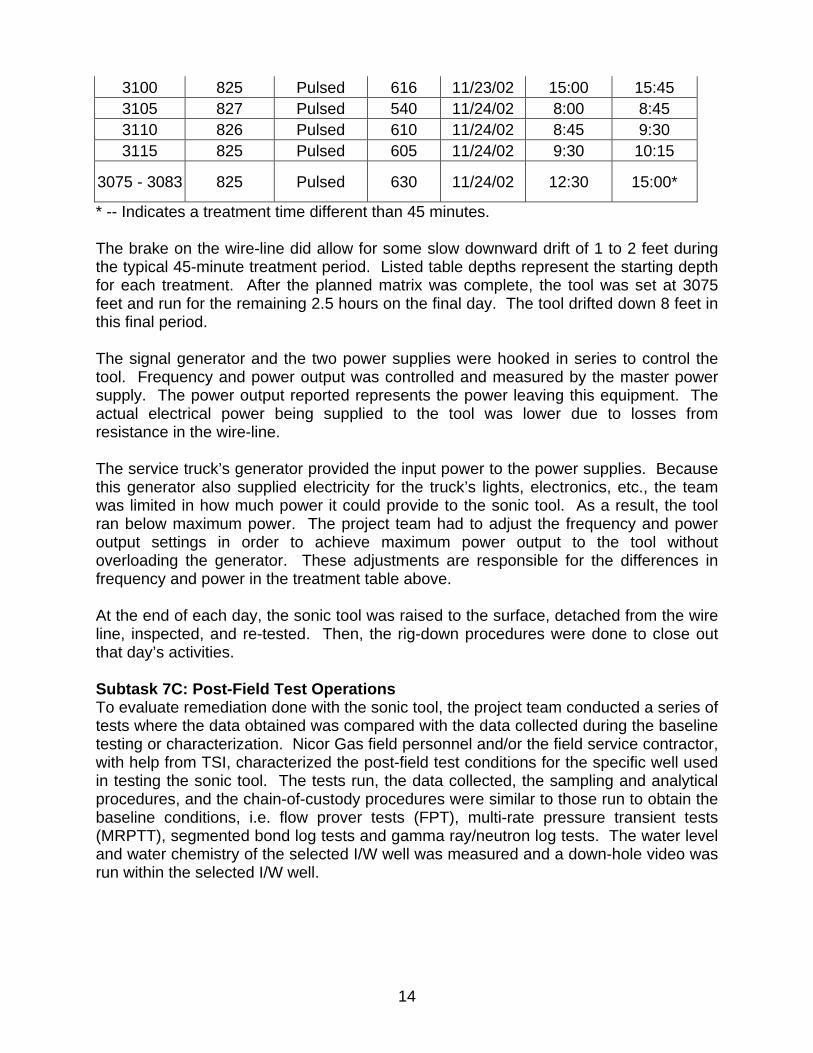
The brake on the wire-line did allow for some slow downward drift of 1 to 2 feet during the typical 45-minute treatment period. Listed table depths represent the starting depth for each treatment. After the planned matrix was complete, the tool was set at 3075 feet and run for the remaining 2.5 hours on the final day. The tool drifted down 8 feet in this final period. The signal generator and the two power supplies were hooked in series to control the tool. Frequency and power output was controlled and measured by the master power supply. The power output reported represents the power leaving this equipment. The actual electrical power being supplied to the tool was lower due to losses from resistance in the wire-line. The service truck’s generator provided the input power to the power supplies. Because this generator also supplied electricity for the truck’s lights, electronics, etc., the team was limited in how much power it could provide to the sonic tool. As a result, the tool ran below maximum power. The project team had to adjust the frequency and power output settings in order to achieve maximum power output to the tool without overloading the generator. These adjustments are responsible for the differences in frequency and power in the treatment table above. At the end of each day, the sonic tool was raised to the surface, detached from the wire line, inspected, and re-tested. Then, the rig-down procedures were done to close out that day’s activities. Subtask 7C: Post-Field Test Operations To evaluate remediation done with the sonic tool, the project team conducted a series of tests where the data obtained was compared with the data collected during the baseline testing or characterization. Nicor Gas field personnel and/or the field service contractor, with help from TSI, characterized the post-field test conditions for the specific well used in testing the sonic tool. The tests run, the data collected, the sampling and analytical procedures, and the chain-of-custody procedures were similar to those run to obtain the baseline conditions, i.e. flow prover tests (FPT), multi-rate pressure transient tests (MRPTT), segmented bond log tests and gamma ray/neutron log tests. The water level and water chemistry of the selected I/W well was measured and a down-hole video was run within the selected I/W well.
15
Results and Discussion
Task 8: Data Analysis & Final Report Preparation The project team analyzed all data collected as part of the field test including the baseline conditions, the actual field test events and the post-field test conditions. The key tests that generated data for the baseline and post-field test conditions included water chemistry (pH, calcium, suspended solids, magnesium, iron, sulfates, etc), pressure transient analyses, flow prover, and gamma ray/neutron logs. Water Chemistry The project team took water samples from 3020, 3060, and 3100 feet deep in the well on the day before the sonic treatment started (11/21/02) and on the day after treatment finished (11/25/02). Analytical Chemistry & Environmental Services, Inc. evaluated these six samples. The water chemistry analyses would test the hypotheses that the sonic treatment might mechanically break up scale formations, dissolve scale, enhance precipitation, and/or remove dissolved gases from the well water through localized pressure changes.
Table 2: Water Chemistry Analyses Before and After Sonication at 3 Different Depths
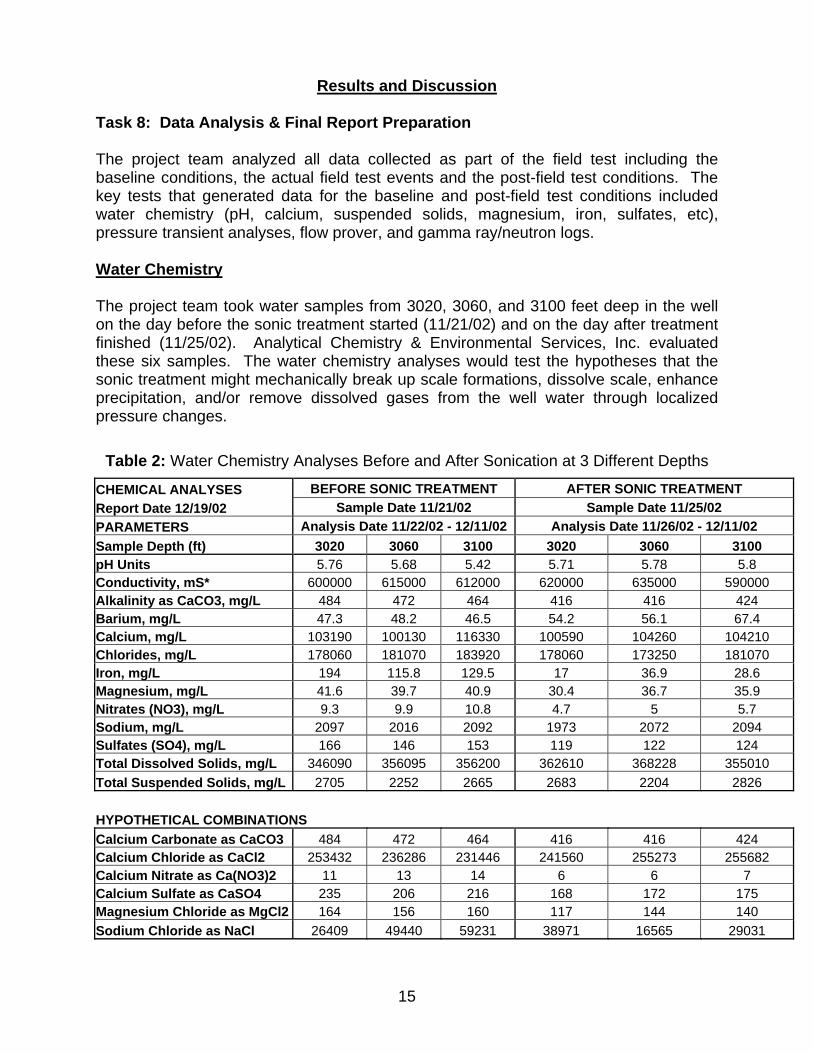
DISSOLVED SOLIDS Calculated 280929 286689 291661 281255 272613 285488 Determined 340090 356095 356200 362610 368228 355010 Percentage Difference 18.8 19.5 18.1 22.4 26 19.6 Most parameters varied with depth in the water sample taken before treatment. Most notably, the pH, alkalinity, and iron concentrations decreased at the greater depths. After treatment, the water samples at the different depths were far more uniform. In analyzing this data, one must consider that while some changes will be due to the sonic treatment, changes will also be the result of uncontrollable variables such as diffusion. In all likelihood, the greater uniformity with regard to depth was partly the result of natural diffusion and convection rather than the sole result of sonic treatment.
Table 3: Water Chemistry Changes from Sonic Treatment
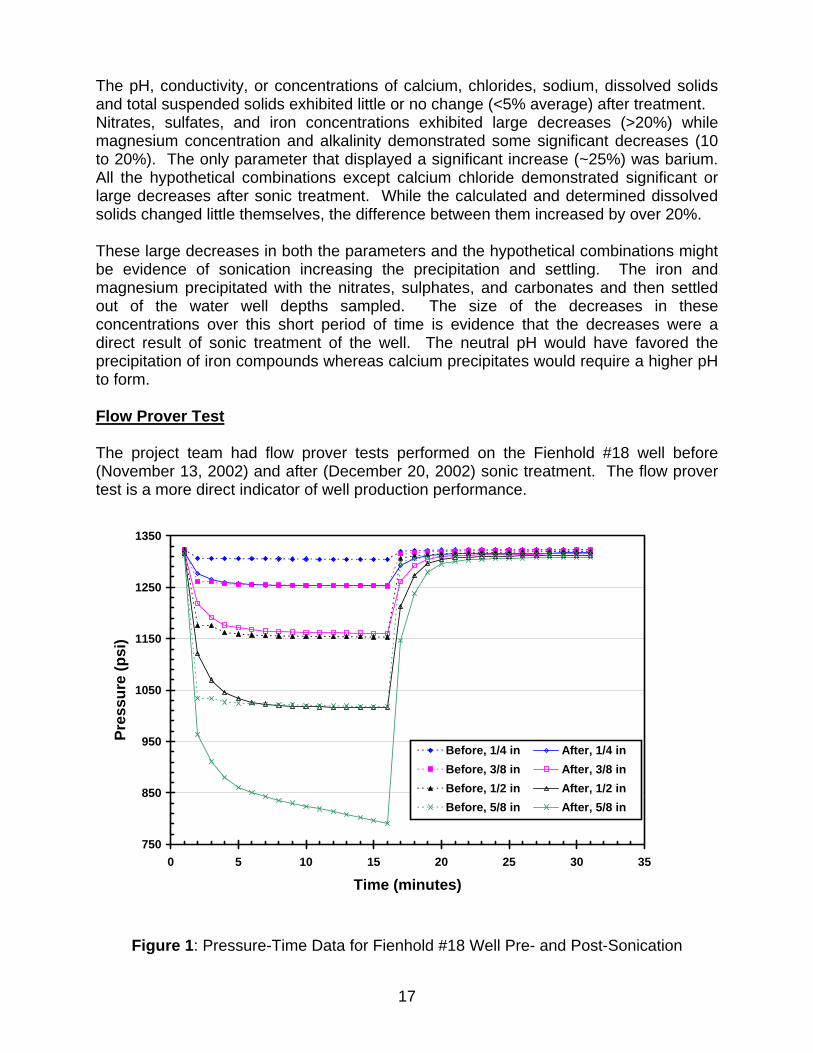
The pH, conductivity, or concentrations of calcium, chlorides, sodium, dissolved solids and total suspended solids exhibited little or no change (<5% average) after treatment. Nitrates, sulfates, and iron concentrations exhibited large decreases (>20%) while magnesium concentration and alkalinity demonstrated some significant decreases (10 to 20%). The only parameter that displayed a significant increase (~25%) was barium. All the hypothetical combinations except calcium chloride demonstrated significant or large decreases after sonic treatment. While the calculated and determined dissolved solids changed little themselves, the difference between them increased by over 20%. These large decreases in both the parameters and the hypothetical combinations might be evidence of sonication increasing the precipitation and settling. The iron and magnesium precipitated with the nitrates, sulphates, and carbonates and then settled out of the water well depths sampled. The size of the decreases in these concentrations over this short period of time is evidence that the decreases were a direct result of sonic treatment of the well. The neutral pH would have favored the precipitation of iron compounds whereas calcium precipitates would require a higher pH to form. Flow Prover Test The project team had flow prover tests performed on the Fienhold #18 well before (November 13, 2002) and after (December 20, 2002) sonic treatment. The flow prover test is a more direct indicator of well production performance.
Figure 1: Pressure-Time Data for Fienhold #18 Well Pre- and Post-Sonication
750
850
950
1050
1150
1250
1350
0 5 10 15 20 25 30 35
Time (minutes)
Pres
sure
(psi
)
Before, 1/4 in After, 1/4 inBefore, 3/8 in After, 3/8 inBefore, 1/2 in After, 1/2 inBefore, 5/8 in After, 5/8 in
18
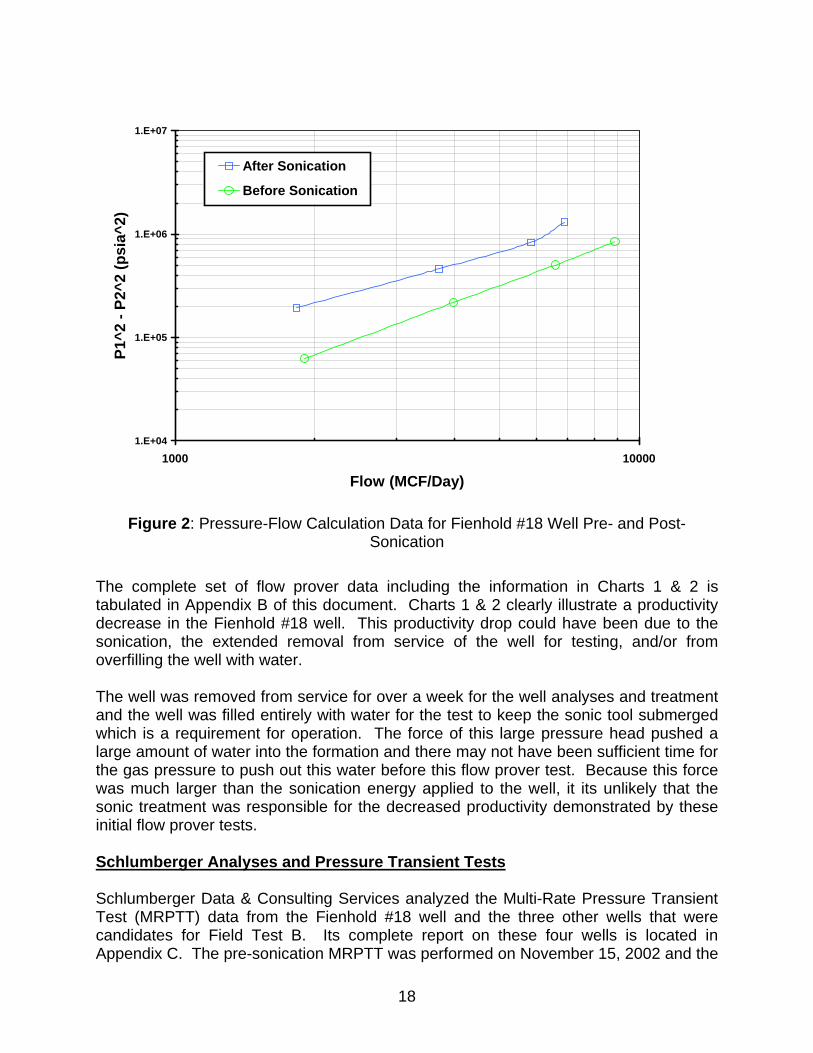
Figure 2: Pressure-Flow Calculation Data for Fienhold #18 Well Pre- and Post-Sonication
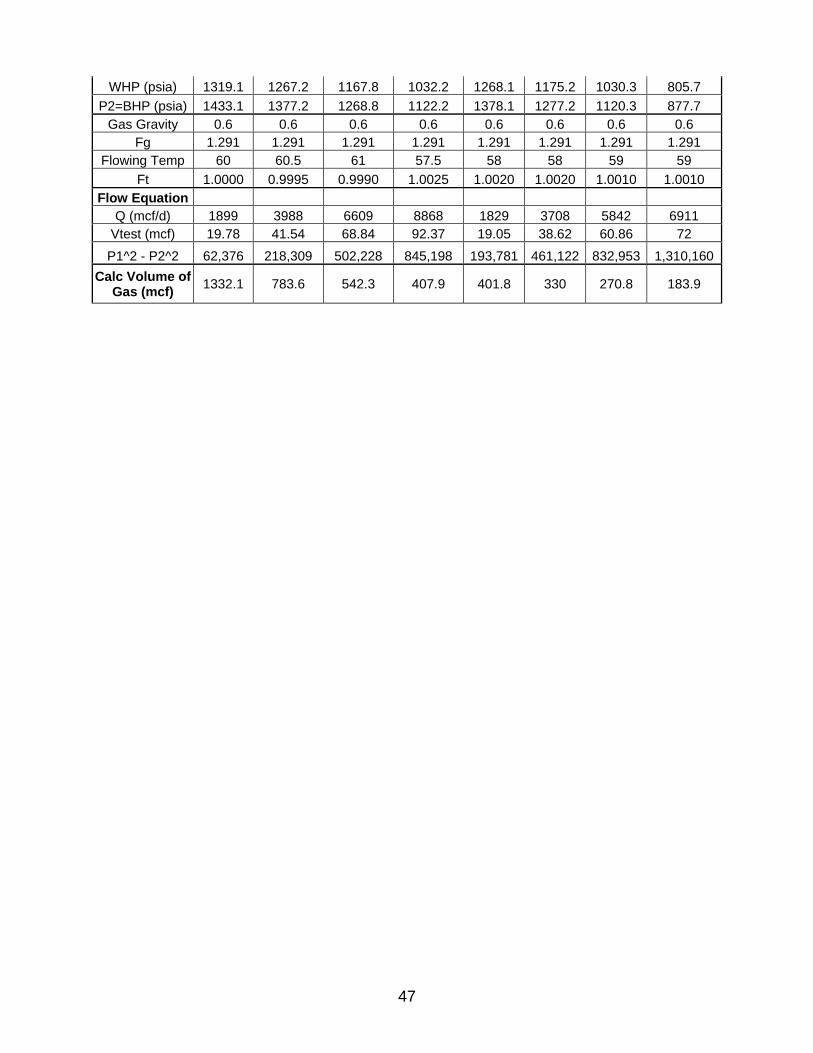
The complete set of flow prover data including the information in Charts 1 & 2 is tabulated in Appendix B of this document. Charts 1 & 2 clearly illustrate a productivity decrease in the Fienhold #18 well. This productivity drop could have been due to the sonication, the extended removal from service of the well for testing, and/or from overfilling the well with water. The well was removed from service for over a week for the well analyses and treatment and the well was filled entirely with water for the test to keep the sonic tool submerged which is a requirement for operation. The force of this large pressure head pushed a large amount of water into the formation and there may not have been sufficient time for the gas pressure to push out this water before this flow prover test. Because this force was much larger than the sonication energy applied to the well, it its unlikely that the sonic treatment was responsible for the decreased productivity demonstrated by these initial flow prover tests. Schlumberger Analyses and Pressure Transient Tests Schlumberger Data & Consulting Services analyzed the Multi-Rate Pressure Transient Test (MRPTT) data from the Fienhold #18 well and the three other wells that were candidates for Field Test B. Its complete report on these four wells is located in Appendix C. The pre-sonication MRPTT was performed on November 15, 2002 and the
1.E+04
1.E+05
1.E+06
1.E+07
1000 10000
Flow (MCF/Day)
P1^2
- P2
^2 (p
sia^
2)
After Sonication
Before Sonication
19
initial post-stimulation MRPTT was performed on December 12, 2002. Since the results were inconclusive, the MRPTT and backpressure tests were repeated during October-November 2003. These second post-sonication tests were run at the same time of year as the pre-sonication tests so that both sets of data would come from the well when it was at the end of the injection season making the comparison more valid.
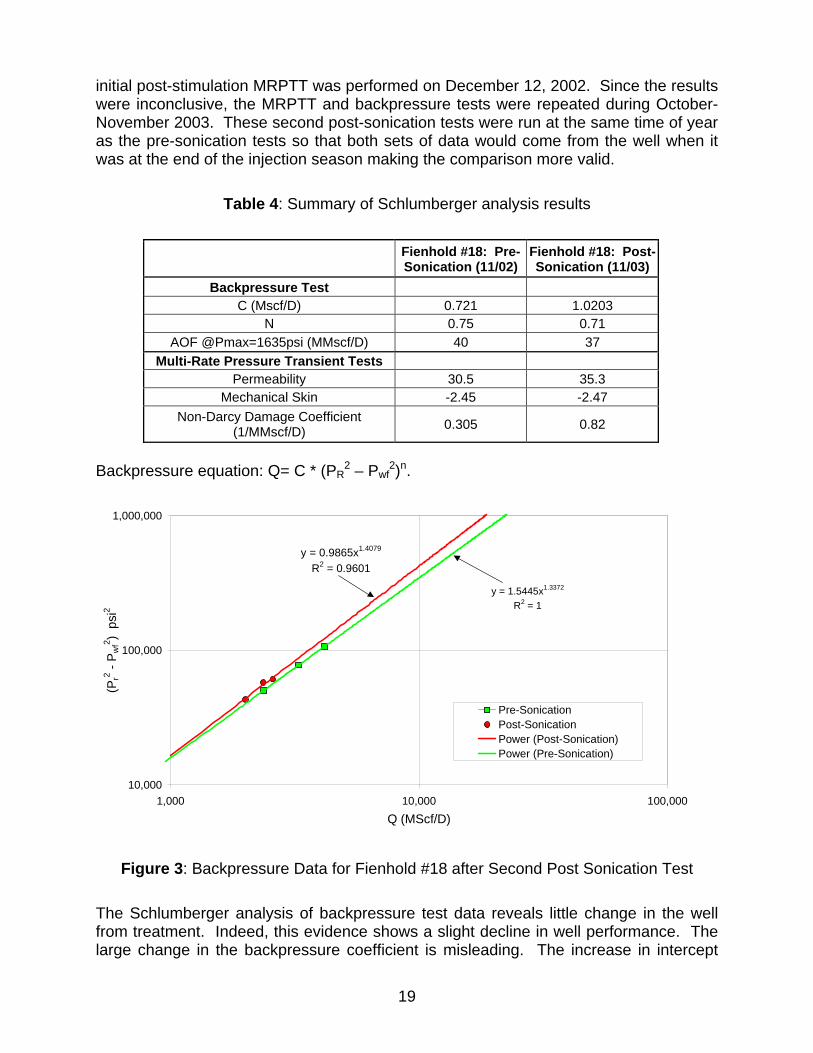
Figure 3: Backpressure Data for Fienhold #18 after Second Post Sonication Test The Schlumberger analysis of backpressure test data reveals little change in the well from treatment. Indeed, this evidence shows a slight decline in well performance. The large change in the backpressure coefficient is misleading. The increase in intercept
20
coefficient C (0.721 1.02 Mscf/D) is more than compensated for by the decrease in slope n (0.75 0.71). The variation in the backpressure coefficients is an artifact of the data set fit of a limited number of points rather than any performance change.
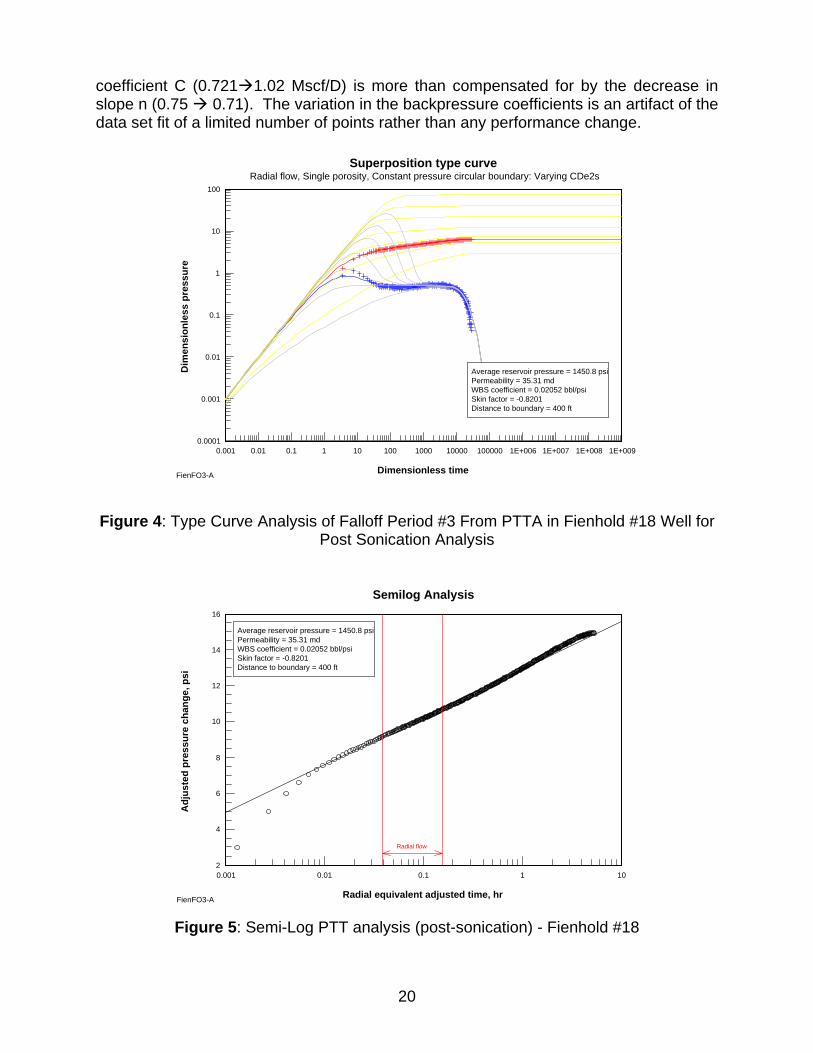
Superposition type curveRadial flow, Single porosity, Constant pressure circular boundary: Varying CDe2s
Average reservoir pressure = 1450.8 psiPermeability = 35.31 mdWBS coefficient = 0.02052 bbl/psiSkin factor = -0.8201 Distance to boundary = 400 ft
Dim
ensi
onle
ss p
ress
ure
Dimensionless timeFienFO3-A
Figure 4: Type Curve Analysis of Falloff Period #3 From PTTA in Fienhold #18 Well for Post Sonication Analysis
Semilog Analysis
2
4
6
8
10
12
14
16
0.001 0.01 0.1 1 10
Radial flow
Average reservoir pressure = 1450.8 psiPermeability = 35.31 mdWBS coefficient = 0.02052 bbl/psiSkin factor = -0.8201 Distance to boundary = 400 ft
Adj
uste
d pr
essu
re c
hang
e, p
si
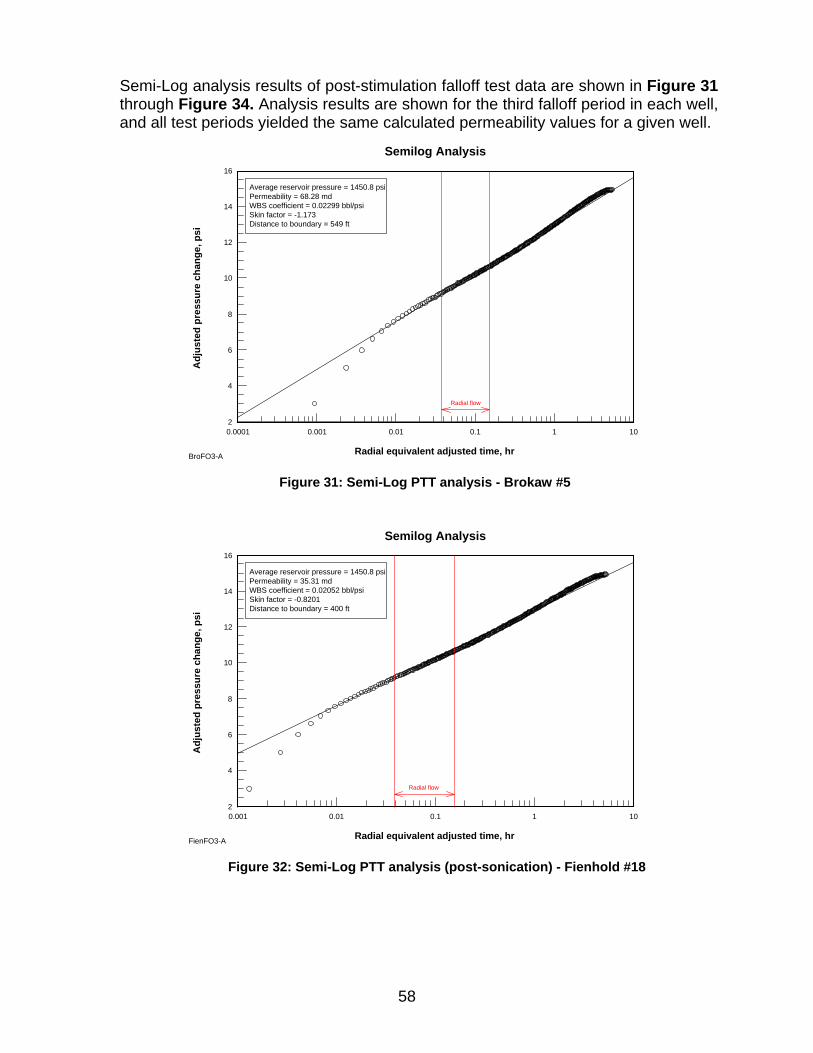
Radial equivalent adjusted time, hrFienFO3-A Figure 5: Semi-Log PTT analysis (post-sonication) - Fienhold #18
21
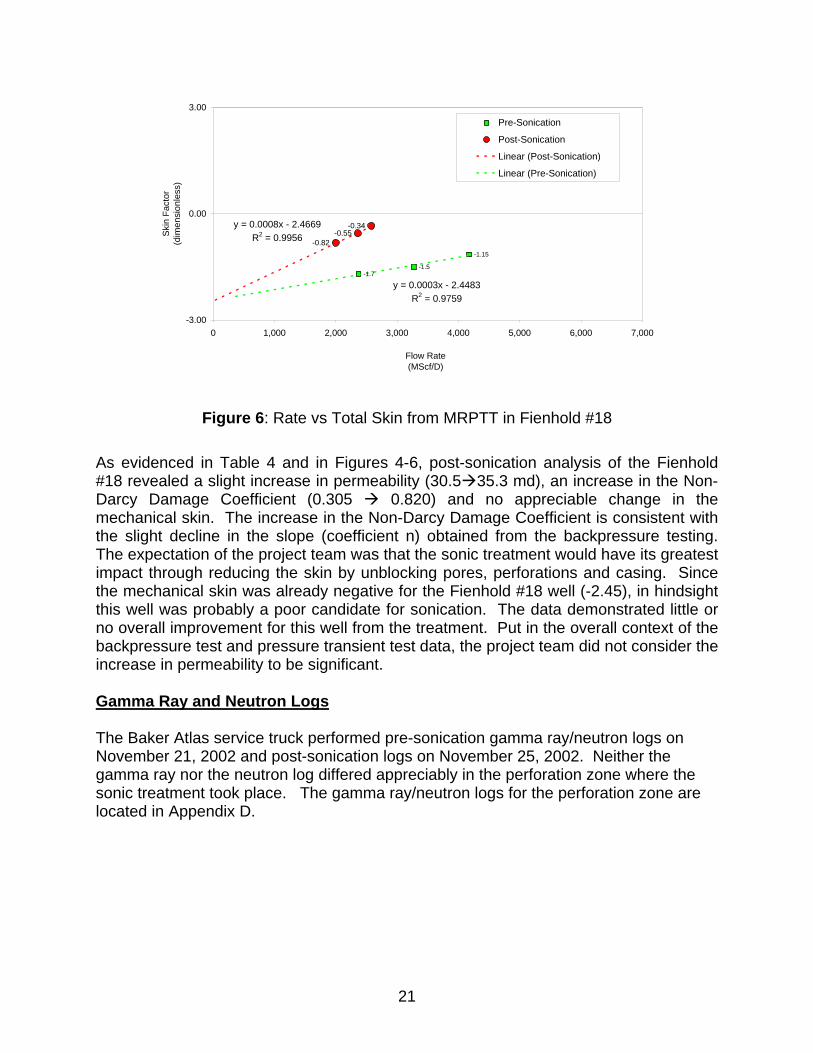
-1.7-1.5
-1.15
-0.55-0.34
-0.82
y = 0.0008x - 2.4669R2 = 0.9956
y = 0.0003x - 2.4483R2 = 0.9759
-3.00
0.00
3.00
0 1,000 2,000 3,000 4,000 5,000 6,000 7,000
Flow Rate(MScf/D)
Ski
n Fa
ctor
(dim
ensi
onle
ss)
Pre-Sonication
Post-Sonication
Linear (Post-Sonication)
Linear (Pre-Sonication)
Figure 6: Rate vs Total Skin from MRPTT in Fienhold #18
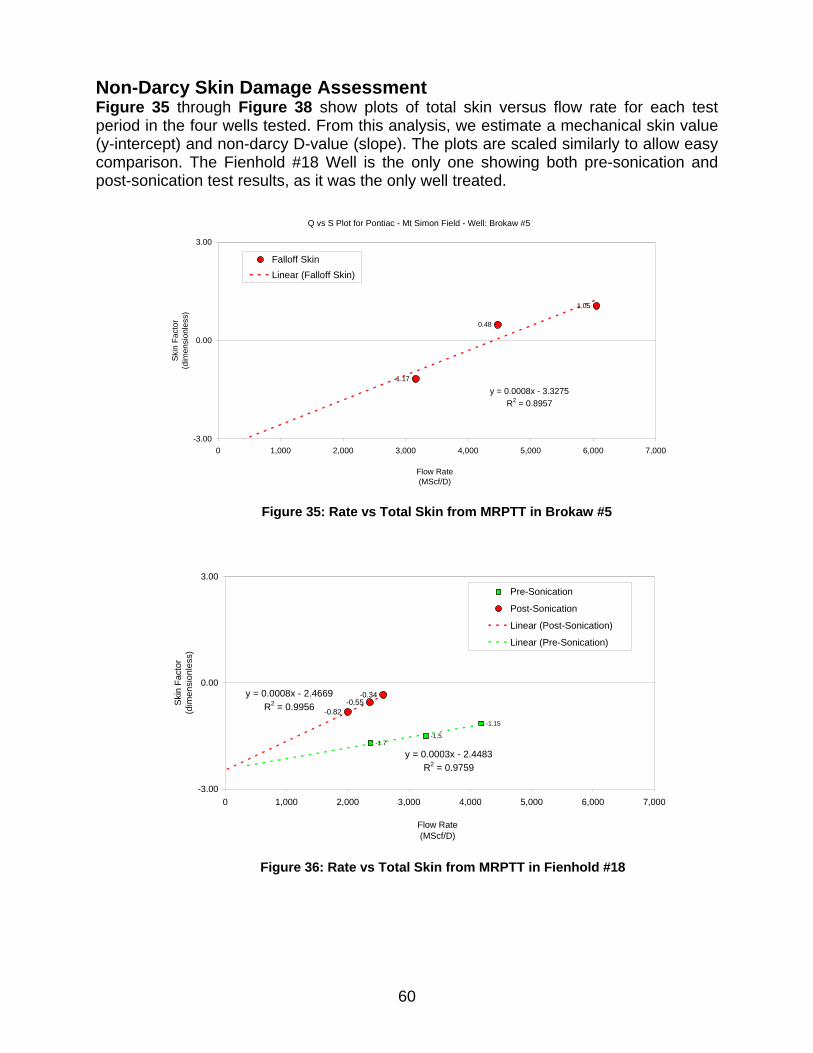
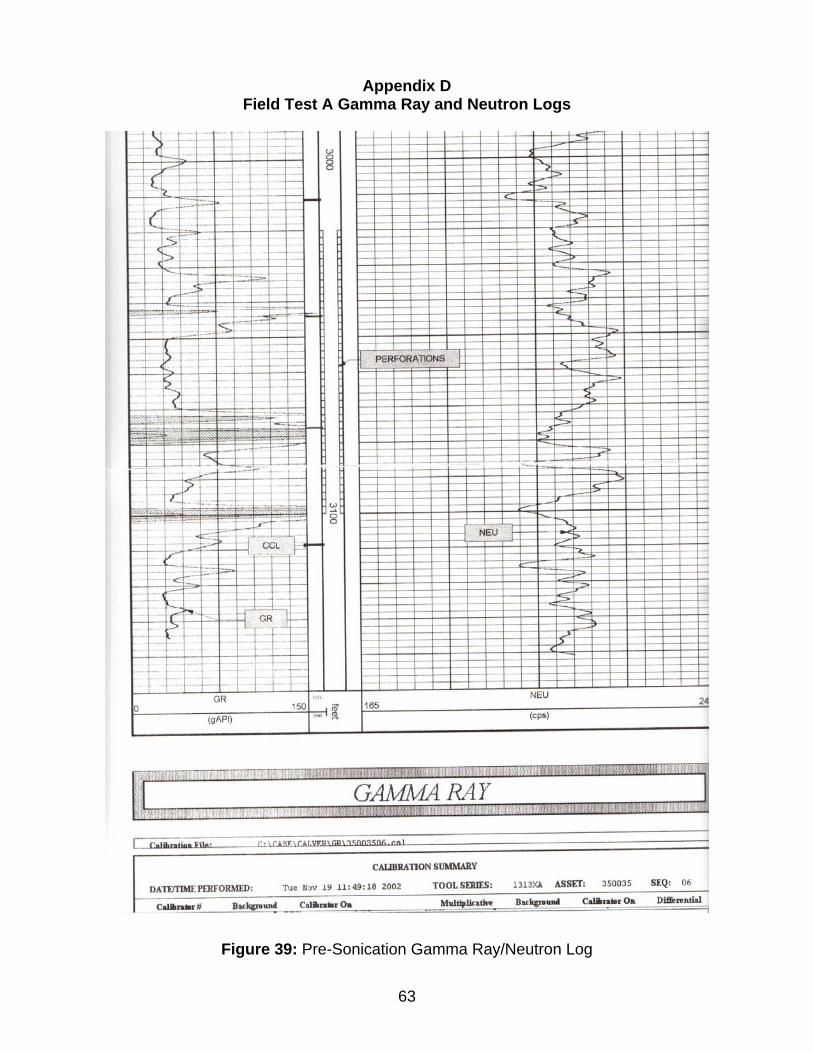
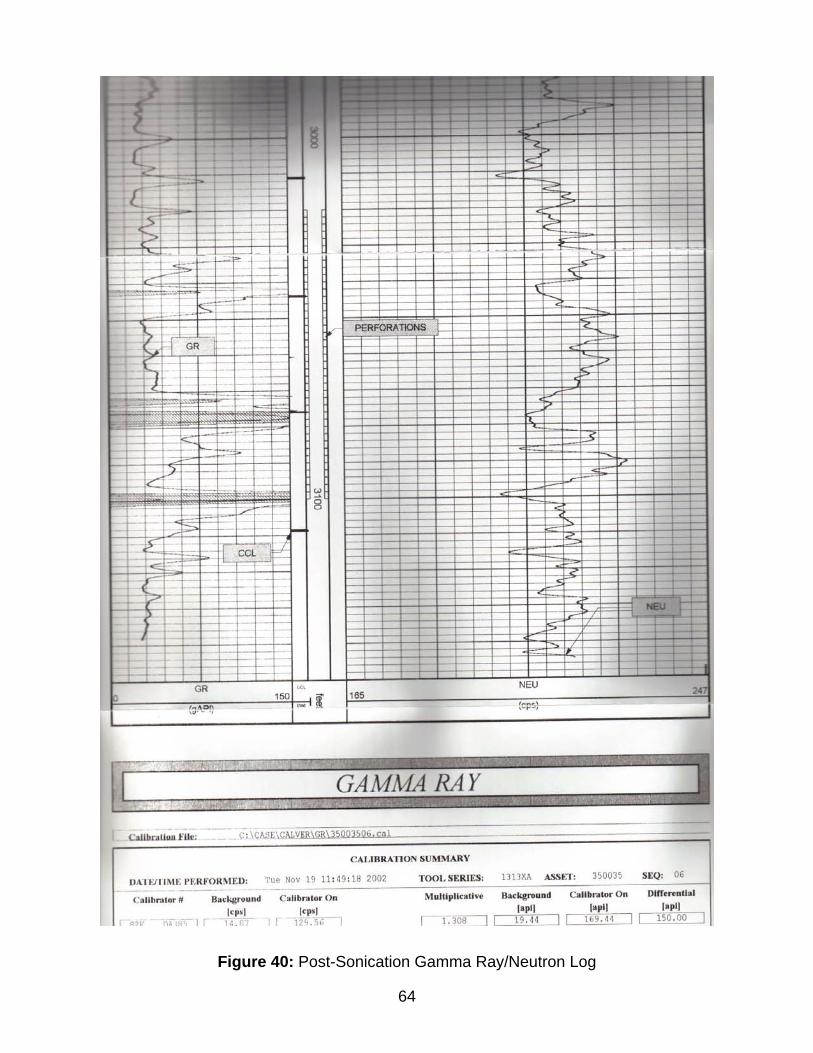
As evidenced in Table 4 and in Figures 4-6, post-sonication analysis of the Fienhold #18 revealed a slight increase in permeability (30.5 35.3 md), an increase in the Non-Darcy Damage Coefficient (0.305 0.820) and no appreciable change in the mechanical skin. The increase in the Non-Darcy Damage Coefficient is consistent with the slight decline in the slope (coefficient n) obtained from the backpressure testing. The expectation of the project team was that the sonic treatment would have its greatest impact through reducing the skin by unblocking pores, perforations and casing. Since the mechanical skin was already negative for the Fienhold #18 well (-2.45), in hindsight this well was probably a poor candidate for sonication. The data demonstrated little or no overall improvement for this well from the treatment. Put in the overall context of the backpressure test and pressure transient test data, the project team did not consider the increase in permeability to be significant. Gamma Ray and Neutron Logs The Baker Atlas service truck performed pre-sonication gamma ray/neutron logs on November 21, 2002 and post-sonication logs on November 25, 2002. Neither the gamma ray nor the neutron log differed appreciably in the perforation zone where the sonic treatment took place. The gamma ray/neutron logs for the perforation zone are located in Appendix D.
22
Conclusion Task 9: Project Review & Technical Paper Field Test A conducted November 22-24, 2002 was the second deployment of a sonication tool down hole in a natural gas storage field well. In the first deployment (August 2001) undertaken during Budget Period 1, the sonication tool treated an observation well for three hours before it was removed because of damage. In this second deployment, the sonication tool operated in a pressurized well for more than 20 hours during a three day period without any damage. This field test confirmed the success of the tool development in Task 5. The conversion of a laboratory sonication device into a practical, durable down-hole tool that could survive multiple field operations was completed. Field Test A also increased the operational experience of the project team in integrating the new tool with standard field service truck equipment. In this second deployment, the team increased the potential power delivery to the tool through the addition of a second power supply in series. Unfortunately, the service truck’s electrical generator could not supply enough power to take advantage of this new configuration. Furthermore, the tool was connected to a ~25,000 ft long wireline for a test with a maximum deployment depth of 3120 ft. The extra wireline length meant greater resistive losses, thus reducing the power that reached the tool down-hole. The lessons learned included the need to use a separate electrical generator devoted to powering the tool and to use as short a wireline as practical. Backpressure and pressure transient tests most directly measured well productivity. Neither of these tests provided any evidence that the sonication changed the Fienhold #18 well’s productivity. Initial flow prover data (Dec. 2002) and review of the field test protocol generated concern that the pressure head from the well filling could potentially cause well damage. Subsequent backpressure and pressure transient tests (Oct.-Nov. 2003) determined that the well was not damaged nor had the well productivity improved. The team learned that during treatment, the hydrostatic head in the production zone should be kept to a minimum to reduce potential damage from the high pressure head associated with a full well column of water. MRPTT data documented that the treated well had a negative mechanical skin both before and after treatment. Mechanical skin is an indicator of a blockage in the production zone pores and fractures within the well. Schlumberger analysis of MRPTT data concluded that because the Fienhold #18 well had a negative mechanical skin, it was a poor candidate for sonication. The project team learned that the sonication treatment should be targeted at wells with positive mechanical skin that would indicate the possible presence of scale blocking the formation’s pores, perforations, and casing. Large changes in water chemistry provided evidence that suggested sonication did alter the well environment. As such, these changes demonstrate that sonication has the potential to impact well productivity, but only if applied to the right well under the proper conditions. Large changes in water chemistry also occurred during the brief treatment of the Bashore #1 observation well documented in the Budget Period 1 report. However, how the water chemistry changed in the two field tests was very different. This difference can be attributed to the two different initial well environments. Table 5
23
compares and contrasts the water chemistry and their sonication changes for the two wells at a location in the middle of their respective perforation zones.
Table 5: Comparison of Water Chemistry Changes for the Two Initial Field Tests
Bashore # 1 Well @ 3240 ft Fienhold #18 Well @ 3060 ft Pre-Sonication Post Sonication Pre-Sonication Post SonicationpH 3.11 8.38 5.68 5.78 Iron, mg/L 63 39.4 115.8 36.9 Calcium, mg/L 1,755 4,028 100,130 104,260 Magnesium, mg/L 285 461 39.7 36.7 Dissolved Solids, mg/L 63,270 50,328 356,095 368,228 Suspended Solids, mg/L 240 532 2252 2204
The Bashore #1 well of the first field test had a much lower initial pH as well as initial lower concentrations of iron, calcium, dissolved solids, and suspended solids than the Fienhold #18 well. The increase in pH, calcium, and magnesium in the Bashore well was attributed to dissolution of the scale into the water caused by sonication. One could not conclusively determine that this same dissolution occurred in the treatment of the Fienhold #18 well. This may have been due to any of the following reasons:
• The large concentrations of calcium and dissolved solids in the Fienhold well inhibited the dissolution of scale.
• The higher pH of the well reduced the ability of the water to dissolve scale. • The dissolution of scale did, in fact, occur in this well, but the increase in
calcium concentration from this process was masked by the high background calcium concentration.
• If we infer that the negative mechanical skin measurement indicated that the well did not have much scale initially, then any dissolution could not be observed with a water chemistry test.
In both field tests, sonication reduced the iron concentrations, a result attributed to sonication enhanced precipitation and settling. The two ways that sonication can impact the well environment (as observed through the water chemistry tests) are through changing the water’s equilibrium (thermodynamic) and through increasing the rate of reaction (kinetics). Thermodynamically, sonication can remove dissolved gases such as carbon dioxide that will subsequently float out of the perforation zone. Also, sonication can help precipitate solids that subsequently settle out of this zone. The removal of iron in both field tests is evidence for this thermodynamic change. Kinetically, sonication will help the water more rapidly reach equilibrium. In the case of the Bashore #1 well, the low pH necessary to dissolve scale was present. The large pH increase indicated that sonication helped the acid dissolve the scale faster to reach equilibrium. In analyzing the water chemistry data, it appears that the well’s chemical environment can impact the success of the sonic treatment. Overall, Field Test A did not conclusively validate sonication as a gas storage well treatment technology because the well productivity was not improved. However, the changes in water chemistry suggested that the technology has the potential to improve
24
well productivity, but only if applied to the proper well, i.e. a well with significant mechanical skin damage. The greatest value of Field Test A was in the development of practical experience in integrating the sonication equipment and operations with standard well service truck equipment and operations. Field Test A was the first lengthy deployment of this sonication tool that survived the more rugged field environment. After reviewing the results of Field Test A, the project team determined that this test was not sufficiently conclusive to merit publication of a technical paper. On the one hand, because no increase in productivity could be established with the MRPTT analysis, one could not conclude that sonication worked. On the other hand, because the water chemistry changed and the MRPTT established that the Fienhold well was an unsuitable candidate since it had negative mechanical skin damage, one could not conclude that sonication would not work.
FIELD TEST B August 23, 2004 through August 27, 2004
Experimental
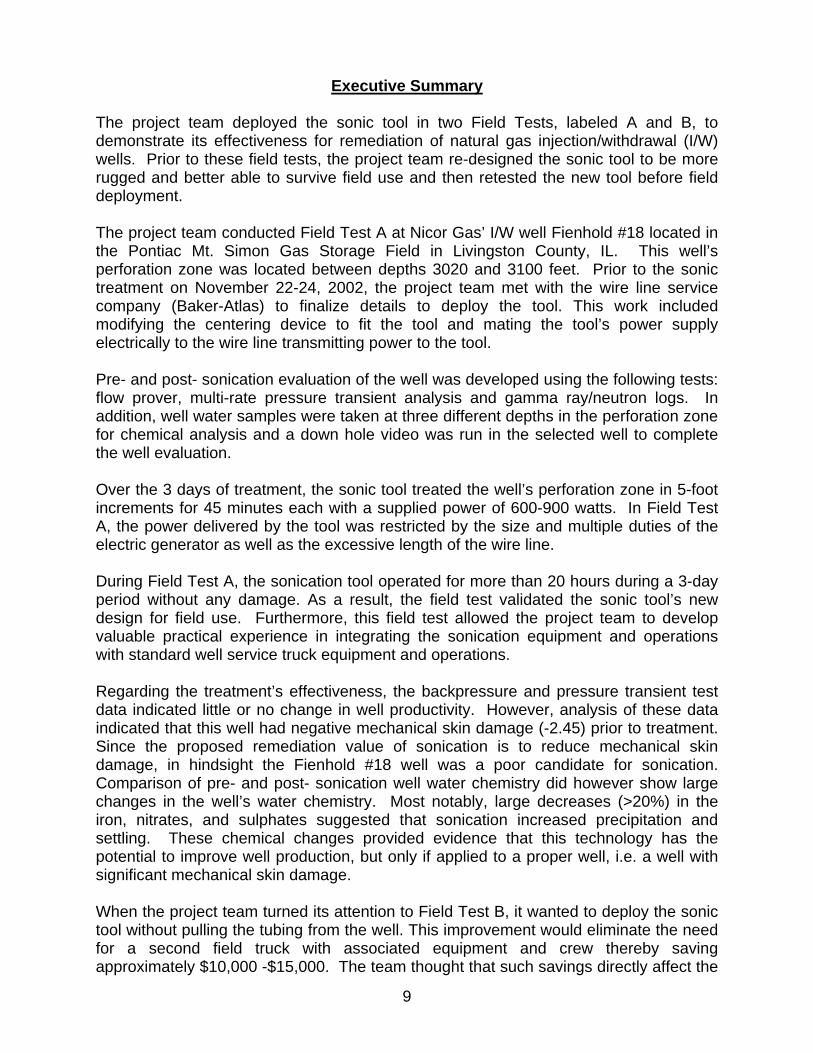
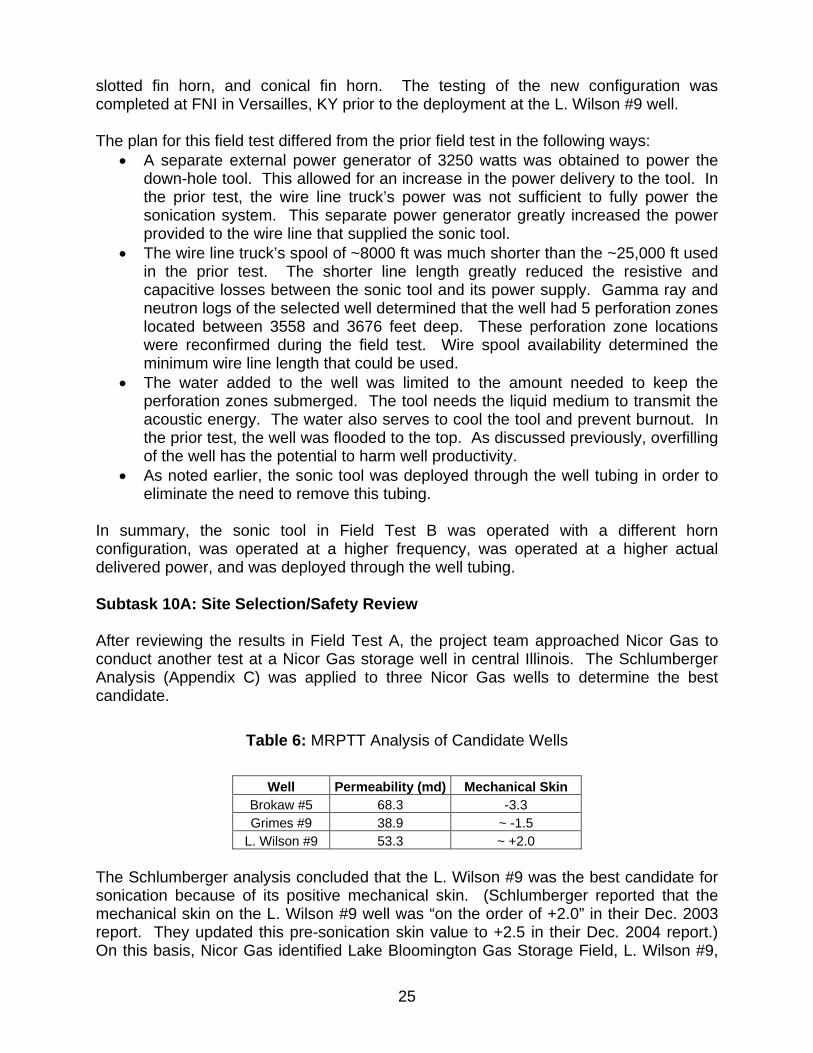
Task 10: Develop Comprehensive Field Test Plan (FTP) The project team, Furness-Newburge, Inc. (FNI), TechSavants, Inc. (TSI) and Nicor Gas developed a comprehensive plan for the field test at a second Nicor Gas pressurized/injection well located in central Illinois. In Field Test B, the project team wanted to deploy the sonic tool without pulling the tubing from the well. This change would eliminate the need for a snubbing unit with its associated equipment and field crew and save an estimated $10,000-$15,000 of treatment cost for this test. Therefore, the ability to deploy the tool through the well tubing would greatly increase the commercial potential of the sonic tool through lowering the tool deployment cost. In order to deploy the tool without pulling the tubing, adjustments were needed in the sonic tool and its horns. Thus, initial preparations for Field Test B included modifying the sonic tool to fit into the Nicor Gas well tubing. The L. Wilson #9 tubing has a 2-7/8 inch 6.5# EUE (External Upset Tubing) outside diameter with an inside diameter of 2.441 inches with a seating nipple at the very bottom with a 2-1/4 inch “no go” diameter through which the tool must fit. The acoustic actuator has a diameter of 1.95 inches and the horn used in prior field operations had a 2.5 inch diameter. New horns were constructed with a 2 inch diameter so they could fit inside this well tubing. Furthermore, a gently sloping cone was added to the bottom of the horn in order to guide the tool through the well tubing’s bottom seating nipple. The new acoustic actuator/horn system was tested over several days at FNI’s facility in Kentucky to determine the optimal frequency of operation. Changes in the weight and shape of the horn caused an increase in this optimal frequency. A modular horn system was attached to the bottom of the actuator. The second conical horn above the 2 slotted fin horns was added to better direct the sound energy outward. The final configuration of the horn system is pictured in Figure 7: conical horn, slotted fin horn,
25
slotted fin horn, and conical fin horn. The testing of the new configuration was completed at FNI in Versailles, KY prior to the deployment at the L. Wilson #9 well. The plan for this field test differed from the prior field test in the following ways:
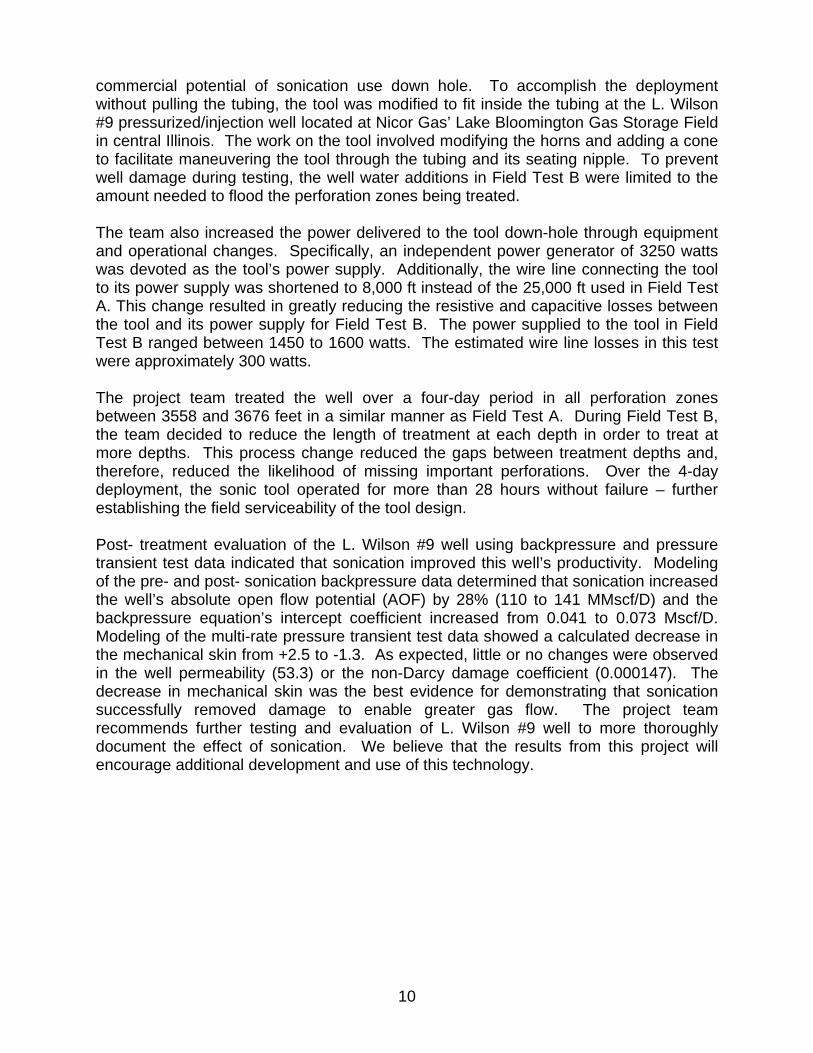
• A separate external power generator of 3250 watts was obtained to power the down-hole tool. This allowed for an increase in the power delivery to the tool. In the prior test, the wire line truck’s power was not sufficient to fully power the sonication system. This separate power generator greatly increased the power provided to the wire line that supplied the sonic tool.
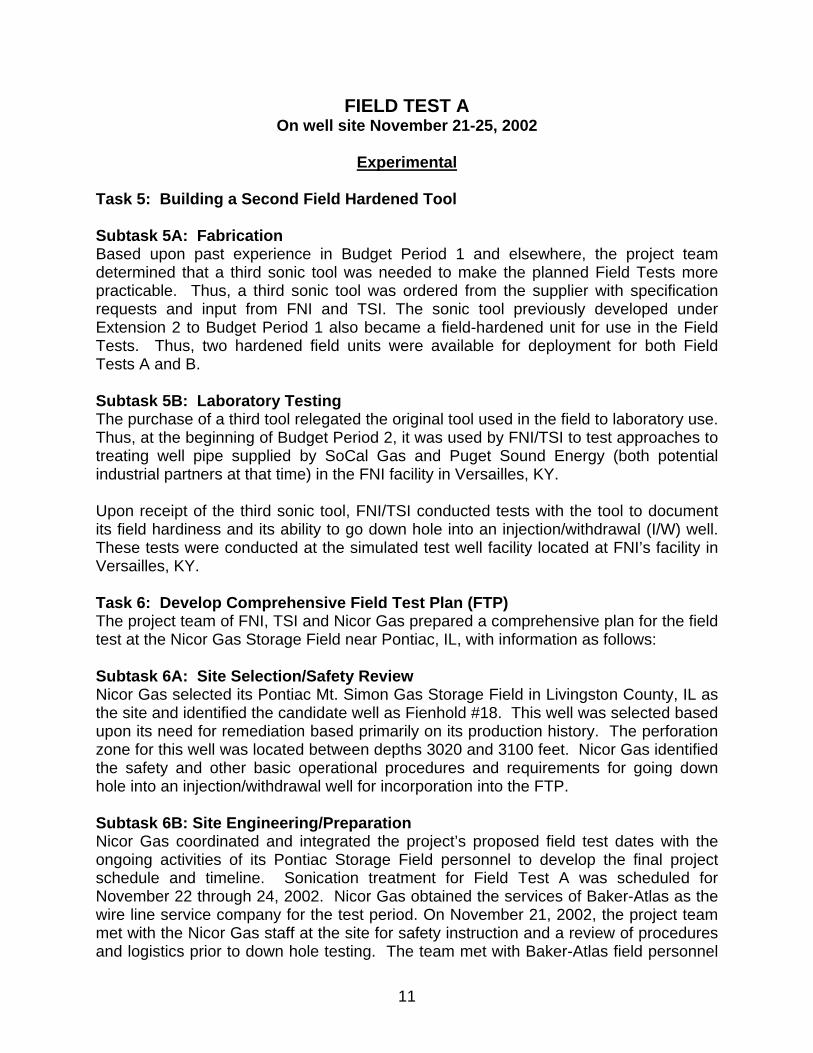
• The wire line truck’s spool of ~8000 ft was much shorter than the ~25,000 ft used in the prior test. The shorter line length greatly reduced the resistive and capacitive losses between the sonic tool and its power supply. Gamma ray and neutron logs of the selected well determined that the well had 5 perforation zones located between 3558 and 3676 feet deep. These perforation zone locations were reconfirmed during the field test. Wire spool availability determined the minimum wire line length that could be used.
• The water added to the well was limited to the amount needed to keep the perforation zones submerged. The tool needs the liquid medium to transmit the acoustic energy. The water also serves to cool the tool and prevent burnout. In the prior test, the well was flooded to the top. As discussed previously, overfilling of the well has the potential to harm well productivity.
• As noted earlier, the sonic tool was deployed through the well tubing in order to eliminate the need to remove this tubing.
In summary, the sonic tool in Field Test B was operated with a different horn configuration, was operated at a higher frequency, was operated at a higher actual delivered power, and was deployed through the well tubing. Subtask 10A: Site Selection/Safety Review After reviewing the results in Field Test A, the project team approached Nicor Gas to conduct another test at a Nicor Gas storage well in central Illinois. The Schlumberger Analysis (Appendix C) was applied to three Nicor Gas wells to determine the best candidate.
The Schlumberger analysis concluded that the L. Wilson #9 was the best candidate for sonication because of its positive mechanical skin. (Schlumberger reported that the mechanical skin on the L. Wilson #9 well was “on the order of +2.0” in their Dec. 2003 report. They updated this pre-sonication skin value to +2.5 in their Dec. 2004 report.) On this basis, Nicor Gas identified Lake Bloomington Gas Storage Field, L. Wilson #9,
26
as the candidate well and evaluated its production history and its remediation needs. In addition, Nicor Gas identified safety and other basic operational procedures for the FTP. Subtask 10B: Site Engineering/Preparation Nicor Gas coordinated and integrated the project’s proposed field test dates with the ongoing activities of its Lake Bloomington Gas Storage Field personnel to develop the final project schedule and timeline. The project team met with the Nicor Gas personnel on site for a walk-through of procedures, including a mandatory safety review, and logistics on August 23, 2004, the first day of the test. Subtask: 10C Tasking and Protocols Field Test B used Field Test A’s FTP as a template for its tasking and protocols incorporating all the aforementioned changes in tool deployment. In Field Test B, the project team focused on the MRPTT and backpressure tests that more directly measure well productivity. The down-hole video and the water sampling/analysis were removed from the FTP. Field conditions and observations necessitated some minor operational changes in the FTP. Task 11 documents the actual field test operations. Task 11: Field Test Subtask 11A: Determine Baseline Conditions Nicor Gas field personnel and/or the field service contractor, with help from TSI, characterized the baseline conditions for the specific well, L. Wilson #9, selected for the field-testing of the sonic tool. The actual tests run, the data collected, the sampling and analytical procedures, and the chain-of-custody and other concerns were established as part of the FTP. The procedures, tests, protocols and data collection and sampling techniques within the FTP were rigorously followed in order to establish the baseline condition of the L. Wilson #9 well prior to the field-testing of the sonic tool. Flow prover tests (FPT), multi-rate pressure transient tests (MRPTT), and gamma ray/neutron log tests were run as part of the baseline characterization. (See Schlumberger Analysis in Appendix C for L. Wilson #9.) Pre-sonication test results are reported alongside post-sonication results under Task 12. Subtask 11B: Sonic Tool Testing Immediately following the mandatory safety review meeting, the team met at the well site with Baker Atlas personnel to observe both sonic tool and wire line truck equipment. To properly fit the tool through the seating nipple located at the bottom of the well tubing, the team determined it would be best to add a sinker bar and centering device to the tool. Also, the team learned that a new flange and valve would need to be added to the well-head for water addition. By the time these items were obtained, it was too close to nightfall to begin tests.
27
Figure 7: Acoustic horns on the downhole tool. On the following morning, Tuesday, August 24, 2004, it was necessary to raise the water level above the perforations in the well. Thus, 20 barrels of water (840 gallons) were added to the well in two, 10-barrel increments. Multiple gamma ray/neutron logs were taken to determine the liquid level and when the liquid level stabilized. These logs also confirmed the locations of the perforations in the well which were divided into the following five zones:
Zone 1 3558 to 3584 feet deepZone 2 3591 to 3626 feet deepZone 3 3628 to 3652 feet deepZone 4 3656 to 3660 feet deepZone 5 3668 to 3676 feet deep
Table 7 located at the end of this narrative summarizes the treatment conditions for the entire week of testing. On Tuesday morning, the water level had stabilized at a depth of 3604 feet covering the bottom of the second zone and all of zones 3 through 5. The team performed acoustic treatment of the well at six different depths in these zones for 30 minutes each. The team finished this treatment by slowly sweeping the tool between 3620 and 3676 feet for 17 minutes.
Slotted Fins
Directing Cones
Acoustic Actuator Bottom
28
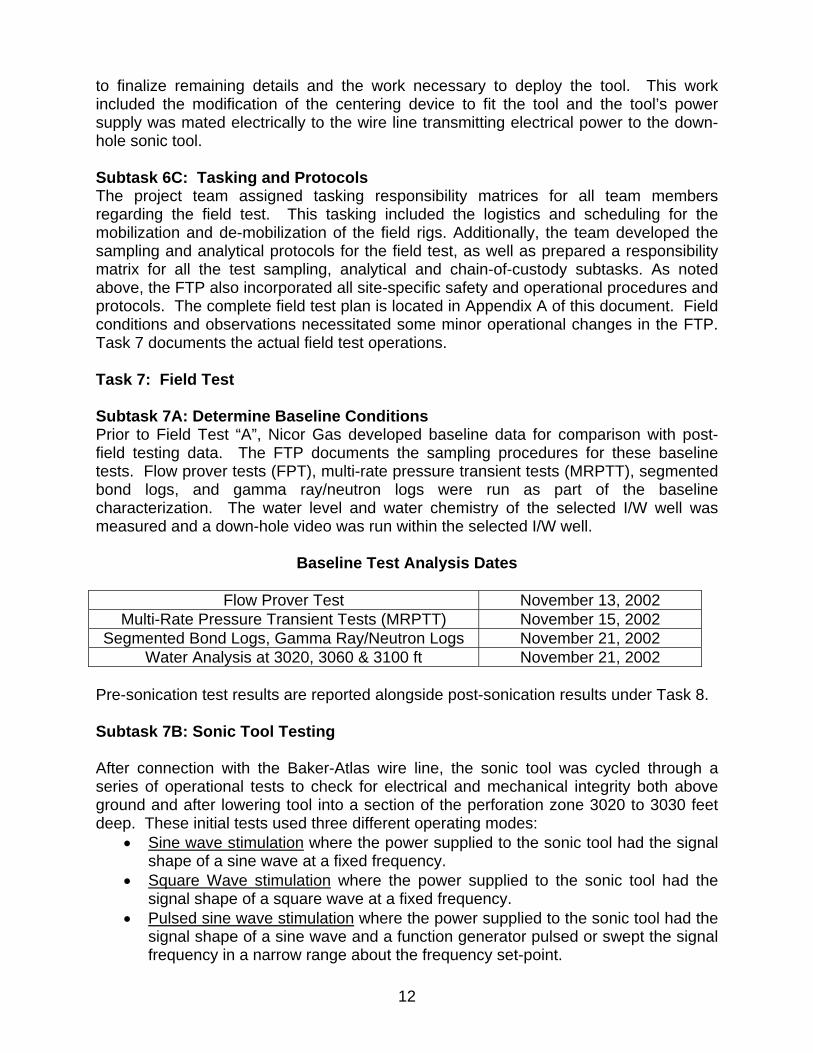
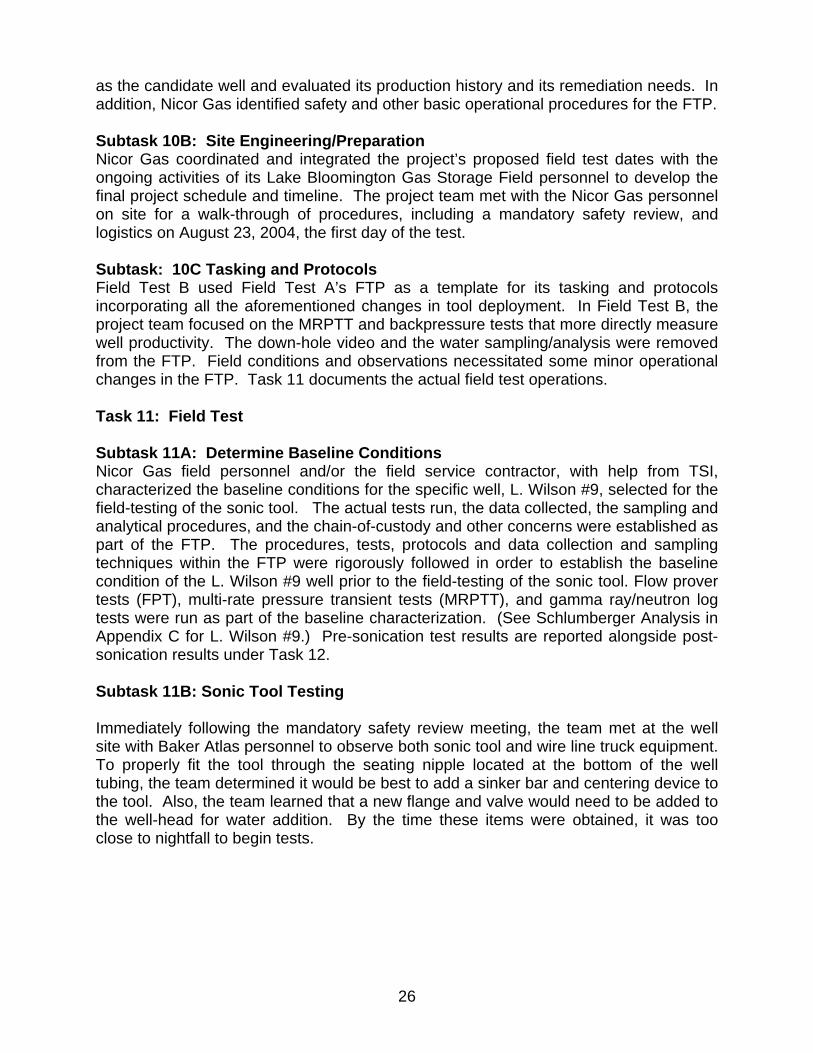
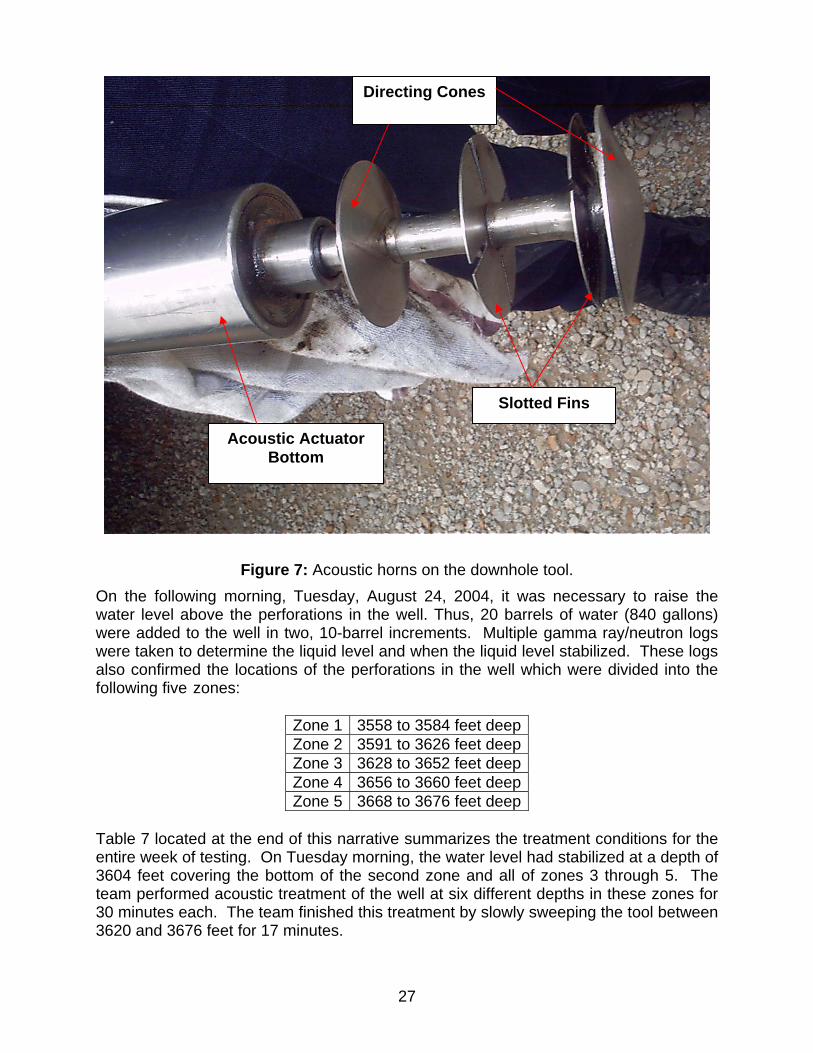
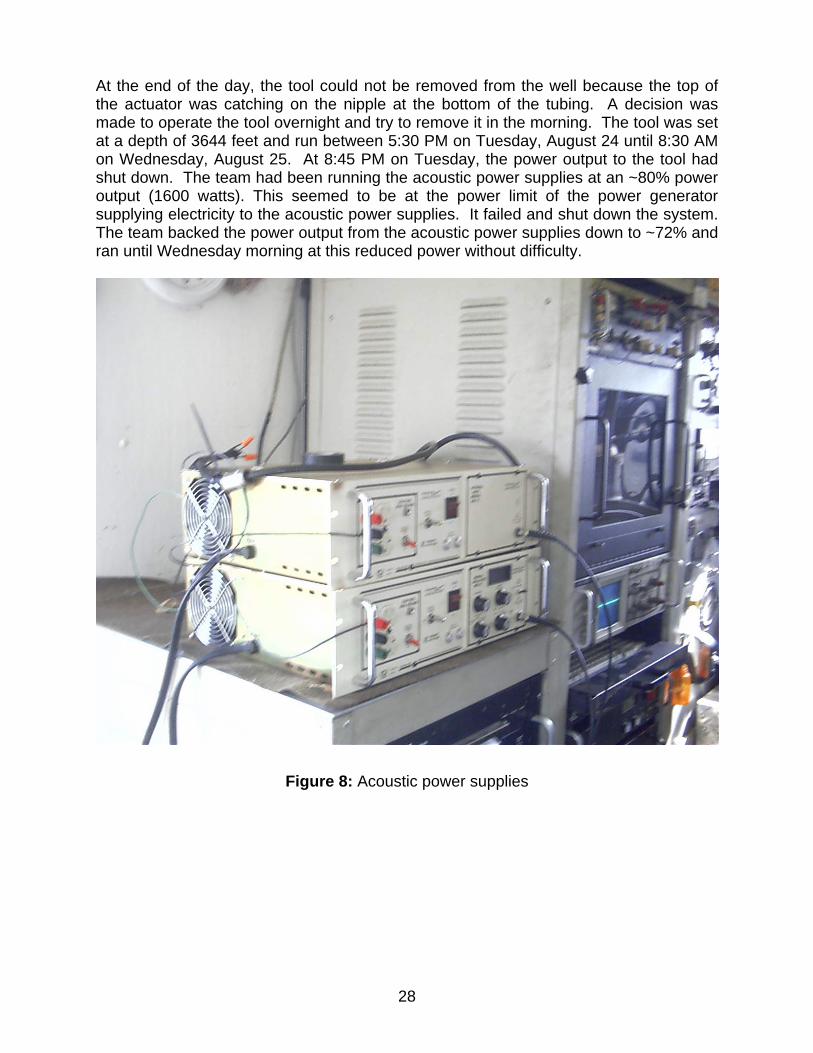
At the end of the day, the tool could not be removed from the well because the top of the actuator was catching on the nipple at the bottom of the tubing. A decision was made to operate the tool overnight and try to remove it in the morning. The tool was set at a depth of 3644 feet and run between 5:30 PM on Tuesday, August 24 until 8:30 AM on Wednesday, August 25. At 8:45 PM on Tuesday, the power output to the tool had shut down. The team had been running the acoustic power supplies at an ~80% power output (1600 watts). This seemed to be at the power limit of the power generator supplying electricity to the acoustic power supplies. It failed and shut down the system. The team backed the power output from the acoustic power supplies down to ~72% and ran until Wednesday morning at this reduced power without difficulty.
Figure 8: Acoustic power supplies
29
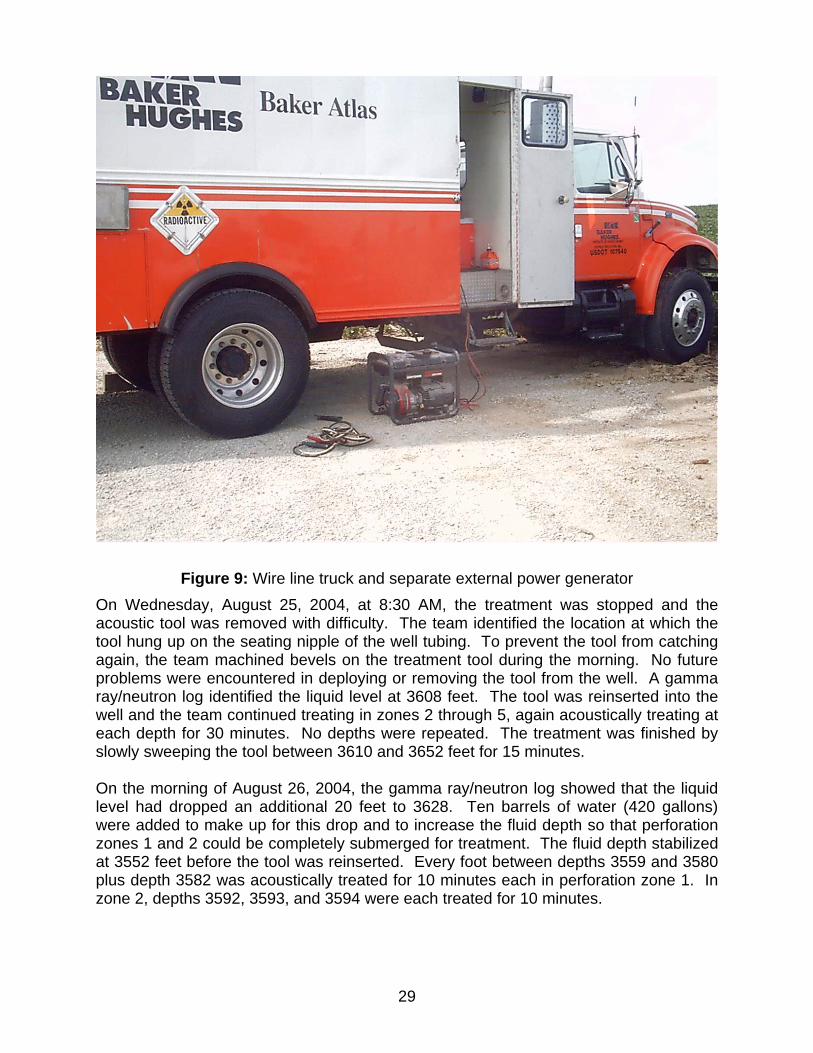
Figure 9: Wire line truck and separate external power generator On Wednesday, August 25, 2004, at 8:30 AM, the treatment was stopped and the acoustic tool was removed with difficulty. The team identified the location at which the tool hung up on the seating nipple of the well tubing. To prevent the tool from catching again, the team machined bevels on the treatment tool during the morning. No future problems were encountered in deploying or removing the tool from the well. A gamma ray/neutron log identified the liquid level at 3608 feet. The tool was reinserted into the well and the team continued treating in zones 2 through 5, again acoustically treating at each depth for 30 minutes. No depths were repeated. The treatment was finished by slowly sweeping the tool between 3610 and 3652 feet for 15 minutes. On the morning of August 26, 2004, the gamma ray/neutron log showed that the liquid level had dropped an additional 20 feet to 3628. Ten barrels of water (420 gallons) were added to make up for this drop and to increase the fluid depth so that perforation zones 1 and 2 could be completely submerged for treatment. The fluid depth stabilized at 3552 feet before the tool was reinserted. Every foot between depths 3559 and 3580 plus depth 3582 was acoustically treated for 10 minutes each in perforation zone 1. In zone 2, depths 3592, 3593, and 3594 were each treated for 10 minutes.
30
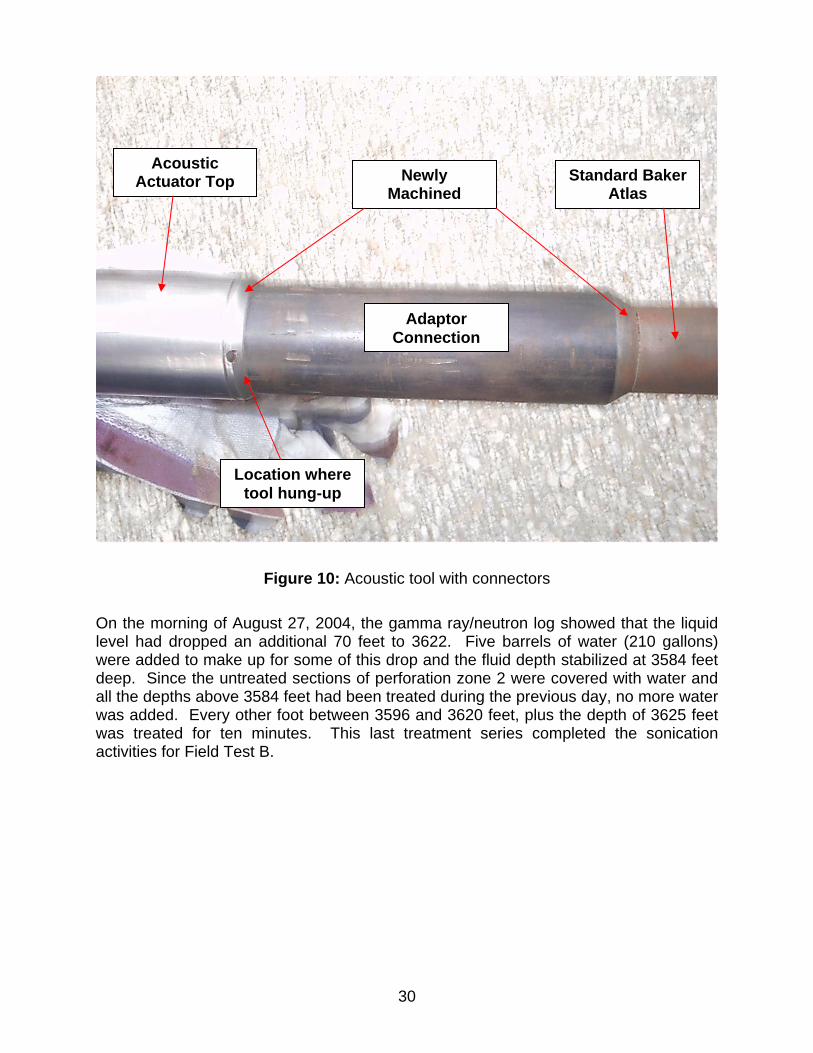
Figure 10: Acoustic tool with connectors On the morning of August 27, 2004, the gamma ray/neutron log showed that the liquid level had dropped an additional 70 feet to 3622. Five barrels of water (210 gallons) were added to make up for some of this drop and the fluid depth stabilized at 3584 feet deep. Since the untreated sections of perforation zone 2 were covered with water and all the depths above 3584 feet had been treated during the previous day, no more water was added. Every other foot between 3596 and 3620 feet, plus the depth of 3625 feet was treated for ten minutes. This last treatment series completed the sonication activities for Field Test B.
Newly Machined
Standard Baker Atlas
Acoustic Actuator Top
Adaptor Connection
Location where tool hung-up
31
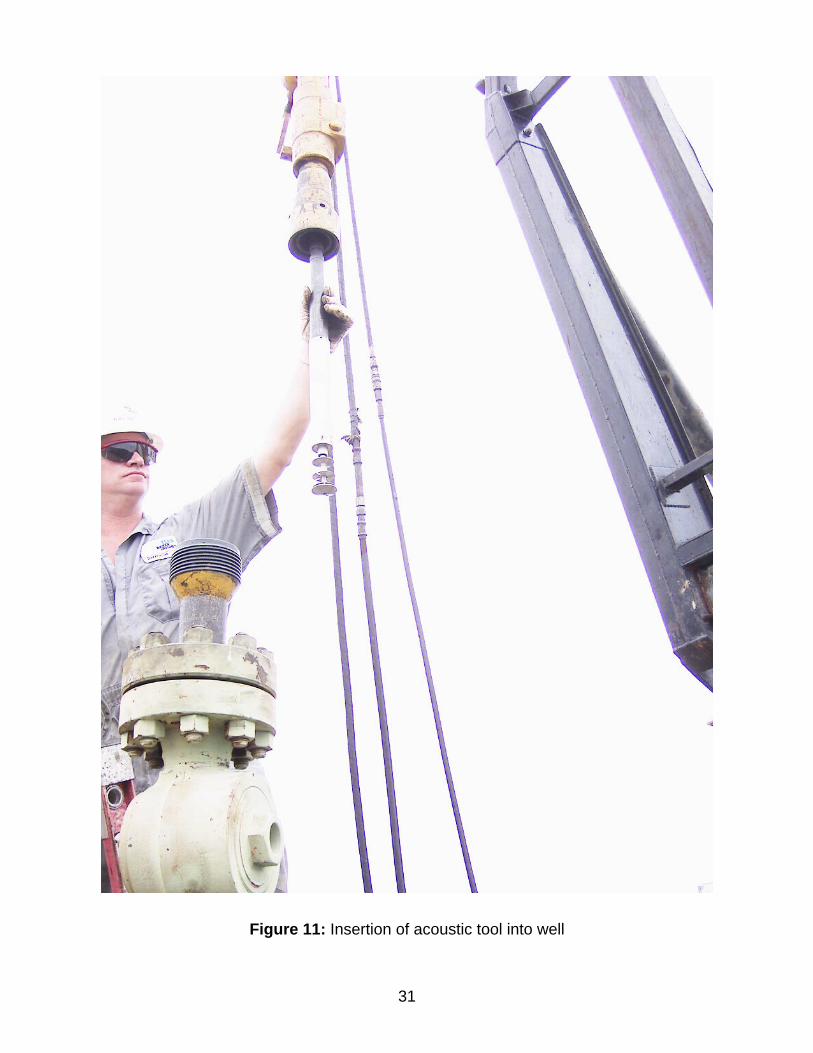
Figure 11: Insertion of acoustic tool into well
32
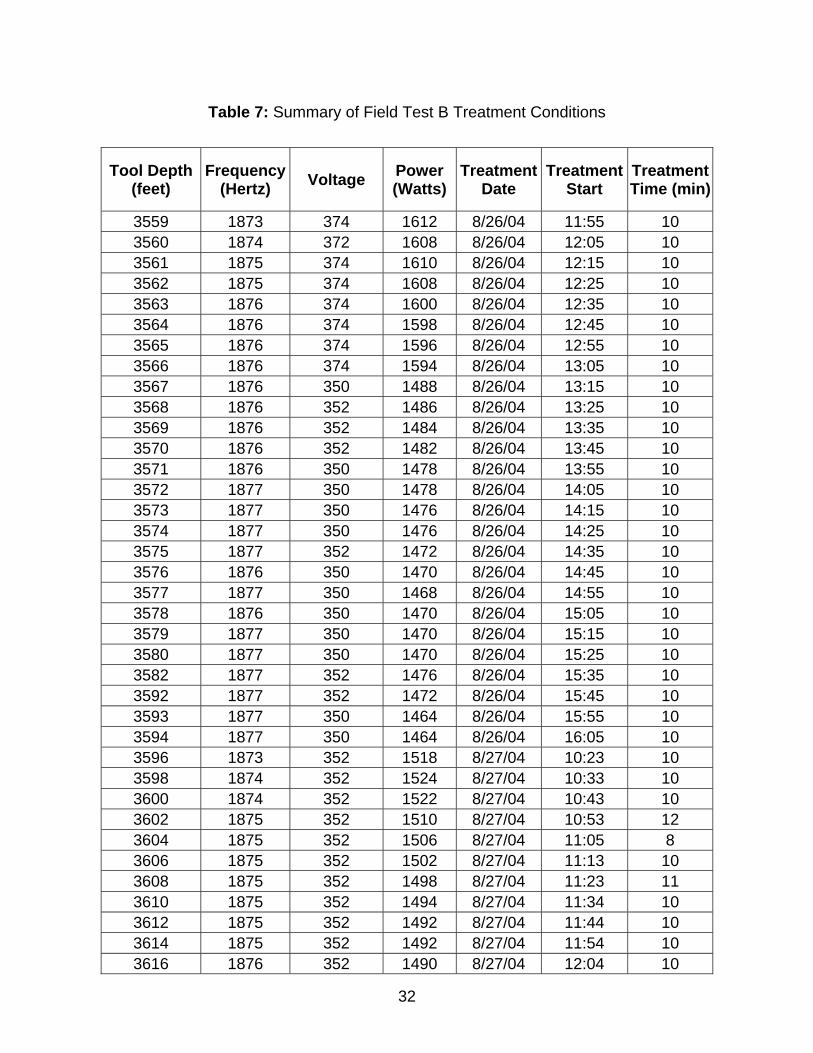
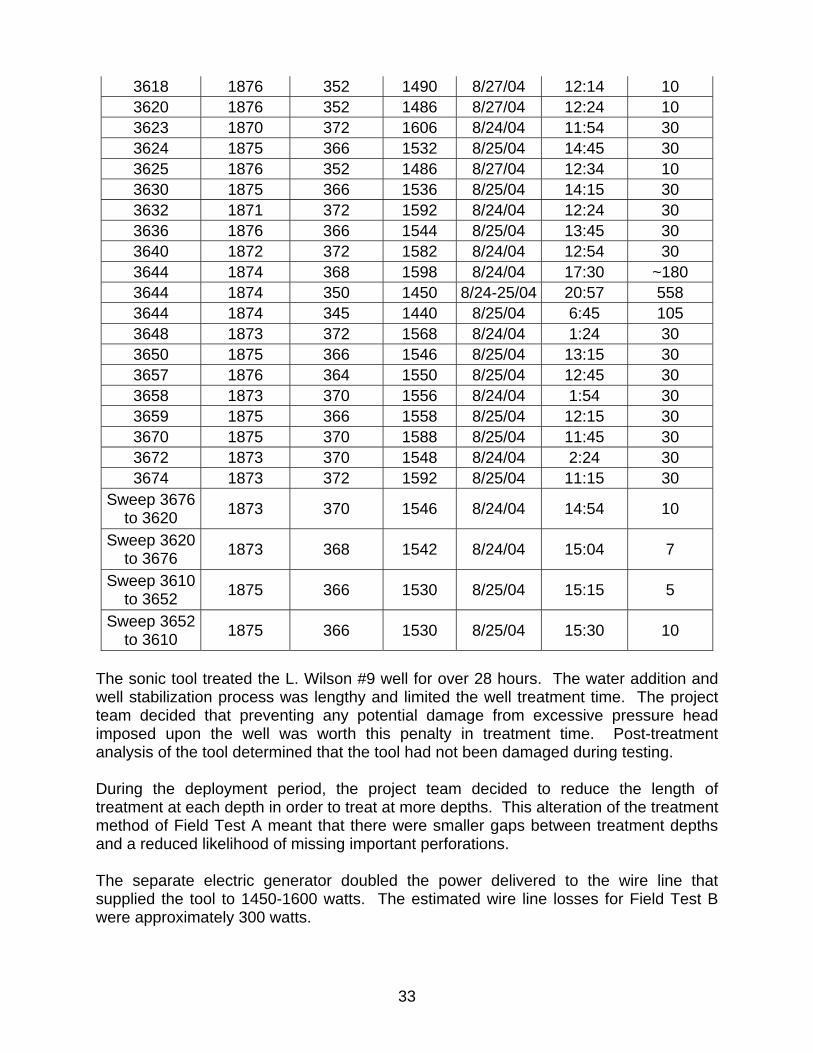
Table 7: Summary of Field Test B Treatment Conditions
The sonic tool treated the L. Wilson #9 well for over 28 hours. The water addition and well stabilization process was lengthy and limited the well treatment time. The project team decided that preventing any potential damage from excessive pressure head imposed upon the well was worth this penalty in treatment time. Post-treatment analysis of the tool determined that the tool had not been damaged during testing. During the deployment period, the project team decided to reduce the length of treatment at each depth in order to treat at more depths. This alteration of the treatment method of Field Test A meant that there were smaller gaps between treatment depths and a reduced likelihood of missing important perforations. The separate electric generator doubled the power delivered to the wire line that supplied the tool to 1450-1600 watts. The estimated wire line losses for Field Test B were approximately 300 watts.
34
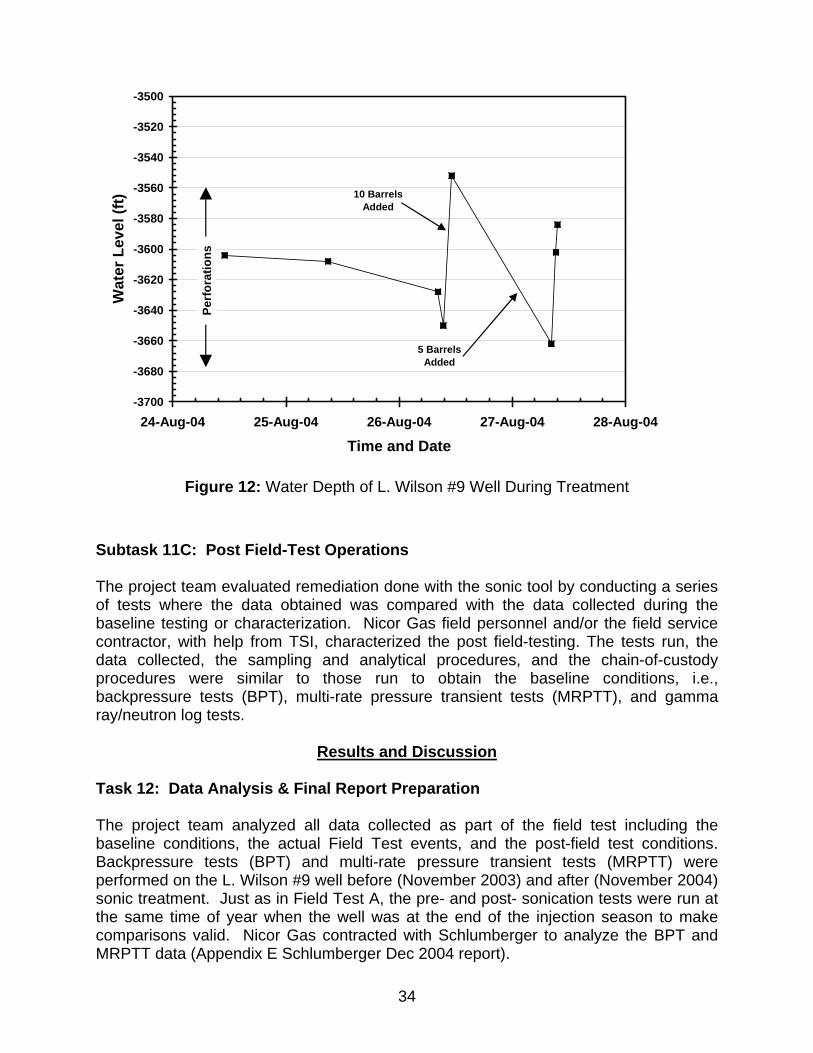
Figure 12: Water Depth of L. Wilson #9 Well During Treatment Subtask 11C: Post Field-Test Operations The project team evaluated remediation done with the sonic tool by conducting a series of tests where the data obtained was compared with the data collected during the baseline testing or characterization. Nicor Gas field personnel and/or the field service contractor, with help from TSI, characterized the post field-testing. The tests run, the data collected, the sampling and analytical procedures, and the chain-of-custody procedures were similar to those run to obtain the baseline conditions, i.e., backpressure tests (BPT), multi-rate pressure transient tests (MRPTT), and gamma ray/neutron log tests.
Results and Discussion
Task 12: Data Analysis & Final Report Preparation The project team analyzed all data collected as part of the field test including the baseline conditions, the actual Field Test events, and the post-field test conditions. Backpressure tests (BPT) and multi-rate pressure transient tests (MRPTT) were performed on the L. Wilson #9 well before (November 2003) and after (November 2004) sonic treatment. Just as in Field Test A, the pre- and post- sonication tests were run at the same time of year when the well was at the end of the injection season to make comparisons valid. Nicor Gas contracted with Schlumberger to analyze the BPT and MRPTT data (Appendix E Schlumberger Dec 2004 report).
-3700
-3680
-3660
-3640
-3620
-3600
-3580
-3560
-3540
-3520
-3500
24-Aug-04 25-Aug-04 26-Aug-04 27-Aug-04 28-Aug-04
Time and Date
Wat
er L
evel
(ft) 10 Barrels
Added
5 Barrels Added
Perf
orat
ions
35
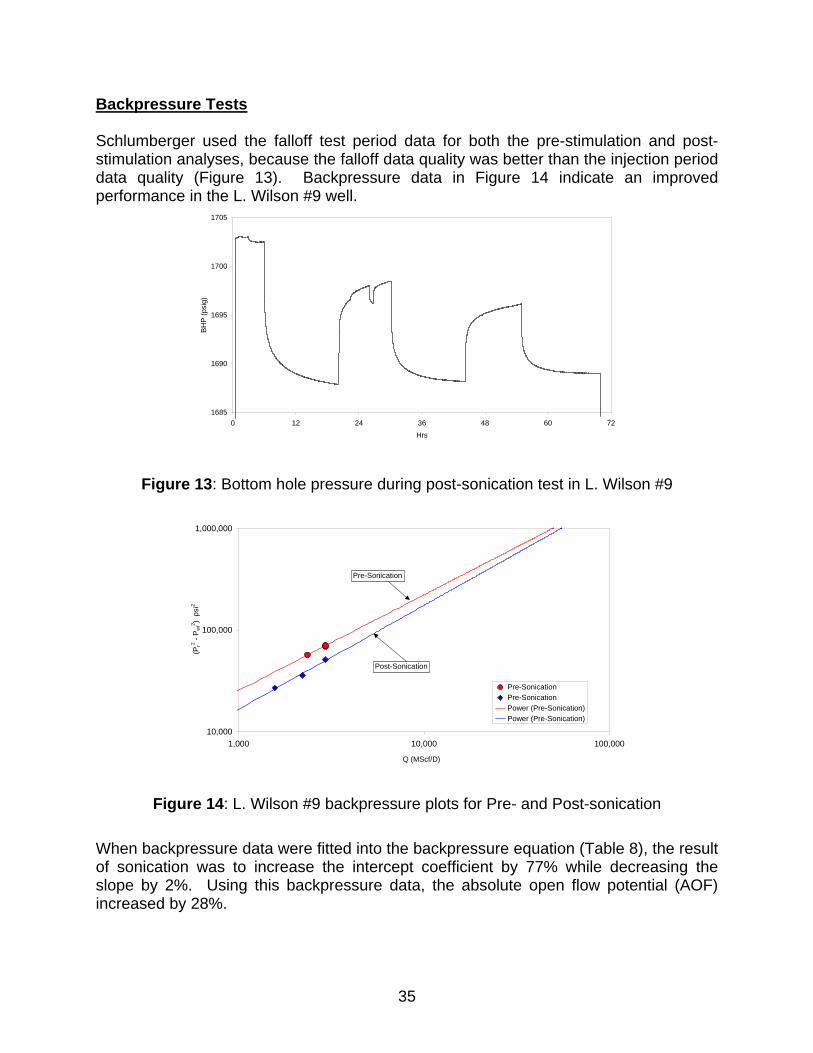
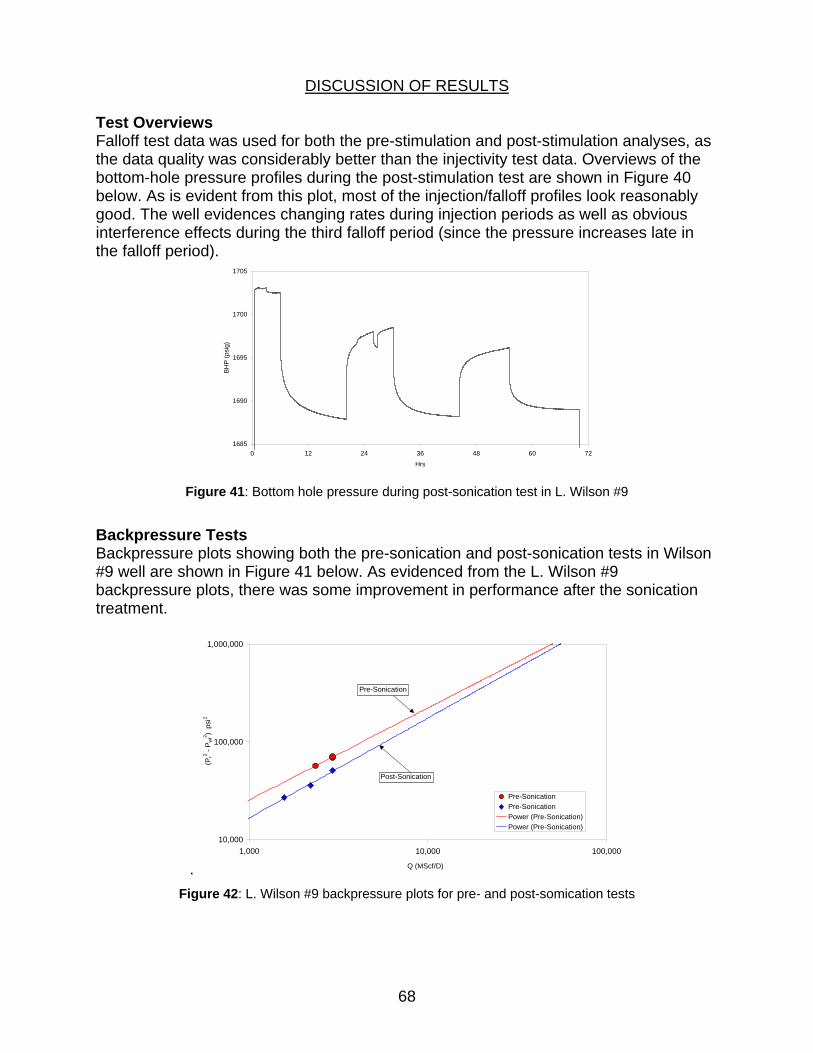
Backpressure Tests Schlumberger used the falloff test period data for both the pre-stimulation and post-stimulation analyses, because the falloff data quality was better than the injection period data quality (Figure 13). Backpressure data in Figure 14 indicate an improved performance in the L. Wilson #9 well.
1685
1690
1695
1700
1705
0 12 24 36 48 60 72Hrs
BHP
(psi
g)
Figure 13: Bottom hole pressure during post-sonication test in L. Wilson #9
Figure 14: L. Wilson #9 backpressure plots for Pre- and Post-sonication
When backpressure data were fitted into the backpressure equation (Table 8), the result of sonication was to increase the intercept coefficient by 77% while decreasing the slope by 2%. Using this backpressure data, the absolute open flow potential (AOF) increased by 28%.
36
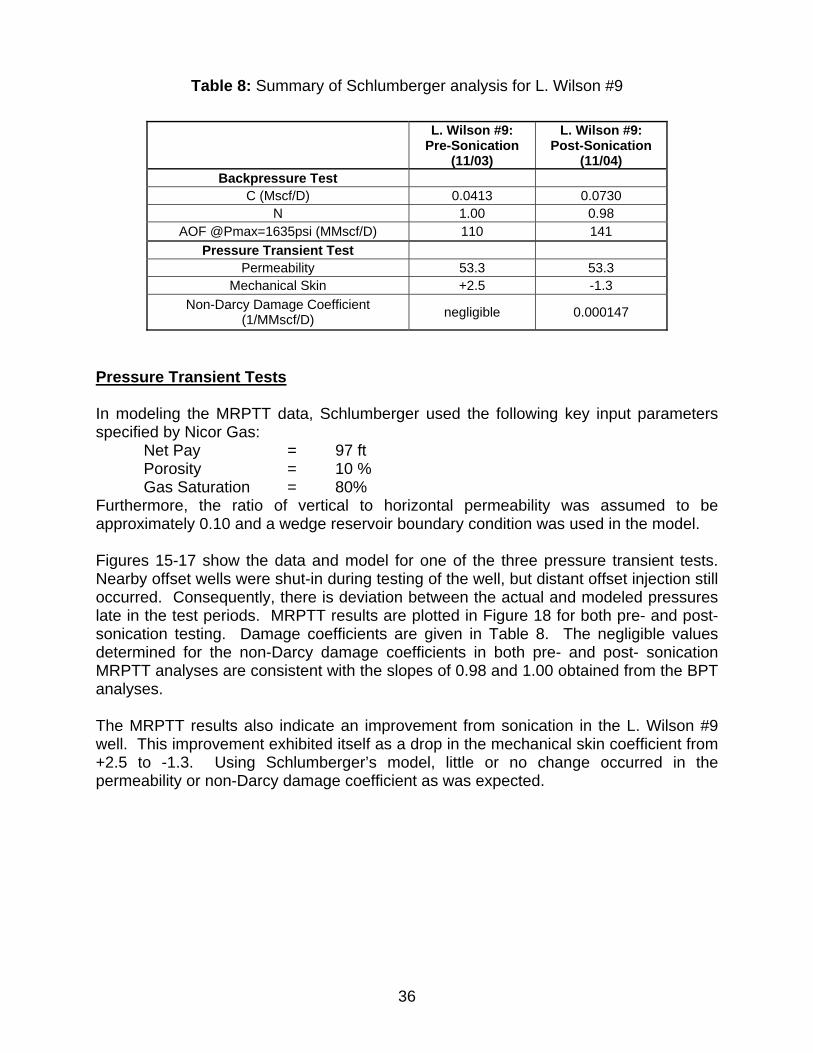
Table 8: Summary of Schlumberger analysis for L. Wilson #9
L. Wilson #9:
Pre-Sonication (11/03)
L. Wilson #9: Post-Sonication
(11/04) Backpressure Test
C (Mscf/D) 0.0413 0.0730 N 1.00 0.98
AOF @Pmax=1635psi (MMscf/D) 110 141 Pressure Transient Test
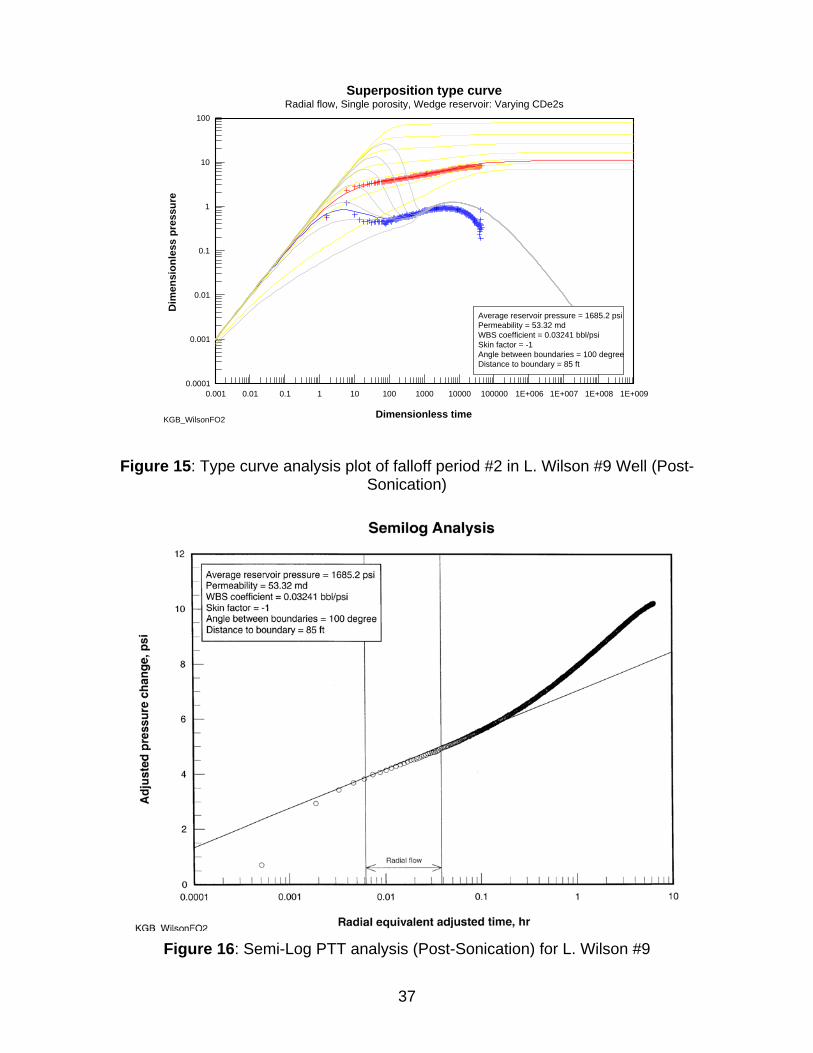
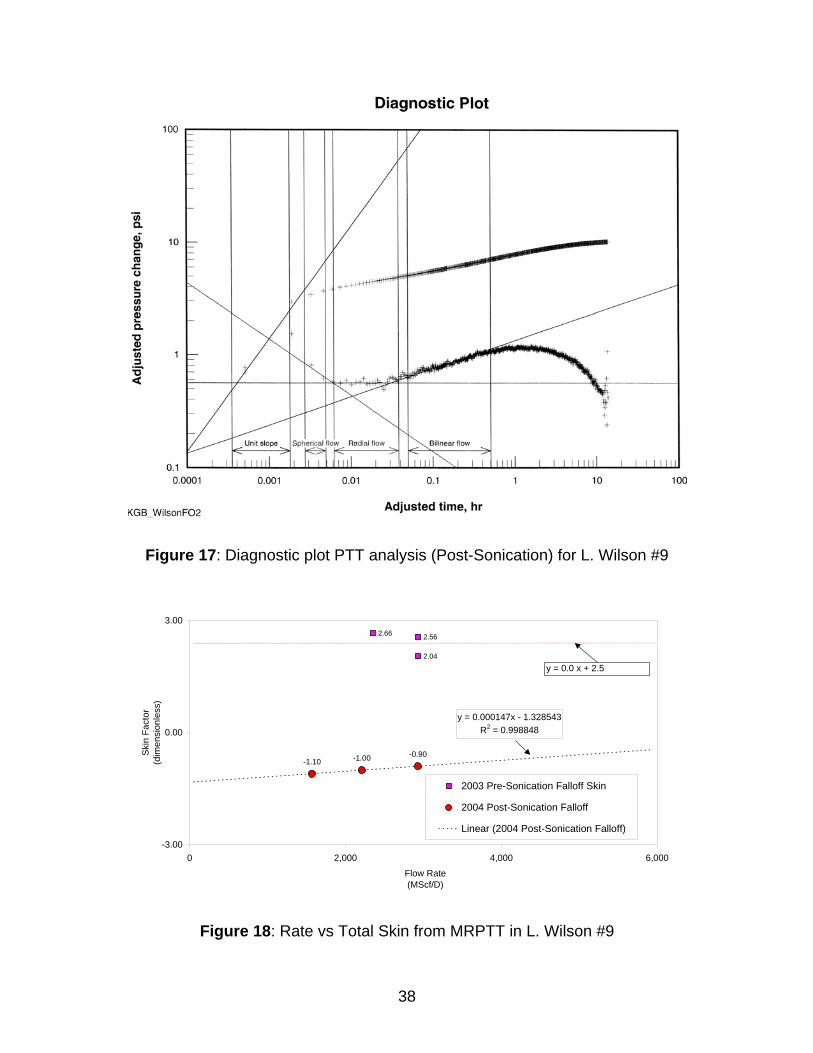
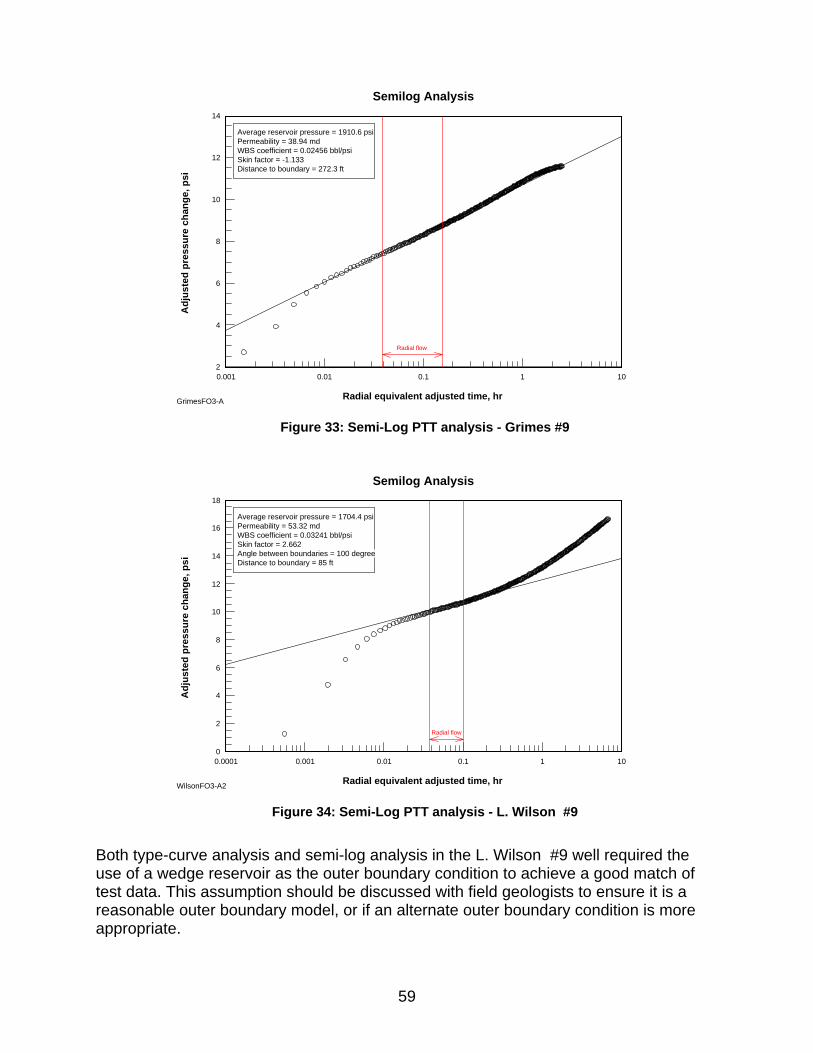
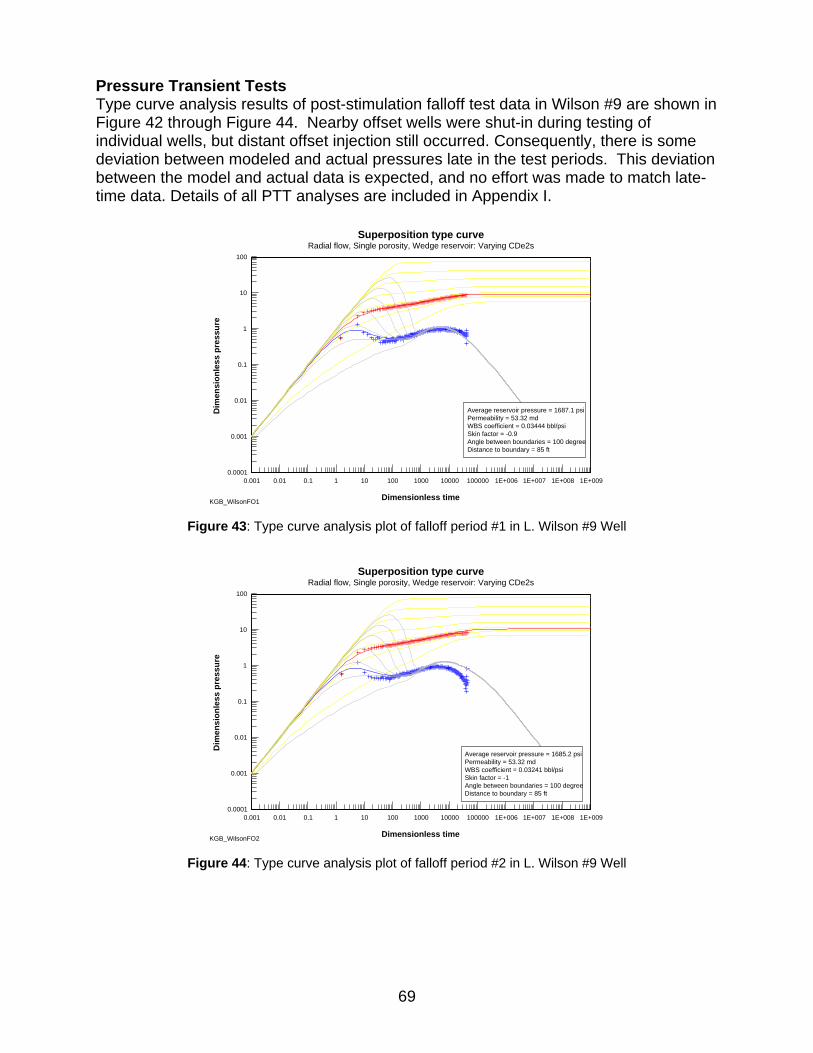
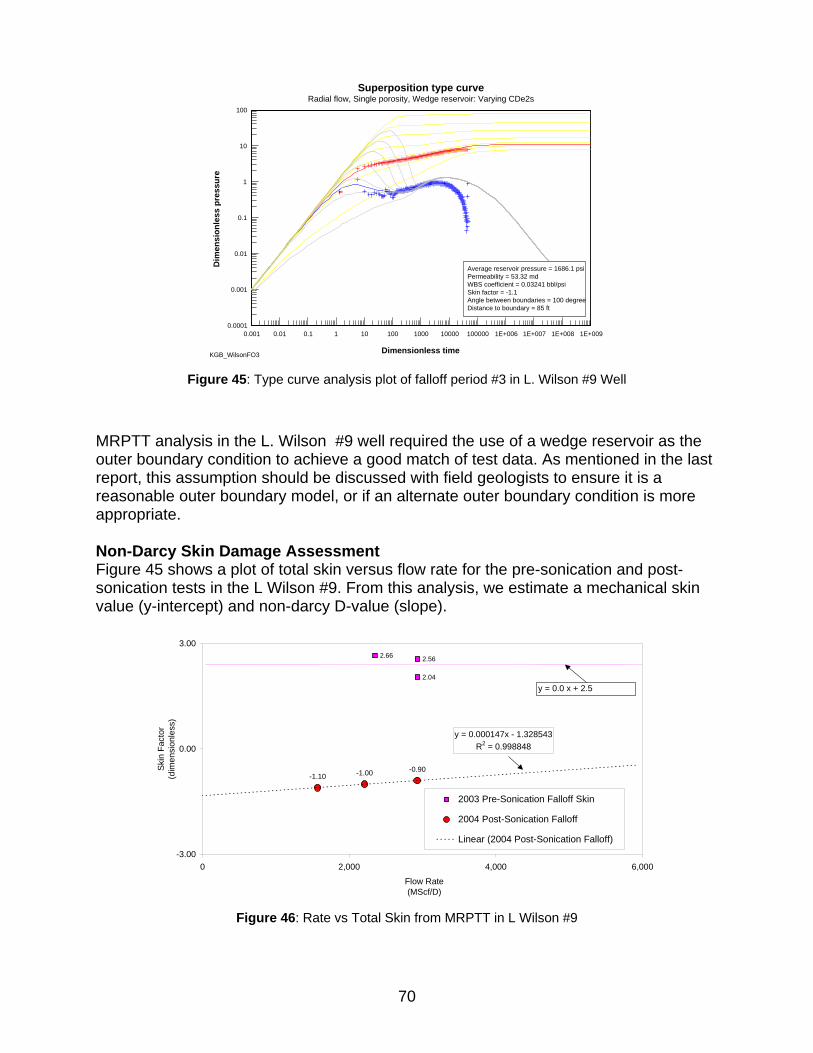
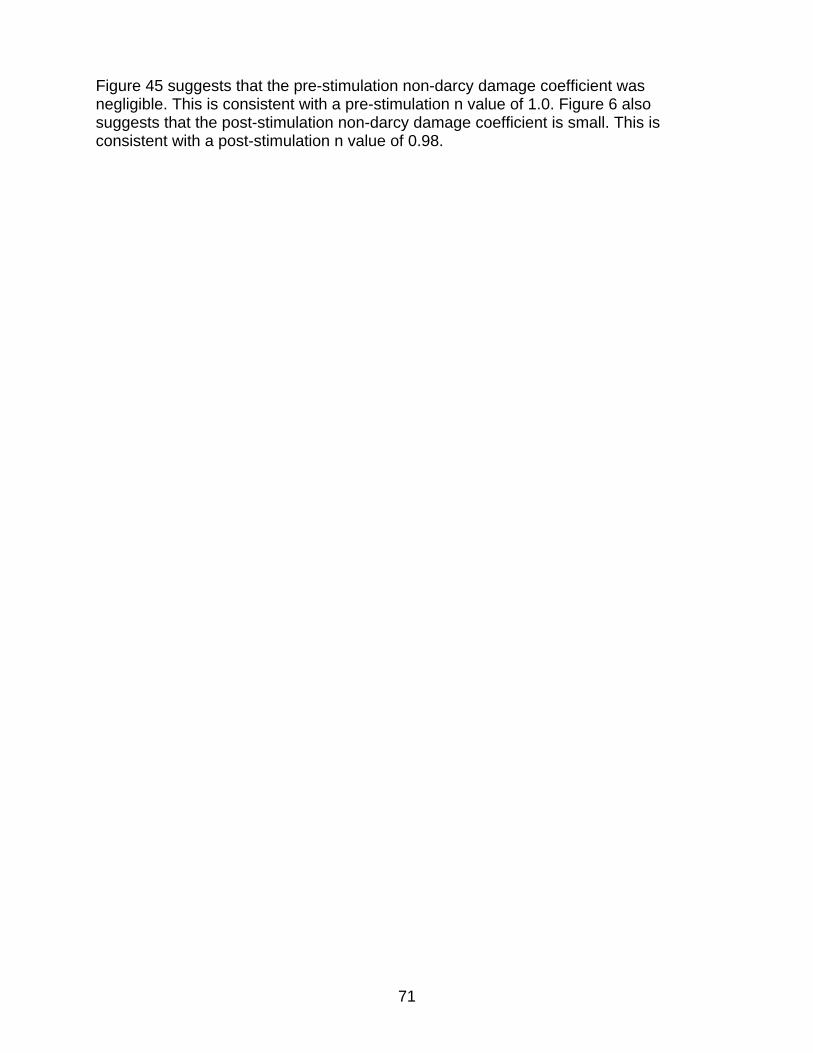
In modeling the MRPTT data, Schlumberger used the following key input parameters specified by Nicor Gas: Net Pay = 97 ft Porosity = 10 % Gas Saturation = 80% Furthermore, the ratio of vertical to horizontal permeability was assumed to be approximately 0.10 and a wedge reservoir boundary condition was used in the model. Figures 15-17 show the data and model for one of the three pressure transient tests. Nearby offset wells were shut-in during testing of the well, but distant offset injection still occurred. Consequently, there is deviation between the actual and modeled pressures late in the test periods. MRPTT results are plotted in Figure 18 for both pre- and post- sonication testing. Damage coefficients are given in Table 8. The negligible values determined for the non-Darcy damage coefficients in both pre- and post- sonication MRPTT analyses are consistent with the slopes of 0.98 and 1.00 obtained from the BPT analyses. The MRPTT results also indicate an improvement from sonication in the L. Wilson #9 well. This improvement exhibited itself as a drop in the mechanical skin coefficient from +2.5 to -1.3. Using Schlumberger’s model, little or no change occurred in the permeability or non-Darcy damage coefficient as was expected.
37
Superposition type curveRadial flow, Single porosity, Wedge reservoir: Varying CDe2s
Average reservoir pressure = 1685.2 psiPermeability = 53.32 mdWBS coefficient = 0.03241 bbl/psiSkin factor = -1 Angle between boundaries = 100 degreeDistance to boundary = 85 ft
Dim
ensi
onle
ss p
ress
ure
Dimensionless timeKGB_WilsonFO2
Figure 15: Type curve analysis plot of falloff period #2 in L. Wilson #9 Well (Post-Sonication)
Figure 16: Semi-Log PTT analysis (Post-Sonication) for L. Wilson #9
38
Figure 17: Diagnostic plot PTT analysis (Post-Sonication) for L. Wilson #9
2.04
2.562.66
-0.90-1.00-1.10
y = 0.000147x - 1.328543R2 = 0.998848
-3.00
0.00
3.00
0 2,000 4,000 6,000
Flow Rate(MScf/D)
Ski
n Fa
ctor
(dim
ensi
onle
ss)
2003 Pre-Sonication Falloff Skin
2004 Post-Sonication Falloff
Linear (2004 Post-Sonication Falloff)
y = 0.0 x + 2.5
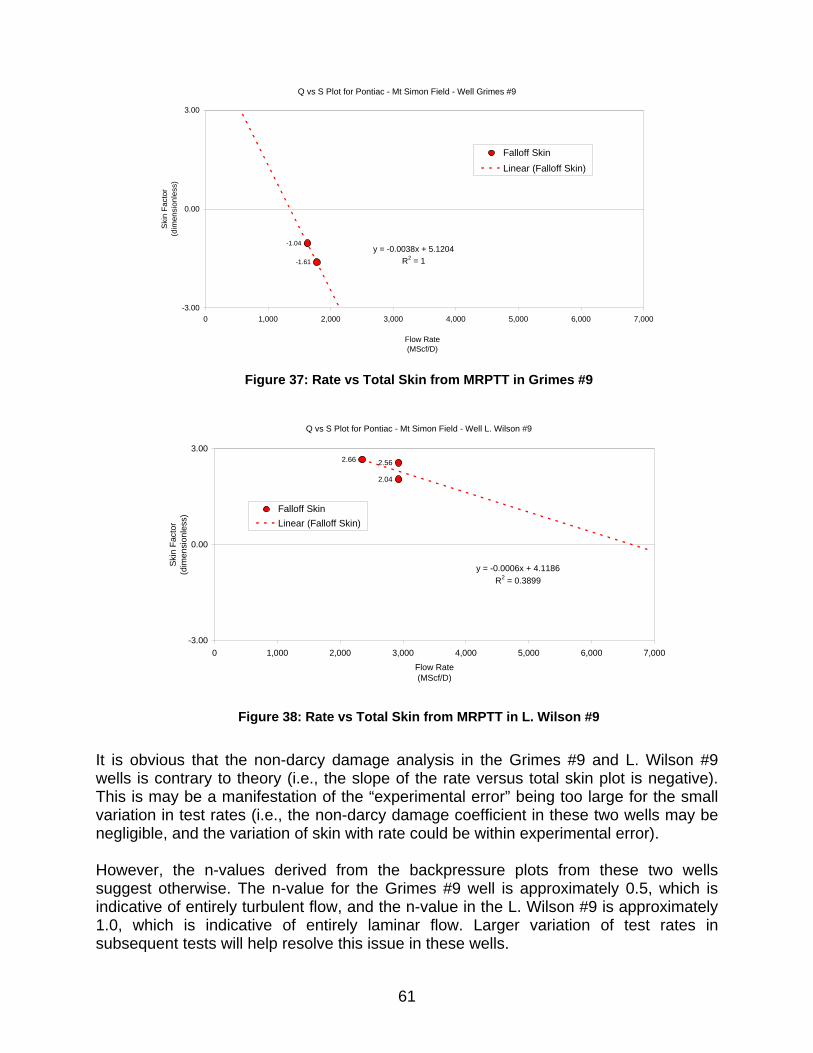
Figure 18: Rate vs Total Skin from MRPTT in L. Wilson #9
39
Conclusion
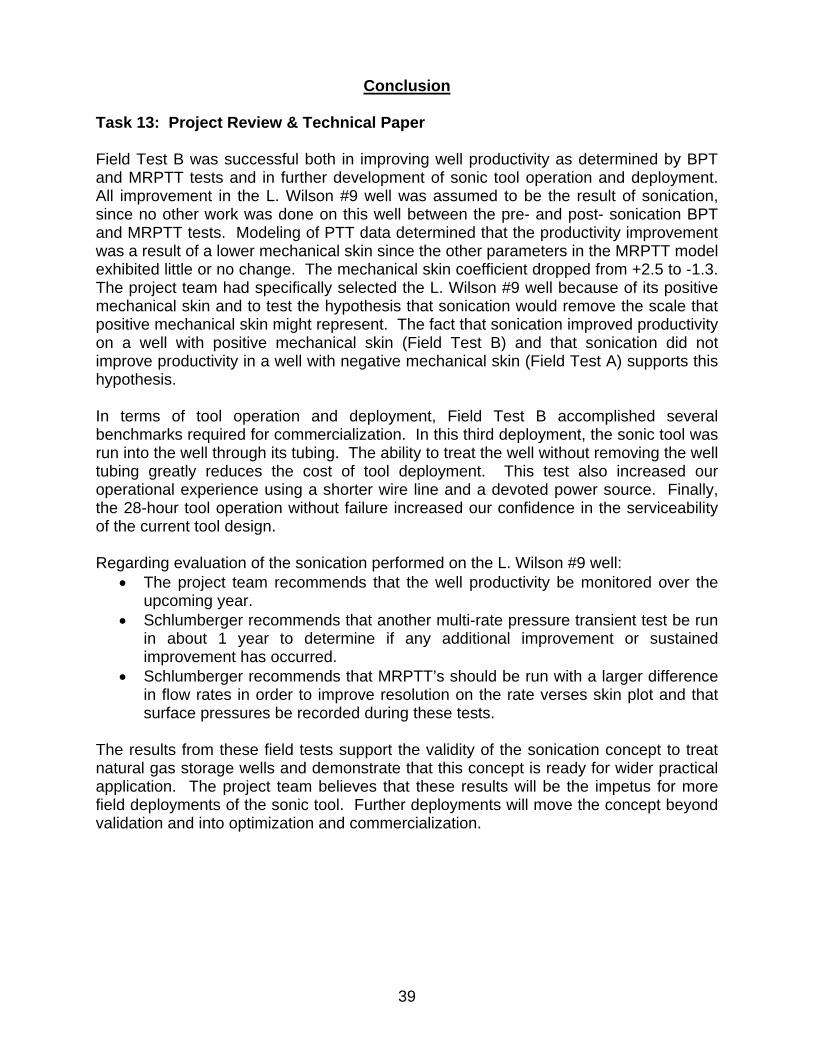
Task 13: Project Review & Technical Paper Field Test B was successful both in improving well productivity as determined by BPT and MRPTT tests and in further development of sonic tool operation and deployment. All improvement in the L. Wilson #9 well was assumed to be the result of sonication, since no other work was done on this well between the pre- and post- sonication BPT and MRPTT tests. Modeling of PTT data determined that the productivity improvement was a result of a lower mechanical skin since the other parameters in the MRPTT model exhibited little or no change. The mechanical skin coefficient dropped from +2.5 to -1.3. The project team had specifically selected the L. Wilson #9 well because of its positive mechanical skin and to test the hypothesis that sonication would remove the scale that positive mechanical skin might represent. The fact that sonication improved productivity on a well with positive mechanical skin (Field Test B) and that sonication did not improve productivity in a well with negative mechanical skin (Field Test A) supports this hypothesis. In terms of tool operation and deployment, Field Test B accomplished several benchmarks required for commercialization. In this third deployment, the sonic tool was run into the well through its tubing. The ability to treat the well without removing the well tubing greatly reduces the cost of tool deployment. This test also increased our operational experience using a shorter wire line and a devoted power source. Finally, the 28-hour tool operation without failure increased our confidence in the serviceability of the current tool design. Regarding evaluation of the sonication performed on the L. Wilson #9 well:
• The project team recommends that the well productivity be monitored over the upcoming year.
• Schlumberger recommends that another multi-rate pressure transient test be run in about 1 year to determine if any additional improvement or sustained improvement has occurred.
• Schlumberger recommends that MRPTT’s should be run with a larger difference in flow rates in order to improve resolution on the rate verses skin plot and that surface pressures be recorded during these tests.
The results from these field tests support the validity of the sonication concept to treat natural gas storage wells and demonstrate that this concept is ready for wider practical application. The project team believes that these results will be the impetus for more field deployments of the sonic tool. Further deployments will move the concept beyond validation and into optimization and commercialization.
40
References Furness JC, Johnson DO, Wilkey ML, Furness L, Vanderlee K, and PD Paulsen, “Improved Natural Gas Storage Well Remediation,” Final Report for Budget Period 1, DOE Technical Report # DE-FC26-00FT40704, 2003. Ammer JR, Furness JC, Wilkey ML, and DO Johnson, “Well Bore Remediation Using Sonication,” American Gas Association 2002 Operating Section Proceedings.
41
APPENDIX A Field Test Plan Fienhold #18 October 2002
FIELD TEST PLAN FOR THE DOWNHOLE TESTING OF THE SONIC TOOL IN AN
INJECTION/WITHDRAWAL WELL AT NICOR GAS’ PONTIAC NATURAL GAS STORAGE WELL FIELD
The US Department of Energy’s National Energy Technology Laboratory (NETL) has funded the project team (Furness-Newburge, Inc. (FNI) and TechSavants, Inc. (TSI)) to develop a tool capable of remediating (removing scale) underground natural gas storage well within an aquifer. As part of the second phase (Budget Period 2) the project team working with Nicor Gas has scheduled a field trial to test the sonic tool in one or two pressurized natural gas storage well(s) in Nicor Gas’ field near Pontiac, IL (see page 4 for maps and driving directions). Pre-Field Test Activities As part of their cost sharing in this field test, Nicor Gas (or their field operators—Baker Atlas Wireline) needs to do the following:
1. Select Injection/Withdrawal (I/W) wells to be used in the testing program. 2. Send safety-related information to all project team participants before testing
commences. 3. Prior to the field-testing conduct the following operations:
a) Determine the size of the opening at the end of the tubing string in each well.
b) Collect water samples at the various depths where tests occurred in the well to determine the background chemistry of the water. The number of samples, the parameters to be analyzed and the collection depths will be determined prior to the field-testing and after the wells are selected. Send samples for analysis of water chemistry parameters.
c) Insert a downhole video camera into the well bore to document the extent and current state of corrosion and scale build-up. This information will be compared to information collected by the downhole video cameras in each of the well bores following the field test. The difference between the two will be a qualitative measure of the work done by the sonic tool.
d) Segmented bond logs will be run in each well to document cement integrity prior to the field test. As in "c" above, this information will be compared to logs run after the field test to determine if sonication had any impact on the cement bond integrity. Preliminary and repeat runs will be made for each log.
e) Gamma ray/neutron (GRN) logs will be run in each well to determine whether hydrocarbons are present. Following the field test, GRN logs will be rerun to determine if additional hydrocarbons are present, i.e., did sonication impact or alter the gas bubble behind the well casing. Preliminary and repeat runs will be made for each log.
42
f) Measure water levels in observation wells surrounding natural gas storage fields prior to field test to use as a measure of the volume of natural gas in storage within the well field after field test.
g) Conduct Transient Pressure Tests—These multi-rate flow tests can benchmark production potential at a certain drawdown rate and gas inventory.
h) Conduct Flow Prover Tests—These tests measure the characteristics of an individual well’s flow by measuring the gas flow at different pressures, i.e. before and after sonication to measure the increase in flow due to remediation by sonication.
Field Testing of the Sonic Tool
As part of the first day’s activities, and prior to actually beginning the downhole testing, Nicor Gas will conduct a safety briefing for all field-test participants.
Some of the topics that will be discussed, but will be listed in advance are:
1. Appropriate safety and health standards are to be followed to comply with: a. Occupational Safety and Health Act of 1970 b. Illinois Commerce Commission General Order 204 c. Department of Transportation 49 CFR Part 192
2. Appropriate clothing is required:
a. Clothing is to be of natural fibers, such as cotton or wool. Synthetic materials, such as polyester and nylon, are not to be worn.
b. Footwear required is to be steel-toed which displays the ANSI Z41, or most current ANSI approval. They must be over-the-ankle and made of leather or equivalent to provide ankle support.
c. Hard hats must be worn on the job site and will be marked ANSI Z89.1, or the most current ANSI rating.
As part of the field test, the project team (FNI, TSI and Nicor Gas) will conduct following operations: (see page 5 for proposed daily activities/tests) a) Field service operator "rig-up" -i.e., prepare the first I/W pressurized well for the
insertion of the sonication tool (snubbing of tubing, preliminary downhole runs, etc.). b) Attach the sonic tool to the wireline. c) Lower the tool into the hole to desired depth to begin testing d) Sonic tool checkout e) Sine wave testing f) Square wave testing g) Raise or lower sonic tool to new depth and repeat “e” and “f” h) Repeat “g” to complete the test plan for the I/W well i) Remove sonic tool from the I/W pressurized well
43
Post Field Test Activities Upon completion of the field test in the pressurized I/W well, Nicor Gas (or their field operators—Baker Atlas Wireline) will conduct the following operations. a) Collect water samples at the depths where the sonic tool testing occurred and
analyze samples for water chemistry as per 3b. Compare these results to background water chemistry results obtained as part of 3b to determine, qualitatively, that work is being done by sonication.
b) Insert the downhole video camera to document conditions in each well following testing. Compare these results to background video information established as part of 3c to determine, qualitatively, the amount of scour or scale removal.
c) Run segmented bond logs in each well and compare the data to background data collected in 3d to determine if sonication had any impact on the cement bond integrity. Preliminary and repeat logs will be run for each well.
d) Run Gamma Ray/Neutron (GRN) logs in each well to determine where hydrocarbons are present. These data will be compared with the background data collected in 3e. If any additional hydrocarbons are present, they may indicate that sonication had an impact on or altered the gas bubble behind the well casing. Preliminary and post-treatment GRN logs will be run for each well.
e) Water levels in observation wells will be evaluated over a period of several months to determine if the levels have changed.
f) Field service operator "rigs down" -i.e. return the I/W wells to their pre-testing field operation status.
g) Conduct Multi-Rate Pressure Transient Tests—compare with 3g. h) Conduct Flow Prover Tests—compare with 3h.
Field Testing of Sonication Tool
Location: Nicor Gas, Station 80 – Pontiac, Illinois Dates: Wednesday, November 20, 2002 – Monday, November 25, 2002 Daily times: Start: 8:00 A.M. – End: 5:00 P.M. Directions to Pontiac Office (shown below from Chicago):
1. Illinois Route 55 - South to St. Louis 2. Route 23 - South to Pontiac 3. Route 116 - East (approximately 3 miles) 4. Fork in road, turn right (approximately 1 mile) 5. 1600 N, turn left – East (approximately 3 miles) 6. 2000 E, turn right – South to station
44
Potential Attendees Listed below are potential attendees for the week of testing, along with their respective cell and pager numbers. Please contact Joe Deters regarding specifics for the week. During this week, Nicor Gas employees will have complete jurisdiction and authority related to operational activities while on-site. Should any operational problem or concern arise while on-site, please call the Pontiac office first and then one of the Nicor Gas representatives. Company Representative Cell Number Pager Number Nicor Gas Joe Deters Pontiac Office (815) 844-7701 ---------------
TechSavants Don Johnson (630) 842-0247 ---------------- Mike Wilkey (708) 267-0984 ----------------- Furness-Newburge Jim Furness (859) 533-3234 ----------------- Dave Paulsen NETL Jim Ammer Baker-Atlas TBD
45
Tentative Agenda Listed below is a tentative agenda for the testing week. Testing parameters are subject to change. Monday, November 4
8:00 – 10:00: Safety meeting at station facility (See safety information to be distributed prior to field test (page 1) and points of emphasis at beginning of Field Test section on page 2)
10:00 – 12:00: Discussion of testing protocol
12:00 – 5:00: Sonic tool lowered middle of perforations and operated with a Sine Wave at constant depth with no wireline travel
Tuesday, November 5
8:00 – 4:00 Sonic tool lowered from top of perforations to 5’ above the middle of the perforated zone, operating with a Sine Wave with wireline travel set at 5 feet per hour 4:00 – 5:00 Measure water level and obtain sample with bailer from top, middle, and bottom of perforations
Wednesday, November 6
8:00 – 4:00 Sonic tool lowered to next deeper section of perforations (from 5’ below the middle of the perforated zone to bottom of perforations), operating with a Square Wave with wireline travel set at 5 feet per hour 4:00 – 5:00 Measure water level and obtain samples with bailer from top, middle, and bottom of perforations Thursday, November 7 8:00 – 5:00 Run Post Field Test Gamma-Ray-Neutron Log Friday, November 8 8:00 – 5:00 Run Post Field Test Segmented Bond Log and return well to original operating orientation
46
APPENDIX B Table 9: Flow Prover Test Data
BEFORE SONIC TREATMENT (11/13/02) AFTER SONIC TREATMENT (12/20/02) Pressure (psig) Pressure (psig) Plate Size 1/4" 3/8" 1/2" 5/8" 1/4" 3/8" 1/2" 5/8" Time (min)
Calc Volume of Gas (mcf) 1332.1 783.6 542.3 407.9 401.8 330 270.8 183.9
48
APPENDIX C
Analysis of Multi-Rate Pressure Transient Test Data From Four Gas Storage Wells in the
Pontiac Mt Simon Gas Storage Field, Livingston County, Ill
prepared for
NICOR GAS Naperville, Illinois
Kenneth G. Brown Principle Consultant – Gas Storage Joseph H. Frantz Operations Manager, Consulting Services, Eastern US
December 2003
Data and Consulting Services
49
EXECUTIVE SUMMARY
Purpose The purpose of this report is to document the results of multi-rate pressure transient testing (MRPTT) and backpressure testing conducted in four of NICOR GAS’ underground gas storage wells located in the Pontiac - Mt Simon Field. One of these wells, the Fienhold #18 well, was involved in a sonication stimulation treatment. The remaining three, Brokaw #5, Grimes #9, and L. Wilson #9 have not been stimulated via sonication. Conclusions Based on results of the pre- and post sonication multi-rate pressure transient test analysis (MRPTTA) from the Fienhold #18 well, it appears that little, if any, improvement was realized as a result of the recent sonication stimulation treatment. It is important to note, however, that the Fienhold #18 well had permeability of 30.5 md and a mechanical skin of –2.45 prior to the sonication stimulation. As such, the well was probably not the best candidate for a stimulation treatment aimed at reduction of mechanical skin damage. The Brokaw #5 well has a permeability of 68.3 md and a mechanical skin factor of –3.3. The Grimes #9 well has a permeability of 38.9 md and mechanical skin factor on the order of –1.5. Given the similarity of these two wells compared to the Fienhold #18 well, no significant improvement would be expected as a result of a sonication stimulation. The L. Wilson #9 well has a permeability of 53.3 md and mechanical skin on the order of 2.0. This well may represent a better candidate for sonication stimulation. However, it would be prudent to construct a calibrated NODAL analysis model to estimate the improvement expected from a reduction in the mechanical skin factor in this well. Recommendations Based on our analyses of the MRPTT data from the Brokaw #5, Fienhold #18, Grimes #9, and the L. Wilson #9 wells, we recommend the following:
1. Given that no significant improvement was observed in the Fienhold #18 well, no sonication stimulations are recommended for either the Brokaw #5 well or the Grimes #9 well.
2. We recommend construction of a calibrated NODAL analysis model for the L.
Wilson #9 well to determine the anticipated benefits of stimulation to reduce the mechanical skin damage before considering it as a possible sonication stimulation candidate.
3. Future MRPTT’s utilize three significantly different flow rates during the test
sequence, to ensure sufficient resolution on the rate versus skin plot to successfully distinguish between mechanical damage and non-darcy damage.
50
4. Another MRPTT should be run in the Fienhold #18 well in about 1 year to see if any additional improvement/cleanup has occurred.
BACKGROUND The four gas storage wells included in this study, the Brokaw #5, Fienhold #18, Grimes #9, and the L. Wilson #9 wells, are in the Pontiac Mt Simon gas storage field, located in Livingston County, Illinois. The Fienhold #18 well was stimulated via a sonication treatment in late November 2002. The remaining three wells have not had a sonication treatment performed on them. NICOR GAS requested that Schlumberger Data & Consulting Services (DCS) analyze MRPTT data from all four wells to determine if the stimulation was effective in the Fienhold #18 well and if a similar treatment should be performed in the remaining three wells. In the Fienhold #18 well, pre-stimulation testing occurred in November 2002 and consisted of three injection/falloff periods lasting a total of about 3 days (analysis results from pre-stimulation tests are included in a separate report from Schlumberger DCS). The post-stimulation testing occurred in October and November of 2003, and also consisted of three injection/falloff periods lasting a total of about 3 days. In the remaining three wells, testing occurred from late October into early November 2003. RESULTS A summary of key input parameters used in the analysis of MRPTT data from the four wells is shown in Table 10. These values were supplied by NICOR GAS for use in the study.
DISCUSSION OF RESULTS Test Overviews Falloff data was used for both the pre-stimulation and post-stimulation analyses, as the quality was considerably better than the injectivity data. Overviews of the bottom-hole pressure profiles during the post-stimulation test are shown in Figure 19 through Figure 22 below. As is evident from these plots, most of the injection/falloff profiles look reasonably good, with the exception of the Grimes #9 well. The Grimes #9 well evidences changing rates during injection periods as well as obvious interference effects during the third falloff period (since the pressure increases late in the falloff period).
1700
1710
1720
1730
1740
1750
1760
1770
1780
1790
1800
0 12 24 36 48 60 72Hrs
BH
P (p
si)
Figure 19: Bottom Hole Pressure During Test in Brokaw #5
1,400
1,410
1,420
1,430
1,440
1,450
1,460
1,470
1,480
1,490
1,500
0 12 24 36 48 60 72Hrs
BHP
(psi
)
Figure 20: Bottom Hole Pressure During Post-Stimulation Test in Fienhold #18
53
1,900
1,910
1,920
1,930
0 12 24 36 48 60 72Hrs
BH
P
Figure 21: Bottom Hole Pressure During Test in Grimes #9
1,700
1,710
1,720
1,730
1,740
1,750
0 12 24 36 48 60 72
Hrs
BH
P (p
sia)
Figure 22: Bottom Hole Pressure During Test in L. Wilson #9
Backpressure Tests
Backpressure analyses were performed for all four wells, and the backpressure plots are shown in Figure 23 through Figure 26 below. Only the Fienhold #18 well had tests before and after stimulation (i.e., the sonication treatment ). Therefore, this is the only plot where before and after curves are plotted and compared. As evidenced from the Fienhold #18 backpressure plot, there is very little difference in performance before and after the treatment. In fact, a slight decline in performance is evidenced after the treatment. However, the well may not be completely cleaned up yet, so the well’s performance may improve over time.
Figure 24: Fienhold #18 Backpressure Plots – Before and After Sonication
55
y = 0.0069x2.0646
R2 = 0.977
10,000
100,000
1,000,000
1,000 10,000 100,000
Q (MScf/D)
(Pr2 -
Pw
f2 ) ps
i2
Figure 25: Grimes #9 Backpressure Plot
y = 38.272x0.9411
R2 = 0.9853
10,000
100,000
1,000,000
1,000 10,000 100,000
Q (MScf/D)
(Pr2 -
Pw
f2 ) ps
i2
Figure 26: L. Wilson #9 Backpressure Plot
56
Pressure Transient Tests Type curve analysis results of post-stimulation falloff test data are shown in Figure 27 through Figure 30. Analysis results are shown for the third falloff period in each well, and all test periods yielded the same calculated permeability values for a given well. Analysis results from all the test periods are included in Appendix I.
Superposition type curveRadial flow, Single porosity, Constant pressure circular boundary: Varying CDe2s
Average reservoir pressure = 1704.4 psiPermeability = 53.32 mdWBS coefficient = 0.03241 bbl/psiSkin factor = 2.662 Angle between boundaries = 100 degreeDistance to boundary = 85 ft
Dim
ensi
onle
ss p
ress
ure
Dimensionless timeWilsonFO3-A2 Figure 30: Type Curve Analysis of Falloff Period #3 From PTTA in L. Wilson #9 Well
Nearby offset wells were shut-in during testing of individual wells, but distant offset injection still occurred. A constant pressure outer boundary condition was used in type-curve analyses, which approximates this condition. An increasing pressure outer boundary is more representative of reality, but not an available option in WELLTESTTM. Consequently, there is some deviation between modeled and actual pressures for some test periods, and indicated boundaries are probably questionable.
58
Semi-Log analysis results of post-stimulation falloff test data are shown in Figure 31 through Figure 34. Analysis results are shown for the third falloff period in each well, and all test periods yielded the same calculated permeability values for a given well.
Semilog Analysis
2
4
6
8
10
12
14
16
0.0001 0.001 0.01 0.1 1 10
Radial flow
Average reservoir pressure = 1450.8 psiPermeability = 68.28 mdWBS coefficient = 0.02299 bbl/psiSkin factor = -1.173 Distance to boundary = 549 ft
Adj
uste
d pr
essu
re c
hang
e, p
si
Radial equivalent adjusted time, hrBroFO3-A Figure 31: Semi-Log PTT analysis - Brokaw #5
Semilog Analysis
2
4
6
8
10
12
14
16
0.001 0.01 0.1 1 10
Radial flow
Average reservoir pressure = 1450.8 psiPermeability = 35.31 mdWBS coefficient = 0.02052 bbl/psiSkin factor = -0.8201 Distance to boundary = 400 ft
Adj
uste
d pr
essu
re c
hang
e, p
si
Radial equivalent adjusted time, hrFienFO3-A Figure 32: Semi-Log PTT analysis (post-sonication) - Fienhold #18
59
Semilog Analysis
2
4
6
8
10
12
14
0.001 0.01 0.1 1 10
Radial flow
Average reservoir pressure = 1910.6 psiPermeability = 38.94 mdWBS coefficient = 0.02456 bbl/psiSkin factor = -1.133 Distance to boundary = 272.3 ft
Adj
uste
d pr
essu
re c
hang
e, p
si
Radial equivalent adjusted time, hrGrimesFO3-A Figure 33: Semi-Log PTT analysis - Grimes #9
Semilog Analysis
0
2
4
6
8
10
12
14
16
18
0.0001 0.001 0.01 0.1 1 10
Radial flow
Average reservoir pressure = 1704.4 psiPermeability = 53.32 mdWBS coefficient = 0.03241 bbl/psiSkin factor = 2.662 Angle between boundaries = 100 degreeDistance to boundary = 85 ft
Adj
uste
d pr
essu
re c
hang
e, p
si
Radial equivalent adjusted time, hrWilsonFO3-A2 Figure 34: Semi-Log PTT analysis - L. Wilson #9
Both type-curve analysis and semi-log analysis in the L. Wilson #9 well required the use of a wedge reservoir as the outer boundary condition to achieve a good match of test data. This assumption should be discussed with field geologists to ensure it is a reasonable outer boundary model, or if an alternate outer boundary condition is more appropriate.
60
Non-Darcy Skin Damage Assessment Figure 35 through Figure 38 show plots of total skin versus flow rate for each test period in the four wells tested. From this analysis, we estimate a mechanical skin value (y-intercept) and non-darcy D-value (slope). The plots are scaled similarly to allow easy comparison. The Fienhold #18 Well is the only one showing both pre-sonication and post-sonication test results, as it was the only well treated.
Q vs S Plot for Pontiac - Mt Simon Field - Well: Brokaw #5
1.05
0.48
-1.17
y = 0.0008x - 3.3275R2 = 0.8957
-3.00
0.00
3.00
0 1,000 2,000 3,000 4,000 5,000 6,000 7,000
Flow Rate(MScf/D)
Skin
Fac
tor
(dim
ensi
onle
ss)
Falloff SkinLinear (Falloff Skin)
Figure 35: Rate vs Total Skin from MRPTT in Brokaw #5
-1.7-1.5
-1.15
-0.55-0.34
-0.82
y = 0.0008x - 2.4669R2 = 0.9956
y = 0.0003x - 2.4483R2 = 0.9759
-3.00
0.00
3.00
0 1,000 2,000 3,000 4,000 5,000 6,000 7,000
Flow Rate(MScf/D)
Ski
n Fa
ctor
(dim
ensi
onle
ss)
Pre-Sonication
Post-Sonication
Linear (Post-Sonication)
Linear (Pre-Sonication)
Figure 36: Rate vs Total Skin from MRPTT in Fienhold #18
61
Q vs S Plot for Pontiac - Mt Simon Field - Well Grimes #9
-1.61
-1.04y = -0.0038x + 5.1204
R2 = 1
-3.00
0.00
3.00
0 1,000 2,000 3,000 4,000 5,000 6,000 7,000
Flow Rate(MScf/D)
Skin
Fac
tor
(dim
ensi
onle
ss)
Falloff SkinLinear (Falloff Skin)
Figure 37: Rate vs Total Skin from MRPTT in Grimes #9
Q vs S Plot for Pontiac - Mt Simon Field - Well L. Wilson #9
Figure 38: Rate vs Total Skin from MRPTT in L. Wilson #9
It is obvious that the non-darcy damage analysis in the Grimes #9 and L. Wilson #9 wells is contrary to theory (i.e., the slope of the rate versus total skin plot is negative). This is may be a manifestation of the “experimental error” being too large for the small variation in test rates (i.e., the non-darcy damage coefficient in these two wells may be negligible, and the variation of skin with rate could be within experimental error). However, the n-values derived from the backpressure plots from these two wells suggest otherwise. The n-value for the Grimes #9 well is approximately 0.5, which is indicative of entirely turbulent flow, and the n-value in the L. Wilson #9 is approximately 1.0, which is indicative of entirely laminar flow. Larger variation of test rates in subsequent tests will help resolve this issue in these wells.
62
Several things are evident from the rate versus skin plot for the Fienhold #18 well. First, the non-Darcy damage increased slightly, as evidenced by the increase in the slope of the post-sonication line. This is consistent with the results of the backpressure testing, which showed a slight decline in the n-value, which qualitatively suggests an increase in the non-darcy damage. Second, there was no appreciable change in the mechanical damage as a result of the sonication treatment. The mechanical damage prior to stimulation was about - 2.5, which is indicative of a somewhat stimulated state. As such, there was relatively little to be gained from a stimulation aimed at a reduction in the mechanical damage, and the well was probably not the best candidate for a sonication treatment.
63
Appendix D Field Test A Gamma Ray and Neutron Logs
Figure 39: Pre-Sonication Gamma Ray/Neutron Log
64
Figure 40: Post-Sonication Gamma Ray/Neutron Log
65
APPENDIX E
Analysis of Multi-Rate Pressure Transient Test Data From NICOR GAS’s Wilson #9 Mt Simon Gas Storage Well
Located in McLean County, IL
prepared for
NICOR GAS Naperville, Illinois
Kenneth G. Brown Principle Consultant – Gas Storage Joseph H. Frantz Operations Manager, Consulting Services, Eastern US
December 2004
Data and Consulting Services
66
EXECUTIVE SUMMARY Purpose The purpose of this report is to document the results of a multi-rate pressure transient testing (MRPTT) conducted in L. Wilson #9, located NICOR GAS’ Lake Bloomington Field, McLean County, IL. The L Wilson #9 well is completed in the Mt Simon reservoir was stimulated via sonication in August 2004. Conclusions Results of the pre- and post sonication multi-rate pressure transient test analysis (MRPTTA) from the Wilson #9 well indicate that some improvement was realized after sonication. Although there is some room for subjectivity concerning the exact magnitude of mechanical skin and the non-darcy damage coefficient, results indicate that the total skin in this well was reduced from around +2.5 to about -1.0 at test rates between 1,500 MScf/D and 3,000 MScf/D. The non-darcy damage coefficient is negligible in the pre-sonication testing and small in the post-sonication analyses. This improvement is presumed to be the result of sonication, since NICOR GAS has not indicated that any other well work was performed between pre- and post-sonication testing. If other well work was performed after the pre-sonication test and before the post-sonication MRPTT, the improvement may be partially or totally attributable to such work rather than sonication. Recommendations Based on our analyses of the MRPTT data from the L. Wilson #9 wells, we recommend the following:
1. Future MRPTT’s should be run at three significantly different flow rates during the test sequence, to ensure sufficient resolution on the rate versus skin plot to successfully distinguish between mechanical damage and non-darcy damage.
2. During Future MRPTT’s, the surface pressures should recorded during the test.
Of particular importance are the stabilized flowing pressures (and the corresponding instantaneous flow rates) just before shutting in the wells, which allow for construction of a calibrated NODAL analysis model that could be used for predictive purposes.
3. Another MRPTT should be run in the Wilson #9 wells in about 1 year to
determine if any additional improvement/cleanup has occurred.
67
BACKGROUND Two of NICOR GAS’ Mt Simon gas storage wells, Fienhold #18 and L. Wilson #9, have been treated via sonication in recent years. Results of pre- and post-sonication MRPTT analysis in the Fienhold #18 well were summarized in a previous report by Schlumberger Data and Consulting Services (December 2003). In short, little (if any) improvement was realized as a result of the sonication stimulation treatment in the Fienhold #18 well. However, the Fienhold #18 well had a mechanical skin of –2.45 prior to the sonication treatment, and therefore was probably a poor candidate for a treatment aimed at reduction of mechanical skin damage. The focus of this report is to determine if any improvement in performance was realized from the sonication treatment in the L. Wilson #9 Well. A pre-sonication MRPTT was performed in the Wilson #9 well in November 2003, the well was stimulated by via sonication in August 2004, and post-sonication testing was performed in November 2004. RESULTS Key input parameters used in the analysis of MRPTT data was supplied by NICOR GAS and are as follows: Net Pay = 97 ft Porosity = 10 % Gas Saturation = 80% The ratio of vertical to horizontal permeability was not available, so it was assumed to be approximately 0.10. A comparison of pre-sonication and post-sonication backpressure test (BPT) analysis results are shown in Table 13 and MRPTT analysis results are summarized in Table 14.
Table 13: Comparison of pre-sonication and post-sonication BPT analysis results
Output
Well CMscf/D n
AOF @Pmax=1635psi
(MMScf/D)L. Wilson #9 - Pre-Sonication 0.0413 1.00 110 L. Wilson #9 - Post-Sonication 0.0730 0.98 141
Table 14: Comparison of pre-sonication and post-sonication MRPTT analysis results
PTT Results
Well Permeability(md)
Mechanical Skin
(dim'less)
Non-DarcyDamage
Coefficient(1/MScf/D)
OuterBoundaryConditions
L. Wilson #9-Pre-Sonication 53.3 +2.5 - Wedge ReservoirL. Wilson #9-Post-Sonication 53.3 -1.3 0.000147 Wedge Reservoir
68
DISCUSSION OF RESULTS Test Overviews Falloff test data was used for both the pre-stimulation and post-stimulation analyses, as the data quality was considerably better than the injectivity test data. Overviews of the bottom-hole pressure profiles during the post-stimulation test are shown in Figure 40 below. As is evident from this plot, most of the injection/falloff profiles look reasonably good. The well evidences changing rates during injection periods as well as obvious interference effects during the third falloff period (since the pressure increases late in the falloff period).
1685
1690
1695
1700
1705
0 12 24 36 48 60 72Hrs
BHP
(psi
g)
Figure 41: Bottom hole pressure during post-sonication test in L. Wilson #9
Backpressure Tests Backpressure plots showing both the pre-sonication and post-sonication tests in Wilson #9 well are shown in Figure 41 below. As evidenced from the L. Wilson #9 backpressure plots, there was some improvement in performance after the sonication treatment.
Figure 42: L. Wilson #9 backpressure plots for pre- and post-somication tests
69
Pressure Transient Tests Type curve analysis results of post-stimulation falloff test data in Wilson #9 are shown in Figure 42 through Figure 44. Nearby offset wells were shut-in during testing of individual wells, but distant offset injection still occurred. Consequently, there is some deviation between modeled and actual pressures late in the test periods. This deviation between the model and actual data is expected, and no effort was made to match late-time data. Details of all PTT analyses are included in Appendix I.
Superposition type curveRadial flow, Single porosity, Wedge reservoir: Varying CDe2s
Average reservoir pressure = 1686.1 psiPermeability = 53.32 mdWBS coefficient = 0.03241 bbl/psiSkin factor = -1.1 Angle between boundaries = 100 degreeDistance to boundary = 85 ft
Dim
ensi
onle
ss p
ress
ure
Dimensionless timeKGB_WilsonFO3 Figure 45: Type curve analysis plot of falloff period #3 in L. Wilson #9 Well
MRPTT analysis in the L. Wilson #9 well required the use of a wedge reservoir as the outer boundary condition to achieve a good match of test data. As mentioned in the last report, this assumption should be discussed with field geologists to ensure it is a reasonable outer boundary model, or if an alternate outer boundary condition is more appropriate. Non-Darcy Skin Damage Assessment Figure 45 shows a plot of total skin versus flow rate for the pre-sonication and post-sonication tests in the L Wilson #9. From this analysis, we estimate a mechanical skin value (y-intercept) and non-darcy D-value (slope).
2.04
2.562.66
-0.90-1.00-1.10
y = 0.000147x - 1.328543R2 = 0.998848
-3.00
0.00
3.00
0 2,000 4,000 6,000
Flow Rate(MScf/D)
Ski
n Fa
ctor
(dim
ensi
onle
ss)
2003 Pre-Sonication Falloff Skin
2004 Post-Sonication Falloff
Linear (2004 Post-Sonication Falloff)
y = 0.0 x + 2.5
Figure 46: Rate vs Total Skin from MRPTT in L Wilson #9
71
Figure 45 suggests that the pre-stimulation non-darcy damage coefficient was negligible. This is consistent with a pre-stimulation n value of 1.0. Figure 6 also suggests that the post-stimulation non-darcy damage coefficient is small. This is consistent with a post-stimulation n value of 0.98.