43
Improved predicFon of the verFcal profile of atmospheric parFculate carbon: development and evaluaFon of WRF-CMAQ Annmarie G. Carlton

Improved predicFon of the verFcal profile ofatmospheric parFculate carbon: development
and evaluaFon of WRF-‐CMAQ
Annmarie G. Carlton
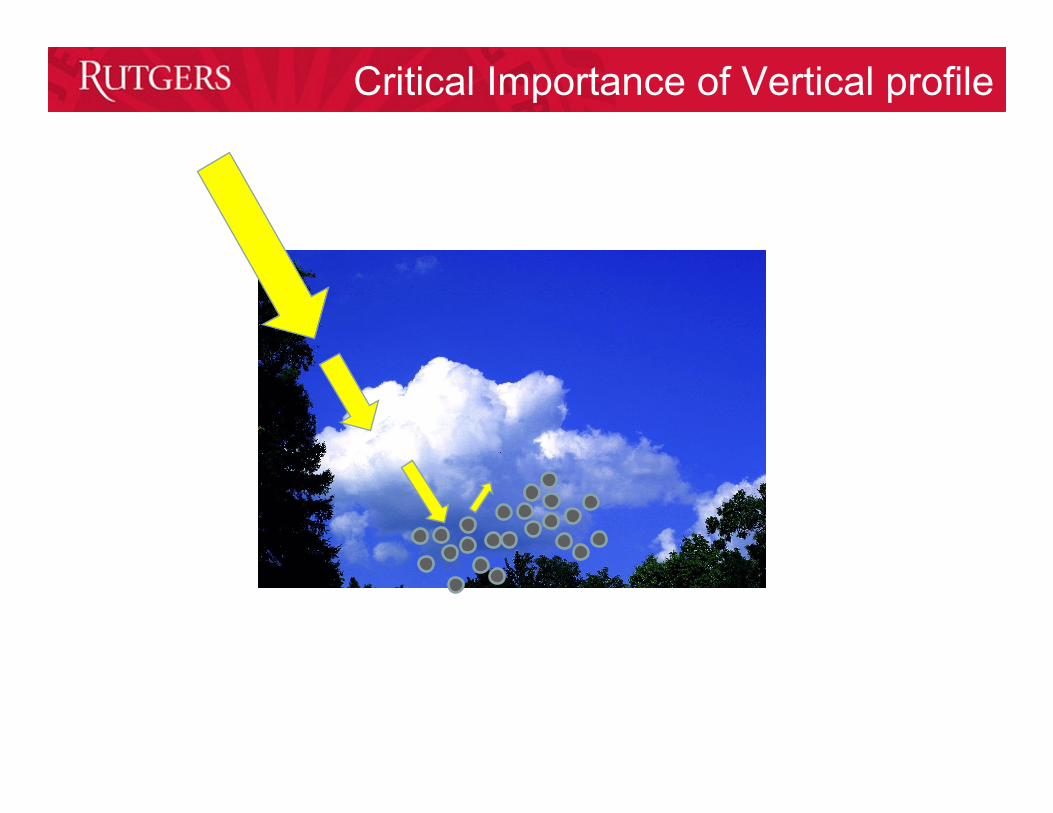
Critical Importance of Vertical profile

Critical Importance of Vertical profile
aerosols above clouds: diffuse backsca1er, less removal processes
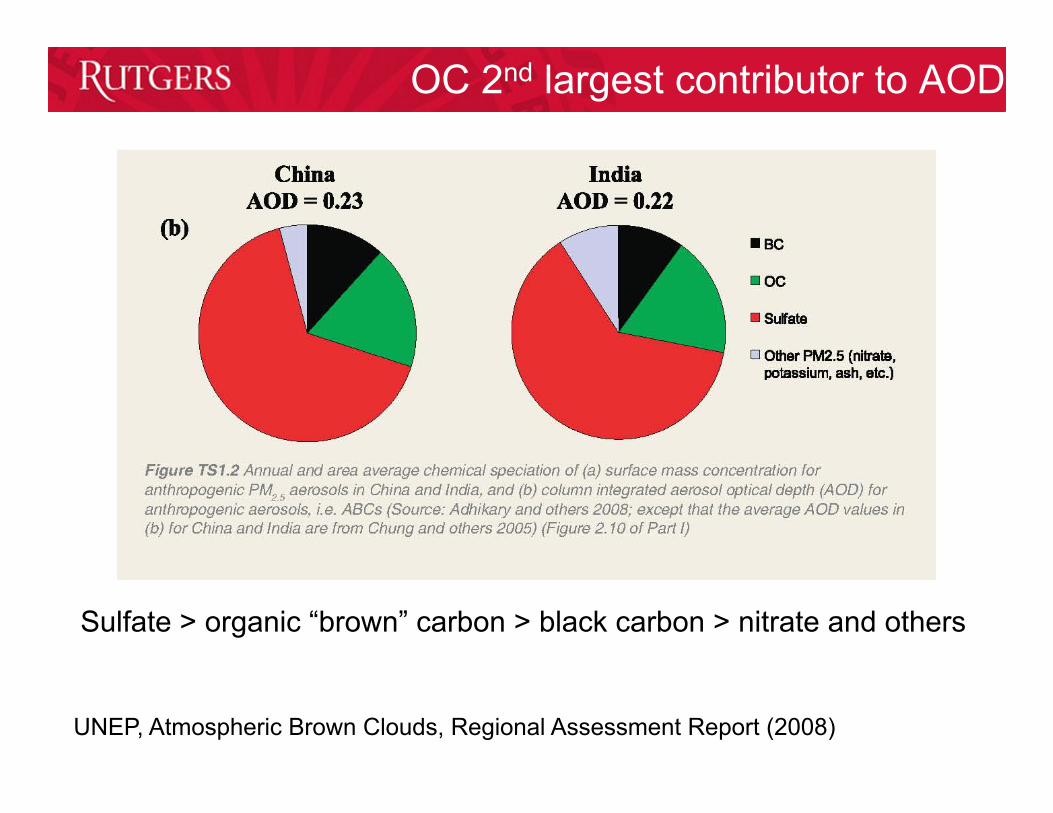
OC 2nd largest contributor to AOD
UNEP, Atmospheric Brown Clouds, Regional Assessment Report (2008)
Sulfate > organic “brown” carbon > black carbon > nitrate and others

BC Definition “Brownish” color of ABCs assumed to arise via absorption by BC particles.
Separation based on single wavelength measurements (adapted from Pöschl, 2003).
ambiguity and arbitrariness to the separation of “BC” from organic or “brown”
black dilutes to gray not brown
Black Carbon: colloquially means “soot”, highly light-‐absorbing carbon
Elemental Carbon: chemically refers
to thermally-‐refractory pure carbon with a graphi@c structure
In CMAQ, Black Carbon contains
elemental carbon and organic carbon, both absorbs and sca1ers UV and visible radia@on

ACE-‐ASIA: FIRST OC AEROSOL MEASUREMENTS IN THE FREE TROPOSPHERE (Spring 2001)
Mean Observations Mean Simulation Observations +
[Mader et al., 2002] [Huebert et al., 2003] [Maria et al., 2003]
Scavenging Emissions and Scavenging
[Heald et al., 2005]
Secondary Production Vertical profile of OC is more like SO4 (produced in clouds) than Elemental Carbon (surface emissions)

Reactive organic emissions
Water evaporation
aqSOA
oxidized organics
WSOC
water evapora,on
dissolu,on
water-‐soluble organics (WSOC)
AqSOA
Semi-‐vola,le organic compounds dissolu,on low-‐vola,lity
organic compounds
GasSOA
VOCs
Primary organic aerosol (POA)
condensa,on
Cloud droplet or aqueous aerosol
Aqueous Chemistry
Deliquesced aerosol
Adapted from Ervens et al., 2011
Cloud droplets
incr
easi
ng R
H
Aerosol aqSOA
Cloud aqSOA Convec@ve mixing in clouds will affect the ver@cal profile of par@culate carbon, enhancing aloK mass concentra@ons. AqSOA has higher O:C ra@os than gasSOA.
Reactive organic emissions
Water evaporation
aqSOA
oxidized organics
WSOC
water evapora,on
dissolu,on
water-‐soluble organics (WSOC)
AqSOA
Semi-‐vola,le organic compounds dissolu,on low-‐vola,lity
organic compounds
GasSOA
VOCs
Primary organic aerosol (POA)
condensa,on
Cloud droplet or aqueous aerosol
Aqueous Chemistry
Deliquesced aerosol
Adapted from Ervens et al., 2011
Cloud droplets
incr
easi
ng R
H
Aerosol aqSOA
Cloud aqSOA
Including aqSOA 1.8
0.5
1.5
1.2
0.8
Convec@ve mixing in clouds will affect the ver@cal profile of par@culate carbon, enhancing aloK mass concentra@ons. AqSOA has higher O:C ra@os than gasSOA.
Aqueous lab experiments with methylglyoxal form low vola@lity brown material. Figure courtesy of V.F. McNeill, Columbia
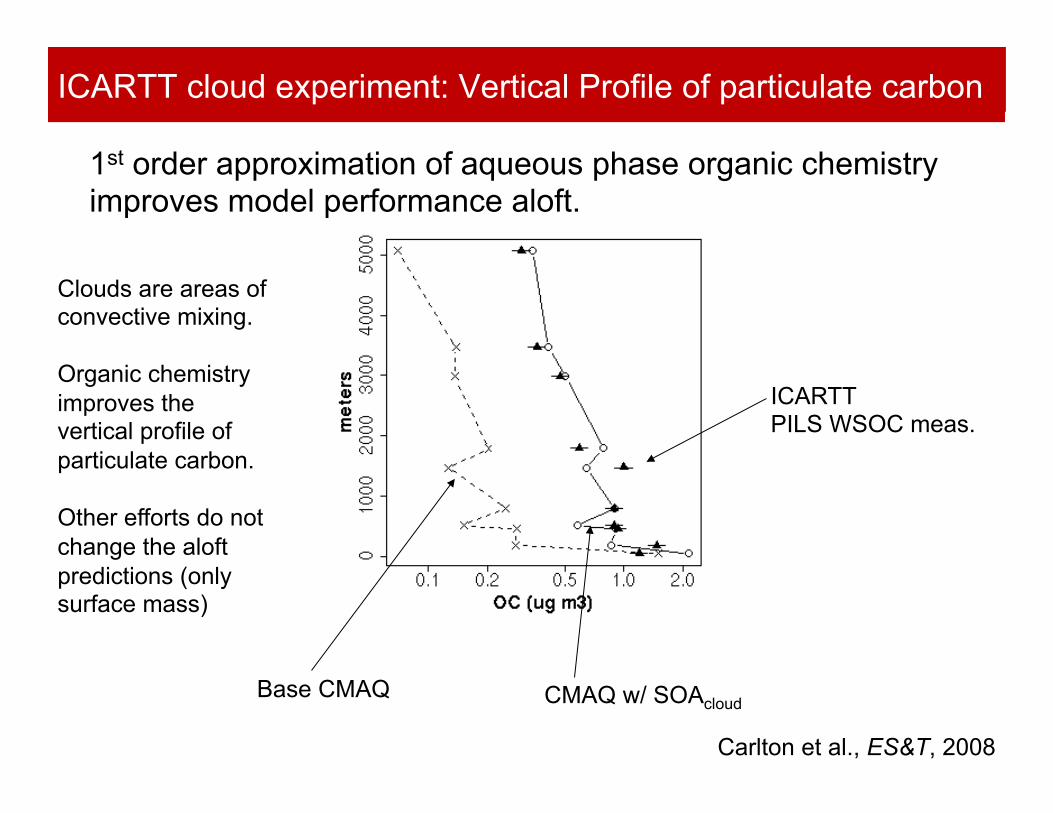
ICARTT cloud experiment: Vertical Profile of particulate carbon
Base CMAQ CMAQ w/ SOAcloud
ICARTT PILS WSOC meas.
Clouds are areas of convective mixing. Organic chemistry improves the vertical profile of particulate carbon. Other efforts do not change the aloft predictions (only surface mass)
Carlton et al., ES&T, 2008
1st order approximation of aqueous phase organic chemistry improves model performance aloft.

What we proposed
1.) Develop condensed phase mechanisms suitable for CTMs that produce op@cally ac@ve aerosol aloP 2.) Iden@fy condi@ons, precursors and sources that have the largest impact on brown carbon predic@ons 3.) Incorporate new mechanism(s) into WRF-‐CMAQ and evaluate impacts.

NOx NOx
NOx
SO2 (ads) SO2(g)
H2O2(g)
HNO3 (ads)
HNO3(g) NOx
H2O2 (ads) + SO4
ICE chemistry 1) par@@oning to cloud ice by SO2, H2O2, HNO3; 2) ice phase SO2 àSO4 chemistry; 3) explore the sensi@vity in aloK nitrate mass concentra@ons regarding debate over reversibility of HNO3 par@@oning
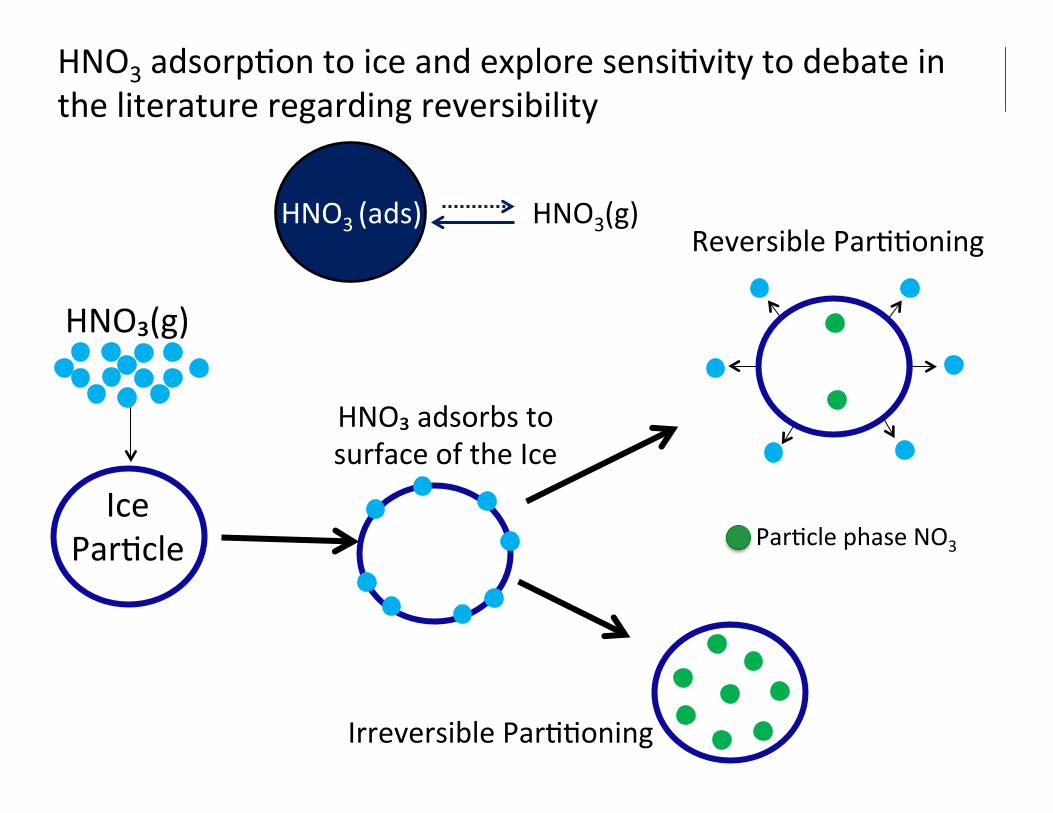
Ice Par@cle
HNO₃ adsorbs to surface of the Ice
Reversible Par@@oning
Irreversible Par@@oning
HNO₃(g)
HNO3 (ads) HNO3(g)
HNO3 adsorp@on to ice and explore sensi@vity to debate in the literature regarding reversibility
Par@cle phase NO3
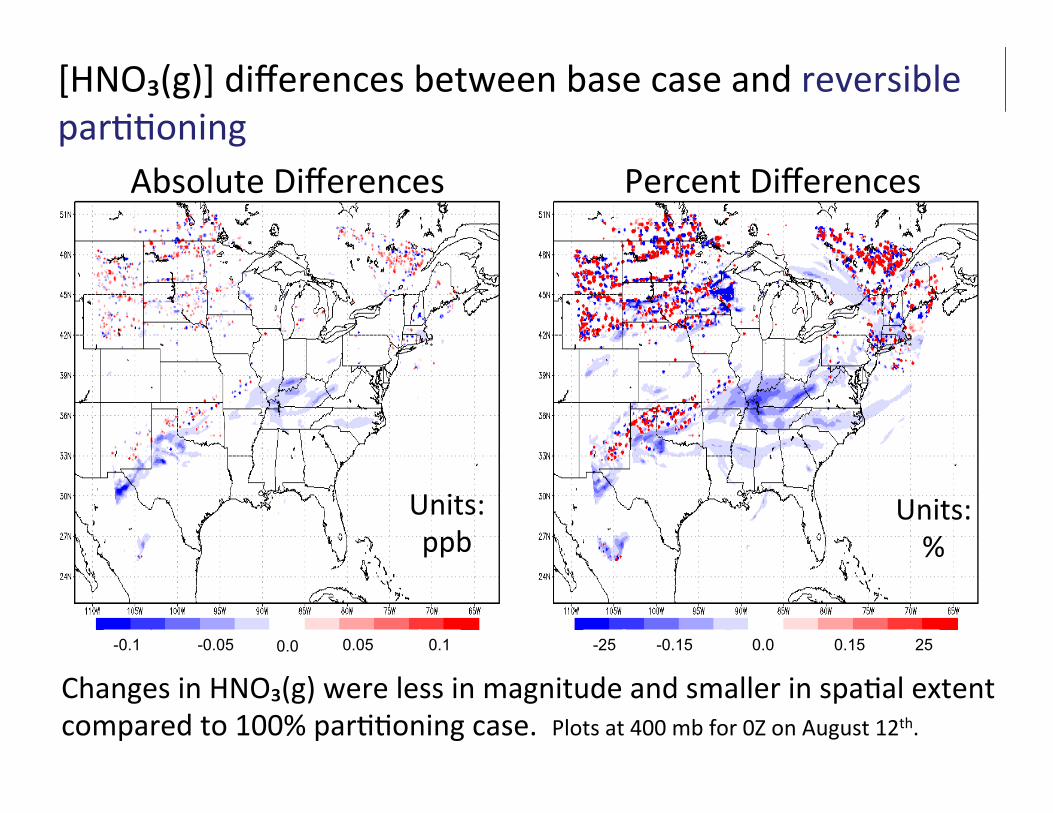
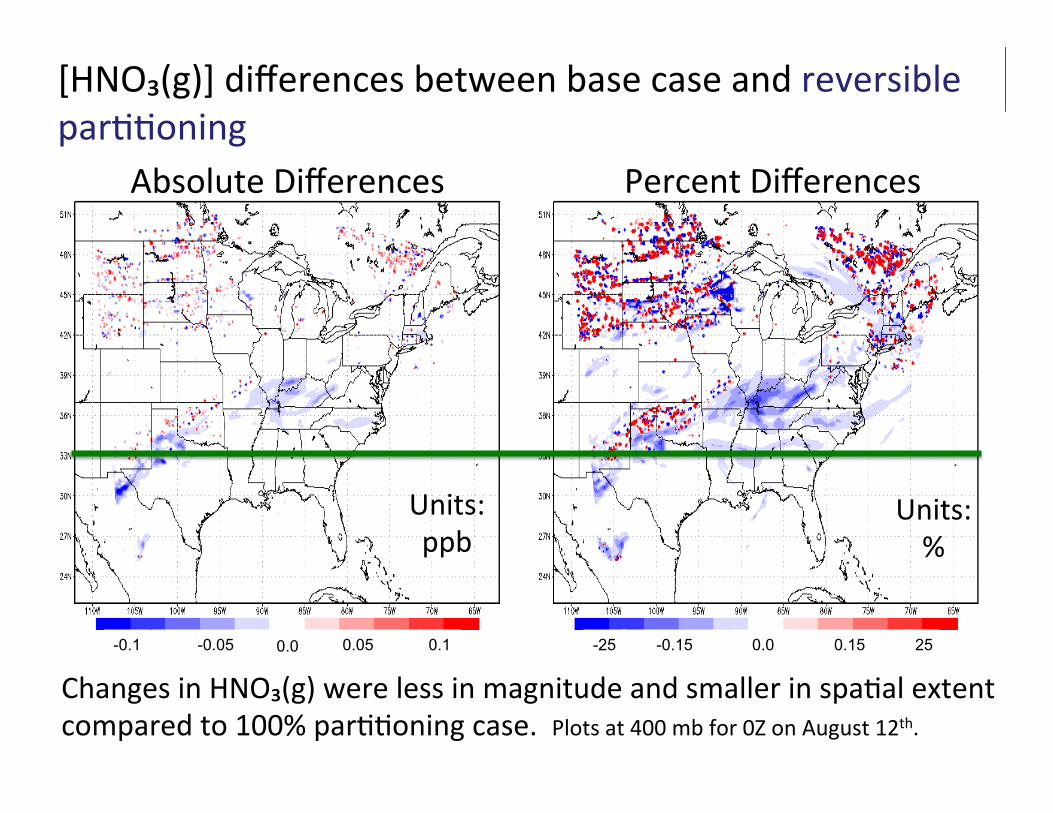
Changes in HNO₃(g) were less in magnitude and smaller in spa@al extent compared to 100% par@@oning case. Plots at 400 mb for 0Z on August 12th.
[HNO₃(g)] differences between base case and reversible par@@oning
Units: ppb
Units: %
Absolute Differences Percent Differences
-0.1 -0.05 0.1 0.05 0.0 -25 -0.15 25 0.15 0.0

Pressure (m
b)
Units: %
Percent Differences
Large changes in [HNO₃(g)] were seen from 300 mb to 650 mb for la@tude of 33°N at 10Z on August 23rd
[HNO₃(g)] differences between base case and 100% par@@oning
Units: ppb
Absolute Differences 100
200
300
400
500
600
700
800
900
1000
-0.1 -0.05 0.1 0.05 0.0 -25 -0.15 25 0.15 0.0

Difference in accumulation mode [NO3] when ice chemistry is included at 100 mb for 0Z on August 12th. Maximum differences > 0.10 µg m-³
Units: µg/m³
Units: µg/m³
Irreversible Partitioning Case Reversible Partitioning Case
Marmo et al., AE, (2013): The modified CMAQ subroutines are available for sharing!
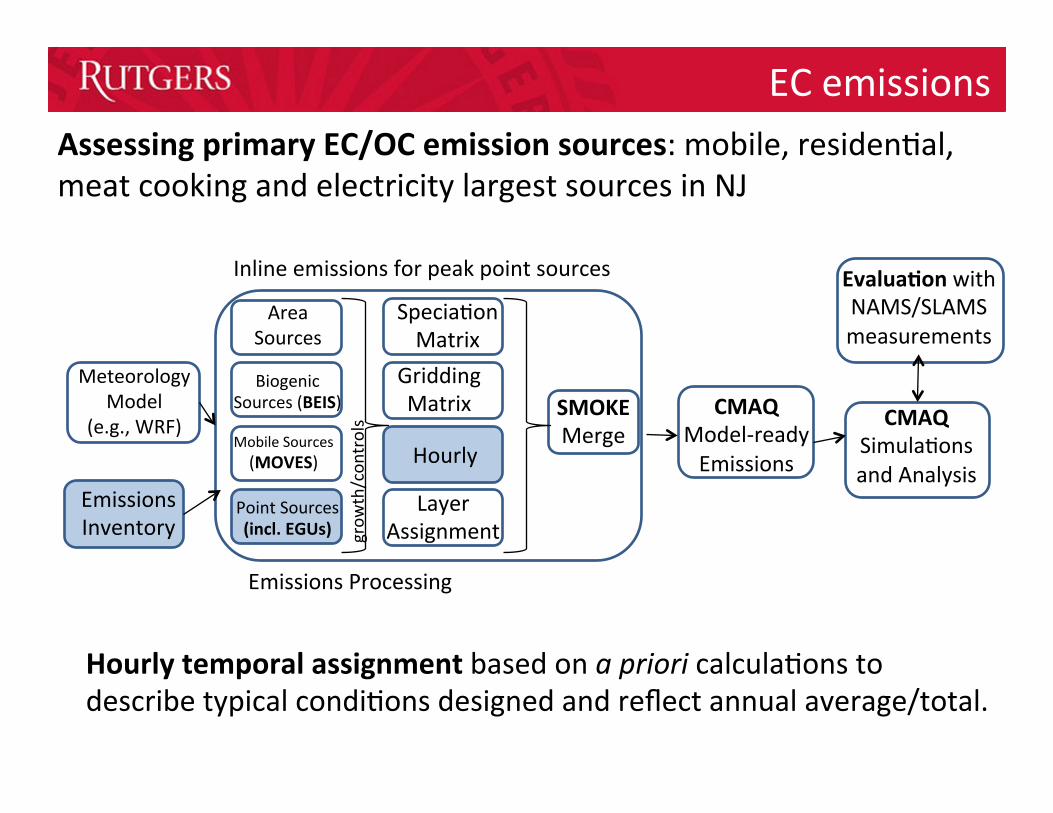
EC emissions
Inline emissions for peak point sources
Point&Sources!(incl.!EGUs)!
Emissions&Processing&
Biogenic&Sources&(BEIS)&
Area&Sources&
Mobile&Sources&(MOVES)&
Emissions&Inventory&
Specia<on&Matrix&
Gridding&Matrix&
Hourly&&
Layer&Assignment&
SMOKE&Merge&
CMAQ&ModelBready&Emissions&
grow
th/con
trols& CMAQ&
Simula<ons&and&Analysis&
Meteorology&Model&&
(e.g.,&WRF)&
Evalua:on&with&NAMS/SLAMS&measurements!
Assessing primary EC/OC emission sources: mobile, residen@al, meat cooking and electricity largest sources in NJ
Hourly temporal assignment based on a priori calcula@ons to describe typical condi@ons designed and reflect annual average/total.

NEI Annual PM
emissions (tons)
NOX CEM Annual
Heat Inputs (mmBTU)
Tons per mmBTU of
PM
Custom PM Emission Factor Calculation
Custom PM Emission
Factor (tons/mmBTU)
CEM Hourly Heat
Inputs (mmBTU)
Hourly PM Emissions
(tons)
Temporaliza@on of PM emissions
Actual measured emission data is not used for point sources with CEMs when “ORIS” ID number is not reported with annual NEI total.
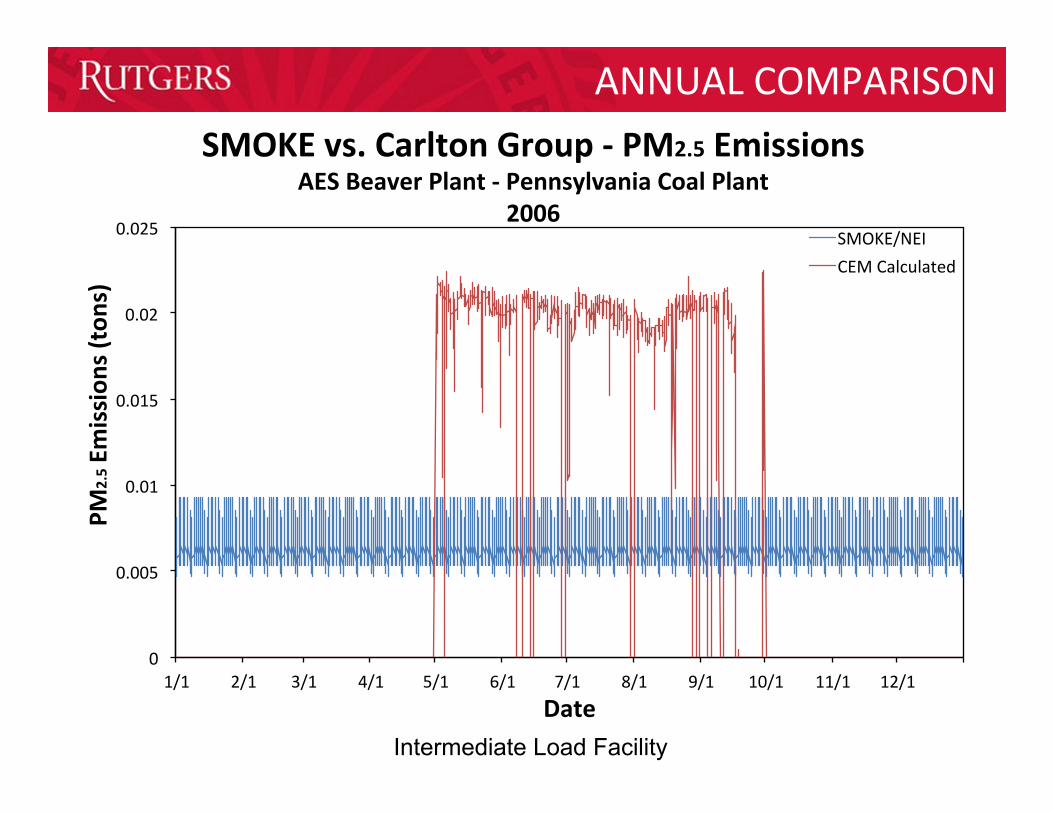
ANNUAL COMPARISON
0"
0.005"
0.01"
0.015"
0.02"
0.025"
1/1" 2/1" 3/1" 4/1" 5/1" 6/1" 7/1" 8/1" 9/1" 10/1" 11/1" 12/1"
!PM
2.5!Emission
s!(tons)!
Date!
SMOKE!vs.!Carlton!Group!=!PM2.5!Emissions!AES!Beaver!Plant!=!Pennsylvania!Coal!Plant!
2006!SMOKE/NEI"CEM"Calculated"
Intermediate Load Facility
19
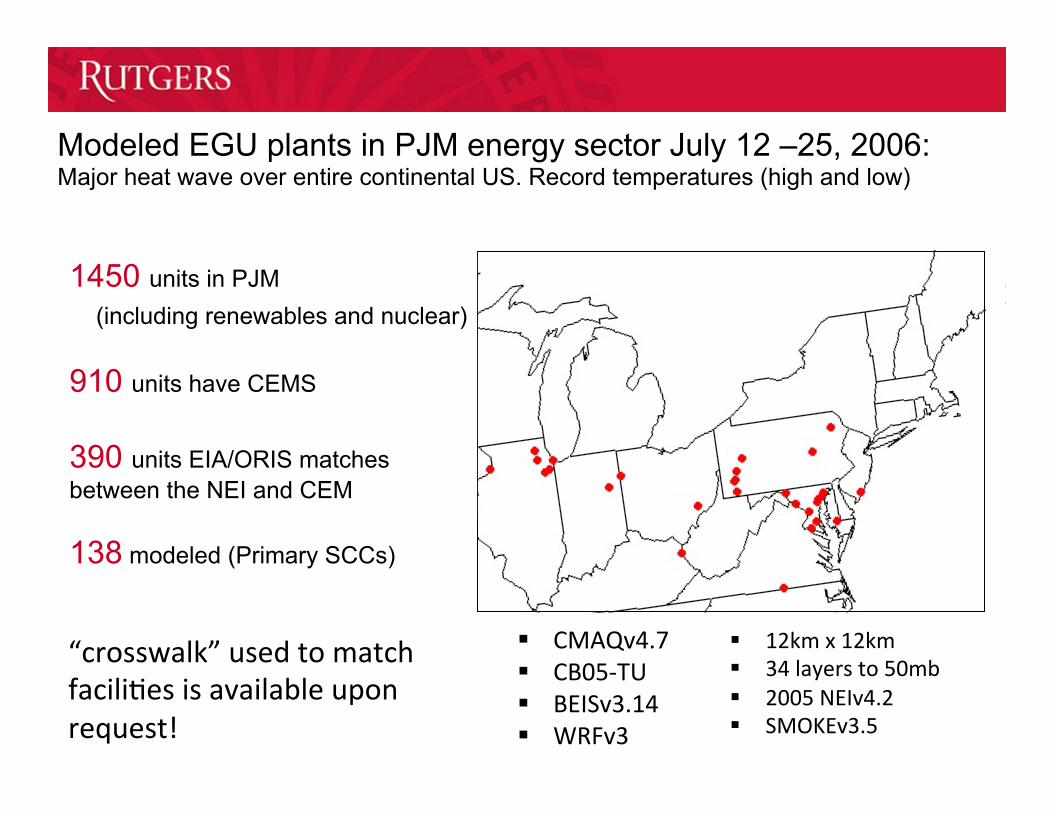
Modeled EGU plants in PJM energy sector July 12 –25, 2006: Major heat wave over entire continental US. Record temperatures (high and low)
1450 units in PJM (including renewables and nuclear)
910 units have CEMS
390 units EIA/ORIS matches between the NEI and CEM 138 modeled (Primary SCCs)
§ CMAQv4.7 § CB05-‐TU § BEISv3.14 § WRFv3
§ 12km x 12km § 34 layers to 50mb § 2005 NEIv4.2 § SMOKEv3.5
“crosswalk” used to match facili@es is available upon request!
Maximum 800mb Sulfate Percent Difference
Per
cent
Diff
eren
ce
50
30
20
10
0
40
Maximum Surface Sulfate Percent Difference
Per
cent
Diff
eren
ce
50
30
20
10
0
40
Maximum Surface PM2.5 Percent Difference
Per
cent
Diff
eren
ce
50
30
20
10
0
40
Maximum Surface EC Percent Difference
Per
cent
Diff
eren
ce
50
30
20
10
0
40
a)
b)
c)
Maximum 800mb PM2.5 Percent Difference
Per
cent
Diff
eren
ce
50
30
20
10
0
40
d)
e)
Maximum 800mb EC Percent Difference
Per
cent
Diff
eren
ce
50
30
20
10
0
40
f ) Maximum 800mb Sulfate Difference
µg/m
3
2.0
1.5
1.0
0.5
0.0
2.0
1.5
1.0
0.5
0.0
µg/m
3
Maximum Surface Sulfate Difference
Maximum Surface PM2.5 Difference 4.0
3.0
2.0
1.0
0.0
µg/m
3
a)
b)
Maximum Surface EC Difference 2.0
1.5
1.0
0.5
0.0
µg/m
3
c)
Maximum 800mb PM2.5 Difference
µg/m
3
2.0
1.5
1.0
0.5
0.0
Maximum 800mb EC Difference
µg/m
3
0.2
0.15
0.1
0.05
0.0
d)
e)
f )
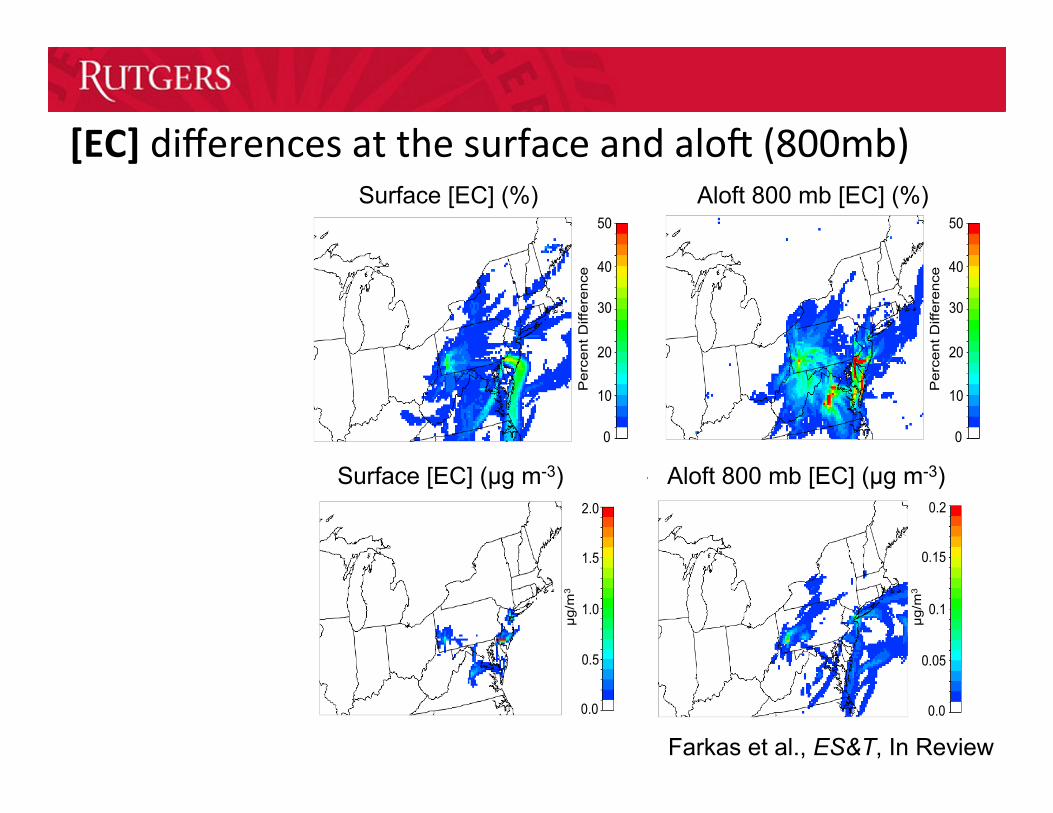
Farkas et al., ES&T, In Review
[EC] differences at the surface and aloK (800mb) Surface [EC] (%) Aloft 800 mb [EC] (%)
Surface [EC] (µg m-3) Aloft 800 mb [EC] (µg m-3)
Developing and implemen,ng more robust representa,on of organic aqueous chemistry
Iden@fy the most important water-‐soluble gas phase precursors and controlling factors for cloud-‐produced OA. Develop expanded and efficient new chemical mechanism Develop new solver technique – collabora@on with Kathleen Fahey and Bill Hutzell

Lab experiments verify
glyoxal + OH à “cloud SOA”
methylglyoxal + OH à “cloud SOA”
1st attempt at CTM implementation
Early Implementation of aqueous organic chemistry

Abundance WSOM poten,al MEK Glyoxal
Acetaldehyde Methylglyoxal Ace@c acid Ace@c acid
Formaldehyde Formaldehyde Methanol Acetaldehyde Acetone Acetone
Methylglyoxal MEK Glyoxal Methanol MVK MVK
Methacrolein Methacrolein
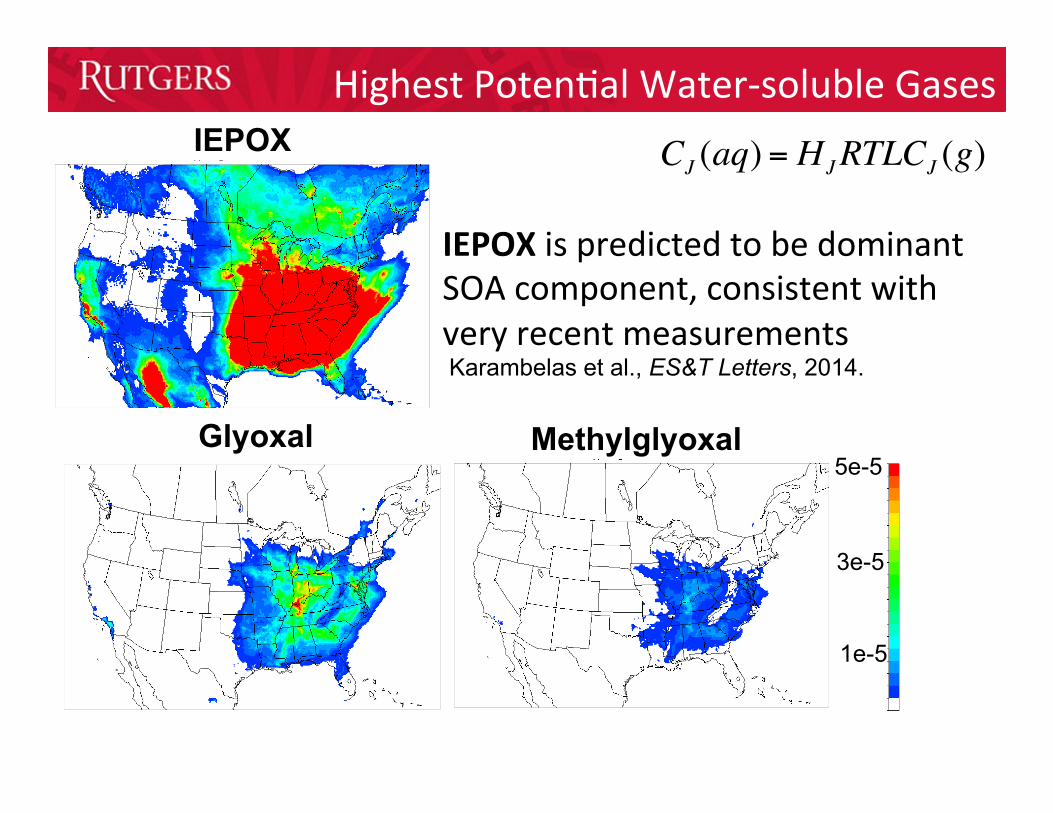
Highest Poten@al Water-‐soluble Gases
CJ (aq) = HJRTLCJ (g)
CJ (aq) = HJRTLCJ (g)
Glyoxal Methylglyoxal
IEPOX
5e-5
3e-5
1e-5
IEPOX is predicted to be dominant SOA component, consistent with very recent measurements Karambelas et al., ES&T Letters, 2014.
Highest Poten@al Water-‐soluble Gases
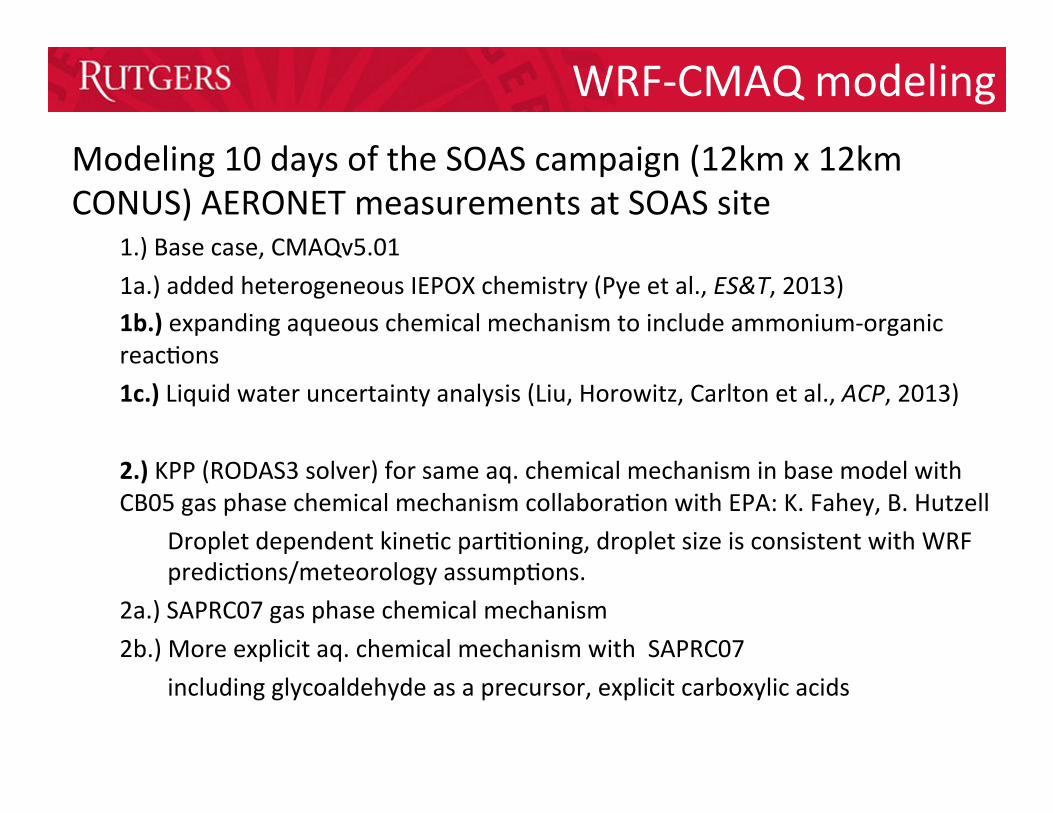
WRF-‐CMAQ modeling Modeling 10 days of the SOAS campaign (12km x 12km CONUS) AERONET measurements at SOAS site
1.) Base case, CMAQv5.01 1a.) added heterogeneous IEPOX chemistry (Pye et al., ES&T, 2013) 1b.) expanding aqueous chemical mechanism to include ammonium-‐organic reac@ons 1c.) Liquid water uncertainty analysis (Liu, Horowitz, Carlton et al., ACP, 2013)
2.) KPP (RODAS3 solver) for same aq. chemical mechanism in base model with CB05 gas phase chemical mechanism collabora@on with EPA: K. Fahey, B. Hutzell
Droplet dependent kine@c par@@oning, droplet size is consistent with WRF predic@ons/meteorology assump@ons.
2a.) SAPRC07 gas phase chemical mechanism 2b.) More explicit aq. chemical mechanism with SAPRC07
including glycoaldehyde as a precursor, explicit carboxylic acids
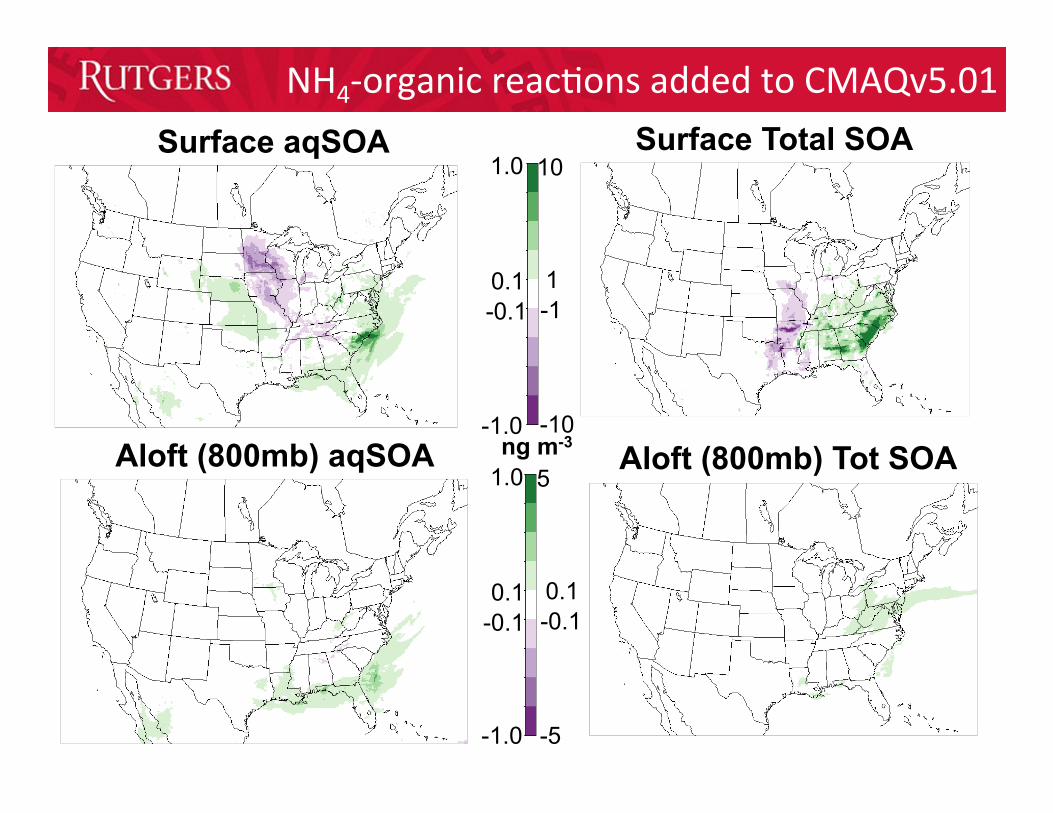
NH4-‐organic reac@ons added to CMAQv5.01 Surface aqSOA
1.0
-1.0
0.1 -0.1
Surface Total SOA 10
-10
1 -1
Aloft (800mb) aqSOA 1.0
-1.0
0.1 -0.1
5
-5
0.1 -0.1
ng m-3 Aloft (800mb) Tot SOA

Liquid water content (+40%)
Surface aqSOA
0.1
0.3
-0.1
ng m-3 -0.3
He, Liu, Horowitz, Carlton et al., ACP, (2013) found that in a global model that for a given organic cloud chemical mechanism, liquid water content was the most sensi@ve parameter

Atmospheric aqueous phase chemistry is more complex than typical model mechanisms Current CMAQ aqueous chemistry module does not easily expanded
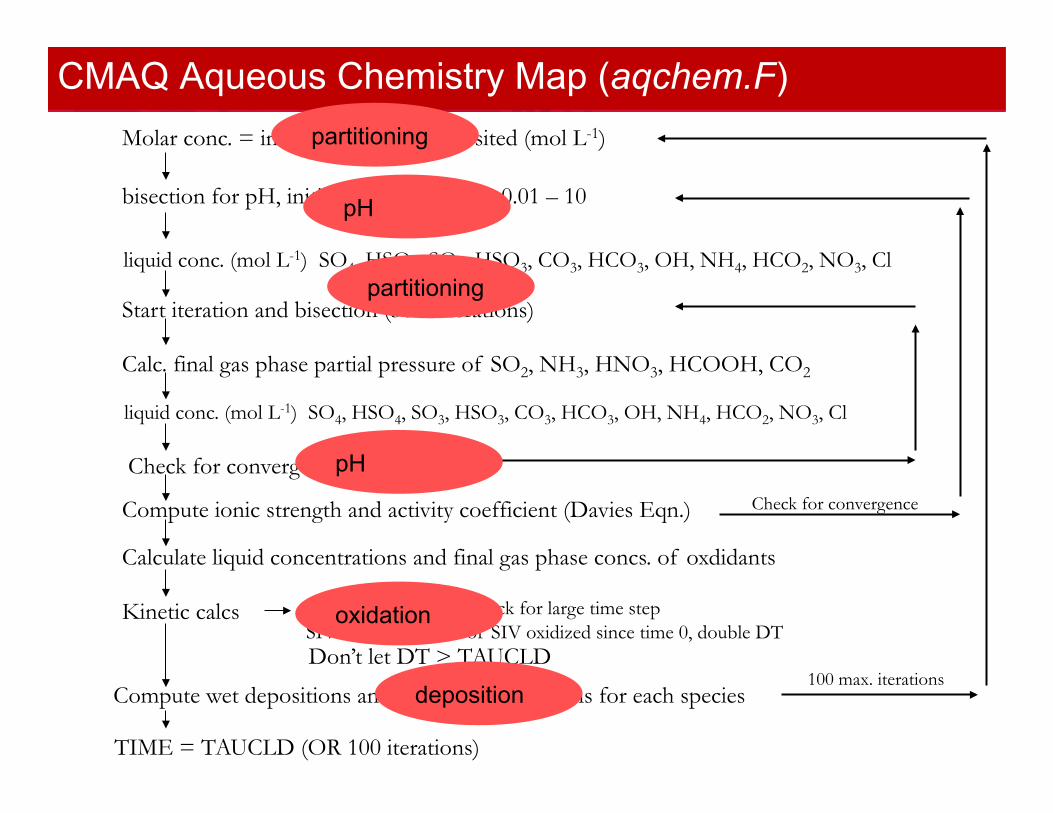
Forward Euler solver for oxida@on and bisec@on method for pH (note: linear convergence for bisec@on method) S@ffness induced by wide dynamic range of the system
RODAS3 solver in KPP is a good candidate for solving atmospheric aqueous chemistry (Sandu et al., 1997; Djouad et al., 2002)
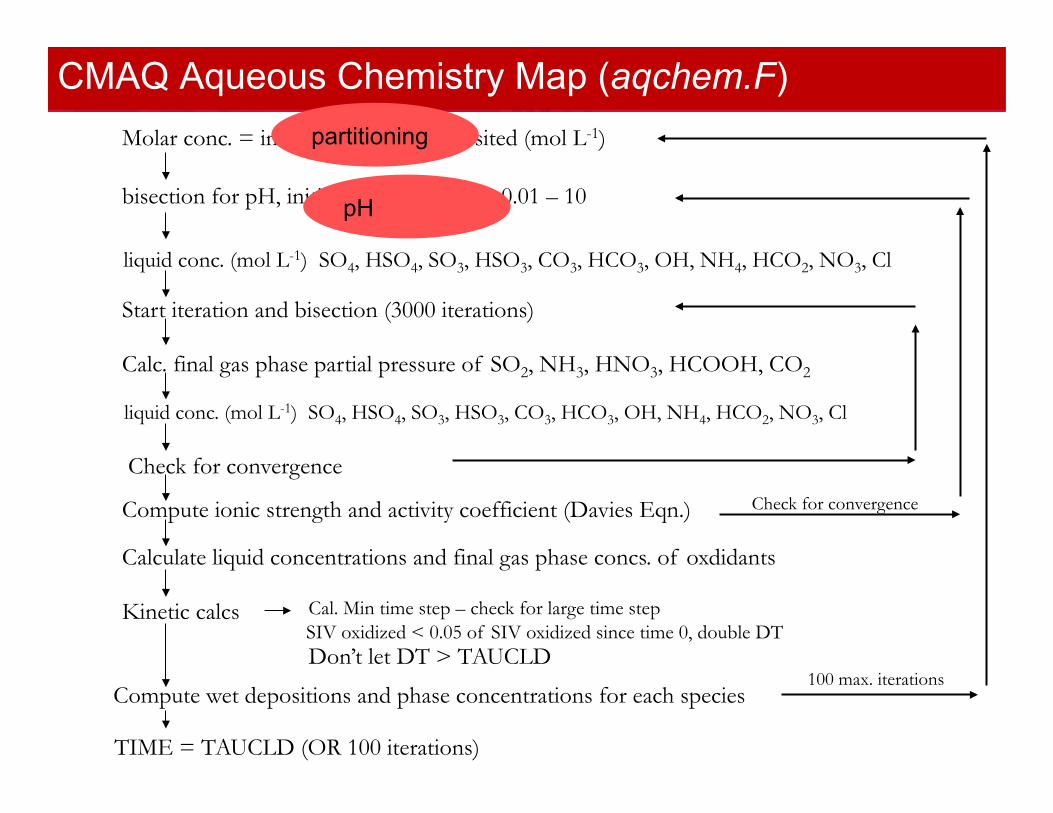
New Solver

CMAQ Aqueous Chemistry Map (aqchem.F) Molar conc. = initial amt. – amt. deposited (mol L-1)
bisection for pH, initial guesses between 0.01 – 10
liquid conc. (mol L-1) SO4, HSO4, SO3, HSO3, CO3, HCO3, OH, NH4, HCO2, NO3, Cl
Start iteration and bisection (3000 iterations)
Calc. final gas phase partial pressure of SO2, NH3, HNO3, HCOOH, CO2
liquid conc. (mol L-1) SO4, HSO4, SO3, HSO3, CO3, HCO3, OH, NH4, HCO2, NO3, Cl
Check for convergence
Compute ionic strength and activity coefficient (Davies Eqn.)
Calculate liquid concentrations and final gas phase concs. of oxdidants
Kinetic calcs Cal. Min time step – check for large time step SIV oxidized < 0.05 of SIV oxidized since time 0, double DT Don’t let DT > TAUCLD
Compute wet depositions and phase concentrations for each species
TIME = TAUCLD (OR 100 iterations)
Check for convergence
100 max. iterations
partitioning
CMAQ Aqueous Chemistry Map (aqchem.F) Molar conc. = initial amt. – amt. deposited (mol L-1)
bisection for pH, initial guesses between 0.01 – 10
liquid conc. (mol L-1) SO4, HSO4, SO3, HSO3, CO3, HCO3, OH, NH4, HCO2, NO3, Cl
Start iteration and bisection (3000 iterations)
Calc. final gas phase partial pressure of SO2, NH3, HNO3, HCOOH, CO2
liquid conc. (mol L-1) SO4, HSO4, SO3, HSO3, CO3, HCO3, OH, NH4, HCO2, NO3, Cl
Check for convergence
Compute ionic strength and activity coefficient (Davies Eqn.)
Calculate liquid concentrations and final gas phase concs. of oxdidants
Kinetic calcs Cal. Min time step – check for large time step SIV oxidized < 0.05 of SIV oxidized since time 0, double DT Don’t let DT > TAUCLD
Compute wet depositions and phase concentrations for each species
TIME = TAUCLD (OR 100 iterations)
Check for convergence
100 max. iterations
pH
partitioning
partitioning
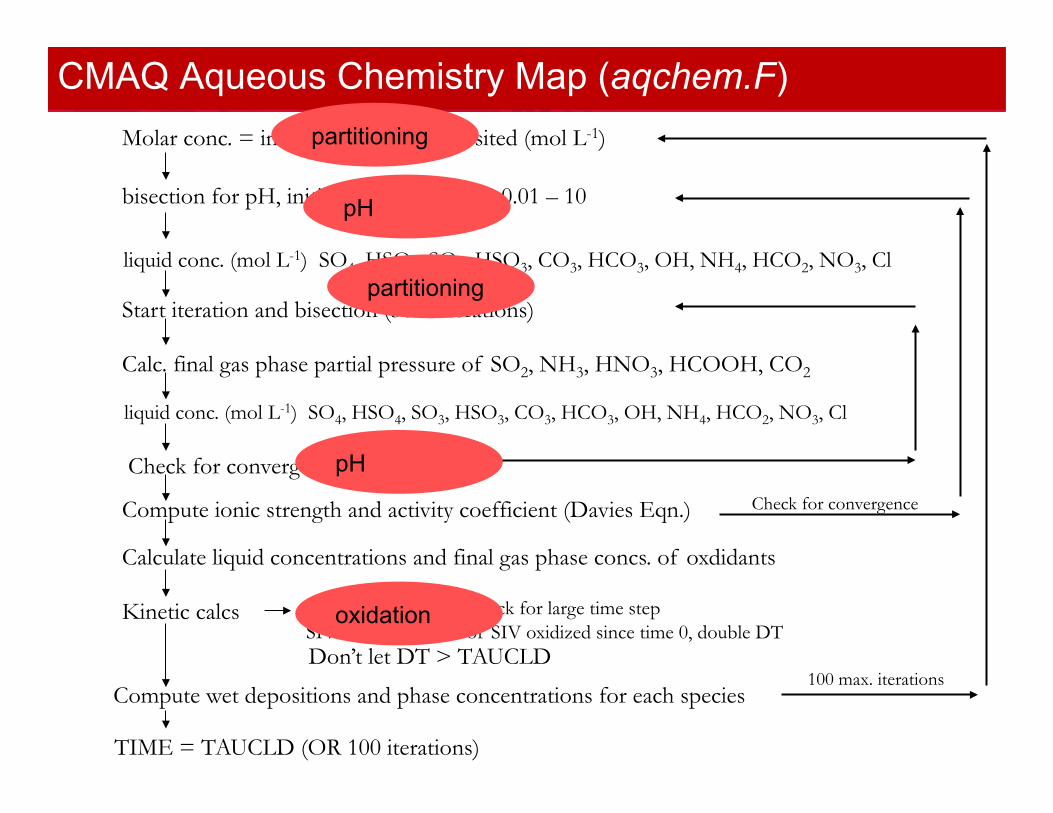
pH
CMAQ Aqueous Chemistry Map (aqchem.F) Molar conc. = initial amt. – amt. deposited (mol L-1)
bisection for pH, initial guesses between 0.01 – 10
liquid conc. (mol L-1) SO4, HSO4, SO3, HSO3, CO3, HCO3, OH, NH4, HCO2, NO3, Cl
Start iteration and bisection (3000 iterations)
Calc. final gas phase partial pressure of SO2, NH3, HNO3, HCOOH, CO2
liquid conc. (mol L-1) SO4, HSO4, SO3, HSO3, CO3, HCO3, OH, NH4, HCO2, NO3, Cl
Check for convergence
Compute ionic strength and activity coefficient (Davies Eqn.)
Calculate liquid concentrations and final gas phase concs. of oxdidants
Kinetic calcs Cal. Min time step – check for large time step SIV oxidized < 0.05 of SIV oxidized since time 0, double DT Don’t let DT > TAUCLD
Compute wet depositions and phase concentrations for each species
TIME = TAUCLD (OR 100 iterations)
Check for convergence
100 max. iterations
pH
partitioning
oxidation
partitioning
pH
CMAQ Aqueous Chemistry Map (aqchem.F) Molar conc. = initial amt. – amt. deposited (mol L-1)
bisection for pH, initial guesses between 0.01 – 10
liquid conc. (mol L-1) SO4, HSO4, SO3, HSO3, CO3, HCO3, OH, NH4, HCO2, NO3, Cl
Start iteration and bisection (3000 iterations)
Calc. final gas phase partial pressure of SO2, NH3, HNO3, HCOOH, CO2
liquid conc. (mol L-1) SO4, HSO4, SO3, HSO3, CO3, HCO3, OH, NH4, HCO2, NO3, Cl
Check for convergence
Compute ionic strength and activity coefficient (Davies Eqn.)
Calculate liquid concentrations and final gas phase concs. of oxdidants
Kinetic calcs Cal. Min time step – check for large time step SIV oxidized < 0.05 of SIV oxidized since time 0, double DT Don’t let DT > TAUCLD
Compute wet depositions and phase concentrations for each species
TIME = TAUCLD (OR 100 iterations)
Check for convergence
100 max. iterations
pH
partitioning
oxidation
deposition
partitioning
pH
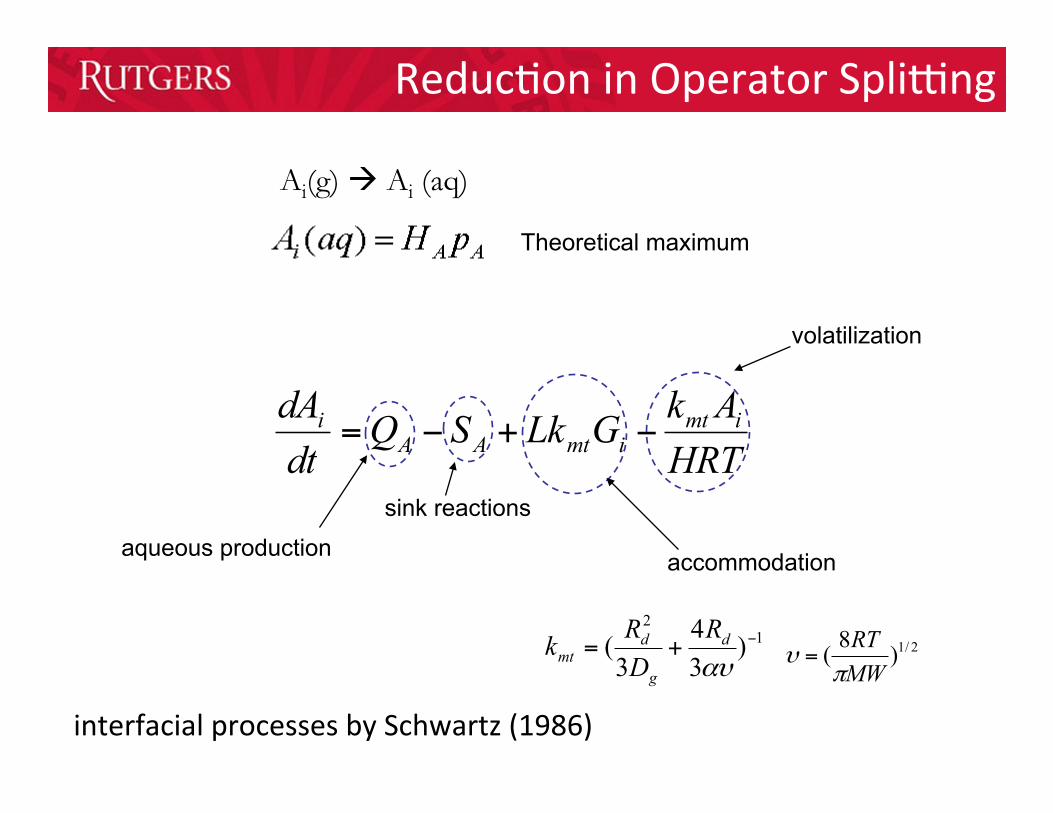
Reduc@on in Operator Splixng
HRTAkGLkSQ
dtdA imt
imtAAi −+−=
volatilization
aqueous production
sink reactions
accommodation
interfacial processes by Schwartz (1986)
12
)34
3( −+=
αυd
g
dmt
RDRk 2/1)8(
MWRT
πυ =
Theoretical maximum
Ai(g) à Ai (aq)
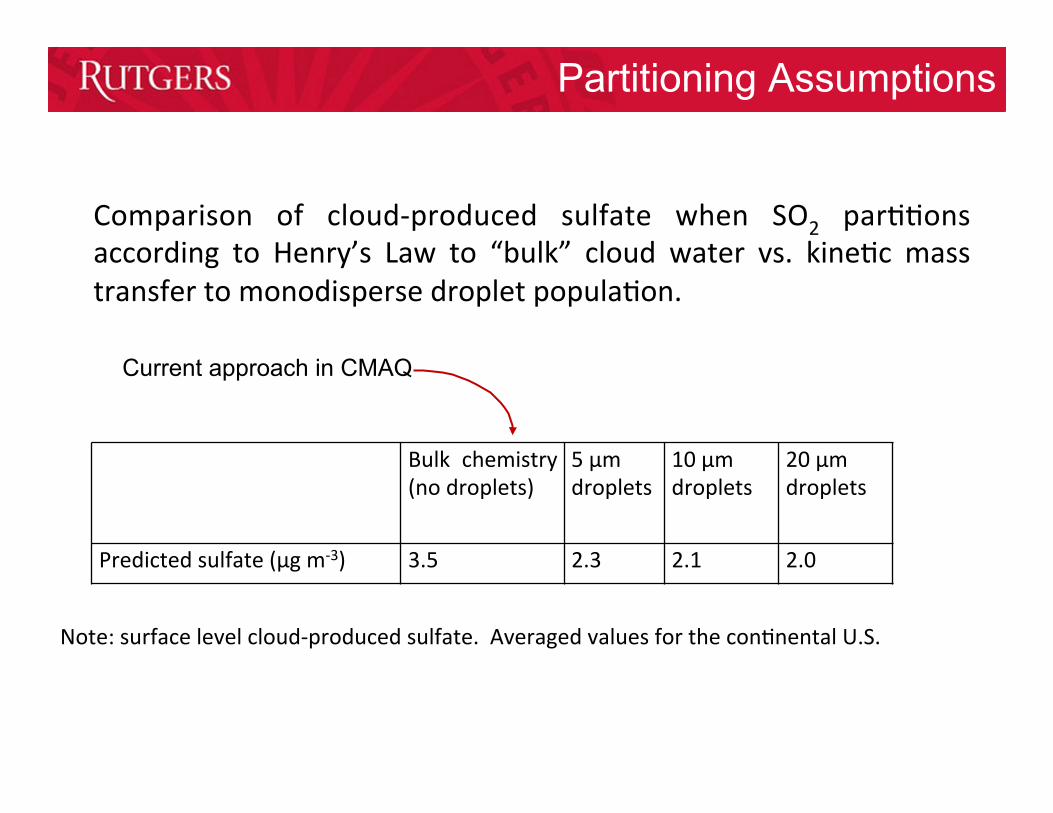
Bulk chemistry (no droplets)
5 µm droplets
10 µm droplets
20 µm droplets
Predicted sulfate (µg m-‐3) 3.5 2.3 2.1 2.0
Comparison of cloud-‐produced sulfate when SO2 par@@ons according to Henry’s Law to “bulk” cloud water vs. kine@c mass transfer to monodisperse droplet popula@on.
Note: surface level cloud-‐produced sulfate. Averaged values for the con@nental U.S.
Current approach in CMAQ
Partitioning Assumptions
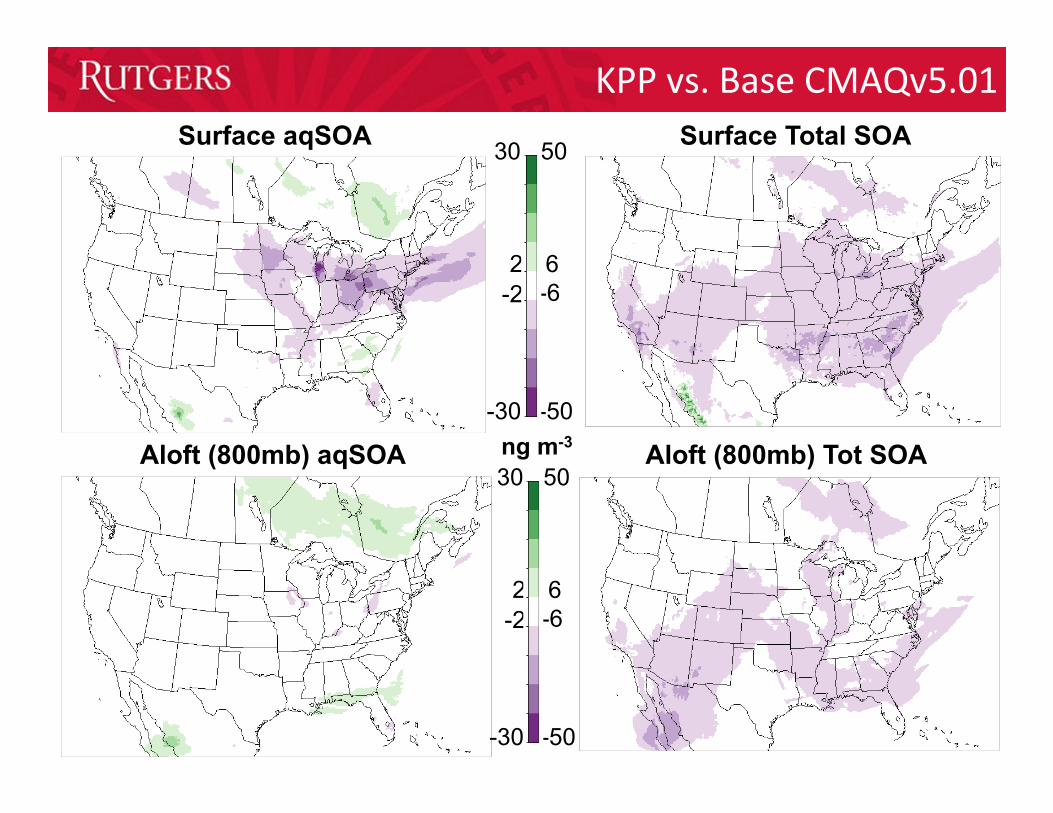
KPP vs. Base CMAQv5.01 Surface aqSOA 30
-30
2 -2
Surface Total SOA 50
-50
6 -6
Aloft (800mb) aqSOA ng m-3 Aloft (800mb) Tot SOA 30
-30
2 -2
50
-50
6 -6

Future Direc@ons (~9 months)
Con@nued refinement of EC/OC emissions from electricity sector
behind the meter, other peak demand genera@on
Con@nued refinement and valida@on of aqueous chemical mechanisms: SOAS data
in par@cular AERONET measurements assign refrac@ve proper@es inves@gate ver@cal profile sensi@vi@es
Acknowledgements EPA STAR Program
– John Dawson, Sherri Hunt, Wil Wilson
All the CMAQ and SMOKE model developers Group Members: Brian Marmo, Neha Sareen, Caroline Farkas, Michael Moeller, Neha Sareen, Eleana Li1le
Farkas
Moeller Sareen

CMAQ & ICARTT (summer 2004) Aug. 14, 2004 - clouds
Aug. 6 Ohio Valley power plants
Aug. 15 transit to FL via Atlanta
Aug. 11 – NYC plume
Aug. 3 – new england
ICARTT WSOC meas.
CMAQ OC prediction
WSOC measurements by Rodney Weber
OC µg m-3 OC µg m-3
OC µg m-3 OC µg m-3
met
ers
met
ers
met
ers
met
ers
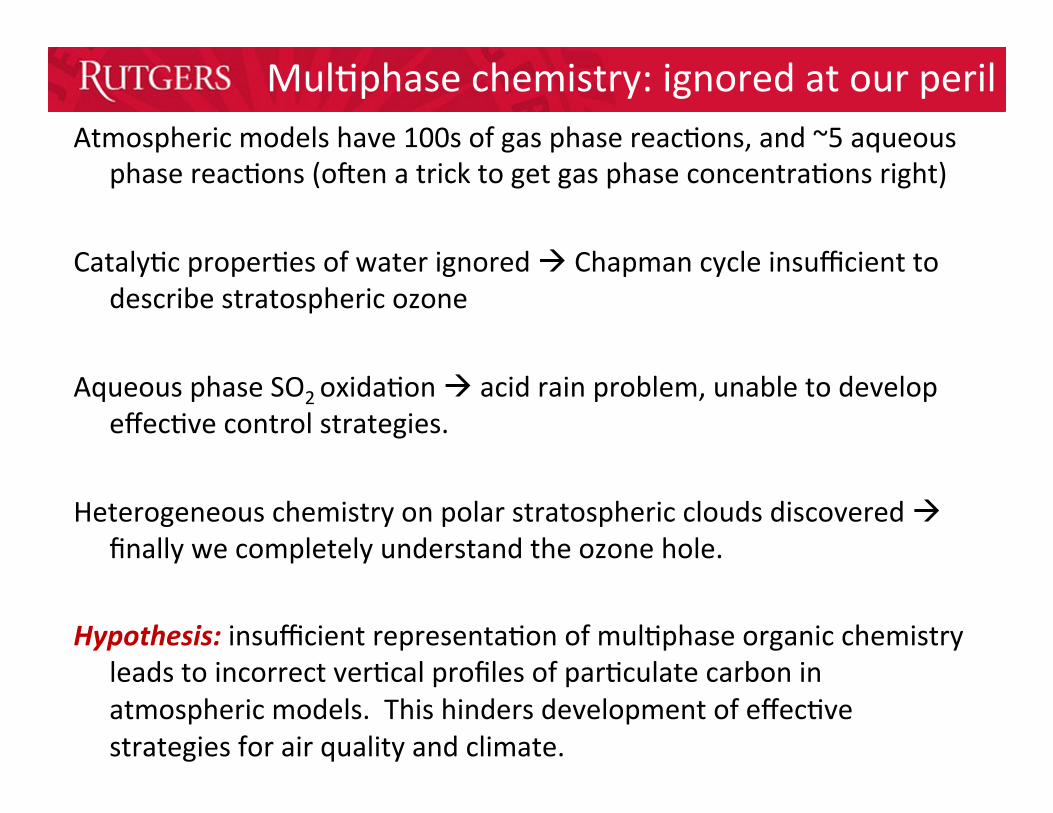
Mul@phase chemistry: ignored at our peril Atmospheric models have 100s of gas phase reac@ons, and ~5 aqueous
phase reac@ons (oKen a trick to get gas phase concentra@ons right) Cataly@c proper@es of water ignored à Chapman cycle insufficient to
describe stratospheric ozone Aqueous phase SO2 oxida@on à acid rain problem, unable to develop
effec@ve control strategies. Heterogeneous chemistry on polar stratospheric clouds discovered à
finally we completely understand the ozone hole. Hypothesis: insufficient representa@on of mul@phase organic chemistry
leads to incorrect ver@cal profiles of par@culate carbon in atmospheric models. This hinders development of effec@ve strategies for air quality and climate.
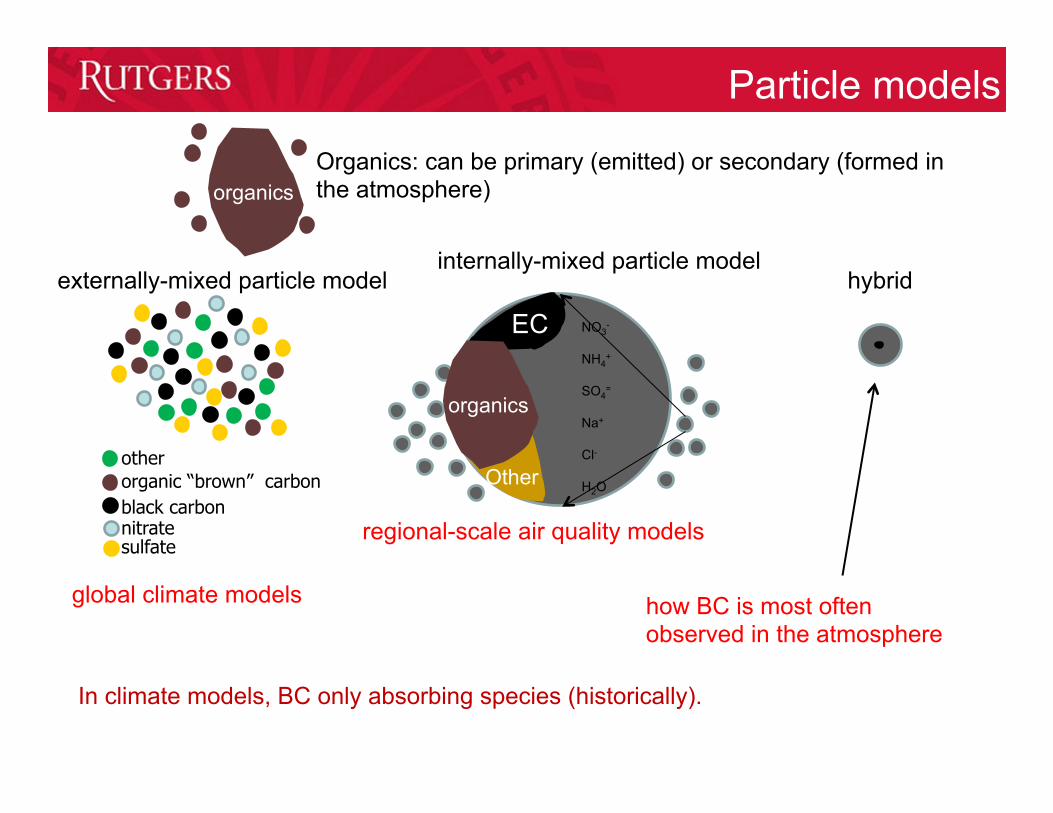
Particle models
black carbon nitrate
organic “brown” carbon other
externally-mixed particle model internally-mixed particle model
hybrid
global climate models
regional-scale air quality models
how BC is most often observed in the atmosphere
In climate models, BC only absorbing species (historically).
NO3-
NH4
+
SO4
= Na+
Cl- H2O
EC
Other
organics
organics Organics: can be primary (emitted) or secondary (formed in the atmosphere)
sulfate


