31
Signs of a structural improvement in airlines’ financial health? February 2016 Brian Pearce Chief Economist International Air Transport Association

Signs of a structural
improvement in airlines’
financial health?
February 2016
Brian Pearce
Chief Economist
International Air Transport Association
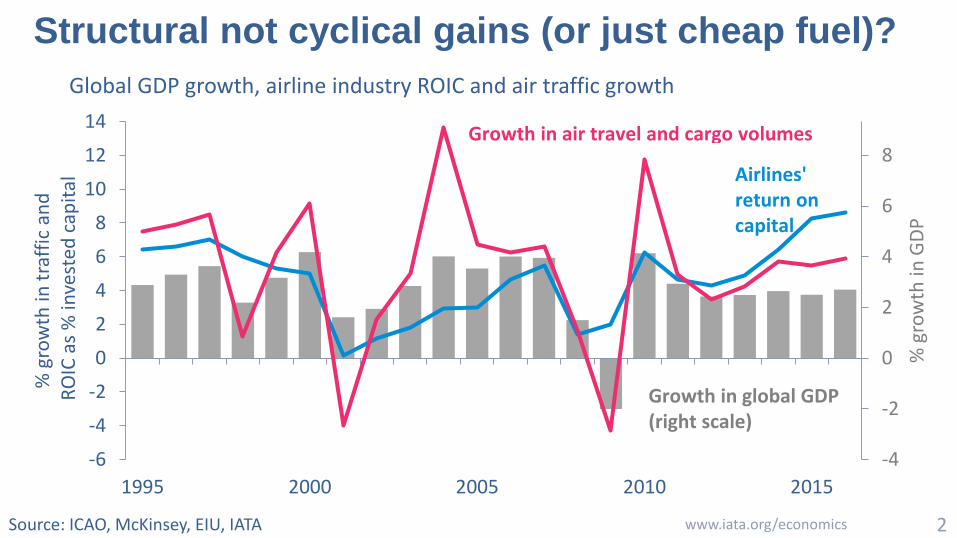
Structural not cyclical gains (or just cheap fuel)?
Source: ICAO, McKinsey, EIU, IATA 2 www.iata.org/economics
-4
-2
0
2
4
6
8
-6
-4
-2
0
2
4
6
8
10
12
14
1995 2000 2005 2010 2015
% g
row
th in
GD
P
% g
row
th in
tra
ffic
an
dR
OIC
as
% in
vest
ed c
apit
alGlobal GDP growth, airline industry ROIC and air traffic growth
Airlines' return on capital
Growth in air travel and cargo volumes
Growth in global GDP(right scale)
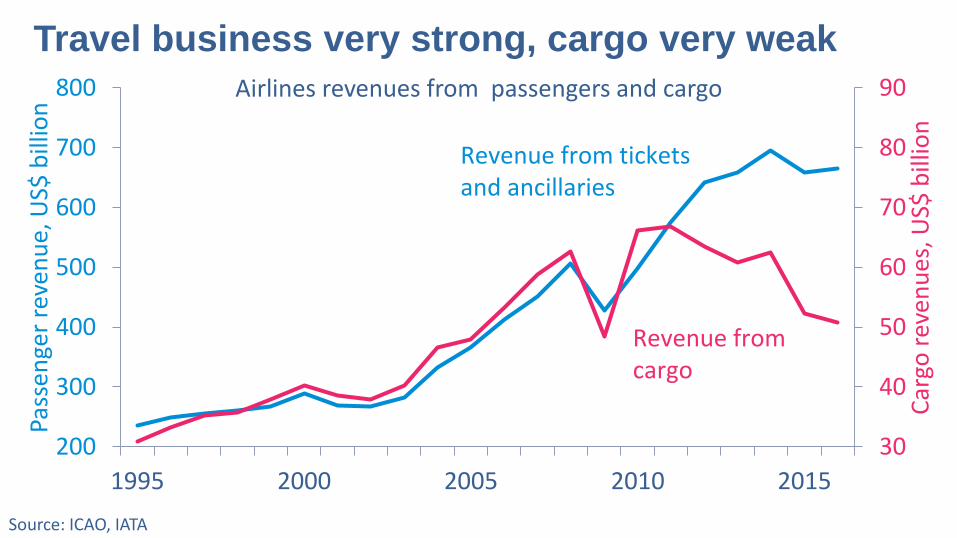
Travel business very strong, cargo very weak
Source: ICAO, IATA
30
40
50
60
70
80
90
200
300
400
500
600
700
800
1995 2000 2005 2010 2015
Car
go r
even
ues
, US$
bill
ion
Pass
enge
r re
ven
ue,
US$
bill
ion
Airlines revenues from passengers and cargo
Revenue from tickets and ancillaries
Revenue from cargo

Not all structural change is good
Source: Netherlands CPB 4 www.iata.org/economics
0.6
0.7
0.8
0.9
1.0
1.1
1.2
1992 1994 1996 1998 2000 2002 2004 2006 2008 2010 2012 2014
Ind
ex r
atio
, 20
05
eq
ual
s 1
International trade compared to global industrial production
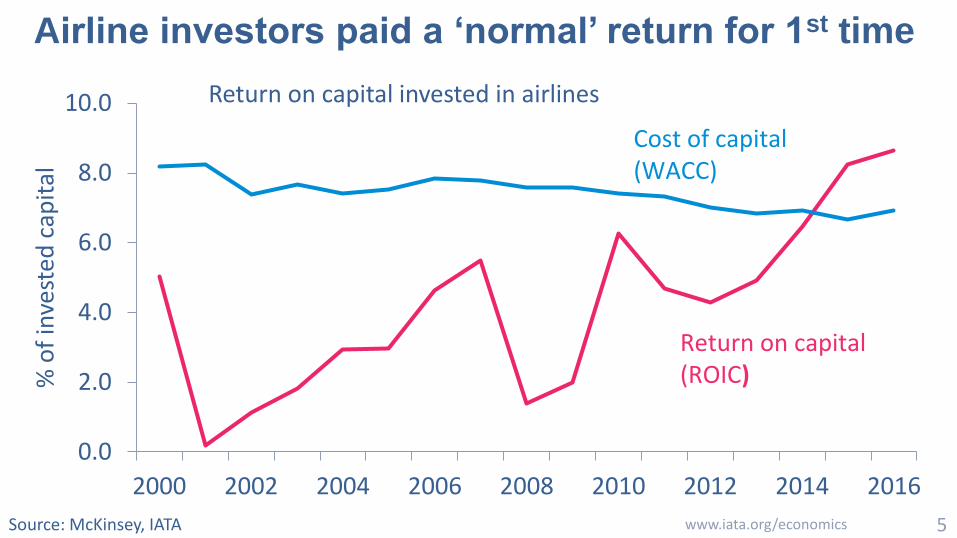
Airline investors paid a ‘normal’ return for 1st time
Source: McKinsey, IATA 5 www.iata.org/economics
0.0
2.0
4.0
6.0
8.0
10.0
2000 2002 2004 2006 2008 2010 2012 2014 2016
% o
f in
vest
ed c
apit
al
Return on capital invested in airlines
Cost of capital (WACC)
Return on capital (ROIC)

Ending decades of investor capital destruction (?)
Source: McKinsey, IATA 6 www.iata.org/economics
-40
-35
-30
-25
-20
-15
-10
-5
0
5
10
15
1995 1997 1999 2001 2003 2005 2007 2009 2011 2013 2015
US$
bill
ion
Difference between investing in airlines and investing in similar assets elsewhere
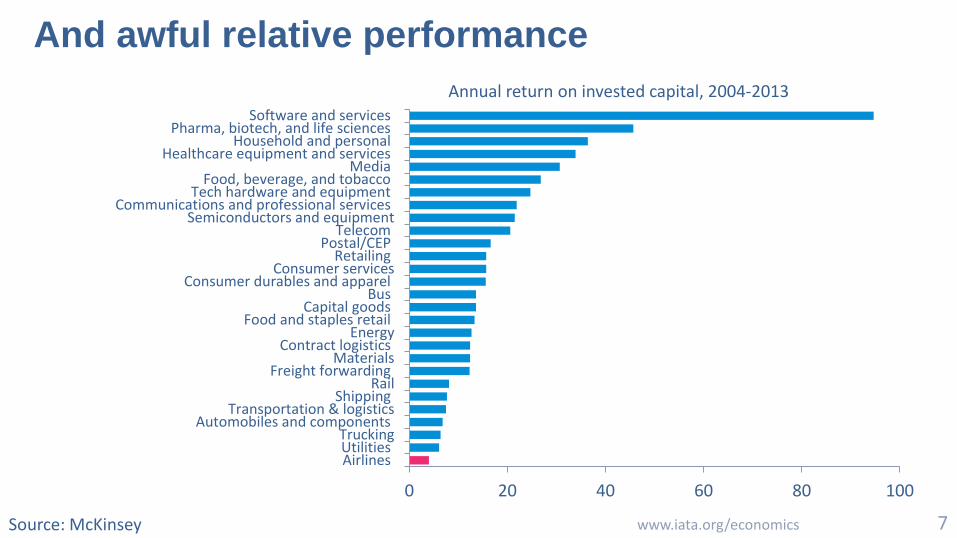
And awful relative performance
www.iata.org/economics 7 Source: McKinsey
0 20 40 60 80 100
AirlinesUtilitiesTrucking
Automobiles and componentsTransportation & logistics
ShippingRail
Freight forwardingMaterials
Contract logisticsEnergy
Food and staples retailCapital goods
BusConsumer durables and apparel
Consumer servicesRetailing
Postal/CEPTelecom
Semiconductors and equipmentCommunications and professional services
Tech hardware and equipmentFood, beverage, and tobacco
MediaHealthcare equipment and services
Household and personalPharma, biotech, and life sciences
Software and services
Annual return on invested capital, 2004-2013
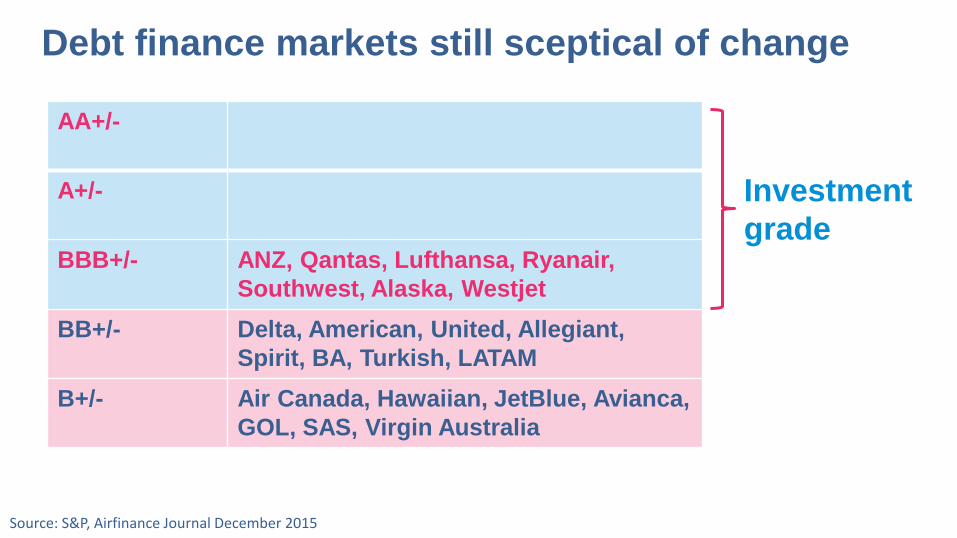
Debt finance markets still sceptical of change
AA+/-
A+/-
BBB+/- ANZ, Qantas, Lufthansa, Ryanair,
Southwest, Alaska, Westjet
BB+/- Delta, American, United, Allegiant,
Spirit, BA, Turkish, LATAM
B+/- Air Canada, Hawaiian, JetBlue, Avianca,
GOL, SAS, Virgin Australia
Investment
grade
Source: S&P, Airfinance Journal December 2015
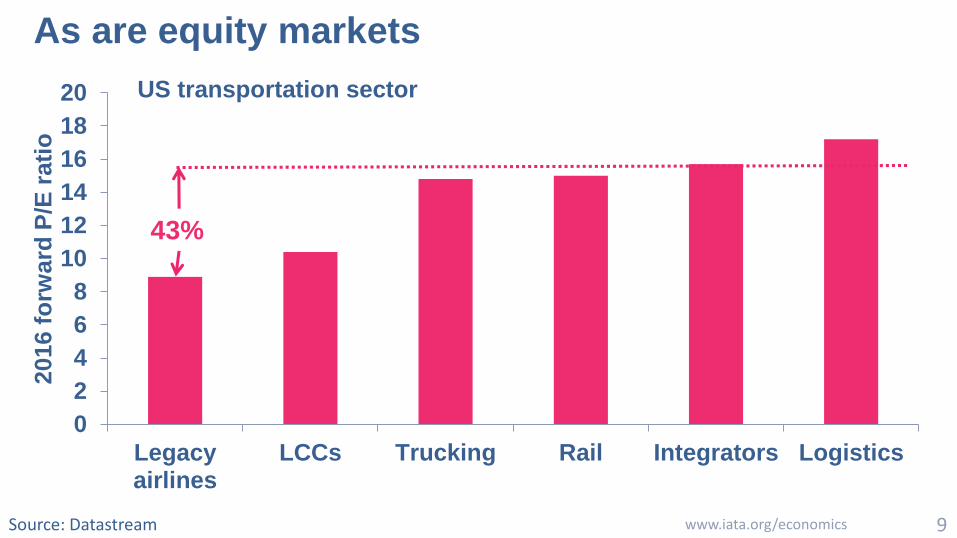
As are equity markets
Source: Datastream 9 www.iata.org/economics
0
2
4
6
8
10
12
14
16
18
20
Legacyairlines
LCCs Trucking Rail Integrators Logistics
2016 f
orw
ard
P/E
rati
o
43%
US transportation sector
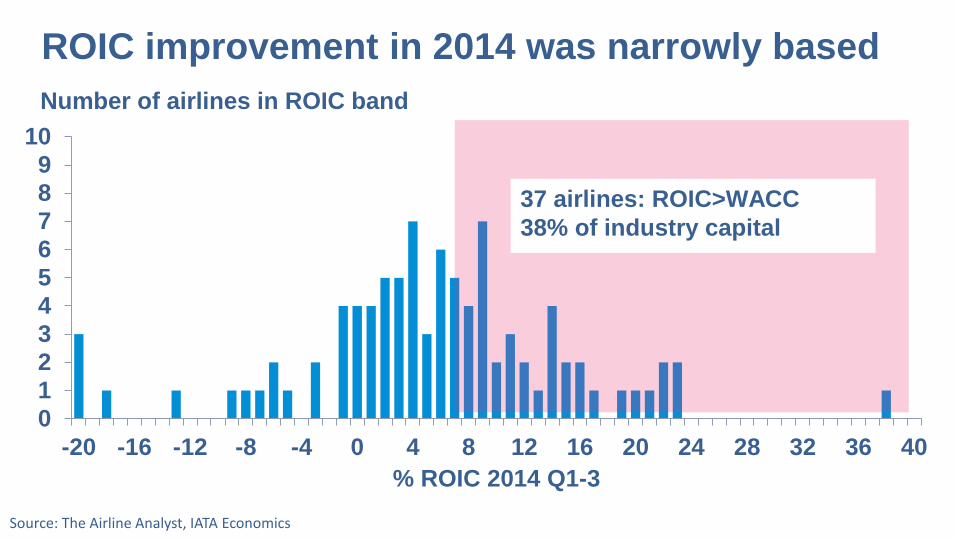
ROIC improvement in 2014 was narrowly based
Source: The Airline Analyst, IATA Economics
0
1
2
3
4
5
6
7
8
9
10
-20 -16 -12 -8 -4 0 4 8 12 16 20 24 28 32 36 40
% ROIC 2014 Q1-3
Number of airlines in ROIC band
37 airlines: ROIC>WACC
38% of industry capital
Source: The Airlines Analyst, IATA Economics
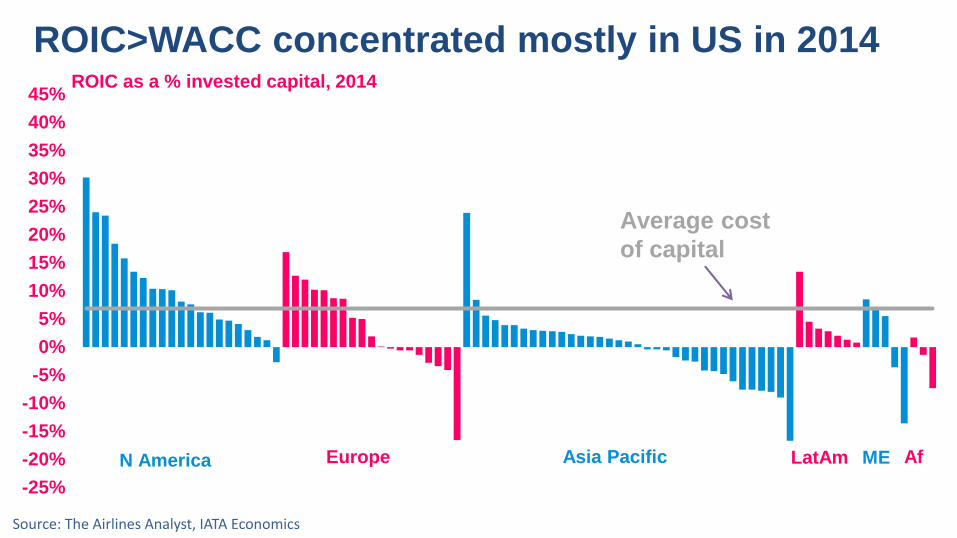
ROIC>WACC concentrated mostly in US in 2014
-25%
-20%
-15%
-10%
-5%
0%
5%
10%
15%
20%
25%
30%
35%
40%
45%ROIC as a % invested capital, 2014
Average cost
of capital
N America Europe Asia Pacific LatAm ME Af

But last year ROIC improvement spread
Source: The Airline Analyst, IATA 12 www.iata.org/economics
0
1
2
3
4
5
6
7
8
9
10
-20 -16 -12 -8 -4 0 4 8 12 16 20 24 28 32 36 40
% ROIC 2015 Q1-3
Number of airlines in ROIC band
47 airlines: ROIC>WACC
60% of industry capital

Returns rose in US, Europe and spread to Asia
Source: The Airlines Analyst, IATA Economics
-25%
-20%
-15%
-10%
-5%
0%
5%
10%
15%
20%
25%
30%
35%
40%
45% ROIC as % invested capital, 2015 Q1-3 annualized
N America Europe Asia Pacific LatAm ME
Average cost of
capital

Unprecedented FCF in the US
Source: The Airline Analyst, IATA Economics
0
5
10
15
20
25
30
N America Europe Asia Pacific L America
US
$ b
illi
on
Cash flow from operations, 2015 Q1-3
Capex, 2015 Q1-3

Allowing significant balance sheet repair for some
Source: The Airline Analyst, IATA 15 www.iata.org/economics
0
5
10
15
20
25
30
-50% -40% -30% -20% -10% 0% 10% 20% 30% 40% 50%
Ad
just
ed n
et d
ebt,
US$
bill
ion
Free cash flow as a % of adjusted net debt
2014 free cash flow and adjusted net debt
6 airlines could repay all debt in next 5 years
Median airline$3 billion net debt-3% FCF/net debt

It’s not just cheap fuel
Source: ICAO, McKinsey, IATA 16 www.iata.org/economics
0
2
4
6
8
10
5
10
15
20
25
30
2000 2002 2004 2006 2008 2010 2012 2014 2016
% r
etu
rn o
n in
vest
ed c
apit
al
US
cen
ts p
er A
TKFuel unit costs and airline return on capital
Airlines return on capital
Fuel unit cost

Suppliers mostly generate much better returns
Source: McKinsey for IATA 17 www.iata.org/economics
0%
5%
10%
15%
20%
25%
30%
% R
OIC
Return on capital across the air transport supply chain
1996-2014 2007-2014
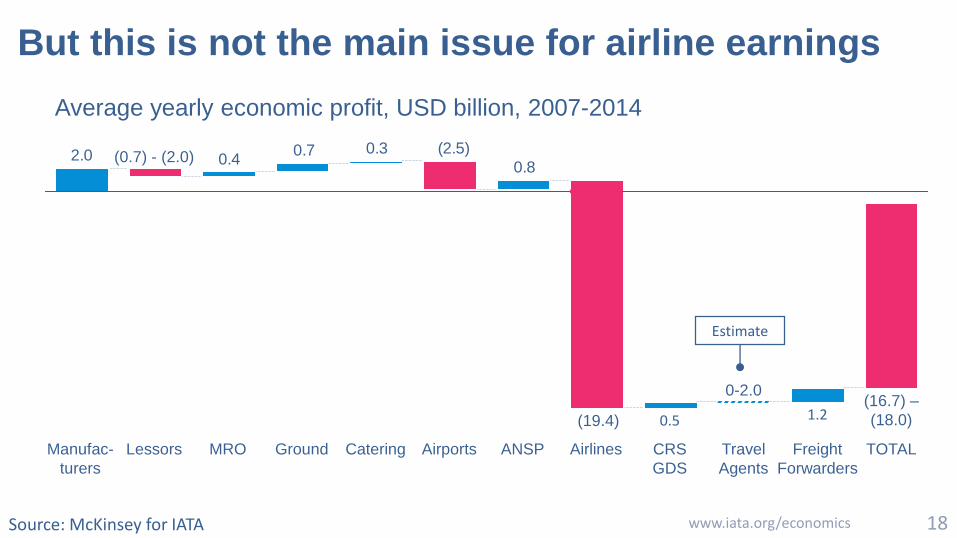
But this is not the main issue for airline earnings
www.iata.org/economics 18 Source: McKinsey for IATA
0.8
(2.5) 0.3 0.7 0.4 2.0
TOTAL
(16.7) –
(18.0)
Freight
Forwarders
1.2
Travel
Agents
0-2.0
CRS
GDS
0.5
Airlines
(19.4)
ANSPAirportsCateringGroundMROLessors
(0.7) - (2.0)
Manufac-
turers
Estimate
Average yearly economic profit, USD billion, 2007-2014

Most of the value created ends up with consumers
Source: ICAO, Boeing, OAG, IATA 19 www.iata.org/economics
0.5
1
1.5
2
2.5
3
3.5
-
2,000
4,000
6,000
8,000
10,000
12,000
14,000
16,000
18,000
1994 1996 1998 2000 2002 2004 2006 2008 2010 2012 2014
US$
/RTK
in 2
01
4U
S$
Nu
mb
er o
f u
niq
ue
city
-pai
rs
Unique city-pairs and real transport costs
Unique city pairs
Real cost of air transport

Step change in airlines’ asset use since the GFC
Source: ICAO, IATA 20 www.iata.org/economics
58
59
60
61
62
63
64
65
66
67
68
2000 2002 2004 2006 2008 2010 2012 2014
% A
TK
s
Breakeven and achieved load factor (LF)
Achieved LF
Breakeven LF
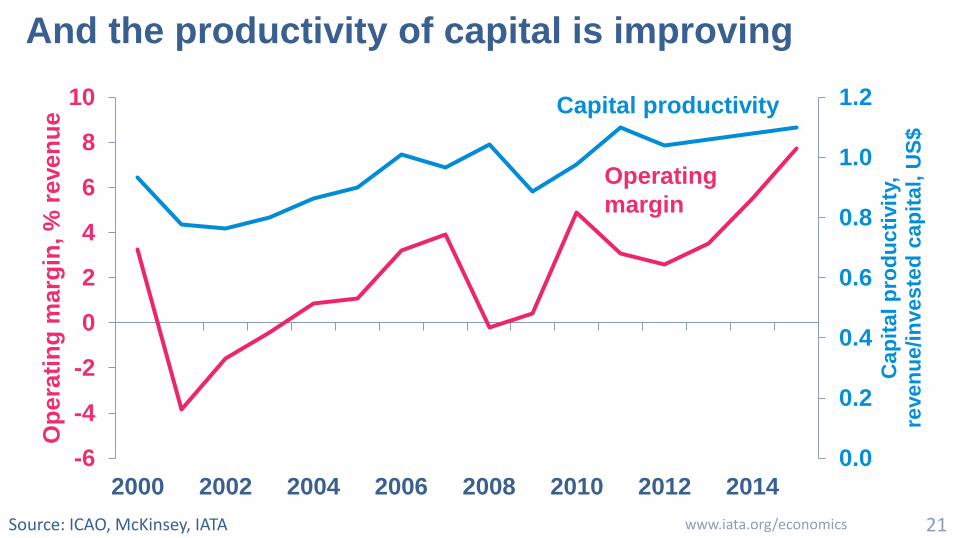
And the productivity of capital is improving
Source: ICAO, McKinsey, IATA 21 www.iata.org/economics
0.0
0.2
0.4
0.6
0.8
1.0
1.2
-6
-4
-2
0
2
4
6
8
10
2000 2002 2004 2006 2008 2010 2012 2014
Ca
pit
al
pro
du
cti
vit
y,
reve
nu
e/i
nve
ste
d c
ap
ita
l, U
S$
Op
era
tin
g m
arg
in, %
reven
ue
Capital productivity
Operating
margin
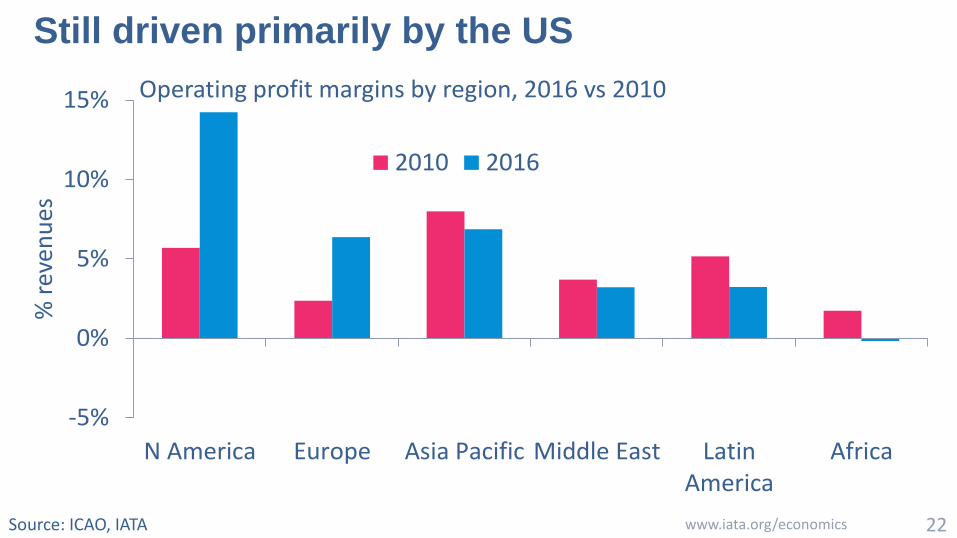
Still driven primarily by the US
Source: ICAO, IATA 22 www.iata.org/economics
-5%
0%
5%
10%
15%
N America Europe Asia Pacific Middle East LatinAmerica
Africa
% r
even
ues
Operating profit margins by region, 2016 vs 2010
2010 2016
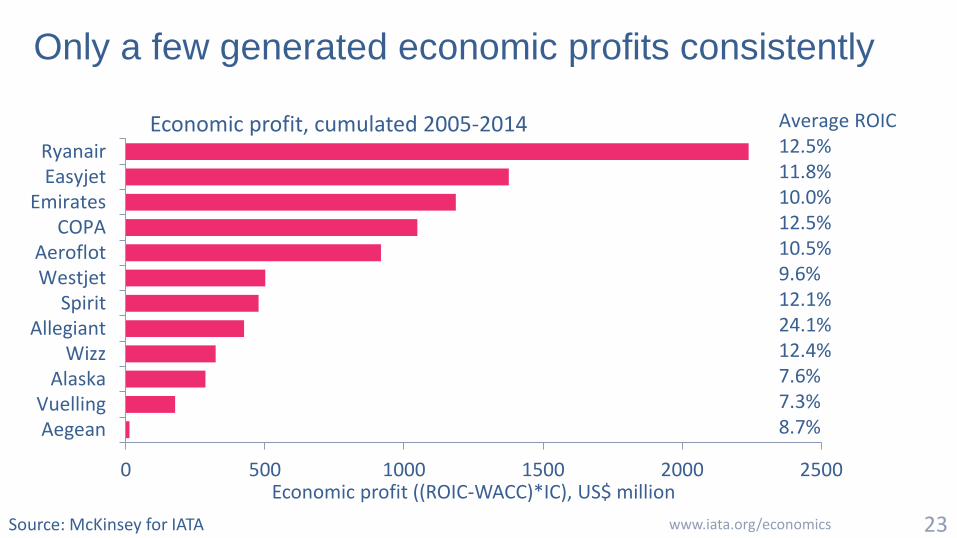
Only a few generated economic profits consistently
www.iata.org/economics 23 Source: McKinsey for IATA
0 500 1000 1500 2000 2500
AegeanVuelling
AlaskaWizz
AllegiantSpirit
WestjetAeroflot
COPAEmirates
EasyjetRyanair
Economic profit ((ROIC-WACC)*IC), US$ million
Economic profit, cumulated 2005-2014 Average ROIC12.5%11.8%10.0%12.5%10.5%9.6%12.1%24.1%12.4%7.6%7.3%8.7%
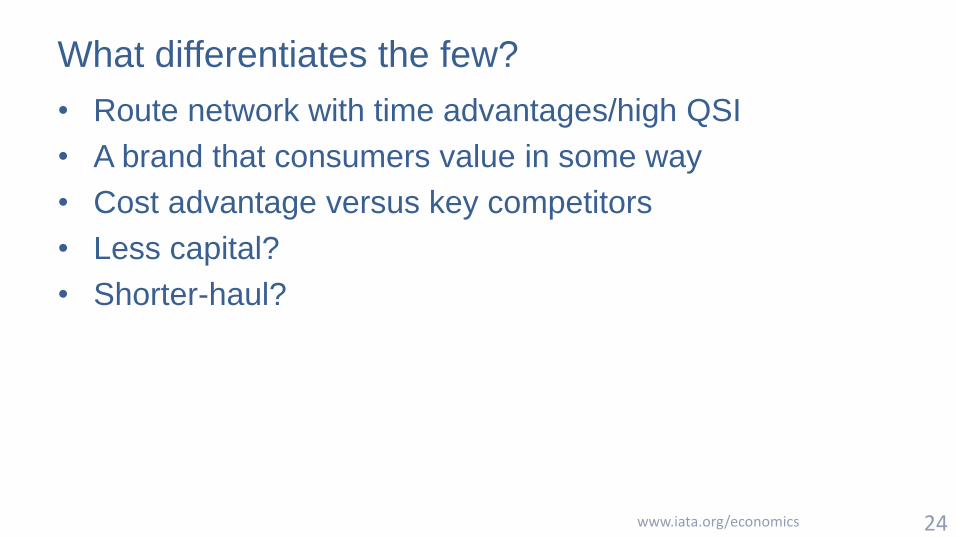
What differentiates the few?
• Route network with time advantages/high QSI
• A brand that consumers value in some way
• Cost advantage versus key competitors
• Less capital?
• Shorter-haul?
www.iata.org/economics 24
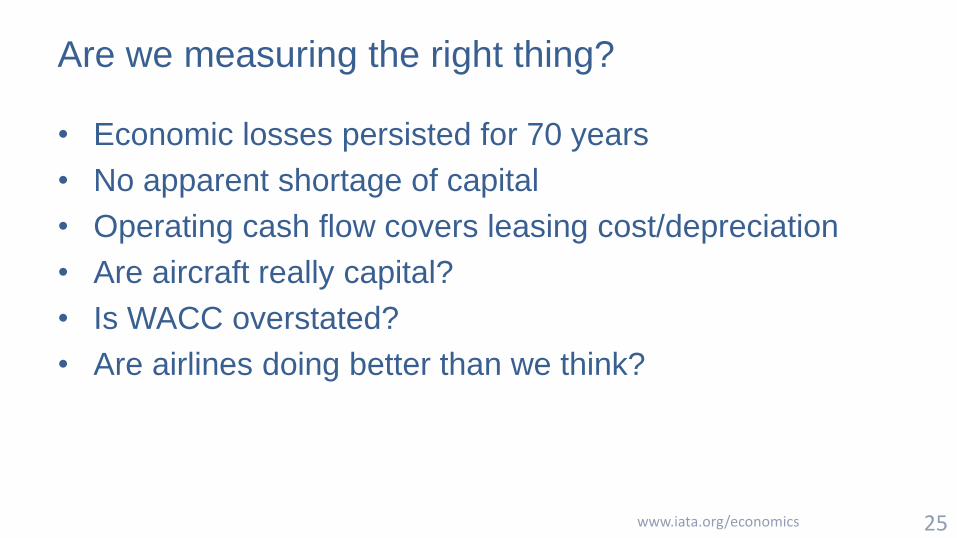
Are we measuring the right thing?
• Economic losses persisted for 70 years
• No apparent shortage of capital
• Operating cash flow covers leasing cost/depreciation
• Are aircraft really capital?
• Is WACC overstated?
• Are airlines doing better than we think?
www.iata.org/economics 25
BACK UP SLIDES
www.iata.org/economics 26

Wide variation in travel growth by country
-5
0
5
10
15
20
25
India China US Eurozone Brazil Russia
% c
han
ge o
ver
pre
vio
us
year
Economic and passenger growth in 2015 to date
GDP Pax
Source: Datastream, IATA Statistics 27 www.iata.org/economics
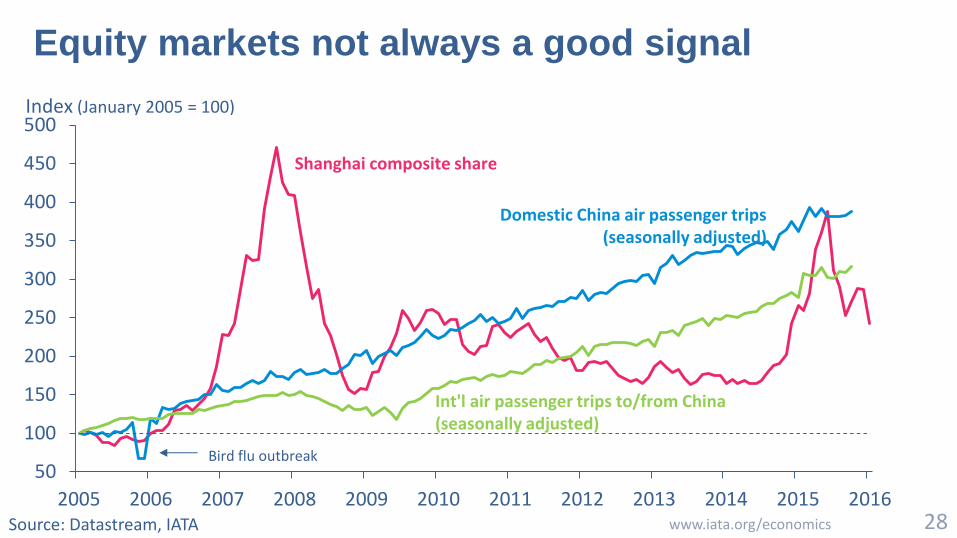
Equity markets not always a good signal
www.iata.org/economics 28
50
100
150
200
250
300
350
400
450
500
2005 2006 2007 2008 2009 2010 2011 2012 2013 2014 2015 2016
Index (January 2005 = 100)
Bird flu outbreak
Shanghai composite share
Domestic China air passenger trips (seasonally adjusted)
Int'l air passenger trips to/from China (seasonally adjusted)
Source: Datastream, IATA
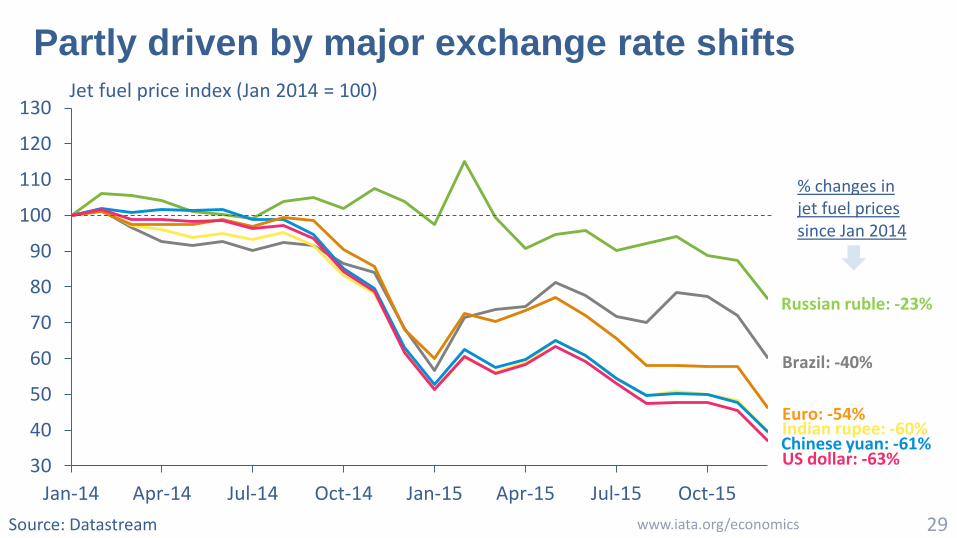
Partly driven by major exchange rate shifts
29 www.iata.org/economics Source: Datastream
30
40
50
60
70
80
90
100
110
120
130
Jan-14 Apr-14 Jul-14 Oct-14 Jan-15 Apr-15 Jul-15 Oct-15
Jet fuel price index (Jan 2014 = 100)
US dollar: -63%
Indian rupee: -60%Chinese yuan: -61%
Euro: -54%
Brazil: -40%
Russian ruble: -23%
% changes in jet fuel prices since Jan 2014

Premium slowing yield decline in some markets
www.iata.org/economics 30 Source: PaxIS+, IATA
2.9%
4.2%
3.3%
8.4%
5.8%
4.4%
24.6%
3.2%
14.7%
12.4%
-7% -6% -5% -4% -3% -2% -1% 0% 1% 2%
North-South America
Within Europe
Asia-Southwest Pacific
Within Asia
Europe-Middle East
Europe-Southern Africa
North Atlantic
South Atlantic
Europe-Asia
North And Mid Pacific
Change in premium's share of revenues (Nov'15 vs. Nov'14, %-point)
Each route's share of industry-wide premium revenues
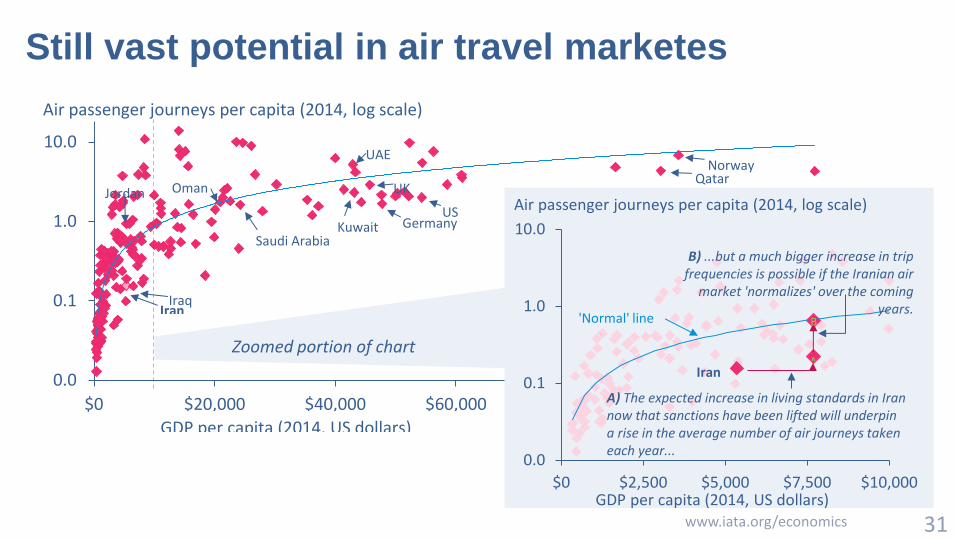
Still vast potential in air travel marketes
www.iata.org/economics 31
0.0
0.1
1.0
10.0
$0 $20,000 $40,000 $60,000 $80,000 $100,000 $120,000
Air passenger journeys per capita (2014, log scale)
GDP per capita (2014, US dollars)
Iran
UAE
Saudi Arabia
Qatar Oman
Kuwait
Jordan
Iraq
Zoomed portion of chart
US
UK
Germany
Norway
0.0
0.1
1.0
10.0
$0 $2,500 $5,000 $7,500 $10,000
Air passenger journeys per capita (2014, log scale)
GDP per capita (2014, US dollars)
Iran
A) The expected increase in living standards in Iran now that sanctions have been lifted will underpin a rise in the average number of air journeys taken each year...
B) ...but a much bigger increase in trip frequencies is possible if the Iranian air
market 'normalizes' over the coming years.
'Normal' line
A
B


