Improvement of Meadow Stream Health due to Livestock Distribution Efforts K.W. Tate, T.A. Becchetii, C. Battaglia, N.K. McDougald, D.F. Lile, H.A. George, and D.L. Lancaster University of California
Transcript
Improvement of Meadow Stream Health due to Livestock Distribution Efforts
K.W. Tate, T.A. Becchetii, C. Battaglia, N.K. McDougald, D.F. Lile,
H.A. George, and D.L. Lancaster
University of California
• Grazed streams across CA range
from excellent to poor health.
• What practices are associated with
excellent to poor health?
• Conduct a cross-sectional survey of
health and management of grazed
stream systems.
Grazing – Stream Health
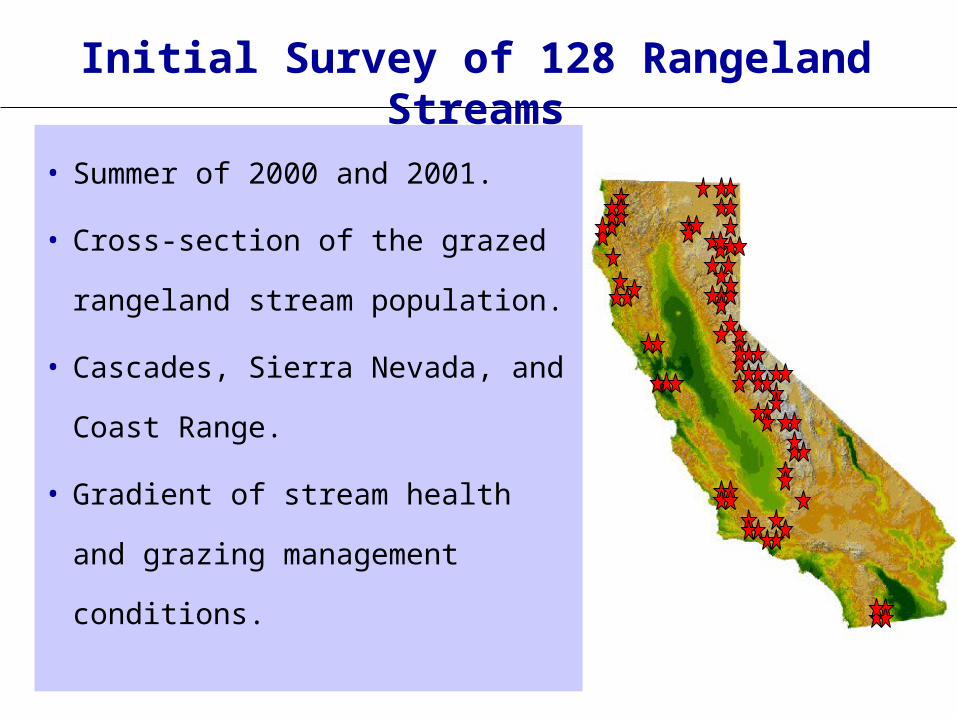
Initial Survey of 128 Rangeland Streams
• Summer of 2000 and 2001.
• Cross-section of the grazed
rangeland stream population.
• Cascades, Sierra Nevada, and
Coast Range.
• Gradient of stream health and
grazing management conditions.
Grazing ManagementEPA – CDFG Stream Health Assessment
stability
fish habitat
macroinverts.
Overall Health Score
0 – 5 poor
6 – 10 marginal
11 – 15 suboptimal
16 – 20 optimal
Off-site water, herding, season, frequency, fencing, etc.
Site Characteristics
Elevation, channel slope, substrate, watershed disturb., past disturb., etc.
• Regression analysis – correlate
stream health score (0-20) to
grazing management variables
• Analyzed by substrate type:
bedrock/boulder, cobble/gravel,
fines/alluvial
• Associations v. Cause-Effect
Grazing and Stream Health Associations
Grazing – Stream Health Score Correlations: Meadow Streams
+Time maintaining off-stream
attractants (days/yr).
+Herding to reduce time near
stream (days/yr).
– Cattle density (AU/ac) .
– Frequency (times/yr).
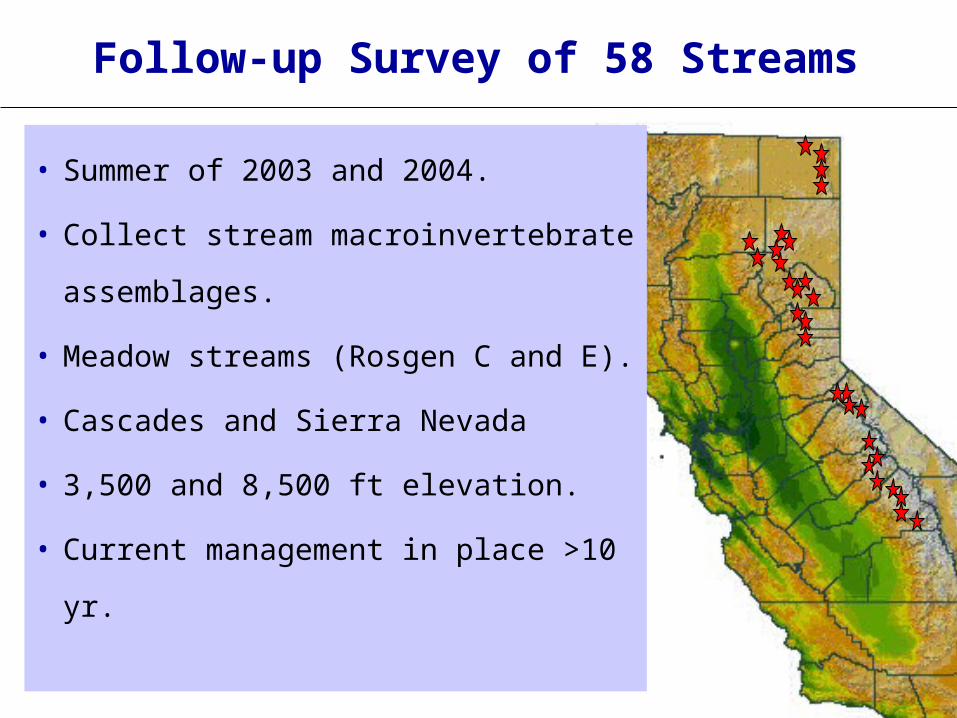
Follow-up Survey of 58 Streams
• Summer of 2003 and 2004.
• Collect stream macroinvertebrate
assemblages.
• Meadow streams (Rosgen C and E).
• Cascades and Sierra Nevada
• 3,500 and 8,500 ft elevation.
• Current management in place >10 yr.
Macroinvertebrates
• Integrate stream conditions and
disturbance over space and
time.
• EPA – CDF&G protocols
– 3 transects per 100m reach, d-
ring kick-net, 0.25 m2 sample
area, 3 minute sample effort
• ID to genus – species
Sub-sample edge and mid stream substrates at 3 transects each stream
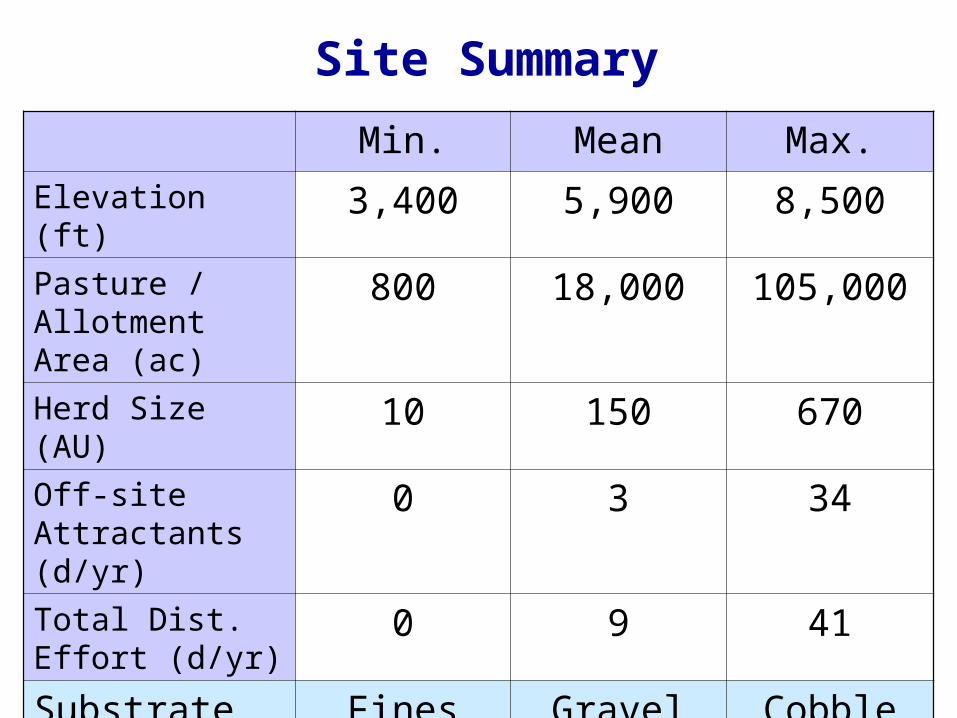
Site Summary
Min. Mean Max.
Elevation (ft) 3,400 5,900 8,500
Pasture / Allotment Area (ac)
800 18,000 105,000
Herd Size (AU) 10 150 670
Off-site Attractants (d/yr)
0 3 34
Total Dist. Effort (d/yr)
0 9 41
Substrate Type
(% sites)
Fines Gravel Cobble
53 27 20
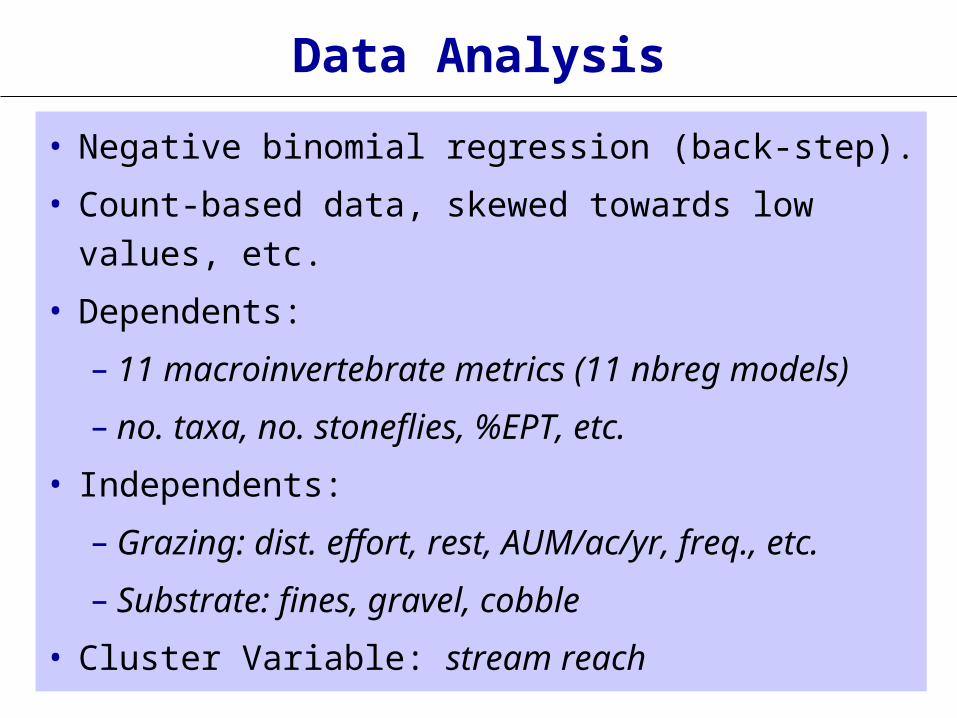
Data Analysis
• Negative binomial regression (back-step).
• Count-based data, skewed towards low values, etc.
• Dependents:
– 11 macroinvertebrate metrics (11 nbreg models)
– no. taxa, no. stoneflies, %EPT, etc.
• Independents:
– Grazing: dist. effort, rest, AUM/ac/yr, freq., etc.
– Substrate: fines, gravel, cobble
• Cluster Variable: stream reach
• 11 metrics significantly assoc. with total dist. effort
(p<0.10).
• No other grazing variables were significant (p>0.10).
• Sensitive metrics increased as dist. effort increased.
• Substrate a major determinant of 10 metrics.
Select Metrics Dist. Effort (d/yr)
Substrate
(cobble to fines)
No. EPT taxa + (p=0.01) – (p=0.07)
No. Total Taxa + (p<0.01) – (p=0.02)
No. Intolerant Taxa + (p<0.01) – (p=0.02)
% Intolerant Taxa + (p=0.06) – (p=0.06)
% Dominant Taxa – (p=0.03) n.s.(p>0.10)
Livestock Distribution Effort (days/yr)
0 10 20 30 40
Num
ber
of T
axa
15
20
25
30
CobbleGravelFines
Total Taxa
Total livestock distribution effort v. richness for
streams with fine, gravel, and cobble substrate.
Streambed Substarte
Cobble Gravel Fines
Nu
mb
er
of T
axa
0
5
10
15
20
25
30
Total Taxa
EPT Taxa
Intolerant Taxa
Sensitive metrics decreases with substrate size.
Must be accounted for in cross stream comparisons.
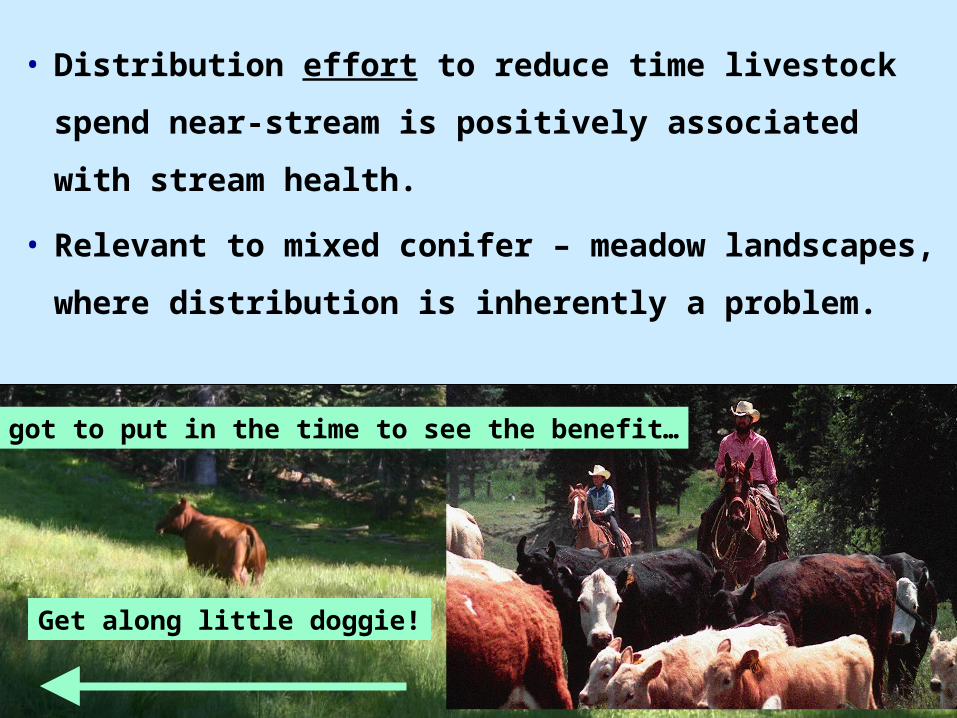
• Distribution effort to reduce time livestock spend