Page 1
Nutrients 2012, 4, 1151-1170; doi:10.3390/nu4091151
nutrients ISSN 2072-6643
www.mdpi.com/journal/nutrients
Article
An Assessment of the Impact of Fortification of Staples
and Condiments on Micronutrient Intake in Young
Vietnamese Children
Arnaud Laillou 1,
*, Le Bach Mai 2, Le Thi Hop
2, Nguyen Cong Khan
3, Dora Panagides
1,
Frank Wieringa 4, Jacques Berger
4 and Regina Moench-Pfanner
1
1 Global Alliance for Improved Nutrition (GAIN), Rue de Vermont 37-39, Geneva 1201, Switzerland;
E-Mails: [email protected] (D.P.); [email protected] (R.M.-P.) 2 National Institute of Nutrition (NIN), 48b Tang Bat Ho, Hanoi 10000, Vietnam;
E-Mails: [email protected] (L.B.M.); [email protected] (L.T.H.) 3 Vietnam Food Administration (VFA), Hanoi 10000, Vietnam;
E-Mail: [email protected] 4 UMR 204 “Prevention of Malnutrition and Associated Diseases”, IRD-UM2-UM1, Institute of
Research for Development (IRD), BP 645, Montpellier cedex 34394, France;
E-Mails: [email protected] (F.W.); [email protected] (J.B.)
* Author to whom correspondence should be addressed; E-Mail: [email protected] ;
Tel.: +41-079-418-61-45; Fax: +41-022-749-18-69.
Received: 7 June 2012; in revised form: 8 August 2012 / Accepted: 15 August 2012 /
Published: 24 August 2012
Abstract: Targeted fortification programs for infants and young children are an effective
strategy to prevent micronutrient deficiencies in developing countries, but the role of
large-scale fortification of staple foods and condiments is less clear. Dietary modeling in
children aged 6–60 months was undertaken, based on food consumption patterns described
in the 2009 national food consumption survey, using a 24-h recall method. Consumption
data showed that the median intake of a child for iron, vitamin A and zinc, as a proportion
of the Vietnamese Recommended Dietary Allowance (VRDA), is respectively 16%–48%,
14%–49% and 36%–46%, (depending on the age group). Potential fortification vehicles,
such as rice, fish/soy sauces and vegetable oil are consumed daily in significant amounts
(median: 170 g/capita/day, 4 g/capita/day and 6 g/capita/day, respectively) by over 40% of
the children. Vegetable oil fortification could contribute to an additional vitamin A intake of
21%–24% of VRDA recommended nutrient intake, while fortified rice could support the
intakes of all the other micronutrients (14%–61% for iron, 4%–11% for zinc and 33%–49%
OPEN ACCESS
Page 2
Nutrients 2012, 4 1152
of folate requirements). Other food vehicles, such as wheat flour, which is consumed by
16% of children, could also contribute to efforts to increase micronutrient intakes, although
little impact on the prevalence of micronutrient deficiencies can be expected if used alone.
The modeling suggests that fortification of vegetable oil, rice and sauces would be an
effective strategy to address micronutrient gaps and deficiencies in young children.
Keywords: fortification; strategy; infant; young children; Vietnam; recommended
dietary allowance
1. Introduction
The critical 1000 days of human development from pregnancy until 2 years of age has received
much attention from stakeholders, since inadequate nutrition during this crucial period of time is a
global public health problem with long-term impact. More than one-third of deaths among children
under the age of 5 years as well as other long-term consequences (stunting, reduced productivity) are
due to under-nutrition during the first 1000 days [1,2]. Children under 5 years of age, and particularly
those under two years of age, are often deficient in micronutrients. According to WHO, an estimated
250 million preschool children are vitamin A deficient [3]. Prevalence of anemia in children aged
from 6 to 35 months can exceed 50% in countries as diverse as India, Peru and Madagascar [4]. In
addition, a review estimated that zinc deficiency was responsible, globally, for 453,207 deaths per year
(4.4% of childhood deaths) and 1.2% of the burden of disease among children under 5 years of age [5].
In Vietnam, recent studies showed that the prevalence of anemia ranges from 25% to 45% in
schoolchildren [6,7]. In addition, the prevalence of zinc and selenium deficiencies were also reported
to be very high (>50%) in rural Vietnamese children[8]. A nationwide survey on micronutrient status
of young children carried out in 2010 in Vietnam [9] confirms these data, indicating that zinc
deficiency is a severe public health problem among children aged 6–75 months, as 51.9% had plasma
zinc concentrations—indicative of deficiency. While the prevalence of anemia, and deficiencies of iron
and vitamin A have decreased compared to previous surveys, marginal vitamin A status is still
prevalent (above 50% with plasma retinol <1.05 µmol/L), and over 25% of children (6–75 months)
had a ferritin concentration <30 µg/L, indicating low iron stores. Children from 6 to 18 months of age
were particularly at risk of micronutrient deficiencies [9].
While there are numerous approaches to control micronutrient deficiency using a range of
interventions (fortification, supplementation, dietary diversification, other food-based approaches and
public health measures), there is no single model appropriate to cover all population segments, making
it important to design and implement complementary approaches to ensure the greatest penetration of
fortified food products. The 6–24 month age period corresponds to the time when different foods are
successively introduced to complement breast milk. The timely introduction of complementary foods
and/or food supplements is generally recognized as a necessary condition to prevent malnutrition [10].
However, early introduction and poor quality of complementary foods among children less than two
years of age are of substantial concern in Vietnam [11]. In addition, several studies have shown a low
consumption of animal-sourced foods, such as meat or eggs, as well as other food, such as
Page 3
Nutrients 2012, 4 1153
fruit [12,13]. Large-scale fortification of staple foods and condiments targeting the entire population
(through mandatory or voluntary legislation) has already had some significant effects on micronutrient
status among children [14,15] and could contribute to the reduction of micronutrient gaps, as children
also consume family foods. For example, in Indonesia, consumption of fortified milk and noodles was
associated with reduced incidence of anemia and stunting in children aged 6–59 months [16].
With the evidence of the impact of iron-fortified fish sauce [17,18], the Global Alliance for
Improved Nutrition (GAIN) supported the development of the first national plan to launch iron
fortified fish sauce to prevent iron deficiency in Vietnam. In addition, the government has issued a
standard for voluntary fortification of several staples and condiments to reduce micronutrient
deficiencies [19,20]. Unfortunately, the privatization of the state-run fish sauce industry in the first
years of the project drastically reduced the number of participating factories and the potential impact of
the project. Therefore, fish sauce fortification as a stand-alone intervention could not sufficiently
reduce micronutrient deficiencies in Vietnam, and it became essential to conduct an analysis of the
sauces (fish and soy sauces) and staple food (rice, wheat flour, vegetable oil) markets to examine
potential additional vehicles for fortification. A market survey in Vietnam [21], commissioned in 2009
by the GAIN, showed potential for a multiple food fortification strategy due to highly concentrated
industries for vegetable oil (8 producers with 95% of the market), fish sauces (13 producers with 60%
of the market), flavoring powders (13 producers with 75% of the market), soy sauces (4 producers with
76% of the market) and wheat flour (8 producers with 84% of the market). In addition, rice fortification
is currently getting more attention because fortification technology is now available [22–25], and
new evidence is demonstrating the potential benefits of rice fortification to control micronutrient
deficiencies [26–29].
By focusing on improving nutrition for mothers and children in the 1000-day window, many
organizations have focused their efforts on developing new products for targeted groups.
Consequently, the objective of this study was to explore, based on measured dietary intakes, whether
multiple large scale food fortification of selected staple foods and condiments with multiple
micronutrients in Vietnam has the potential to increase iron, folic acid, zinc and vitamin A daily
intakes among children among different socioeconomic groups, age groups, and among both urban and
rural populations.
The hypothesis tested was that fortification of these selected staple foods and condiments,
according to existing Vietnamese food fortification regulations [19,20] would provide a significant
contribution to daily micronutrient requirements of iron, zinc, vitamin A and folate in children aged
between 6 and 60 months.
2. Materials and Methods
2.1. Study Design and Sampling
The survey population of the 2009 Food Consumption Survey (FCS) consisted of 7680 households
(HH), sampled from 512 clusters (104 urban and 408 rural). HH were randomly selected using a
stratified 2-stage cluster sampling procedure with probability proportionate to size (PPS). A subset of
HH from the FCS was selected for the 2010 micronutrient study (MNS). The sample size for the 2010
Page 4
Nutrients 2012, 4 1154
MNS was estimated on the basis of a prevalence of anemia among women of reproductive age of 50%,
since in the previous national anemia survey (2005), 39.9% of the non-pregnant and 52.5% of pregnant
women were anemic [30]. Therefore, a sample size of approximately 700 HH per stratum (urban/rural)
was calculated to achieve an accuracy of 5.0%, with an expected design effect of 2.0. Anticipating an
estimated 17% refusal or absence of women in the selected HH, 840 HH per stratum were required.
Consequently, a total of 56 urban and 56 rural clusters of 15 households were selected for the 2010
MNS. Due to limited funding, sampling from each province was not possible; therefore, the National
Institute of Nutrition randomly selected 19 provinces from the total of 64 provinces in Vietnam. From
these 19 provinces, 56 urban clusters and 56 rural clusters were randomly chosen from those that had
been included in the 2009 FCS.
Every child (less than 5 years old) from the subset of HH was surveyed and the individual
consumption data were collected (n = 430 children). For this paper, children less than 6 months
(n = 15) were excluded as exclusive breastfeeding is recommended.
2.2. Food Consumption Analysis
The 2009 FCS estimated the individual consumption of children using the 24-h recall method
combined with controlled food weighing, similar to the procedures followed in 2000 [31].
The 24-h recall of amount of foods consumed by any given child was conducted by teams of
dietitians or trained personnel from provincial medical centers. Dietitians interviewed the woman in
charge of cooking for the child and feeding him/her. To estimate quantities of ingredients used in food
preparation, various techniques were used: (1) reproduction of the quantity of food and weighing: the
mother was asked to reproduce the quantity (e.g., quantity of rice cooked using the stock) or the
volume of a food (e.g., volume of fish sauce using water). The enumerator weighed these quantities
using a small digital balance; (2) use of a photographic food catalogue including different serving sizes
of typical dishes and calibrated cooking tools (spoon of vegetable oil, spoon of sugar, etc.);
(3) estimation according to the prices of food purchases: food prices were converted into weight using
market data.
To understand the food consumption patterns of the children, the National Institute of Nutrition
(NIN) classification of food groups used for the 2000 and 2009 FCS was applied, which included
a wheat flour group, a vegetable oil group, a sauces group (including fish and soy sauces) and a
rice group.
2.3. Socioeconomic Status
Socio-economic status was calculated from data obtained during the 2009 FCS [32], using the
Demographic and Health Survey (DHS) Wealth Index to divide HH surveyed into five socio-economic
quintiles: the “extreme poor” (category 1), the “poor” (category 2), the “intermediate” categories 3 and 4
and the “wealthiest” (category 5). The Wealth Index was constructed from recorded data on household
assets such as tables, chairs, refrigerator, air conditioners and beds and also from housing conditions
(building materials used to make the house floor; roof; main wall) and facilities (energy for cooking,
electricity and latrines). Income and expenditure data were not used [33].
Page 5
Nutrients 2012, 4 1155
2.4. Proposed Fortification Strategy
The most prevalent micronutrient deficiencies found among children during the 2010 national-wide
survey were iron, vitamin A, zinc and folate [9]. For this reason, those four micronutrients formed the
basis of the current modeling exercise.
In this study, fortification levels for vegetable oil were set according to the most current national
standards [19,20]. For wheat flour and rice, the latest international recommendation [34], based on an
adult’s equivalent consumption of rice—over 300 g/day, and of wheat flour—below 75 g/day was
adapted so as not to exceed approximately 35%–40% of the VRDA of an adult woman of 19–50 years
of age. Finally, the standard for sauces was modified from 4 mg to 2.5 mg of iron as sodium iron
ethylenediaminetetraacetic acid (NaFeEDTA) per 10 mL of sauce to avoid any color change or
precipitation as observed in Vietnam and Thailand [35]. Table 1 presents the standard used for
modeling in the present study. Sugar fortification was not included in this strategy, as the sugar
consumption among adults is very low in Vietnam: 8 g/capita/day in 2000 [36]. In 2009 it was even
less: approximately 6 g/capita/day [37].
Table 1. Standards used for modeling purposes of an integrated large-scale fortification
strategy in Vietnam.
Food vehicle Standards
Wheat flour 40 mg/kg of iron as NaFeEDTA; 50 mg/kg
of zinc and 5 mg/kg of folic acid
Rice 40 mg/kg of iron as micronized ferrous pyrophosphate;
5 mg/kg of zinc and 0.5 mg/kg of folic acid
Vegetable oil 75 IU of retinyl palmitate per gram of vegetable oil
Sauces 2.5 mg of iron as NaFeEDTA per 10 mL of sauces
2.5. Statistical Analysis
In 2007, the Vietnamese government issued the VRDA [38] which recommends a higher
micronutrient intake than the WHO guidelines [39]. In this analysis, the VRDA was used for assessing
the relative contribution of fortification toward meeting the needs of children, as they are more tailored
to the Vietnamese population. Iron bioavailability was estimated to be low (5%) for diets rich in
cereals [39]. A low absorption of zinc was also assumed, considering the diet in Vietnam is rich
in phytate [39].
Data entry, management and analysis, including quality checks, were performed using SPSS
software version 19™ (IBM Corporation, New York, USA). To calculate daily energy, macro- and
micronutrient intakes the database was linked to the Vietnamese Food Composition Database [40].
Descriptive statistics were used to examine all variables. Consumption distribution curves were
asymmetric according to the test of Kolmogorov-Smirnov and therefore only non-parametric tests
were performed. Median and interquartile range values of the per daily capita consumption of children
are presented and disaggregated by socioeconomic status (quintile), age group, sex and residence
(urban/rural). Food consumption (continuous variables) was compared by groups by using the
Page 6
Nutrients 2012, 4 1156
non-parametric Kruskal-Wallis test (more than two groups) or Mann-Whitney U-test (two groups) for
independent variables.
The median consumptions of nutrients through fortifiable food (such as rice, wheat flour, vegetable
oil and flavoring powder) by age group were calculated by multiplying the level of fortificant
(including the losses during processing and storage: 5% for iron and zinc, 30% for vitamin A and 50%
for folic acid [39]) by the amount of food consumed.
2.6. Ethical Issues
The Scientific Committees of the National Institute of Nutrition (Hanoi, Vietnam) and of the
Ministry of Health (Hanoi, Vietnam) reviewed and approved the study protocol.
All households were informed verbally and in writing about the aims and procedures of the study,
and written informed consent was obtained from the person in charge before enrollment.
3. Results
Food consumption patterns of 415 children (51.1% boys and 48.9% girls) were analyzed, of
which 46.3% were urban and 53.7% were rural. Among these children, 24.0% were living in the
“extreme poor” HH (category 1), 16.9% in the “poor” HH (category 2), 14.5% in intermediate low HH
(category 3), 18.1% in intermediate high (category 4), and 26.5% in the “wealthiest” HH (category 5).
The children’s median energy intake from their diet was 871.2 Kcal/day, with a significant
difference between age groups (from 597.8 Kcal/day for children aged between 6 and 11.9 months, to
957.9 Kcal/day for children aged between 36 and 59.9 months). No significant differences were
observed when correlated for sex or residence (see Table 2) for all the intakes. Among age groups,
significantly higher quantities of protein and carbohydrates were consumed by older children versus
infants (for protein: 35.6 g/day vs. 22.7 g/day; p < 0.001, and for carbohydrates: 159.1 g/day vs.
69.6 g/day; p < 0.001). Differences can be observed also among socioeconomic groups, as less protein
and lipids were consumed by the poorest versus the wealthiest groups (for protein: 23.4 g/day vs.
36.3 g/day; p < 0.001, and for lipids: 9.4 g/day vs. 16.4 g/day; p < 0.001).
The median per capita per day consumption levels of iron, zinc, vitamin A (as retinol activity
equivalent), vitamin B1 and B2 from the diet were respectively: 4.8 mg, 4.3 mg, 182.8 µg, 0.5 mg and
0.3 mg (Table 2). Again, no significant differences were observed in median iron, zinc, vitamin A,
vitamin B1 and B2 when correlated against sex and residence, while significant differences were
noted for median iron, vitamin A, zinc, vitamin B1 and B2 between the two groups: age and
socioeconomic level.
As shown in Figure 1, using the VRDA and depending on the age group, the median intake of
children covers from 16.1% to 46.8% of the iron requirement, from 36.1% to 48.8% of the zinc
requirement, from 14.4% to 48.9% of the vitamin A requirement, from 80.0% to 100.0% of the
vitamin B1 requirement and from 50% to 66.7% of the vitamin B2 requirement.
Page 7
Nutrients 2012, 4 1157
Table 2. Macro- and micronutrient intake (in g/capita/day) by rural and urban residence, sex, age group and socioeconomic group
(median and 25th, 75th percentile) 1,2,3,4
.
n Energy
(Kcal) Protein (g) carbohydrates (g) Lipid (g) Iron (mg) Zinc (mg)
Vitamin A
(µg retinol activity
equivalent)
Vitamin B1
(mg)
Vitamin B2
(mg)
Total 415 871.2 (617.9; 1199.3) 33.1 (22.0; 45.0) 140.7 (101.3; 199.9) 15.4 (8.2; 23.8) 4.8 (3.1; 7.4) 4.3 (3.0; 6.2) 182.8 (40.0; 387.9) 0.5 (0.3; 0.7) 0.3 (0.2; 0.5)
Sex
Boy 212 884.2 (642.5; 1229.3) 34.7 (22.7; 46.0) 144.8 (103.5; 217.7) 16.3 (8.5; 23.8) 4.9 (3.2; 7.3) 4.5 (3.1; 6.5) 177.8 (40.3; 383.8) 0.5 (0.3; 0.7) 0.3 (0.2; 0.5)
Girl 203 830.3 (601.0; 1126.4) 32.3 (21.5; 44.8) 131.7 (97.3; 185.8) 14.3 (7.3; 23.8) 4.7 (2.9; 7.4) 4.2 (2.9; 6.1) 190.7 (37.1; 397.3) 0.5 (0.3; 0.7) 0.4 (0.2; 0.6)
p 2
p = 0.090 p = 0.373 p = 0.127 p = 0.179 p = 0.592 p = 0.113 p = 0.837 p = 0.392 p = 0.476
Age groups (month)
(6–11.9) 48 597.8 (327.4; 871.0) 22.7 (11.3; 36.0) 69.6 (37.8; 110.6) 11.5 (3.8; 21.6) 3.0 (1.6; 4.1) 3.0 (1.7; 6.1) 57.7 (4.5; 224.1) 0.3 (0.1; 0.7) 0.2 (0.1; 0.4)
(12–23.9) 97 760.7 (555.5; 1143.2) 27.2 (17.8; 40.9) 111.8 (82.3; 202.5) 14.9 (7.8; 23.4) 3.8 (2.4; 5.5) 4.0 (2.4; 5.7) 174.6 (49.4; 284.9) 0.4 (0.2; 0.8) 0.3 (0.1; 0.5)
(24–35.9) 94 883.2 (647.0; 1173.8) 34.7 (21.6; 45.5) 148.4 (117.0; 189.8) 14.4 (8.2; 25.7) 5.3 (3.6; 8.3) 4.1 (2.9; 6.2) 174.4 (39.5; 430.7) 0.4 (0.3; 0.7) 0.3 (0.2; 0.6)
(36–59.9) 176 957.9 (732.5; 1269.2) 35.6 (25.6; 48.5) 159.1 (118.6; 225.4) 16.3 (9.8; 23.7) 5.9 (4.2; 8.6) 4.7 (3.6; 7.0) 220.2 (78.1; 448.6) 0.6 (0.3; 0.8) 0.4 (0.2; 0.6)
p 2
p < 0.001 p < 0.001 p < 0.001 p = 0.159 p < 0.001 p < 0.001 p < 0.001 p < 0.01 p < 0.001
Category socioeconomic
Extremely poor 100 733.8 (578.0; 1039.7) 23.4 (17.9; 35.5) 139.3 (103.5; 192.6) 9.4 (3.0; 19.7) 3.9 (2.7; 5.8) 3.5 (2.2; 4.9) 121.8 (3.0; 273.5) 0.3 (0.2; 0.6) 0.2 (0.1; 0.4)
Poor 70 990.0 (737.8; 1225.0) 36.6 (25.5; 47.0) 161.1 (119.0; 250.8) 16.3 (11.6; 22.6) 5.4 (3.7; 7.2) 4.7 (3.5; 6.6) 199.9 (73.9; 449.4) 0.6 (0.3; 0.8) 0.4 (0.2; 0.6)
Intermediate low 60 883.2 (608.5; 1176.4) 34.8 (22.1; 48.0) 136.3 (101.4; 188.4) 16.2 (8.6; 26.8) 4.9 (2.7; 8.0) 4.6 (2.9; 6.4) 153.7 (32.9; 350.4) 0.5 (0.3; 0.8) 0.4 (0.1; 0.6)
Intermediate high 75 833.1 (551.7; 1247.3) 34.8 (23.5; 47.4) 132.7 (80.4; 173.3) 18.5 (8.9; 28.7) 5.0 (2.9; 8.2) 4.5 (2.9; 6.9) 259.9 (103.2; 430.7) 0.6 (0.3; 0.8) 0.4 (0.2; 0.6)
Wealthy 110 900.7 (686.3; 1248.0) 36.3 (25.4; 48.6) 134.9 (99.2; 214.0) 16.4 (10.0; 26.1) 5.1 (3.8; 8.1) 4.8 (3.3; 6.4) 186.7 (59.9; 430.3) 0.5 (0.3; 0.7) 0.4 (0.2; 0.6)
p 2
p < 0.01 p < 0.001 p = 0.148 p < 0.001 p < 0.01 p < 0.01 p < 0.001 p < 0.01 p < 0.001
Areas
Rural 223 916.7 (613.7; 1199.3) 32.8 (21.5; 44.1) 151.4 (99.9; 201.0) 16.1 (8.5; 23.6) 5.0 (3.2; 7.4) 4.3 (3.1; 6.4) 177.5(32.4; 372.0) 0.5 (0.3; 0.7) 0.3 (0.2; 0.5)
Urban 192 804.2 (625.5; 1209.0) 34.4 (22.4; 47.1) 132.9 (102.0; 197.4) 14.7 (8.0; 24.7) 4.7 (3.1; 7.3) 4.4 (2.9; 6.2) 183.3 (53.0; 401.0) 0.5 (0.3; 0.8) 0.3 (0.2; 0.6)
p 2 p = 0.363 p = 0.396 p = 0.354 p = 0.768 p = 0.988 p = 0.868 p = 0.308 p = 0.671 p = 0.271
1 median (25th percentile; 75th percentile); 2 test of Kruskal-Wallis or Mann-Whitney U-test on the median; 3 no data exists for folate in the Vietnamese food table; 4 not including intakes from breastfeeding.
Page 8
Nutrients 2012, 4 1158
Figure 1. Percentage of children achieving the VRDA for retinol, zinc, iron, vitamin B1
and vitamin B2 by age group.
Rice (Ri) was consumed daily by almost all children. Fish and soy sauces (S) were consumed by
half of the children, while wheat flour (WF) was consumed daily by less than one sixth of children and
vegetable oil (VO) by more than a third of children (Table 3).
Table 3. Percentage of Vietnamese children consuming selected food, by socioeconomic
status (quintile), sex, age groups and residence in the previous 24 h.
n Rice Wheat flour Vegetable oil Sauces
Socioeconomic status
Extremely poor 100 100.0% 19.0% 18.0% 47.0%
Poor 70 100.0% 15.7% 34.3% 54.3%
Intermediate low 60 96.7% 20.0% 41.7% 50.0%
Intermediate high 75 97.3% 12.0% 45.3% 50.7%
Wealthy 110 96.4% 15.5% 52.7% 52.7%
p 1
p < 0.05 ns p < 0.001 ns
Sex
Boys 212 100.0% 16.5% 41.5% 52.4%
Girls 203 96.6% 16.3% 35.0% 49.3%
p 1 p < 0.05 ns ns ns
Age groups (month)
(6–11.9) 48 91.7% 4.2% 45.8% 62.5%
(12–23.9) 97 100.0% 17.5% 28.9% 47.4%
(24–35.9) 94 96.8% 9.6% 38.3% 42.6%
(36–59.9) 176 100.0% 22.7% 41.5% 54.0%
p 1
p < 0.05 p < 0.01 ns ns
Areas
Rural 223 100.0% 18.8% 33.6% 51.1%
Urban 192 96.9% 13.5% 43.8% 50.5%
p 1 p < 0.05 ns p < 0.05 ns
Total population 415 98.6% 16.4% 38.3% 50.8%
Note: 1 Chi square test; ns: non-significant.
Page 9
Nutrients 2012, 4 1159
The proportion of children consuming vegetable oil and rice significantly differed by
socioeconomic status, as the proportion of poor children consuming VO is less as compared to the
wealthiest groups of children while it is the opposite for rice consumption. The proportion of children
consuming sauces and wheat flour did not differ among socioeconomic groups. Analyses of different
combinations of food vehicles showed that from the age of 6 months, 45.8% to 61.0% of the children
were consuming on a daily basis VO-Ri while between 20.8% and 30.2% of the children were
consuming VO-S on a daily basis. The other combinations (WF-VO; Ri-WF-VO-S; WF-VO-S) were
consumed daily by less than 10% of the children (from 1.1% to 9.4%). Vitamin A fortification of
vegetable oil has been shown to be the most cost-effective, simple-to-implement strategy [41] and
therefore VO was the choice in the different combination to increase the vitamin A intake.
Among consumers, the median consumption of rice, wheat flour, vegetable oil and sauces for
children was 170 g/day, 43 g/day, 6 g/day and 4 g/day respectively (Table 4). The median consumption
of rice and sauces varied significantly among different age groups while vegetable oil varied among
residence (rural/urban).
Table 4. Median consumption (25th percentile; 75th percentile) for consumers of selected
foods by socioeconomic status, sex, age groups and residence (in g/capita/day) 1.
n Rice n Wheat flour n Vegetable oil n Sauces
Total 408 170.0 (110.0; 250.0) 68 43.0 (14.3; 76.0) 159 6.0 (3.0; 10.0) 211 4.0 (2.0; 9.0)
Sex
Boy 212 180.0 (120.0; 263.0) 35 50.0 (15.0; 80.0) 88 6.0 (3.0; 10.0) 111 4.0 (2.0; 8.0)
Girl 196 157.0 (104.0; 240.0) 33 35.0 (12.5; 75.5) 71 6.0 (3.0; 9.0) 100 4.5 (2.5; 9.0)
p 2 p = 0.150 p = 0.507 p = 0.583 p = 0.926
Category socioeconomic
Extremely poor 100 165.0 (111.8; 243.0) 19 50.0 (14.0; 76.0) 18 5.0 (3.0; 9.8) 47 4.0 (2.0; 7.0)
Poor 70 204.4 (126.0; 295.0) 11 40.0 (12.0; 110.0) 24 6.5 (4.0; 11.5) 38 5.0 (2.0; 10.5)
Intermediate low 58 170.0 (117.8; 254.0) 12 45.0 (15.6; 92.8) 25 5.0 (3.0; 9.0) 30 6.0 (2.0; 8.3)
Intermediate high 73 150.0 (100.0; 219.0) 9 35.0 (12.0; 51.5) 34 6.0 (4.0; 9.3) 38 5.0 (3.0; 9.0)
Wealthy 106 164.0 (108.8; 247.8) 17 50.0 (18.5; 67.5) 58 5.5 (3.0; 10.6) 58 4.0 (2.0; 9.5)
p 2 p = 0.168 p = 0.813 p = 0.661 p = 0.683
Age groups (month)
(6–11.9) 44 70.0 (47.5; 120.0) 2 6.0 (6.0; 6.0) 22 5.5 (2.0; 15.0) 30 2.5 (2.0; 7.5)
(12–23.9) 97 125.0 (93.5; 250.0) 17 40.0 (16.0; 75.5) 28 6.0 (3.3; 13.2) 46 4.0 (2.0; 6.0)
(24–35.9) 91 185.0 (124.0; 230.0) 9 50.0 (23.5; 88.8) 36 5.5 (4.0; 9.8) 40 3.5 (1.6; 8.8)
(36–59.9) 176 195.0 (136.5; 284.5) 40 47.0 (12.8; 84.5) 73 6.0 (3.0; 9.0) 95 5.0 (3.0; 10.0)
p 2 p < 0.001 p = 0.150 p = 0.864 p < 0.05
Areas
Rural 223 175.0 (105.0; 270.0) 42 47.5 (19.5; 81.9) 75 6.0 (3.0; 15.0) 114 5.0 (2.0; 11.3)
Urban 186 167.5 (114.8; 247.8) 26 35.0 (12.0; 71.3) 84 5.0 (3.0; 9.0) 97 4.0 (2.0; 7.0)
p 2 p = 0.883 p = 0.167 p < 0.05 p = 0.196
1 median (25th percentile; 75th percentile); 2 test of Kruskal-Wallis or Mann-Whitney U-test on the median.
Page 10
Nutrients 2012, 4
The oldest children consumed
(195 g/capita/day and 5 g/capita/day
rural children consumed significantly
5.0 g, p < 0.05). No significant difference
oil, wheat flour and sauces among
children consuming vegetable oil
socioeconomic status (Table 3).
Estimates of the amounts of iron,
food vehicles (Ri, WF, VO and S)
their age were calculated in Table 5
Table 5. Estimated daily
amounts and proposed fortification levels
Nutrient
Age
groups
Fortified wheat flour
Iron
(mg/day)
Zinc
(mg/day) (µ
(6–11.9) 0.2 (0.2–0.2) 0.3 (0.3–0.3) 26
(12–23.9) 1.5 (0.6–2.9) 1.9 (0.8–3.6) 170
(24–35.9) 1.9 (0.9–3.4) 2.4 (1.1–4.2) 213
(36–59.9) 1.8 (0.5–3.2) 2.2 (0.6–4.0) 200
1 Values are medians (25th and 75th percentiles);
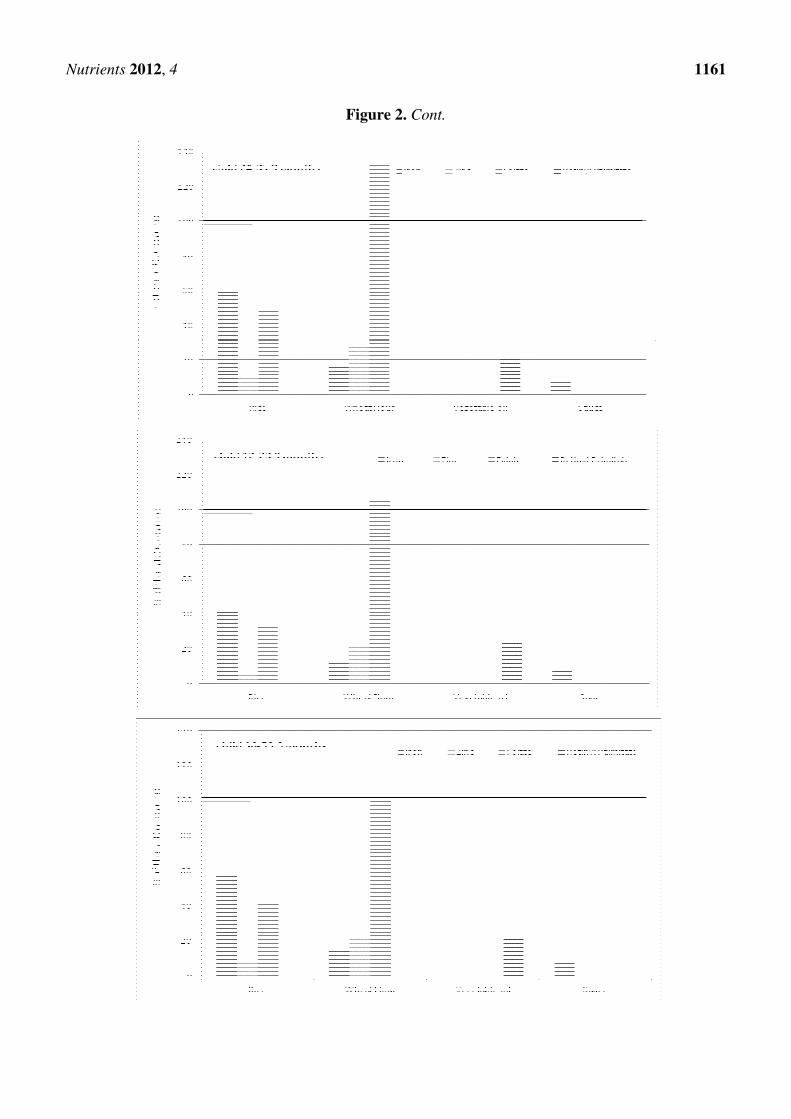
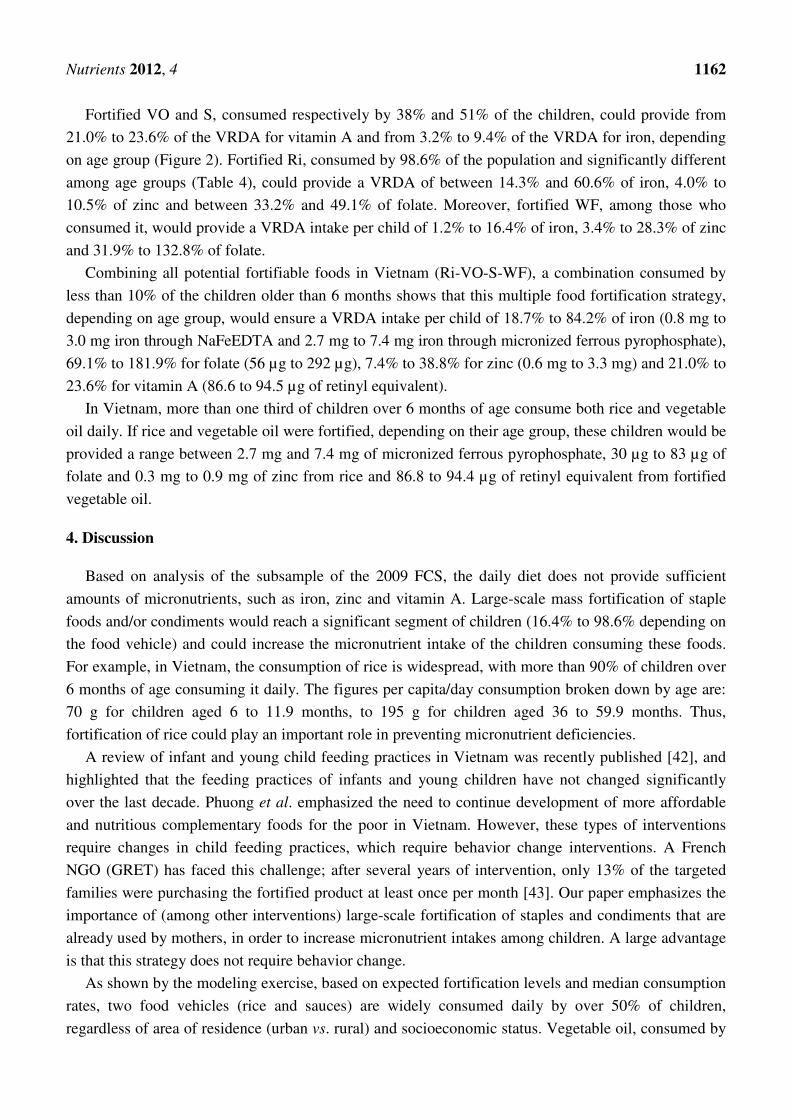
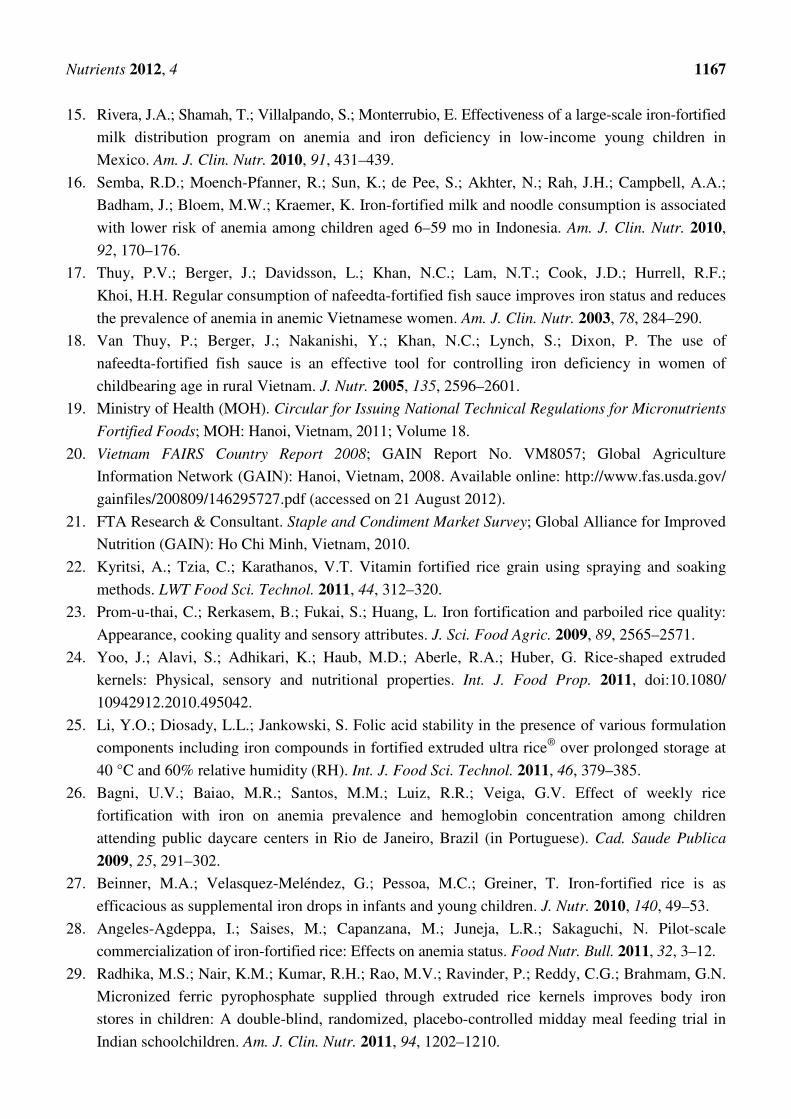
Figure 2. Percentage of VRDA
consumed fortified food vehicles
ed significantly more rice (p < 0.001) and
g/capita/day respectively) than most of the other age groups.
significantly more than those living in urban
difference was shown for the median consumption
among socioeconomic groups (Table 4), even though
oil significantly tended (p < 0.01) to increase
iron, folic acid, zinc and vitamin A provided
S) and the contribution to the daily VRDA for
5 and Figure 2.
contribution from individual fortified foods
and proposed fortification levels consumed daily by children) 1,2
.
Nutrient contribution per child from individual food fortification
Fortified
sauces
Fortified
vegetable oil
Folate
µg/day)
Iron
(mg/day)
Retinyl palmitate
(µg RAE/day)
Iron
(mg/day)
26 (26–26) 0.6 (0.5–1.8) 86.6 (31.5–236.3) 2.7 (1.8–4.6)
170 (68–321) 1.0 (0.5–1.4) 94.5 (52.0–207.9) 4.8 (3.6–9.5)
(100–377) 0.8 (0.4–2.1) 86.6 (63.0–154.4) 7.0 (4.7–8.7)
200 (54–359) 1.2 (0.7–2.4) 94.5 (47.3–141.8) 7.4 (5.2–10.8)
percentiles); 2 assuming 5% losses for iron, 30% losses for retinyl palmitate
VRDA for retinol, zinc, iron and folate contributed
vehicles.
1160
and sauces (p < 0.05)
groups. For vegetable oil,
urban areas (6.0 g versus
consumption of rice, vegetable
though the percentage of
increase with increasing
provided by individual fortified
for children depending on
foods (using median
.
fortification
Fortified rice
Zinc
(mg/day)
Folate
(µg/day)
4.6) 0.3 (0.2–0.6) 30 (20–51)
9.5) 0.6 (0.4–1.2) 53 (40–106)
8.7) 0.9 (0.6–1.1) 79 (53–98)
10.8) 0.9 (0.6–1.4) 83 (58–121)
palmitate and 5% losses for zinc.
contributed by potential
Page 11
Nutrients 2012, 4
Figure 2. Cont.
1161
Page 12
Nutrients 2012, 4 1162
Fortified VO and S, consumed respectively by 38% and 51% of the children, could provide from
21.0% to 23.6% of the VRDA for vitamin A and from 3.2% to 9.4% of the VRDA for iron, depending
on age group (Figure 2). Fortified Ri, consumed by 98.6% of the population and significantly different
among age groups (Table 4), could provide a VRDA of between 14.3% and 60.6% of iron, 4.0% to
10.5% of zinc and between 33.2% and 49.1% of folate. Moreover, fortified WF, among those who
consumed it, would provide a VRDA intake per child of 1.2% to 16.4% of iron, 3.4% to 28.3% of zinc
and 31.9% to 132.8% of folate.
Combining all potential fortifiable foods in Vietnam (Ri-VO-S-WF), a combination consumed by
less than 10% of the children older than 6 months shows that this multiple food fortification strategy,
depending on age group, would ensure a VRDA intake per child of 18.7% to 84.2% of iron (0.8 mg to
3.0 mg iron through NaFeEDTA and 2.7 mg to 7.4 mg iron through micronized ferrous pyrophosphate),
69.1% to 181.9% for folate (56 µg to 292 µg), 7.4% to 38.8% for zinc (0.6 mg to 3.3 mg) and 21.0% to
23.6% for vitamin A (86.6 to 94.5 µg of retinyl equivalent).
In Vietnam, more than one third of children over 6 months of age consume both rice and vegetable
oil daily. If rice and vegetable oil were fortified, depending on their age group, these children would be
provided a range between 2.7 mg and 7.4 mg of micronized ferrous pyrophosphate, 30 µg to 83 µg of
folate and 0.3 mg to 0.9 mg of zinc from rice and 86.8 to 94.4 µg of retinyl equivalent from fortified
vegetable oil.
4. Discussion
Based on analysis of the subsample of the 2009 FCS, the daily diet does not provide sufficient
amounts of micronutrients, such as iron, zinc and vitamin A. Large-scale mass fortification of staple
foods and/or condiments would reach a significant segment of children (16.4% to 98.6% depending on
the food vehicle) and could increase the micronutrient intake of the children consuming these foods.
For example, in Vietnam, the consumption of rice is widespread, with more than 90% of children over
6 months of age consuming it daily. The figures per capita/day consumption broken down by age are:
70 g for children aged 6 to 11.9 months, to 195 g for children aged 36 to 59.9 months. Thus,
fortification of rice could play an important role in preventing micronutrient deficiencies.
A review of infant and young child feeding practices in Vietnam was recently published [42], and
highlighted that the feeding practices of infants and young children have not changed significantly
over the last decade. Phuong et al. emphasized the need to continue development of more affordable
and nutritious complementary foods for the poor in Vietnam. However, these types of interventions
require changes in child feeding practices, which require behavior change interventions. A French
NGO (GRET) has faced this challenge; after several years of intervention, only 13% of the targeted
families were purchasing the fortified product at least once per month [43]. Our paper emphasizes the
importance of (among other interventions) large-scale fortification of staples and condiments that are
already used by mothers, in order to increase micronutrient intakes among children. A large advantage
is that this strategy does not require behavior change.
As shown by the modeling exercise, based on expected fortification levels and median consumption
rates, two food vehicles (rice and sauces) are widely consumed daily by over 50% of children,
regardless of area of residence (urban vs. rural) and socioeconomic status. Vegetable oil, consumed by
Page 13
Nutrients 2012, 4 1163
more than a third of the children, is also a good vehicle to increase the intake of retinyl palmitate.
Therefore, their fortification should be one of the priorities for stakeholders. This would contribute to
filling the gap of micronutrient intake as measured through the 24-h recall (Figure 1). Unfortunately,
the Vietnamese food composition tables do not provide reliable information on other nutrients (such as
vitamin B12 and folate) to generate a more complete overview of gaps in micronutrient intake in
vulnerable groups.
4.1. Vegetable Oil Fortification: A Solution for Additional Vitamin A Intake and Possibly
Vitamin D Intake
The 2010 MNS [9] showed that 11.8% of children under two years of age and 11.9% of the children
between 2 and 5 years of age were VAD deficient. More than half of children had a marginal or
deficient vitamin A status. Vitamin A is a vital nutrient for the functioning of the immune system as well
as for the healthy growth and development of children [44]. This high prevalence of marginal vitamin A
status would suggest that efforts to prevent vitamin A deficiency have to be maintained and even
strengthened, especially for children under the age of two. A diverse diet rich in animal food sources
that contain preformed vitamin A can be sufficient to meet the daily requirement for vitamin A [45].
However, with the inflation of food prices in developing countries such as Vietnam [46], studies show
that populations prioritize calorie-rich but nutritionally poor foods [47,48]. As highlighted in this
study, the current diet, according to age groups, provides 14.4% to 48.9% of the retinol requirement.
Eliminating or preventing vitamin A deficiency through vitamin A supplementation has also been
the focus of universal efforts and needs to continue. However, when reviewing the sustainability of the
increase in serum retinol concentration following a periodic provision of high doses of vitamin A, the
literature reveals mixed results. Two studies in the Philippines and India show that the effect of high
dose vitamin A capsules lasts between 2 and 3 months with no impact after 6 months. [49,50]. This
would suggest that other complementary types of interventions, such as food fortification, are necessary,
as supplementation alone appears to be insufficient for maintaining nutritional reserves beyond
3 months. Fortification of vegetable oil with vitamin A is considered a cost-effective and easily
implementable strategy [41]. Retinyl palmitate is the most commonly used vitamin A fortificant, and has
been used successfully to fortify sugar, monosodium glutamate, and wheat flour, in addition to cooking
oil [51–53]. If vegetable oil were to be fortified, it would contribute between 21% and 23.6% of the
VRDA for children because of its widespread consumption.
In addition, studies among Asian children and African American teenagers also suggested that low
dietary intakes of calcium result in increased catabolism of vitamin D and the development of vitamin D
deficiency and rickets [54]. Unfortunately, no published data exist on the deficiency of vitamin D
among children in Vietnam. According to the 2010 MNS (personal communication[55]), more than
50% of children were vitamin D deficient (below 50 nmol/L [56]), and more than 30% with
“insufficient” levels (circulating 25(OH)D between 51 and 74 nmol/L [56]). This preliminary data
indicates that prevention of vitamin D deficiency in children is a public health priority that needs to be
addressed through appropriate interventions. Vegetable oil may be a suitable vehicle for fortification
with vitamin D, as well as retinyl palmitate, however this proposal would require further dietary
modelling within the Vietnamese context.
Page 14
Nutrients 2012, 4 1164
4.2. Rice and Sauces Fortification to Increase Zinc, Iron and Folate Intakes
The latest 2010 MNS study highlighted that over 25% of children had low iron stores [9]. Recent
reviews suggest that iron deficiencies in early life have persistent negative effects later in life [57,58].
The fortification of rice has proven to be effective in improving iron status for children (between 6 and
13 years old) in India when the fortified rice was provided, containing at least 17 mg to 19 mg iron
through micronized ferrous pyrophosphate [29,59]. In Vietnam, where the diet provides approximately
4.8 mg of iron, if children age 6 to 59.9 months consumed fortified rice with micronized ferrous
phosphate and sauces with NaFeEDTA, those products could provide, depending on the age groups,
ranges of 2.7 mg to 7.4 mg, and 0.6 mg to 1.2 mg respectively. This additional intake of iron is not
negligible, as NaFeEDTA is known to enhance the absorption of both the intrinsic food iron [60] and
iron used in other fortified foods, and thus may have a beneficial effect on overall iron absorption from
the diet.
According to the analysis, the Vietnamese diet provides over 40% of VRDA of zinc to children; in
addition, almost 52% of children [9] are considered zinc deficient, based on the actual serum zinc
cut-off. Fortified rice would be able to provide zinc, and no adverse effects have been shown from zinc
fortification [61]. The United States Food and Nutrition Board of the Institute of Medicine estimated
the upper limit (UL) for zinc to be 7 mg of zinc for children 1–3 years and 12 mg for children
4–8 years [39]. The combination of the current diet and the fortification of rice would provide a
maximum of between 6.7 and 7.3 mg of zinc for children between 1 and 3 years, and 8.4 mg for
children between 4 and 6 years of age (considering a median consumption of rice and zinc consumption
through the diet at the 75th percentile level, the worst scenario). Therefore, research is needed to
estimate the optimal quantity of zinc to be added through fortification of staples and condiments.
For folate, the Vietnamese food composition tables do not provide sufficient information. Children
consuming rice at the 75th percentile level would consume an additional 51 µg to 121 µg of folate
which is far from the UL estimated for children 1–3 years (300 µg) and for children 4–8 years
(400 µg) [39].
Rice fortification is currently attracting more attention and stakeholders, together with international
agencies, are trying to develop models to create a sustainable market in a rice producing country. In
addition, new technologies introducing fortified rice through village rice millers are now available and
could be a solution in Vietnam [62].
4.3. Wheat Flour Fortification to Increase Zinc, Iron and Folate Intakes: A Possibility but Not a Priority
Wheat flour fortification is more logistically feasible than rice fortification because there are only
20 flourmills in Vietnam using imported wheat flour. In addition, wheat flour is often fortified around
the world. Wheat flour fortification could provide multiple micronutrients at the same time, such as
iron, zinc and folic acid. Unfortunately, the downside of flour fortification is that it will not reach most
of the Vietnamese population, regardless of socioeconomic status, sex and residence. The reason,
according to the survey, is that between 75% and 80% of children do not consume wheat flour. So, if
the percentages of wheat flour consumers among the extreme poor (19.0%) and all children (16.4%),
are taken into account, little impact on rates of deficiencies through this vehicle would be expected.
Page 15
Nutrients 2012, 4 1165
Even if wheat flour were to be fortified in Vietnam, it is essential to evaluate the risk for reaching
the UL for a population that, in the future, might be eating rice, wheat flour and sauces. For example, if
we consider children aged between 24 and 35.9 months who consume rice, wheat flour and sauce at
the 75th percentile level, fortification of all these food vehicles could provide 14.2 mg of iron, 5.3 mg
of zinc and 475 µg of folate. It may also be taken into account that zinc bioavailability from rice may
be higher compared to that of wheat flour, because of the lower inhibitory effect of phytate on zinc
(higher molar ratio before absorption is inhibited). The combination of the current diet and the
fortification of food vehicles would provide nutrients of 22.5 mg i.e., below the 40 mg UL for iron for
children 1–3 years, but unfortunately, could be above the UL for zinc (11.5 mg vs. a UL of 7 mg). Zinc
is a nutrient that is likely to exceed the UL if fortification of wheat flour were to be implemented, and
further modeling is required in this regard.
4.4. Limitations of the Study
The population analyzed for this article is a subsample of the FCS sample that was also used for the
MNS [9]. However, this subsample has not biased the results, as similar findings from the dietary intake
of energy, macronutrients and micronutrients were found among the 7980 households surveyed [63].
The 24-h recall data provided single day consumption and therefore the percentage of children
consuming may be underestimated, because those that did not consume on the day before the interview
may consume another day that week. In addition, the average intake among consumers might be
overestimated because it is assumed that the intake on the previous day represents average daily intake,
whereas consumption may not take place every day. Finally, the 24-h recall does not capture seasonal
variation, such as the consumption of different fruits rich in various micronutrients, or nutrients
provided from breast milk.
5. Conclusions
When developing strategies for young children to prevent micronutrient deficiencies, it is important
to estimate the potential contribution from a large-scale food fortification program to micronutrient
intakes. The results of this study show that fortification of rice, sauces and vegetable oil that are
consumed daily by a large proportion of Vietnamese children would be an effective strategy to reduce
micronutrient deficiencies, whereas fortification of other vehicles, such as wheat flour, would have less
impact on improving the micronutrient status of vulnerable populations.
Acknowledgments
We would like to thank NIN for their support during the study. This study is part of a fortification
project implemented in Vietnam with the support of the Bill and Melinda Gates Foundation and the
Department for International Development (DFID). All authors read and approved the final manuscript.
Conflict of Interest
The authors declare no conflicts of interest. The authors are neither directly nor indirectly affiliated
with any profit-making units that may create a conflict of interest.
Page 16
Nutrients 2012, 4 1166
References
1. Black, R.E.; Allen, L.H.; Bhutta, Z.A.; Caulfield, L.E.; de Onis, M.; Ezzati, M.; Mathers, C.;
Rivera, J. Maternal and child undernutrition: Global and regional exposures and health
consequences. Lancet 2008, 371, 243–260.
2. Victora, C.G.; Adair, L.; Fall, C.; Hallal, P.C.; Martorell, R.; Richter, L.; Sachdev, H.S. Maternal
and child undernutrition: Consequences for adult health and human capital. Lancet 2008, 371,
340–357.
3. World Health Organization (WHO). Global Prevalence of Vitamin A Deficiency in Populations at
Risk 1995–2005; WHO: Geneva, Switzerland, 2009.
4. Sanghvi, T.; van Ameringen, M.; Baker, J.; Fiedler, J.; Borwankar, R.; Phillips, M.; Houston, R.;
Ross, J.; Heymann, H.; Dary, O. Vitamin and mineral deficiencies technical situation analysis: A
report for the ten year strategy for the reduction of vitamin and mineral deficiencies. Food Nutr.
Bull. 2007, 28, S160–S219.
5. Fischer Walker, C.L.; Ezzati, M.; Black, R.E. Global and regional child mortality and burden of
disease attributable to zinc deficiency. Eur. J. Clin. Nutr. 2009, 63, 591–597.
6. Nga, T.T.; Winichagoon, P.; Dijkhuizen, M.A.; Khan, N.C.; Wasantwisut, E.; Furr, H.;
Wieringa, F.T. Multi-micronutrient-fortified biscuits decreased prevalence of anemia and
improved micronutrient status and effectiveness of deworming in rural Vietnamese school
children. J. Nutr. 2009, 139, 1013–1021.
7. Lien do, T.K.; Nhung, B.T.; Khan, N.C.; Hop le, T.; Nga, N.T.; Hung, N.T.; Kiers, J.; Shigeru,
Y.; te Biesebeke, R. Impact of milk consumption on performance and health of primary school
children in rural vietnam. Asia Pac. J. Clin. Nutr. 2009, 18, 326–334.
8. Nhien, N.V.; Khan, N.C.; Ninh, N.X. Micronutrient deficiencies and anemia among preschool
children in rural Vietnam. Asia Pac. J. Clin. Nutr. 2008, 17, 48–55.
9. Laillou, A.; Pham, T.V.; Tran, N.T.; Le, H.T.; Wieringa, F.; Rohner, F.; Fortin, S.; Le, M.B.;
Tran do, T.; Moench-Pfanner, R.; et al. Micronutrient deficits are still public health issues among
women and young children in vietnam. PLoS One 2012, 7, e34906.
10. Young Child Nutrition Working Group: Formulation Subgroup. Formulations for fortified
complementary foods and supplements: Review of successful products for improving the
nutritional status of infants and young children. Food Nutr. Bull. 2009, 30, S239–S255.
11. Nguyen, P.H.; Menon, P.; Ruel, M.; Hajeebhoy, N. A situational review of infant and young child
feeding practices and interventions in Viet Nam. Asia Pac. J. Clin. Nutr. 2011, 20, 359–374.
12. Ministry of Health. Plan of Action for Infant and Young Child Feeding Period 2006–2010;
Ministry of Health: Hanoi, Vietnam, 2006.
13. National Institute of Nutrition; General Statistic Office. The Progress of Malnutrition Reduction
among Children under 5 Years old and Their Mothers. Impact of Nutritional Intervention
Programmes in Vietnam 1999–2004; Statistical Publishing House: Hanoi, Vietnam, 2005.
14. Sazawal, S.; Dhingra, U.; Dhingra, P.; Hiremath, G.; Sarkar, A.; Dutta, A.; Menon, V.P.;
Black, R.E. Micronutrient fortified milk improves iron status, anemia and growth among children
1–4 years: A double masked, randomized, controlled trial. PLoS One 2010, 5, e12167.
Page 17
Nutrients 2012, 4 1167
15. Rivera, J.A.; Shamah, T.; Villalpando, S.; Monterrubio, E. Effectiveness of a large-scale iron-fortified
milk distribution program on anemia and iron deficiency in low-income young children in
Mexico. Am. J. Clin. Nutr. 2010, 91, 431–439.
16. Semba, R.D.; Moench-Pfanner, R.; Sun, K.; de Pee, S.; Akhter, N.; Rah, J.H.; Campbell, A.A.;
Badham, J.; Bloem, M.W.; Kraemer, K. Iron-fortified milk and noodle consumption is associated
with lower risk of anemia among children aged 6–59 mo in Indonesia. Am. J. Clin. Nutr. 2010,
92, 170–176.
17. Thuy, P.V.; Berger, J.; Davidsson, L.; Khan, N.C.; Lam, N.T.; Cook, J.D.; Hurrell, R.F.;
Khoi, H.H. Regular consumption of nafeedta-fortified fish sauce improves iron status and reduces
the prevalence of anemia in anemic Vietnamese women. Am. J. Clin. Nutr. 2003, 78, 284–290.
18. Van Thuy, P.; Berger, J.; Nakanishi, Y.; Khan, N.C.; Lynch, S.; Dixon, P. The use of
nafeedta-fortified fish sauce is an effective tool for controlling iron deficiency in women of
childbearing age in rural Vietnam. J. Nutr. 2005, 135, 2596–2601.
19. Ministry of Health (MOH). Circular for Issuing National Technical Regulations for Micronutrients
Fortified Foods; MOH: Hanoi, Vietnam, 2011; Volume 18.
20. Vietnam FAIRS Country Report 2008; GAIN Report No. VM8057; Global Agriculture
Information Network (GAIN): Hanoi, Vietnam, 2008. Available online: http://www.fas.usda.gov/
gainfiles/200809/146295727.pdf (accessed on 21 August 2012).
21. FTA Research & Consultant. Staple and Condiment Market Survey; Global Alliance for Improved
Nutrition (GAIN): Ho Chi Minh, Vietnam, 2010.
22. Kyritsi, A.; Tzia, C.; Karathanos, V.T. Vitamin fortified rice grain using spraying and soaking
methods. LWT Food Sci. Technol. 2011, 44, 312–320.
23. Prom-u-thai, C.; Rerkasem, B.; Fukai, S.; Huang, L. Iron fortification and parboiled rice quality:
Appearance, cooking quality and sensory attributes. J. Sci. Food Agric. 2009, 89, 2565–2571.
24. Yoo, J.; Alavi, S.; Adhikari, K.; Haub, M.D.; Aberle, R.A.; Huber, G. Rice-shaped extruded
kernels: Physical, sensory and nutritional properties. Int. J. Food Prop. 2011, doi:10.1080/
10942912.2010.495042.
25. Li, Y.O.; Diosady, L.L.; Jankowski, S. Folic acid stability in the presence of various formulation
components including iron compounds in fortified extruded ultra rice®
over prolonged storage at
40 °C and 60% relative humidity (RH). Int. J. Food Sci. Technol. 2011, 46, 379–385.
26. Bagni, U.V.; Baiao, M.R.; Santos, M.M.; Luiz, R.R.; Veiga, G.V. Effect of weekly rice
fortification with iron on anemia prevalence and hemoglobin concentration among children
attending public daycare centers in Rio de Janeiro, Brazil (in Portuguese). Cad. Saude Publica
2009, 25, 291–302.
27. Beinner, M.A.; Velasquez-Meléndez, G.; Pessoa, M.C.; Greiner, T. Iron-fortified rice is as
efficacious as supplemental iron drops in infants and young children. J. Nutr. 2010, 140, 49–53.
28. Angeles-Agdeppa, I.; Saises, M.; Capanzana, M.; Juneja, L.R.; Sakaguchi, N. Pilot-scale
commercialization of iron-fortified rice: Effects on anemia status. Food Nutr. Bull. 2011, 32, 3–12.
29. Radhika, M.S.; Nair, K.M.; Kumar, R.H.; Rao, M.V.; Ravinder, P.; Reddy, C.G.; Brahmam, G.N.
Micronized ferric pyrophosphate supplied through extruded rice kernels improves body iron
stores in children: A double-blind, randomized, placebo-controlled midday meal feeding trial in
Indian schoolchildren. Am. J. Clin. Nutr. 2011, 94, 1202–1210.
Page 18
Nutrients 2012, 4 1168
30. Le Hung, Q.; de Vries, P.J.; Giao, P.T.; Binh, T.Q.; Nam, N.V.; Kager, P.A. Anemia, malaria and
hookworm infections in a Vietnamese ethnic minority. Southeast Asian J. Trop. Med. Public
Health 2005, 36, 816–821.
31. Dop, M.C.; Le, B.M.; Laillou, A.; Sénémaud, B.; Nguyen, C.K.; Khoi, H.H. Validation of
the 24-hour Recall against the Weighing Method at Household Level-Advantage of Comparing
Methods on the Same and Separate Days: A Case Study from Vietnam. In Proceedings of
Fourth International Conference on Dietary Assessment Methods, Tucson, AZ, USA,
17–20 September 2000.
32. Rustein, S.O.; Johnson, K. The DHS Wealth Index; DHS Comperative Reports No. 6; ORC Macro:
Calverton, MD, USA, 2004.
33. Rutstein, S. The DHS wealth index: Approaches for rural and urban areas. Available online:
http://www.iywg.org/ar/popline/dhs-wealth-index-approaches-rural-and-urban-areas (accessed on
15 February 2012).
34. World Health Organization. Recommendations on Wheat and Maize Flour Fortification. Meeting
Report: Interim Consensus Statement; WHO: Geneva, Switzerland, 2009.
35. Chavasit, V.; Nopburabutr, P.; Kongkachuichai, R. Combating iodine and iron deficiencies
through the double fortification of fish sauce, mixed fish sauce, and salt brine. Food Nutr. Bull.
2003, 24, 200–207.
36. Ministry of Health; National Institute of Nutrition. General Nutrition Survey; Medical Publishing
House: Hanoi, Vietnam, 2000.
37. Thuy, P.V.; Nga, T.T. Vietnam National Micronutrient Survey, 2010; National Institute of
Nutrition: Hanoi, Vietnam, 2011.
38. Khan, N.C.; Hoan, P.V. Vietnam recommended dietary allowances 2007. Asia Pac. J. Clin. Nutr.
2008, 17, S409–S415.
39. Allen, L.; de Benoist, B.; Dray, O.; Hurrell, R. Guidelines on Food Fortification with
Micronutrients; World Health Organization: Geneva, Switzerland, 2006.
40. Ministry of Public Health; National Institute of Nutrition. Nutritive Composition Table of
Vietnamese Food; Medical Publishing House: Hanoi, Vietnam, 2000.
41. West, K.P.J.; Darnton-Hill, I. Vitamin A Deficiency. In Nutrition and Health in Developing
Countries, 2nd ed.; Humana Press: New York, NY, USA, 2008; pp. 377–433.
42. Phuong, H.; Menon, P.; Ruel, M.; Hajeebhoy, N. A situational review of infant and young child
feeding practices and interventions in Viet Nam. Asia Pac. J. Clin. Nutr. 2011, 20, 359–374.
43. Bruyeron, O.; Denizeau, M.; Berger, J.; Treche, S. Marketing complementary foods and
supplements in Burkina Faso, Madagascar, and Vietnam: Lessons learned from the Nutridev
program. Food Nutr. Bull. 2010, 31, S154–S167.
44. Garcia-Casal, M.N.; Layrisse, M.; Solano, L.; Baron, M.A.; Arguello, F.; Llovera, D.; Ramirez, J.;
Leets, I.; Tropper, E. Vitamin A and beta-carotene can improve nonheme iron absorption from
rice, wheat and corn by humans. J. Nutr. 1998, 128, 646–650.
45. Dary, O.; Mora, J.O. Food fortification to reduce vitamin A deficiency: International vitamin A
consultative group recommendations. J. Nutr. 2002, 132, 2927S–2933S.
Page 19
Nutrients 2012, 4 1169
46. United Nations Economic and Social Commission for Asia and the Pacific (ESCAP). Rising Food
Prices and Inflation in the Asia-Pacific Region: Causes, Impact and Policy Response; MPDD
policy briefs No. 7; March 2011. Available online: http://www.unescap.org/pdd/publications/
me_brief/mpdd-pb-7.pdf (accessed on 11 January 2012).
47. Bloem, M.W.; Semba, R.D.; Kraemer, K. Castel gandolfo workshop: An introduction to the
impact of climate change, the economic crisis, and the increase in the food prices on malnutrition.
J. Nutr. 2010, 140, 132S–135S.
48. West, K.P., Jr.; Mehra, S. Vitamin A intake and status in populations facing economic stress.
J. Nutr. 2010, 140, 201S–207S.
49. Pereira, S.M.; Begum, A. Prevention of vitamin A deficiency. Am. J. Clin. Nutr. 1969, 22, 858–862.
50. Perlas, L.A.; Florentino, R.F.; Fuertes, R.T.; Madriaga, J.R.; Cheong, R.L.; Desnacido, J.A.;
Marcos, J.M.; Cabrera, M.I. Vitamin A status of filipino preschool children given a massive oral
dose. Southeast Asian J. Trop. Med. Public Health 1996, 27, 785–791.
51. Arroyave, G.; Mejia, L.A.; Aguilar, J.R. The effect of vitamin A fortification of sugar on the
serum vitamin A levels of preschool Guatemalan children: A longitudinal evaluation. Am. J. Clin.
Nutr. 1981, 34, 41–49.
52. Muhilal; Permeisih, D.; Idjradinata, Y.R.; Muherdiyantiningsih; Karyadi, D. Vitamin A-fortified
monosodium glutamate and health, growth, and survival of children: A controlled field trial. Am.
J. Clin. Nutr. 1988, 48, 1271–1276.
53. Favaro, R.; Ferreira, J.; Desai, I.; de Oliveira, J.D. Studies on fortification of refined soybean oil
with all-trans retinyl palmitate in Brazil: Stability during cooking and storage. J. Food Comp.
Anal. 1991, 4, 237–244.
54. Pettifor, J.M. Nutritional rickets: Deficiency of vitamin D, calcium, or both? Am. J. Clin. Nutr.
2004, 80, 1725S–1729S.
55. Laillou, A.; Wieringa, F.; Nga, T.T.; Thuy, P.V.; Mai, L.B.; Fortin, S.; Hop, L.T.;
Moench-Pfanner, R.; Berger, J. Calcium and Vitamin D Deficiency among Rural and Urban
Vietnamese Preschool Children and Women of Reproductive Age. In World Summit of Nutrition;
World Public Health Association: Rio De Janeiro, Brazil, 2012.
56. Holick, M.F.; Chen, T.C. Vitamin D deficiency: A worldwide problem with health consequences.
Am. J. Clin. Nutr. 2008, 87, 1080S–1086S.
57. Beard, J. Recent evidence from human and animal studies regarding iron status and infant
development. J. Nutr. 2007, 137, 524S–530S.
58. Lozoff, B.; Beard, J.; Connor, J.; Barbara, F.; Georgieff, M.; Schallert, T. Long-lasting neural and
behavioral effects of iron deficiency in infancy. Nutr. Rev. 2006, 64, S34–S43; discussion S72–S91.
59. Moretti, D.; Zimmermann, M.B.; Muthayya, S.; Thankachan, P.; Lee, T.C.; Kurpad, A.V.;
Hurrell, R.F. Extruded rice fortified with micronized ground ferric pyrophosphate reduces iron
deficiency in Indian schoolchildren: A double-blind randomized controlled trial. Am. J. Clin.
Nutr. 2006, 84, 822–829.
60. MacPhail, A.P.; Patel, R.C.; Bothwell, T.H.; Lamparelli, R.D. EDTA and the absorption of iron
from food. Am. J. Clin. Nutr. 1994, 59, 644–648.
61. Brown, K.H.; Hambidge, K.M.; Ranum, P. Zinc fortification of cereal flours: Current
recommendations and research needs. Food Nutr. Bull. 2010, 31, 62S–74S.
Page 20
Nutrients 2012, 4 1170
62. Joseph, M.; Beesabathuni, K.; Matthias, D. Enhancing the iron content of milled rice
with path’s ultra rice®
technology. Available online: http://www.path.org/publications/files/
TS_ur_enh_iron_pos.pdf (accessed on 19 February 2012).
63. National Institute of Nutrition; United Nations International Children’s Emergency Fund
(UNICEF). A Review of the Nutrition Situation in Vietnam 2009–2010; United Nations
International Children’s Emergency Fund: Hanoi, Vietnam, 2011.
© 2012 by the authors; licensee MDPI, Basel, Switzerland. This article is an open access article
distributed under the terms and conditions of the Creative Commons Attribution license
(http://creativecommons.org/licenses/by/3.0/).