Page 1
The Pennsylvania State University
The Graduate School
College of Engineering
IMPROVEMENTS IN WET STRENGTH AND LIQUID BARRIER PROPERTIES OF
CELLULOSIC SUBSTRATES USING POLYSACCHARIDE BLENDS
A Thesis in
Agricultural and Biological Engineering
by
Adam R. Plucinski
©2014 Adam R. Plucinski
Submitted in Partial Fulfillment
of the Requirements
for the Degree of
Master of Science
August 2014
Page 2
ii
The thesis of Adam R. Plucinski was reviewed and approved* by the following:
Jeffrey Catchmark Associate Professor of Agricultural and Biological Engineering Thesis Advisor Nicole Brown Associate Professor of Wood Chemistry Mark Horn Associate Professor of Engineering Science and Mechanics Paul Heinemann Agricultural and Biological Engineering Professor Department Head of Agricultural and Biological Engineering
*Signatures are on file in the Graduate School.
Page 3
iii
ABSTRACT
Petroleum-based plastics, including those used in the food packaging industry, pose a threat to
the environment by utilizing nonrenewable resources in the manufacturing process. Some biologically
derived, compostable polysaccharides, including chitosan, carboxymethyl cellulose, starch, guar gum,
and others, have been studied as potential replacements for petroleum-based plastics for food
packaging (Rachtanapun et al., 2011) (Salminen et al., 2011) (Gardlund et al., 2003) (Linden et al.,
1999) (Myllytie et al., 2009). These replacements have shown improvements in liquid and vapor barrier
properties as well as mechanical strength. Blending cationic chitosan (Mucha et al. 1999) with
polyanionic carboxymethyl cellulose (Haug et al., 1970) creates a strong electrostatic bond that can be
cast as a film on cellulosic substrates to create a barrier to reduce vapor permeability, liquid
permeability, and improve mechanical strength. In this study, a polysaccharide solution was
formulated, blended and applied to multiple substrates via a spray process and dehydrated at 110 °C for
30 minutes. The coated samples were then tested for wet and dry mechanical strength using tensile
testing, water vapor transmission, and liquid penetration.
Testing of CMC:CS samples showed improvements in both wet and dry mechanical strength as
well as decreased liquid and vapor permeability. A product with such abundant sources could be used
as an alternative to petroleum-based products for many applications.
Page 4
iv
Table of Contents
List of Tables.......................................................................................................................................... vii
List of Figures……………………………………………………………………………………….... viii
Equations…………………………………………………………………………………………..……. x
Acknowledgements………………………………………………………………………...……….….. xi
Chapter 1: Introduction and Justification.................................................................................................. 1
Chapter 2: Literature Review.................................................................................................................... 4
2.1. Carboxymethyl Cellulose……............................................................................................... 4
2.1.1. Background of Carboxymethyl Cellulose............................................................... 4
2.1.2. Testing, Results and Uses of Carboxymethyl Cellulose......................................... 6
2.2. Chitosan………………………….......................................................................................... 9
2.2.1. Background of Chitosan………………………….……………………………..... 9
2.2.2. Testing, Results and Uses of Chitosan.................................................................. 11
2.3. Formic Acid Regulations and Selection…........................................................................... 12
2.4. Carboxymethyl Cellulose and Chitosan Blends………………………………...………… 15
2.5. Cellulose Nanocrystals………………………..………………………………...………… 16
Chapter 3: Goals/ Objectives/ Hypotheses.............................................................................................. 19
Chapter 4: Methodology………………………………………………………………………............. 23
4.1. Preparation of Polysaccharide Solutions……………………………………………...…... 24
4.1.1. Chitosan Solution…………………...……………………………….…..……… 24
4.1.2. Carboxymethyl Cellulose Solution……………………………...…..…………... 24
4.1.3. Cellulose Nanocrystal (CNC) Solution………….………………………..…….. 25
4.2. Preparation of Polysaccharide Blends.....………………………………………….……… 25
4.2.1. Carboxymethyl Cellulose and Chitosan Blend……………………………...…... 25
Page 5
v
4.2.2. Carboxymethyl Cellulose and Chitosan Blend with Cellulose Nanocrystals…... 26
4.3. Polysaccharide Blend Properties Testing…………………………………………………. 26
4.3.1. Background and Preliminary Results Guiding Blend Formation Parameters……26
4.3.1.1. Selection of pH……………………………………………………...… 26
4.3.1.2. Selection of Solids Content………………………………………….... 27
4.3.1.3. Stoichiometry Selection…………………………………………….…. 27
4.3.2. Viscosity………………………………………………………………………… 27
4.3.3. Particle Size……………………………………………………………………... 29
4.3.4. Scanning Electron Microscopy………………………………………………….. 29
4.4. Deposition and Drying of Polysaccharide Blend to Paper Samples………………...……. 29
4.5. Testing of Coated Samples………………………………………..…………….………… 33
4.5.1. Tensile Testing………………………………………………………...………... 33
4.5.2. Liquid Penetration Time………………………………………………………… 34
4.5.3. Water Vapor Permeability……………………………...………………….……. 35
4.6. Data Collection and Analysis…………………………………………………….……….. 37
Chapter 5: Results and Discussion……………………………………………………………….......... 39
5.1. Effects of Blending Time on Particle Size……………………………………..….……… 39
5.2. Scanning Electron Microscopy of Substrate Porosity and Film Thickness……………..... 41
5.3. Effects of Solids Concentration on Viscosity…………………….…………...………….. 41
5.4. Effects of Polysaccharide Blend on Mechanical Properties………………...…….………. 42
5.5. Effects of Polysaccharide Blend on Liquid Penetration Time…………………………..... 49
5.6. Effects of Polysaccharide Blend on Water Vapor Permeability…….……………………. 53
Chapter 6: Conclusions and Direction…….……………………………………………………........... 57
6.1. Conclusions……………………………………………………………………………….. 57
Page 6
vi
6.2. Future Work………………………………………………………………….………...…. 58
References............................................................................................................................................... 59
Page 7
vii
List of Tables
Table 2-1: Water Vapor Transmission Rate and Water Vapor Permeability for Films Synthesized with
Various NaOH Concentrations (30%, 40%, 50%, and 60%)………………………................................ 9
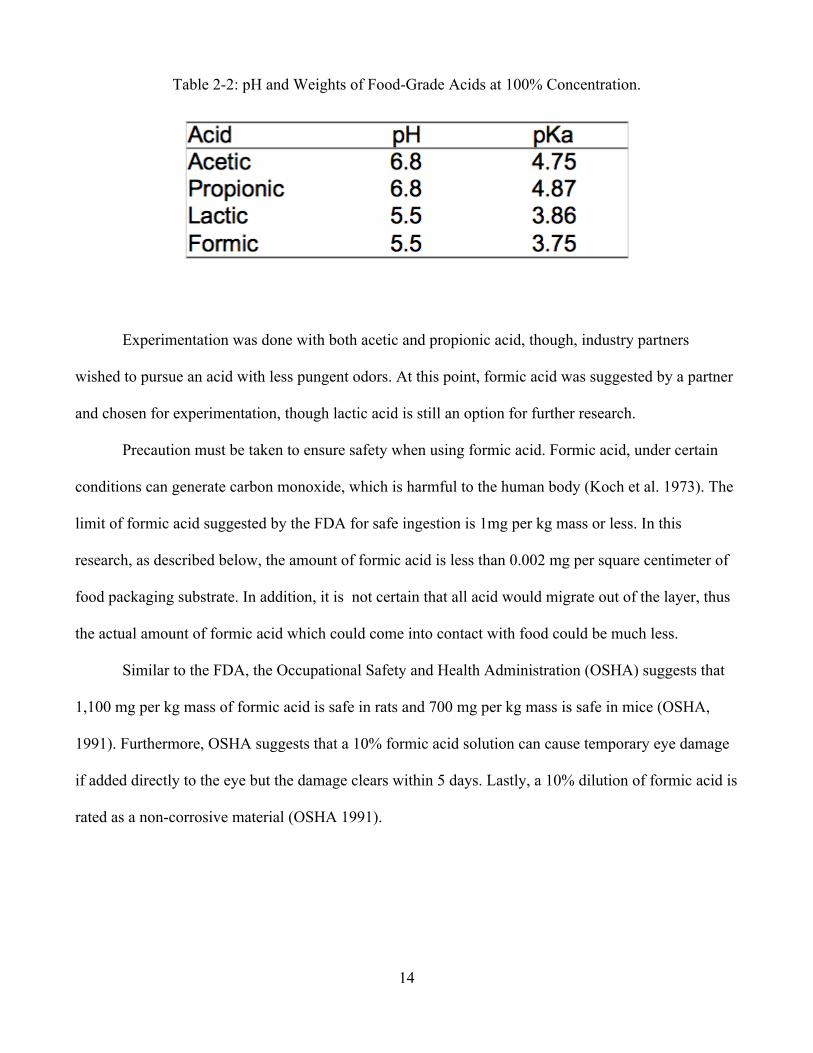
Table 2-2: pH and Weights of Food-Grade Acids at 100% Concentration…………………………… 14
Table 5-1: Tensile Testing Data on Coated and Uncoated Copy Paper Substrates................................ 43
Table 5-2: Tensile Testing Data on Coated and Uncoated Partner Supplied Substrates…..….……..... 43
Table 5-3: Stress at Break Under Wet Conditions for Various CMC:CS:CNC Ratios on Commercial
Copy Paper………………………………………………………………………………… 44
Table 5-4: Stress at Break Under Dry Conditions for Various CMC:CS:CNC Ratios on Commercial
Copy Paper……………………………………………………………………………….… 44
Table 5-5: Strain at Break Under Wet Conditions for Various CMC:CS:CNC Ratios on Commercial
Copy Paper……………………………………………………………………….………… 44
Table 5-6: Strain at Break Under Dry Conditions for Various CMC:CS:CNC Ratios on Commercial
Copy Paper…………………………………………………………………………………. 45
Table 5-7. : Liquid Penetration Times of Coated and Uncoated Partner Supplied Substrates………... 50
Table 5-8. Liquid Penetration Times of Coated and Uncoated Copy Paper Substrates…………...….. 50
Table 5-9: Weights of Coated Samples and Chamber per Day……………………………………...... 53
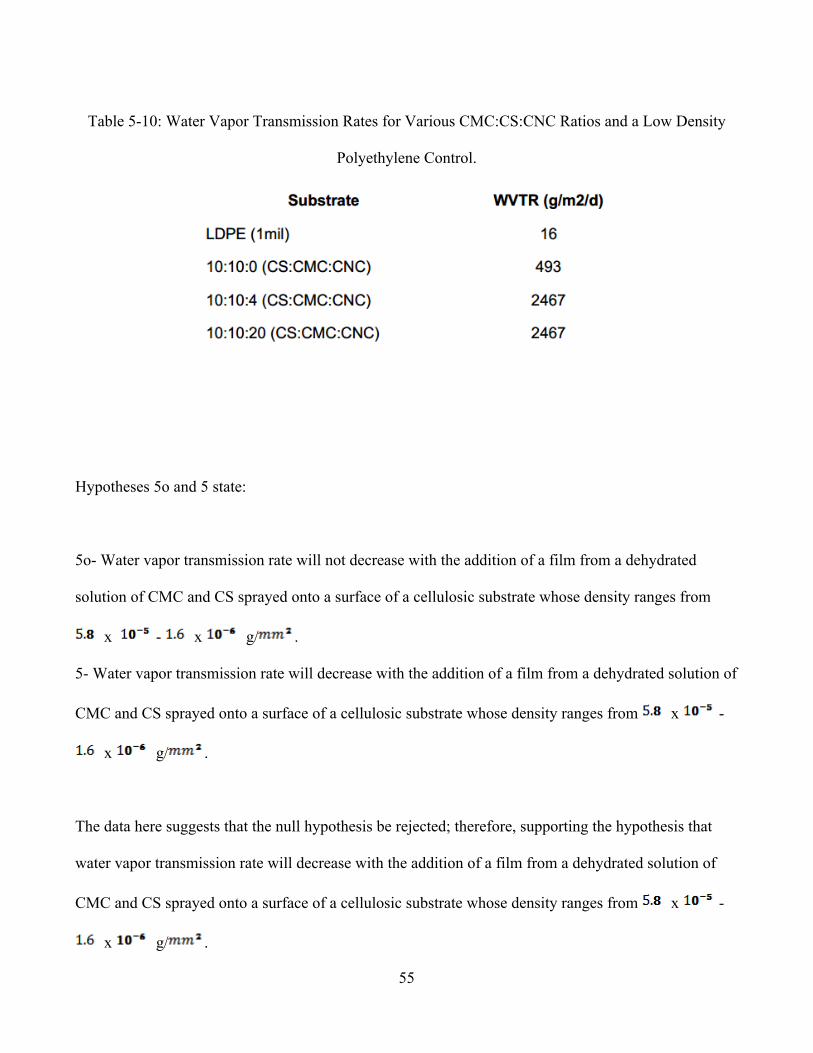
Table 5-10: Water Vapor Transmission Rates for Various CMC:CS:CNC Ratios and a Low Density
Polyethylene Control………………………………………………………………….…. 55
Page 8
viii
List of Figures
Figure 2-1: Structure of Carboxymethyl Cellulose……………………………………………………... 4
Figure 2-2: D-glucosamine Structure………………………………………………………………….. 10
Figure 2-3: N-acetyl-D-glucosamine Structure…………………………………………………………11
Figure 2-4: Structure of Chitosan…………………………………………………………………….... 11
Figure 2-5: Layered Arrangement of CMC and CS on a Substrate…………..……………………….. 15
Figure 2-6: Transmission electron microscopy from a dilute solution of hydrolyzed a) cotton, b) sugar-
beet pulp and c) tunicin…………………………………………………………………… 17
Figure 4-1: Flowchart for the Methodology of the Polysaccharide Blend as a Paper-Strengthening
Agent……………………………….…………………………………………………...… 23
Figure 4-2: Particle Size as a Function of CMC:CS Ratio……………………………………………. 28
Figure 4-3: Spray Apparatus for Blend Application to Substrates......................................................... 31
Figure 4-4: Spray Height Design............................................................................................................ 32
Figure 4-5: Dynamic Mechanical Analyzer Q800 Series from TA Instruments.................................... 34
Figure 4-6: Humidity Chamber to Prevent Liquid Evaporation During the Liquid Barrier Test........... 35
Figure 4-7: Water Vapor Transmission Rate Test Apparatus................................................................. 36
Figure 4-8: Design of Water Vapor Permeability Apparatus.................................................................. 37
Figure 5-1: Average Particle size as a Function of Blending Time........................................................ 39
Figure 5-2: Scanning Electron Microscope Image of a Cellulosic Substrate with a CMC: CS
Coating................................................................................................................................. 39
Figure 5-3: Viscosity versus Shear Stress as a Function of Concentration………...……………....…. 42
Figure 5-4: Derived Wet Modulus of Various Blends……………………………………...…………. 46
Figure 5-5: Derived Dry Modulus of Various Blends…………………………………………...….… 47
Page 9
ix
Figure 5-6: Liquid Penetration Time of Various CMC:CS:CNC Ratios on Commercial Copy Paper at
Various pH Values……………………………...…………………………………………. 51
Figure 5-7: Normalized Vapor Mass Lost as a Function of Time………...…………………………... 54
Page 10
x
Equations
(1) Reduction of the Cellulosic Structure…………………………….…..…………………….…... 5
(2) Degree of Substitution………………………………………..……………………………...…. 5
(3) Correlation between shear stress, shear rate, flow behavior index and consistency coefficient... 7
(4) Viscosity Equation………………...…………………………….……………………………… 8
(5) Water Vapor Transmission Rate Equation………………………………………………..……. 9
(6) Percent Loading Calculation….……………………………………………………………….. 30
(7) Volumetric Flow Rate Equation ……………………………………………………………… 31
(8) Relationship of θ, r, and c to find appropriate spray height…………………………………… 33
(9) Standard Deviation Calculation……………………………………………………………….. 37
Page 11
xi
ACKNOWLEDGEMENTS
I would like to extend a special thanks to Dr. Jeff Catchmark for guiding and mentoring me
through my thesis research. His insight and knowledge aided in my development as not only a
researcher but also an academic. I would also like to thank the United States Department of Agriculture
for supporting this project.
I would also like to thank the other members of my committee, Dr. Nicole Brown and Dr. Mark
Horn, for their assistance to my thesis work and approval. Furthermore, I would like to extend my
gratitude to the Pennsylvania State University, especially the Agricultural and Biological Engineering
Department, for allowing me to conduct my research at such a prestigious institution.
Finally, I would like to thank my family, especially my mother, Carlene Plucinski, for
supporting me through my academic career and my life.
Page 12
Chapter 1
Introduction and Justification
Every year the need for a plastic replacement grows more imperative. As population increases,
greater amounts of waste are dumped into landfills, leaving some waste products susceptible to be
carried to water sources including oceans, seas, rivers, lakes, etc. Such susceptible products include
plastics used by consumers for a variety of applications. Some applications are, but not limited to,
plastic bottles, utensils and containers as well as plastic coatings cast on disposable cups and plates that
are composed of non-plastic materials. These plastics can be harmful to humans, wildlife, and to the
environment by potentially releasing harmful chemicals into the environment. A compostable,
biologically-derived polymer replacing plastics can reduce health risks and improve the environment.
According to the Environmental Protection Agency (EPA, 2012), United States citizens
collectively produce 31 million tons of plastic waste every year. This amount of plastic waste accounts
for 12.4% of the total municipal solid waste. Only 8% (or roughly 2.5 million tons) of produced plastic
is recycled, leaving 28.5 million tons of plastic each year that is deposited into landfills. Here, some of
the plastic products are carried to water sources, potentially releasing harmful chemicals into the waters
(EPA, 2012). Offshore pollutants total nearly $12.8 million every year on death and disease for the
global economy (Jakab, 2007).
Most plastic containers, including disposable cups and plates, contain a substance known as
bisphenol A (BPA) which is an endocrine inhibitor, the use of which is controversial in its effects on
the human body. Concern was high enough that the Food and Drug Administration “issued an interim
update” on March 30, 2012 concerning its policy on BPA (FDA, 2012). Restrictions included banning
BPA from baby bottles and reducing human exposure to BPA (FDA, 2012).
Endocrine inhibitors, such as BPA, mimic the estrogen hormone thereby causing the body to
reduce the production of estrogen. Woodruff et al. (2011) suggested that traces of BPA could be found
Page 13
2
in 96% of pregnant women. Traces of BPA during pregnancy can cause the mother to have adverse
health effects including cardiovascular complications and cancer. The presence of BPA not only poses
potential harm for the mother, but also for her child as compounds from the mother's body transfer to
the unborn child. If the child was exposed to BPA during pregnancy, the child could be born
prematurely, suffer from birth defects and neurodevelopmental deficiencies, or have cancer (Woodruff
et al., 2011).
Previously at the Pennsylvania State University, Dr. Jeffrey Catchmark and Dr. Niharika Mishra
developed a composite plastic substitute comprised of carboxymethyl cellulose sodium salt (CMC) and
chitosan (CS) (Mishra, N. and J. M. Catchmark. 2014. Improvement in Strength and Vapor Barrier
Properties of cellulose composite sheets. Submitted to the Transactions of the ASABE.). CMC is a
cellulose derivative that has various uses in food products and other products as a viscosity modifier.
According to Ashland Specialty Ingredients (2011), CMC is used in bakeries, beverages, dairy
products, desserts, meats, pet food, prepared foods, and sauces to promote foam, improve mouthfeel,
control viscosity, act as a stabilizer, enhance structure, and is used to improve water binding (Ashland,
2011).
Chitosan is a derivative from chitin, a polysaccharide found in the exoskeletons of many
crustacea and cell walls of several fungi. Chitin can be added as a pretreatment to plant seeds to
improve growth and act as a pesticide to protect from disease (Linden et al., 2000). Chitosan is only
soluble in acidic solutions (pH < 5) where the amine becomes protonated.
Formic acid is safe for consumption by humans and can be used to create aqueous chitosan
solutions (Onsosyen et al., 1990). This acid is also used to protect crops from contamination as
suggested in Effect of Lactic Acid in the Drinking Water During Preslaughter Feed Withdrawal on
Salmonella and Campylobacter Contamination of Broilers (Byrd et al., 2000).
The research performed herein details the development and testing of a blended polymer
Page 14
3
solution of CMC and CS that deposited and dehydrated into a surface film that can be substituted for
similar plastic films used on disposable drinking cups and food packaging products.
Understanding the various interactions and properties of this film can aid in future research in
the bio-based materials and packaging fields.
There is an immediate and growing need for bio-based disposable materials. This research
makes great strides toward the practical realization of such a material based on polysaccharides, and
promotes further research that could not only aid human health but also decrease environmental
impacts. Degradable bio-based polymer films useful for packaging products will reduce the amount of
waste in landfills and waste that is carried to water sources, creating a safer habitat for many
organisms.
Page 15
4
Chapter 2
Literature Review
The literature review summarizes previous research conducted on chitosan and carboxymethyl
cellulose polymers, including use as paper coatings to improve mechanical response and strength as
well as barrier and antimicrobial properties.
2.1. Carboxymethyl Cellulose
2.1.1. Background of Carboxymethyl Cellulose
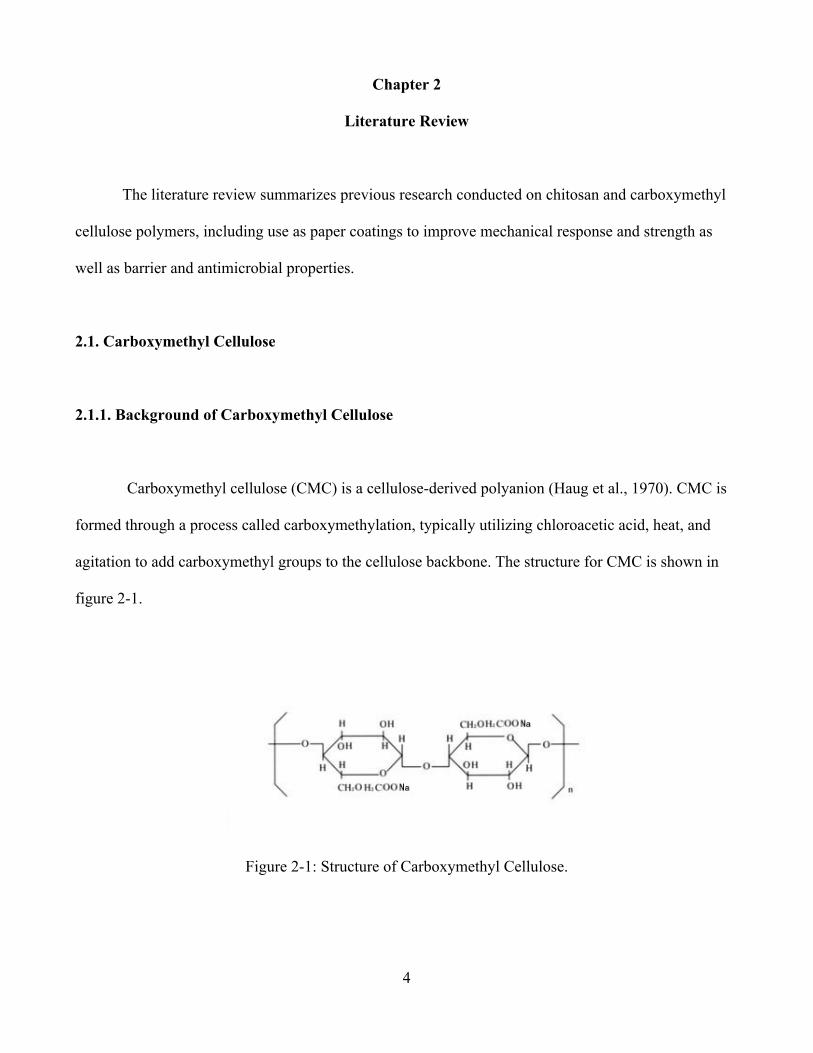
Carboxymethyl cellulose (CMC) is a cellulose-derived polyanion (Haug et al., 1970). CMC is
formed through a process called carboxymethylation, typically utilizing chloroacetic acid, heat, and
agitation to add carboxymethyl groups to the cellulose backbone. The structure for CMC is shown in
figure 2-1.
Figure 2-1: Structure of Carboxymethyl Cellulose.
Page 16
5
There are several differences between CMC and crystalline cellulose that has led to
previous research on CMC based films. First, Rachtanapun et al. (2011), suggests that CMC has a
greater melting point, as well as a greater water permeability capability than cellulose due to the
oxidation of the cellulosic structure as shown in equation (1) (Rachtanapun et al., 2011):
Cell-OH + C1CH2COONa ! Cell-O-CH2COO-Na+ + H2O (1)
As suggested by Rachtanapun et al. (2011), the preparation and solubilizing of CMC causes the
decrystallization of cellulose allowing cast films of CMC to become flexible. Furthermore, Kanie et al.
(2005), in their study of biodegradability of polymer and papers, suggests that crystallinity decreases
the rate of biodegradation. Because preparation and solubilizing of CMC causes decrystallization, the
rate of biodegradation could increase.
As the degree of substitution increases, CMC becomes more water-soluble, which is important
when trying to create an aqueous solution (Rachtanapun et al., 2011). Degree of substitution (DS), as
noted in Encyclopedia of Polymer Science and Technology, can be found using equation (2).
In the case of CMC, carboxymethyl groups replace up to three hydroxyl groups per monomeric
unit. This means that the largest value of DS obtained for CMC is three. Typical values range from >0 -
2.
(2)
Page 17
6
2.1.2. Testing, Results and Uses of Carboxymethyl Cellulose
Carboxymethyl cellulose (CMC) is used in a wide array of industries including the food,
medical, paper and pulp, and horticulture industries. First, in the food industry, CMC is used to
stabilize proteins, enhance water retention, replace pectin placement in foods and improve mouth feel
while ensuring virtually no change in visual appeal in the product due to its near clarity in solutions
(Ashland, 2011). Many of these uses result from CMC's ability to modify viscosity.
In the medical field, CMC can be added to a growth medium to enhance the synthesis of
bacterial cellulose (BC) (Cheng et al., 2009). With this bacterial cellulose, advancements in medical
research have been made and many more medical applications are currently being studied. BC is used
to create membranes that are similar to artificial skin that can allow antibiotics to pass through due to
the membrane's high porosity (Chawla et al., 2009).
CMC research in the medical field has also shown high yields of bacterial cellulose (BC)
growth compared to that of microcrystalline cellulose and sodium alginate BC produced by
Acetobacter xylinum (Cheng et al., 2009). This improved growth will allow for enhanced medical
research and application on sutures, medical meshes, etc.
The paper and pulp industry, Kanie et al. (2005) suggests that an aqueous solution of CMC can
be applied to a cellulosic substrate and dehydrated at elevated temperatures such as 80, 100, and 120
degrees Celsius respectively. After the solution is dehydrated into a film, CMC acts as a strengthening
agent (Salminen et al., 2011). According to Salminen et al. (2011), CMC strengthens paper by breaking
weak fibril bonding and introducing electrostatic forces to the fiber surface, thus linking the fibers
together. With the addition of CMC as a paper filler, dry strength and wet strength properties can be
enhanced to decrease the likelihood of tearing and solubility (Gardlund et al., 2003).
Page 18
7
In the paper and pulp industry, the addition of CMC to paper products can influence tensile
strength, folding endurance, and water vapor permeability (Rachtanapun et al., 2011), as well as
affecting the dry-strength and wet-strength properties (Gardlund et al., 2003). To detect such variables,
specific experiments and instruments must be utilized to obtain credible data.
First, tensile strength can be measured using several instruments. A dynamic mechanical
analyzer (DMA) can be used to apply a specific tensile rate either under dry conditions or wet
conditions. Similarly, Rachtanapun et al. (2011) used the Instron Universal Testing Machine Model
1000 to test mechanical properties.
Because CMC is a viscosity modifier, understanding how varying viscosity affects other
properties is important. A technique known as rheometry can be used to characterize CMC's viscosity
(Pilizota et al. 1996). Pilizota notes that rheological parameters are dependent on shear stress, shear
rate, flow behavior index and a consistency coefficient. The correlation between these properties can be
seen in equation (3):!
where: Shear Stress
Consistency Coefficient
Shear Rate
Flow Index Behavior
Furthermore, Pilizota notes that viscosity is directly related to the mass fraction of CMC,
frequency factor, activation energy, and a gas constant. These correlations can be seen in equation (4):
(3)
Page 19
8
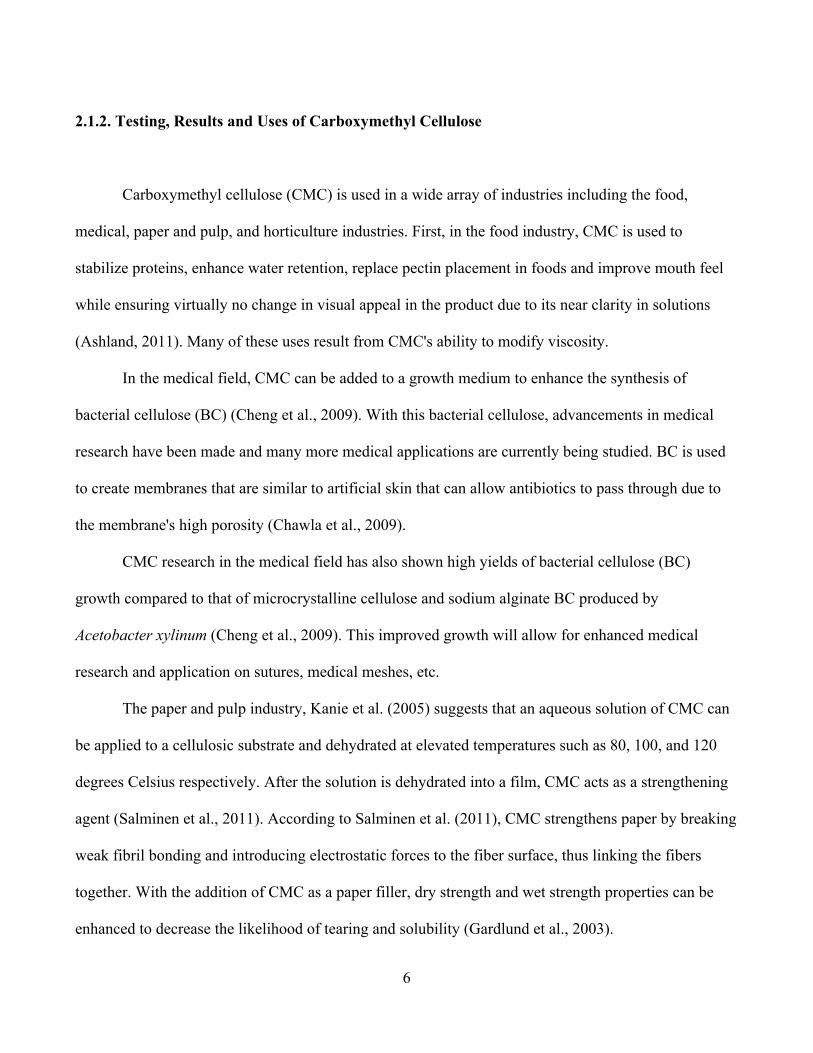
where: Viscosity
Mass Fraction
Coefficient
Activation Energy
Gas Constant
Temperature
and: a and b were obtained by regression of log (viscosity) versus log (CMC concentration).
Pilizota’s results agree with such equations, supporting the idea that viscosity increases with a
decrease in temperature.
Thermal properties can be measured using differential scanning calorimetry (DSC)
(Rachtanapun et al., 2011). Here, the author discovered that cellulose alone had a melting point of
107.3 °C. CMC seems to have a higher melting point than cellulose as can be seen in the evidence
given by Rachtanapun et al. (2011). Their study showed that the addition of sodium hydroxide (NaOH)
decreased the melting point of CMC and at 30% NaOH the melting point is 114.5 °C, still greater than
that of regular cellulose. Furthermore, Rachtanapun et al. (2011) showed that viscosity of the polymer
is inversely proportional to temperature.
In the case of water vapor permeability, Rachtanapun et al. (2011) suggests that water vapor
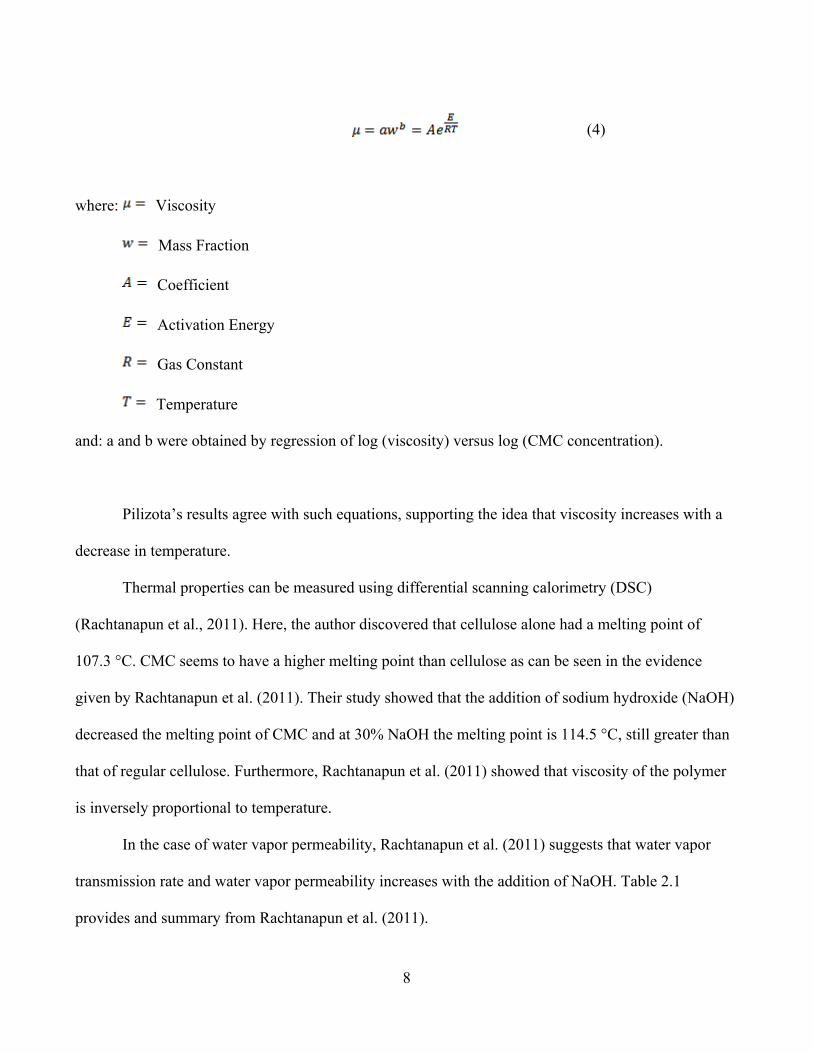
transmission rate and water vapor permeability increases with the addition of NaOH. Table 2.1
provides and summary from Rachtanapun et al. (2011).
(4)
Page 20
9
Table 2-1: Water Vapor Transmission Rate and Water Vapor Permeability for Films Synthesized with
Various NaOH Concentrations (30%, 40%, 50%, and 60%)
Water vapor transmission rate (WVTR) is defined by Saxena et al. (2011) is defined in equation
(5):
2.2. Chitosan
2.2.1. Background of Chitosan
Chitosan (CS) is a derivative of chitin, a naturally occurring polymer found in fungi cell walls
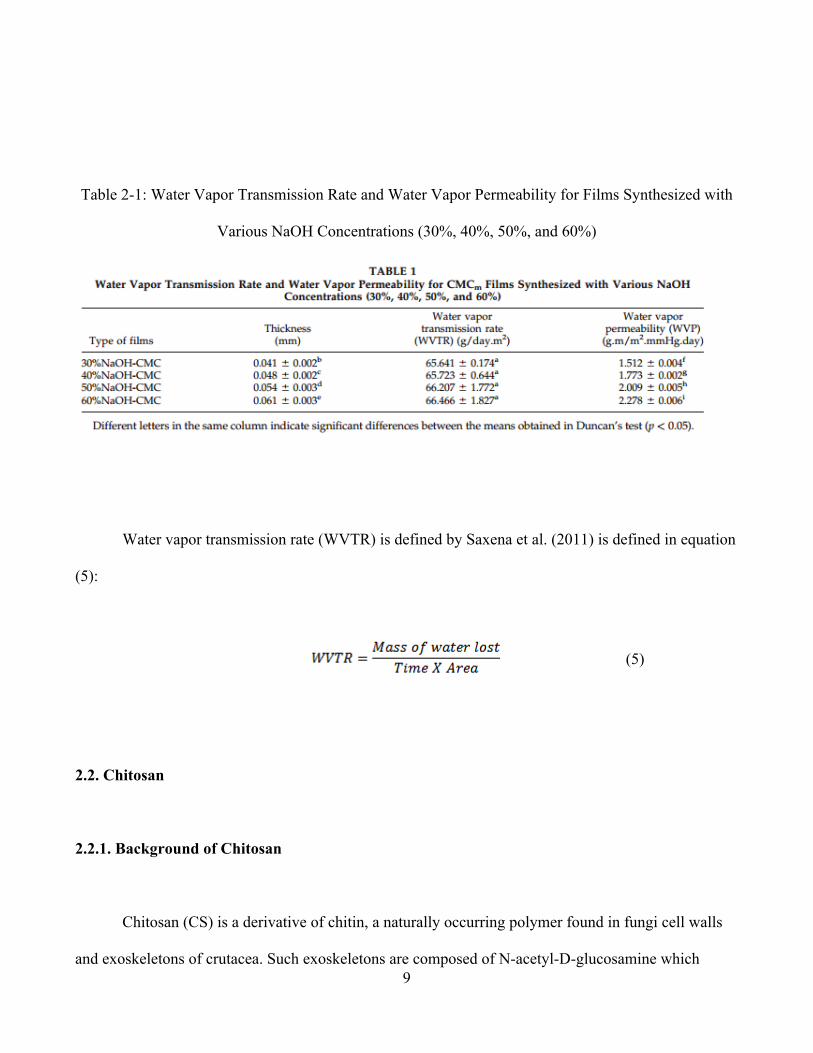
and exoskeletons of crutacea. Such exoskeletons are composed of N-acetyl-D-glucosamine which
(5)
Page 21
10
become deacetylated via treatment with sodium hydroxide to create chitosan, a chain of β-(1!4)-
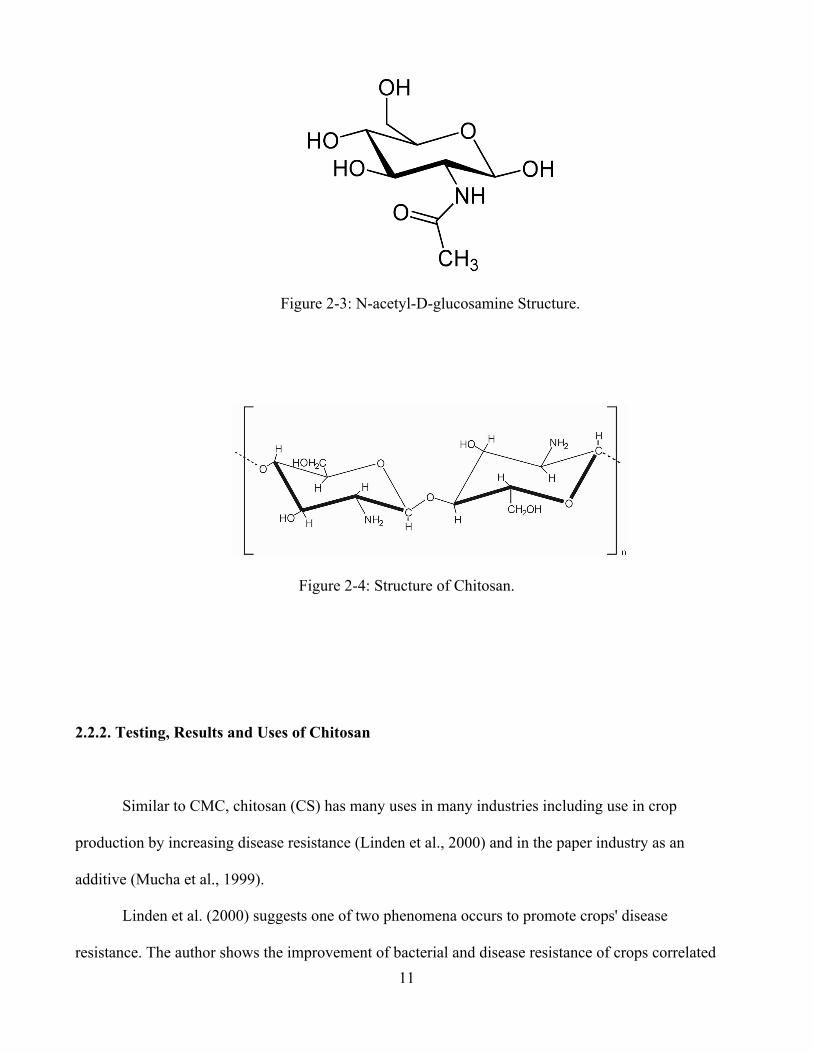
linked D-glucosamine. The structures of D-glucosamine and N-acetyl-D-glucosamine are shown in
figures 2-2 and 2-3. After deacetylation, chitosan becomes cationic (Mucha et al., 1999). Chitosan’s
structure is shown in figure 2-4.
Xu et al. (2001) notes that CS may have poor water solubility as well as a low degree of
substitution in Synthesis of Chitosan Quaternary Ammonium Salts. Fatehi et al. (2010) suggests that
chitosan becomes soluble in acidic conditions due to the protonation of the amine group. Many acids
have been used to solubilize chitosan such as acetic acid, propionic acid, and formic acid (Onsosyen et
al., 1990).
Chitosan is utilized in several fields including use in the paper and pulp and agricultural
industries. Several studies have suggested chitosan as both a dry strength additive in papermaking as
well as an antimicrobial agent (Fatehi et al., 2010, Xu et al., 2001). Fatehi et al. (2010) suggests that the
anionic nature of surface fibers makes cationic chitosan a strong candidate as a barrier on cellulosic
substrates.
Figure 2-2: D-glucosamine Structure.
Page 22
11
Figure 2-3: N-acetyl-D-glucosamine Structure.
Figure 2-4: Structure of Chitosan.
2.2.2. Testing, Results and Uses of Chitosan
Similar to CMC, chitosan (CS) has many uses in many industries including use in crop
production by increasing disease resistance (Linden et al., 2000) and in the paper industry as an
additive (Mucha et al., 1999).
Linden et al. (2000) suggests one of two phenomena occurs to promote crops' disease
resistance. The author shows the improvement of bacterial and disease resistance of crops correlated
Page 23
12
with the addition of CS near the planted seed. One reason for this resistance is the presence of CS at
binding sites could promote the production of hydrogen peroxide which protects the plant from disease.
Furthermore, Linden et al. (2000) suggests that CS stimulates chitinases and glucanase, the
combination of which lyses cells of hyphal tips which suggests that chitosan can be used as an
antifungal agent. Linden further suggests that environmentally safe elicitors, such as CS, could one day
replace other, more harmful, elicitors such as fungicides. While some fungicides decrease crop yields,
CS is suggested to have little to no effect on crop production (Linden et al., 2000).
In the paper industry, literature suggests that paper pulp is anionic (Haug et al., 1970) due to the
sodium attached to the carboxymethyl group. This sodium can dissociate when the CMC solubilizes in
DI water, thus releasing a positive charge, creating an anionic group. Because of CMC’s polyanionic
nature, it is susceptible to create an ionic bond to the cationic chitosan (Mucha et al., 1999). Some
starches form ionic bonds with chitosan, creating a strong polymer coating that enhances mechanical
properties of paper. While ionic bonding is a possibility, there are sites available for both an ionic bond
and for a hydrogen bond (Mucha et al. 1999). Noted by Myllytie et al. (2009), this addition of CS can
enhance both initial and permanent wet-strength properties of paper.
Paper containing chitosan shows improvements in mechanical properties (Mucha et al., 1999).
Likewise, due to a strong ionic bond, chitosan blended with starch also enhanced mechanical properties
by forming a coating on the surface of the paper (Mucha et al., 1999). As suggested by Mucha et al.,
the addition of chitosan in various forms increased all mechanical properties tested including tear
resistance, bursting power, breaking load, extensibility, and breaking length.
2.3. Formic Acid Regulations and Selection
Many acids have been considered in research related to cellulosic polymer research. Acid is
Page 24
13
needed to lower the pH of the chitosan solution to make the CS soluble. Formic acid is a colorless
food-grade acid that exudes little to no odor, making it appealing to the customer. Due to the usage of
the polymer, the acid must be a safe food-grade acid.
Formic acid has shown antimicrobial and preservative qualities when used in the food industry.
Marshall et al. (2006) suggests that beef treated with 0.046% formic acid and 0.6% acetic acid
decreased microbial activity by 65%. Furthermore, Humphrey et al. (1987) suggests that treating
chicken feed with 0.5% formic acid significantly reduced salmonella rates in the hens themselves, as
well as the rate of infection in newly hatched chicks.
Formic Acid has been used as a crop pesticide for its ability to reduce the risk of crop
contamination (Byrd et al., 2000). Literature on formic acid has not suggested that the crops treated
with this formic acid had any adverse effects on consumers. Furthermore, formic acid has been
approved as a food-grade additive by the FDA (Ha et al., 2004). Due to formic acid's use as a food-
grade additive, formic acid is a strong candidate for use in this research.
For the concerned research, other acids such as acetic acid and propionic acid were also
considered for use to solubilize chitosan. In table 2-2, Zumdahl et al. (2003) shows a list of several
food-grade acids along with their pH and pKa values.
Page 25
14
Table 2-2: pH and Weights of Food-Grade Acids at 100% Concentration.
Experimentation was done with both acetic and propionic acid, though, industry partners
wished to pursue an acid with less pungent odors. At this point, formic acid was suggested by a partner
and chosen for experimentation, though lactic acid is still an option for further research.
Precaution must be taken to ensure safety when using formic acid. Formic acid, under certain
conditions can generate carbon monoxide, which is harmful to the human body (Koch et al. 1973). The
limit of formic acid suggested by the FDA for safe ingestion is 1mg per kg mass or less. In this
research, as described below, the amount of formic acid is less than 0.002 mg per square centimeter of
food packaging substrate. In addition, it is not certain that all acid would migrate out of the layer, thus
the actual amount of formic acid which could come into contact with food could be much less.
Similar to the FDA, the Occupational Safety and Health Administration (OSHA) suggests that
1,100 mg per kg mass of formic acid is safe in rats and 700 mg per kg mass is safe in mice (OSHA,
1991). Furthermore, OSHA suggests that a 10% formic acid solution can cause temporary eye damage
if added directly to the eye but the damage clears within 5 days. Lastly, a 10% dilution of formic acid is
rated as a non-corrosive material (OSHA 1991).
Page 26
15
2.4. Carboxymethyl Cellulose and Chitosan Blends
Chitosan and carboxymethyl cellulose can be used separately in a layered formation of
polymer composites (Salminen et al., 2011). An example of a layered polymer composite is shown in
figure 2-5(Wang et al. 2013). Despite the Salminen et al. (2011) study, the interaction between the two
and the formation of a polymer utilizing both constituents has not been studied extensively.
Figure 2-5: Layered Arrangement of a Polymer Composite.
Fatehi et al. (2009) suggests using a mixture of CMC and CS as an additive to cellulose fibers.
Here, CMC and CS were mixed at a concentration not exceeding 200 ppm. In this study, Fatehi
describes the method by first adding a 1% modified CS to a suspended pulp fiber for two hours and
stirred at 90 rpm. After the modified CS is added, a 1% CMC is stirred into the suspension for one
hour. From here, the paper sheets were made in accordance with TAPPI T 205 and dried at 110 °C for
30 minutes. This study suggested that the addition of CMC:CS particles increased bonding between
fibers (Fatehi et al., 2009).
One method of polymer application is to use spray the polymer on a surface that is in a negative
Page 27
16
pressure environment (i.e. a vacuum) (Salminen et al., 2011). Here, Salminen et al. (2011) applied
CMC and CS to the paper before dying and increased the wet strength properties of the sample.
In this research, CMC:CS blends have been developed enhancing wet-strength and liquid
barrier properties of paper were applied to various paper surfaces and then analyzed for film deposition
on the surface of each substrate.
2.5. Cellulose Nanocrystals
Cellulose nanocrystals have been a recent focus for paper strengthening agents for many
reasons. One such reason is because CNC's are a direct derivative of cellulose which is highly abundant
in nature. CNC's are harvested via acid hydrolysis, which strips away amorphous cellulose,
hemicellulose and lignin, leaving a highly crystalline structure to be used. CNC's harvested from three
species of plants provided in Samir et al.'s review titled “Review of Recent Research into Cellulosic
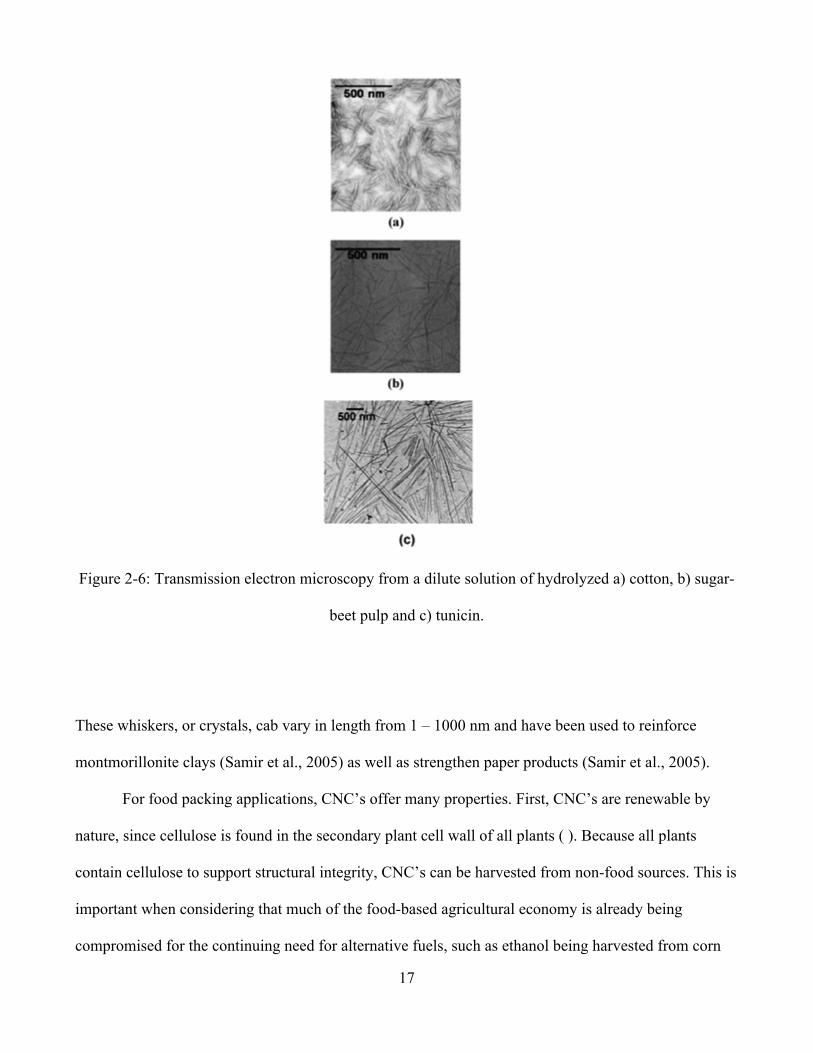
Whiskers, Their Properties and Their Application in Nanocomposite Field” (2005) is shown in figure
2-6 a, b and c.
Page 28
17
Figure 2-6: Transmission electron microscopy from a dilute solution of hydrolyzed a) cotton, b) sugar-
beet pulp and c) tunicin.
These whiskers, or crystals, cab vary in length from 1 – 1000 nm and have been used to reinforce
montmorillonite clays (Samir et al., 2005) as well as strengthen paper products (Samir et al., 2005).
For food packing applications, CNC’s offer many properties. First, CNC’s are renewable by
nature, since cellulose is found in the secondary plant cell wall of all plants ( ). Because all plants
contain cellulose to support structural integrity, CNC’s can be harvested from non-food sources. This is
important when considering that much of the food-based agricultural economy is already being
compromised for the continuing need for alternative fuels, such as ethanol being harvested from corn
Page 29
18
crops. Furthermore, CNC’s offer a high specific strength and modulus due to the crystalline structure.
These mechanical enhancements benefit the food packaging industry by improving existing packaging
methods.
Page 30
19
Chapter 3
Goals/ Objectives/ Hypotheses
This research studied polysaccharide blends of chitosan (CS) and carboxymethyl cellulose
(CMC) as barriers over various cellulosic substrates. A blend was optimized with a specific weight
ratio of CS to CMC, blending time, blending speed, total solids content, and pH. The blend was then
sprayed onto paper substrates at a specific pressure and spray height. The iterations and controlled
changes of this blend aided in the formulation of an optimal blend for paper property enhancement.
Objectives
• Quantify suspended CMC: CS particle size as a function of blending time.
• Establish process for forming particles whose size ranges from 200-1400 µm. This is necessary
to 1) enable particle retention on the surface of typical substrates allowing film formation
during dehydration, and 2) allow particles to properly pass through the spray apparatus.
• Understand the relationship between blend solution and film properties including CMC: CS
stoichiometry, solution pH, film thickness, and the wet strength and liquid/vapor barrier
properties of coated cellulosic substrates.
• Optimize the blend solution and film properties for maximum wet strength and liquid/vapor
barrier performance of coated cellulosic substrates.
Hypotheses
1o- Particle size of CMC: CS solutions are not affected by blending time.
Page 31
20
1- Particle size of CMC: CS solutions are affected by blending time.
2o- A film formed from a dehydrated solution of CMC and CS, sprayed onto a surface of a cellulosic
substrate whose density ranged from x - x g/ , will not resist penetration of a
liquid whose pH ranges from 3-9.
2- A film formed from a dehydrated solution of CMC and CS, sprayed onto a surface of a cellulosic
substrate whose density ranged from x - x g/ , will resist penetration of a
liquid whose pH ranges from 3-9.
3o- Wet modulus will not increase with the addition of a film from a dehydrated solution of CMC and
CS sprayed onto a surface of a cellulosic substrate whose density ranges from x -
x g/ .
3- Wet modulus will increase with the addition of a film from a dehydrated solution of CMC and CS
sprayed onto a surface of a cellulosic substrate whose density ranges from x - x
g/ .
4o- Dry modulus will not increase with the addition of a film from a dehydrated solution of CMC and
CS sprayed onto a surface of a cellulosic substrate whose density ranges from x -
x g/mm2.
4- Dry modulus will increase with the addition of a film from a dehydrated solution of CMC and CS
sprayed onto a surface of a cellulosic substrate whose density ranges from x - x
g/ .
5o- Water vapor transmission rate will not decrease with the addition of a film from a dehydrated
Page 32
21
solution of CMC and CS sprayed onto a surface of a cellulosic substrate whose density ranges from
x - x g/ .
5- Water vapor transmission rate will decrease with the addition of a film from a dehydrated solution of
CMC and CS sprayed onto a surface of a cellulosic substrate whose density ranges from x -
x g/ .
6o- Incorporation of cellulose nanocrystals into dehydrated solution of CMC and CS sprayed onto a
surface of a cellulosic substrate whose density ranged from x - x g/ will not
resist penetration of a liquid whose pH ranges from 3-9.
6- Incorporation of cellulose nanocrystals into dehydrated solution of CMC and CS sprayed onto a
surface of a cellulosic substrate whose density ranged from x - x g/ will
resist penetration of a liquid whose pH ranges from 3-9.
7o- Incorporation of cellulose nanocrystals into dehydrated solution of CMC and CS sprayed onto a
surface of a cellulosic substrate whose density ranged from x - x g/ modulus
will not increase wet modulus.
7- Incorporation of cellulose nanocrystals into dehydrated solution of CMC and CS sprayed onto a
surface of a cellulosic substrate whose density ranged from x - x g/ will
increase wet modulus.
8o- Incorporation of cellulose nanocrystals into dehydrated solution of CMC and CS sprayed onto a
surface of a cellulosic substrate whose density ranged from x - x g/ modulus
will not increase dry modulus.
8- Incorporation of cellulose nanocrystals into dehydrated solution of CMC and CS sprayed onto a
Page 33
22
surface of a cellulosic substrate whose density ranged from x - x g/ will
increase dry modulus.
9o- Incorporation of cellulose nanocrystals into dehydrated solution of CMC and CS sprayed onto a
surface of a cellulosic substrate whose density ranged from x - x g/ modulus
will not decrease water vapor transmission rate.
9- Incorporation of cellulose nanocrystals into dehydrated solution of CMC and CS sprayed onto a
surface of a cellulosic substrate whose density ranged from x - x g/ will
decrease water vapor transmission rate.
Page 34
23
Chapter 4
Methodology
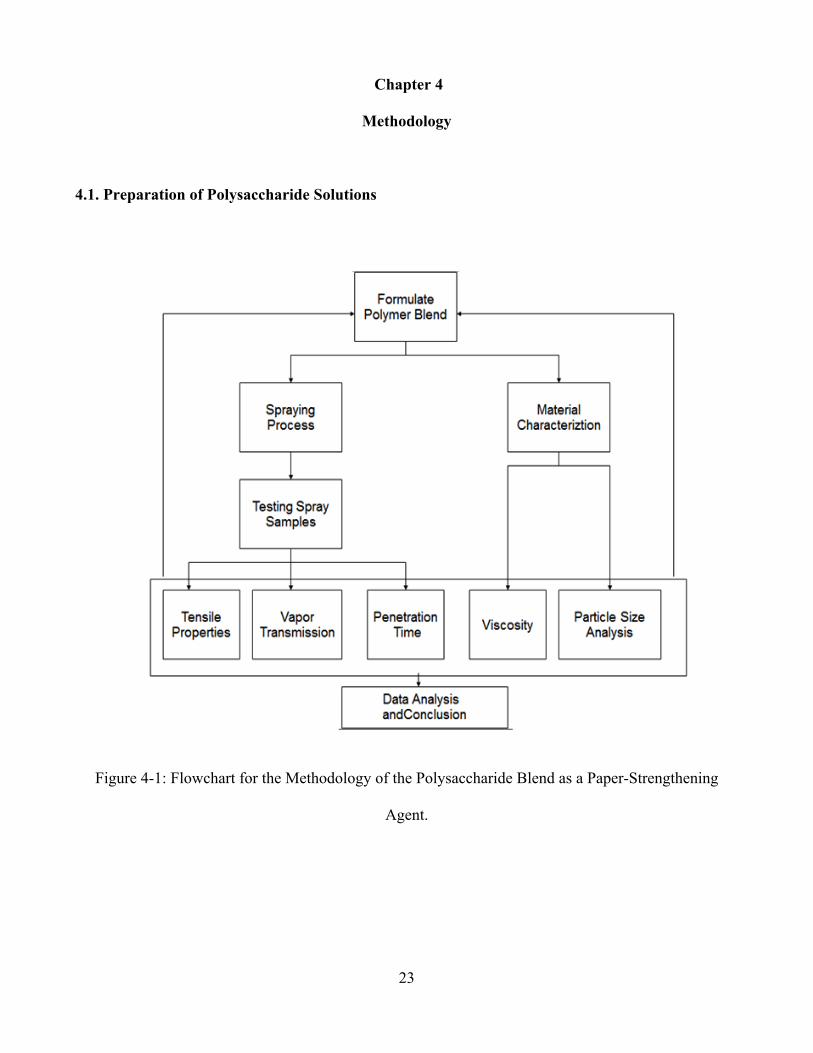
4.1. Preparation of Polysaccharide Solutions
Figure 4-1: Flowchart for the Methodology of the Polysaccharide Blend as a Paper-Strengthening
Agent.
Page 35
24
4.1.1. Creating Chitosan Solution
A 3% (w/v) solution of low density chitosan with a degree of deacetylation (%DD) of ~85.3%
and a molecular weight of 78 kDa was suspended by introducing three grams of chitosan to 96.65 mL
of deionized water. Because chitosan is not water soluble at a neutral pH, formic acid was added to
lower the pH of the solution below the isoelectric point of chitosan (pKa=6.5). For the testing
performed in these studies, a solution of pH value three was utilized. To obtain the 3% (w/v) suspended
solution of chitosan, 1.2 mL of 88% formic acid was added to the solution. The procedure is as follows:
• 95.8 mL of DI water was added to a 250 mL Erlenmeyer flask.
• 3.00 g of CS was added to the DI water.
• Under stirring conditions, 1.2 mL of formic acid was added dropwise.
The formic acid must be added slowly (i.e. drop by drop) to prevent solution coagulation that
will cause heterogeneity.
4.1.2. Carboxymethyl Cellulose Solution
Much like chitosan, carboxymethyl cellulose concentration affects the viscous properties of the
solution. Though CS and CMC share this similarity, CMC is water soluble at a neutral pH. For the
research conducted in this study, formic acid was added to the CMC to control the pH of the final
solution.
A 3% (w/v) solution of CMC was created by introducing three grams of CMC having a degree
of substitution of 0.82 and a molecular weight of 138 kDa to 96.65 grams of deionized water. After the
Page 36
25
CMC powder has solubilized, formic acid was added to lower the solution to a pH of three. The
procedure is as follows:
• 96.65 mL of DI water was added to a 250 mL Erlenmeyer flask.
• 3.00 g of CMC was added to the DI water.
• Under stirring conditions, 0.35 mL of formic acid was added.
4.1.3. Cellulose Nanocrystal (CNC) Solution
Cellulose nanocrystals (CNC’s) were obtained from the Forrest Products Laboratory in
Madison, Wisconsin.
Two solutions of cellulose nanocrystals (CNC) were prepared at varying solids contents, 6%
(w/v) and 1.2 % (w/v) respectively. The 6% solution was created by introducing 6 grams of the CNC’s
into 94 mL of DI water. Similarly the 1.2% (w/v) solution of CNC’s was created by introducing 1.2
grams of CNC’s into 98.8 mL of DI water.
The pH was held neutral and the solution was continuously stirred to keep the particles in
suspension.
4.2. Preparation of Polysaccharide Blends
4.2.1. Carboxymethyl Cellulose and Chitosan Blend
After both 3% (w/v) solutions have been fully solubilized and maintained at a pH of three, the
Page 37
26
CMC and CS solutions were weighed and combined at a 1:1 (w:w) ratio in a Waring commercial
blender, model 51BL32. With these specific CMC and CS solutions, the ratio of the amine on the CS
( to the CMC’s COOH group is 1 : 0.7. The solutions were blended in thirty second intervals for
varying times to find the optimal particle size.
4.2.2. Carboxymethyl Cellulose and Chitosan Blend with Cellulose Nanocrystals
After both 3% (w/v) polysaccharide solutions have been fully solubilized and maintained at a
pH of three and the CNC solution is prepared, the CMC, CS, and CNC solutions were weighed and
combined at a 1:1:1 (w:w:w) ratio in a Waring commercial blender, model 51BL32. The solutions were
blended in thirty second intervals for varying times to find the optimal particle size.
If the 6% CNC solution is added in a 1:1:1 (w:w:w) ratio to both 3% (w/v) solutions of CMC
and CS, the total ratio of solids of CS:CMC:CNC will be 10:10:20. Likewise, If the 1.2% CNC solution
is added in a 1:1:1 (w:w:w) ratio to both 3% (w/v) solutions of CMC and CS, the total ratio of solids of
CS:CMC:CNC will be 10:10:4.
4.3. Polysaccharide Blend Properties Testing
4.3.1. Background and Preliminary Results Guiding Blend Formation Parameters
4.3.1.1. Selection of pH
Preliminary research concluded that mechanical and liquid barrier properties, across a pH range
Page 38
27
3-9, were optimal using a CMC:CS blend at pH~3 (N. Mishra and J.M. Catchmark. Manuscript under
preparation). Solution pH is suspected to play a significant role on the associations of the polymers
through electrostatic interactions which are pH dependent.
4.3.1.2. Selection of Solids Content
Preliminary research was conducted beginning with a CMC:CS blend containing 4% solids. The
blend was then tested in a Zahn cup, a cup with an opening at the bottom to allow liquids of a certain
viscosity range to pass through. To ensure proper passage through the spray apparatus, the solution
should pass entirely through the Zahn cup in 10-60 seconds corresponding to a viscosity range from
approximately 79-784 cSt.
The solution containing 4% solids did not pass through the Zahn cup in the acceptable time
range.
A 3% solution was then formulated and tested for proper passage through the Zahn cup. The 3%
solution passed through within the acceptable time range. This blend was chosen on which to pursue
extensive research because 3% solids content is the largest content that will properly pass through the
apparatus. The highest solids content is desirable to reduce water consumption as well as reduce energy
required to dehydrate the solution.
4.3.1.3. Stoichiometry Selection
Blend stoichiometry was selected by comparing the effect that various ratios of CMC and CS
had on particle sizes and viscosities. As figure 4-2 suggests, the optimal blend would be a 1 : 0.75
(w/w) ratio of CMC:CS. This blend however did not pass through the Zahn cup in the acceptable time
Page 39
28
range. The high viscosity of an optimal blend could suggest that a more viscous blend is created
because there are more bound particles and a smaller amount of supernatant containing nearly the same
amount of unbound particles as a 1:1 blend. Because of the viscous nature of the 1 : 0.75 blend, the 1:1
(w/w) ratio of CMC:CS was used.
Figure 4-2: CMC:CS Ratio’s effect on particle size and supernatant solids content.
4.3.2. Viscosity
Viscosity of a fluid is defined in Keith Symon's Mechanics (3rd Edition) (1971) as a “measure of
[the liquid's] resistance to gradual deformation by shear stress or tensile stress.” This property can be
tested in several ways. Many industries utilize a Zahn Cup which is a measure of time for a fluid to
pass through a cup of certain volume, opening size, and material. These cups correspond to viscosities
Page 40
29
at various temperature and pressures. To obtain viscosity values over a change in shear stresses,
rheology is used. In this study, a TA AR-2000 Rheometer was used to test the viscosity at 25 °C due to
the conditions at which the blend was applied.
4.3.3. Particle Size
The particle size of the polysaccharide blend was determined using a Malvern Mastersizer “S”.
This instrument will plot a particle size distribution in the range of 0.05 – 900 microns. Various blend
times were tested for particle size to show the correlation between the blending time and the particle
size.
In this experiment, the instrument uses a laser calibrated to DI water to measure particle size
distributions of aqueous solutions. The instrument’s laser is aligned with several optical detectors that
detect changes in light scattering. Many detectors are used to reduce the error involved with particle
shape irregularity and orientation. For example, if a particle is twice as long (2x) as it is wide (x), the
detectors can obtain some value between x and 2x. If multiple values are obtained over multiple sweeps
during the experiment, the size of each particle is better represented.
4.3.4. Scanning Electron Microscopy
Scanning electron microscopy (SEM) uses an electron beam and detector to produce images in
the nano- to micro- range (10^-9 – 10^-6). Using a length scale, some porosity measurements can be
evaluated from the image. In this study, a scanning electron microscope was utilized to measure the
porosity of the substrate used.
Page 41
30
4.4. Deposition and Drying of Polysaccharide Blend to Paper Samples
The spray gun apparatus, shown in in figure 4-3, consists of the spray gun held stationary by a
chemical stand on a platform with a 6 inch diameter hole raised one inch to prevent the sprayed sample
from contacting foreign objects that would create permutations in the coating. To ensure proper flow
through the spraying apparatus, the solution exited the system at 30 psi. The blended solution was
applied to both sides of the two types of paper substrates according to a percent of weight added to the
sample. An objective of this research was to minimize the added amount of blend needed to create a
liquid and vapor barrier; therefore, samples were to not exceed more than 25% weight added.
The two substrates used in this research included commercial copy paper purchased from
American Eagle Paper Mills (Tyrone, PA) and a substrate provided by a manufacturing partner that
consisted of an isolated pulp with no additives. The commercial copy paper had a density of
grams per cubic millimeter and the partner supplied substrate had a density of
grams per cubic millimeter.
After spraying on both sides of the substrate, the coating was dried in an oven at 110 °C for 30
minutes. The samples were then removed and allowed to sit overnight. From here, 3cm by 3cm
samples were cut and weighed to determine loading values. To obtain loading values, equation was
used:
(6)
Page 42
31
Figure 4-3: Spray Apparatus for Blend Deposition to Substrates.
A process similar to the one utilized by Salminen et al. (2011) was used to spray the solution on
paper samples. Furthermore, one constituent that was examined is the spray duration. Fluid dynamics
would suggest that the longer the spray duration, the more solution will be added to the sample due to
the volumetric flow rate, governed by equation (7):
Where: Volumetric Flow Rate
The Change in Volume
The Change in Time
The spraying apparatus was developed to cover a specific area of a paper sample. The area can
(7)
Page 43
32
vary depending on application which may also present uniformity constraints to achieve final
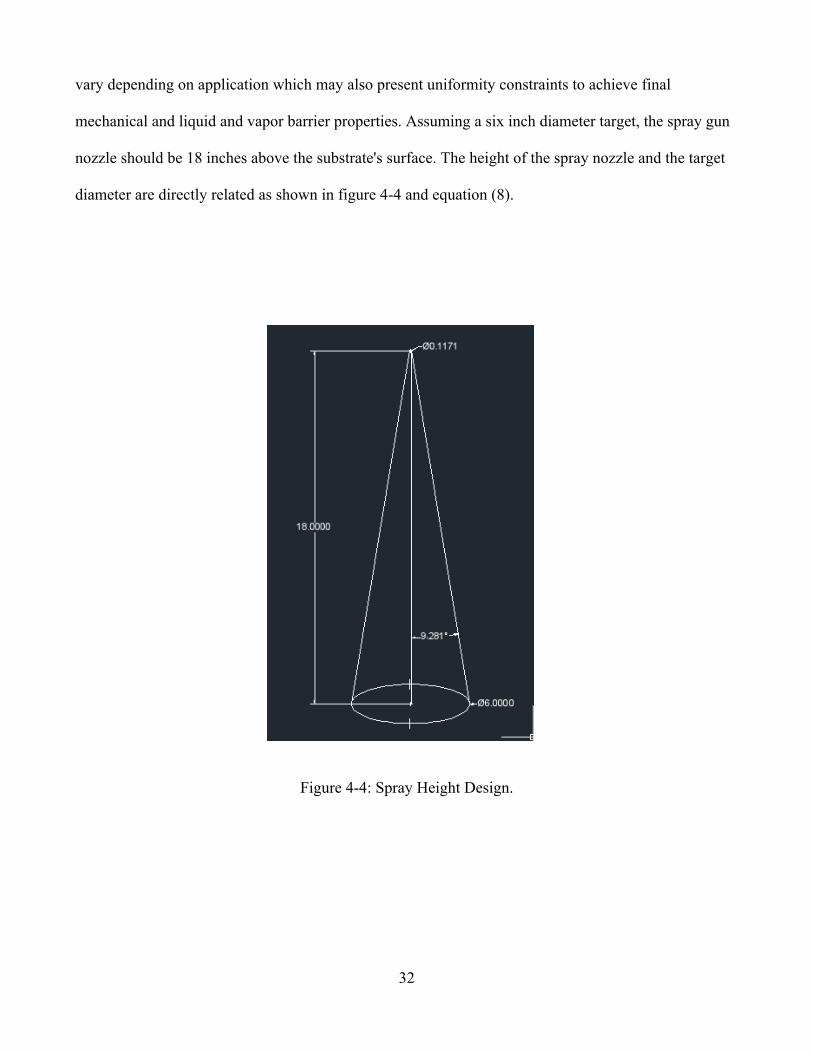
mechanical and liquid and vapor barrier properties. Assuming a six inch diameter target, the spray gun
nozzle should be 18 inches above the substrate's surface. The height of the spray nozzle and the target
diameter are directly related as shown in figure 4-4 and equation (8).
Figure 4-4: Spray Height Design.
Page 44
33
High temperature drying, suggested by Kanie et al. (2005) of the samples will control evaporation and
allow the polymer to cure on the surface without phase separation.
4.5. Testing of Coated Samples
4.5. Testing of Coated Samples
4.5.1. Tensile Testing
Mechanical strength properties of each sample were measured using a dynamic mechanical
analyzer from TA, model Q800, shown in figure 4-5. Two variations of submersed and dry, controlled
force ramps were applied to each sample and stress and strain values were recorded throughout the
process. First, a test was run in DI water with a preload force of 0.1 Newton, isothermal temperature of
25 °C, soak time equal to 25 minutes, and a force ramp of 0.01 Newton per minute until the sample
broke. The second test increased the isothermal temperature to 80 °C. For the submersed tests, the
submersion tension film clamp was used and for the dry tensile test, the tension film/fiber clamp was
used.
Where r = spray radius C = spray diameter In the case in figure 4-4:
*Note: 0.1171 is half the diameter of the spray nozzle opening in inches.
(8)
Page 45
34
Figure 4-5: Dynamic Mechanical Analyzer Q800 Series from TA Instruments.
4.5.2. Liquid Penetration Time
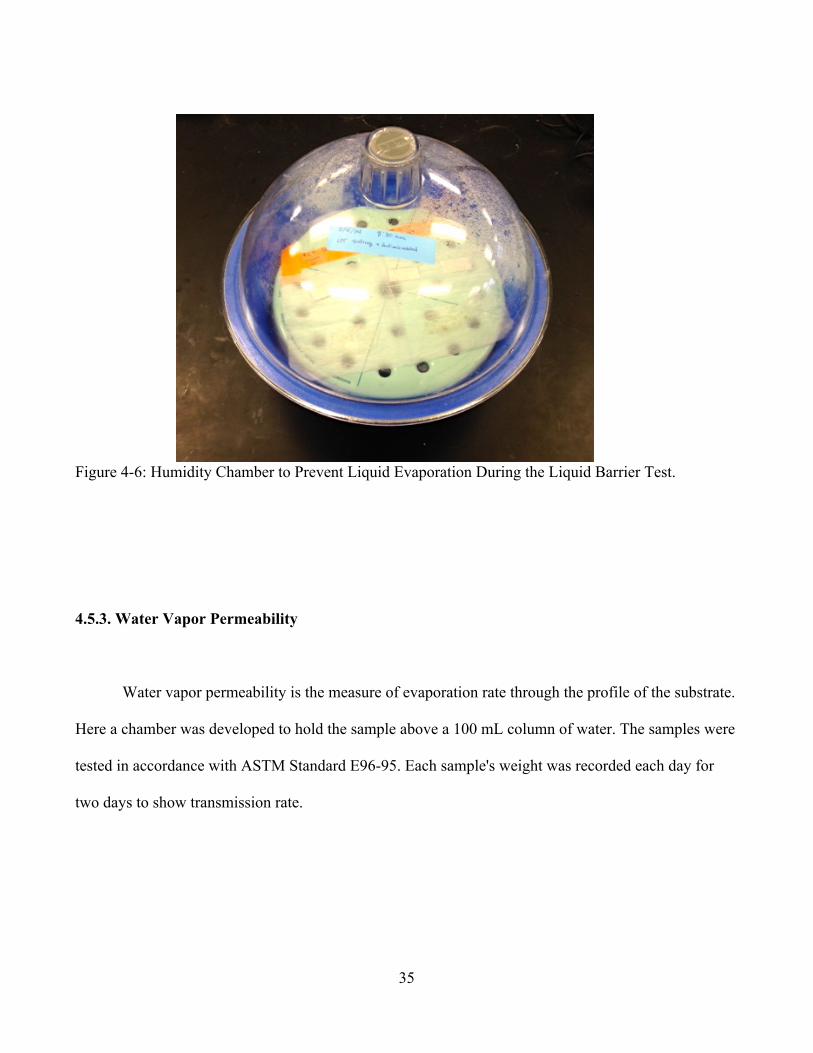
Coated and non-coated samples were placed in a humidity chamber, shown in figure 4-6, to
prevent evaporation of the test liquid from the paper surface. On each substrate, 0.2 mL of deionized
water was placed on the surface and observed for liquid penetration. The time to penetration was
recorded when the bottom of the samples showed dampness. Tests were run with the DI water pH at
pH 3, 7, and 9. The DI water was adjusted using acetic acid.
Page 46
35
Figure 4-6: Humidity Chamber to Prevent Liquid Evaporation During the Liquid Barrier Test.
4.5.3. Water Vapor Permeability
Water vapor permeability is the measure of evaporation rate through the profile of the substrate.
Here a chamber was developed to hold the sample above a 100 mL column of water. The samples were
tested in accordance with ASTM Standard E96-95. Each sample's weight was recorded each day for
two days to show transmission rate.
Page 47
36
Figure 4-7: Water Vapor Transmission Rate Test Apparatus.
The vapor transmission test apparatus used was developed by a previous colleague, Mr. Andrew
Wolos. This apparatus, shown in figure 4-7, has a chamber that can hold a column of water, as well as a
watertight seal where the sample will be placed. The water column will be on top of the sample and
samples will be weighed each day to observe and quantify the amount of water lost through the profile
of the sample. A computer-aided cross-section of the apparatus is shown in figure 4-8.
Page 48
37
Figure 4-8: Cross Section of Water Vapor Permeability Apparatus.
4.6. Data Collection and Analysis
Iterations from each data set were compiled and the mean was calculated. From the mean,
standard deviation was calculated using equation (9):
(9)
Page 49
38
Where: Standard Deviation
Number of Samples
Point Value
Population Mean
Page 50
39
Chapter 5
Results and Discussion
5.1. Effects of Blending Time on Particle Size
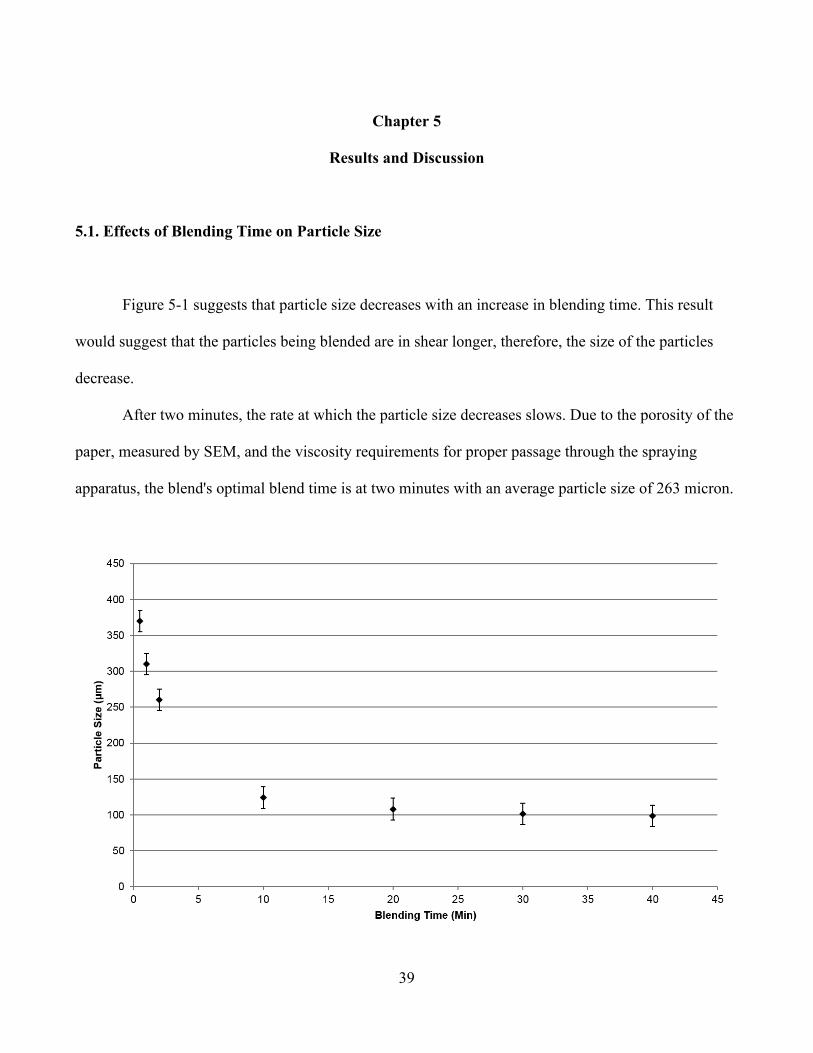
Figure 5-1 suggests that particle size decreases with an increase in blending time. This result
would suggest that the particles being blended are in shear longer, therefore, the size of the particles
decrease.
After two minutes, the rate at which the particle size decreases slows. Due to the porosity of the
paper, measured by SEM, and the viscosity requirements for proper passage through the spraying
apparatus, the blend's optimal blend time is at two minutes with an average particle size of 263 micron.
Page 51
40
Figure 5-1: Average Particle Size as a Function of Blending Time.
Looking at the hypotheses from Chapter 3:
1o- Particle size of CMC: CS solutions are not affected by blending time.
1- Particle size of CMC: CS solutions are affected by blending time.
The data does not support the null hypothesis, thus suggesting that particle size of CMC:CS solutions
are affected by blending time.
5.2. Scanning Electron Microscopy of Substrate Porosity and Thickness
Scanning electron microscopy shows a proper coating of a polysaccharide blend on a cellulosic
substrate. As shown in figure 5-2, the porosity in the substrate does not exceed 200 micron, suggesting
that the average particle size of a two minute blended (263 micron) solution will adequately lie on the
substrate surface with little to no penetration of polymer into the profile inner fiber network of the
substrate.
Page 52
41
Figure 5-2: Scanning Electron Microscope image of a cellulosic substrate with CMC: CS a coating.
5.3. Effects of Concentration on Viscosity
The viscosity of the blend varies with the solids content of the solution. As shown in figure 5-3,
the viscosity decreases with a decrease in solids concentration.
Page 53
42
Figure 5-3: Viscosity versus Shear Stress as a Function of Concentration.
5.4. Effects of Polysaccharide Blends on Mechanical Properties
With the copy paper coated at ~13 - 15% loading by weight, vast improvements were made in
both the strain at break and stress at break shown in table 1. The partner supplied packaging substrate
however, showed improvements in the strain at break but slightly decreased in stress at break. The
decreased value of the stress at break could be due to variations in stoichiometry of surface interaction
due to unknown additives in the substrate's pulp. Results for DMA on partner supplied substrates can
also be seen in table 5-1.
Page 54
43
Table 5-1. Tensile Testing on Coated and Uncoated Copy Paper Substrates.
! Mechanical!Analysis!! ! ! !! ! Coated!Copy!Paper! Uncoated!Copy!Paper!
25C! Stress!at!break! 1.8MPa! 0.5173!MPa!Strain!at!break! 3.50%! 0.65%!
80C! Stress!at!break! 0.61MPa! 0.08!MPa!Strain!at!break! 4.40%! 2.02%!
Table 5-2. Tensile Testing on Coated and Partner Supplied Substrates.
! Mechanical!Analysis!! ! ! !
! !Coated!Partner!
Supplied!Substrate!Uncoated!Partner!Supplied!Substrate!!
25C! Stress!at!break! 0.7MPa! 1.329MPa!Strain!at!break! 9.75%! 2.63%!
80C! Stress!at!break! 0.31MPa! 0.2987MPa!Strain!at!break! 8.98%! 11.76%!
Furthermore, CMC:CS blends including CNC’s were used to coat commercial copy paper and
the tensile strength and stress were measured under wet and dry conditions. These values are shown in
table 5-3, table 5-4, table 5-5, and table 5-6.
Page 55
44
Table 5-3: Stress at Break Under Wet Conditions for Various CMC:CS:CNC Ratios on Commercial
Copy Paper.
Wet Stress at Break (MPa) Temperature (C)
CCP (Control Copy Paper)
10:10:0 (CS:CMC:CNC)
10:10:4 (CS:CMC:CNC)
10:10:20 (CS:CMC:CNC)
25 0.5173 1.8 0.362 0.757 80 0.3152 0.61 0.158 0.3877
Table 5-4: Stress at Break Under Dry Conditions for Various CMC:CS:CNC Ratios on Commercial
Copy Paper.
Dry Stress at Break (MPa) Temperature (C)
CCP (Control Copy Paper)
10:10:0 (CS:CMC:CNC)
10:10:4 (CS:CMC:CNC)
10:10:20 (CS:CMC:CNC)
25 63.07 29.44 31.53 29.78 80 37.33 24.36 20.28 26.75
Table 5-5: Strain at Break Under Wet Conditions for Various CMC:CS:CNC Ratios on Commercial
Copy Paper.
Wet Strain at Break (%) Temperature (C)
CCP (Control Copy Paper)
10:10:0 (CS:CMC:CNC)
10:10:4 (CS:CMC:CNC)
10:10:20 (CS:CMC:CNC)
25 0.6515 3.5 1.872 2.558 80 0.3152 4.4 2.169 1.471
Page 56
45
Table 5-6: Strain at Break Under Dry Conditions for Various CMC:CS:CNC Ratios on Commercial
Copy Paper.
Dry Strain at Break (%) Temperature (C)
CCP (Control Copy Paper)
10:10:0 (CS:CMC:CNC)
10:10:4 (CS:CMC:CNC)
10:10:20 (CS:CMC:CNC)
25 0.967 0.4682 1.033 0.6119 80 0.8426 0.2096 0.8013 0.3061
First, for the wet stress and strain at break, the value decreased with the introduction of CNC’s,
yet, after the initial decrease, the value seems to increase as the CNC content increased. This could
happen by creating porosity for all CNC blends allowing the substrate to become saturated and more
susceptible to failure. Yet, because the substrate is fully saturated in all CNC cases, the additional CNC
content creates a more rigid film which is driving the stress and strain at break value at failure.
For dry conditions, the stress at break increases with the presence of CNC’s yet, does not show
an increase from the 10:10:4 to 10:10:20 blends. This would suggest that, for dry conditions, the
additional CNC content is not needed. For a manufacturer, using a 10:10:4 blend as opposed to a
10:10:20 blend would save material cost for the company.
The Young’s modulus was derived for each blend by examining the most linear region of the
stress versus strain plot. For every point within the linear region, the derivative was calculated and then
plotted to find the modulus. The wet modulus values can be seen in figure 5-4 for the substrate control,
CMC:CS blend (10:10:0), 10:10:4 and 10:10:20 blends. Likewise, the dry modulus data is shown in
figure 5-5.
Page 57
46
Figure 5-4: Derived Wet Modulus of Various Blends
The hypotheses from Chapter 3 are:
3o- Wet modulus will not increase with the addition of a film from a dehydrated solution of CMC and
CS sprayed onto a surface of a cellulosic substrate whose density ranges from x -
x g/ .
3- Wet modulus will increase with the addition of a film from a dehydrated solution of CMC and CS
sprayed onto a surface of a cellulosic substrate whose density ranges from x - x
g/ .
The data suggests that the null is rejected; therefore, supporting the claim that wet modulus will
increase with the addition of a film from a dehydrated solution of CMC and CS sprayed onto a surface
of a cellulosic substrate whose density ranges from x - x g/ .
For CNC incorporation, the hypotheses from Chapter 3 state:
Page 58
47
7o- Incorporation of cellulose nanocrystals into dehydrated solution of CMC and CS sprayed onto a
surface of a cellulosic substrate whose density ranged from x - x g/ modulus
will not increase wet modulus.
7- Incorporation of cellulose nanocrystals into dehydrated solution of CMC and CS sprayed onto a
surface of a cellulosic substrate whose density ranged from x - x g/ will
increase wet modulus.
Due to the possible stoichiometric change, further experimentation is required.
Figure 5-5: Derived Dry Modulus of Various Blends
Page 59
48
The hypotheses in Chapter 3 state:
4o- Dry modulus will not increase with the addition of a film from a dehydrated solution of CMC and
CS sprayed onto a surface of a cellulosic substrate whose density ranges from x -
x g/mm2.
4- Dry modulus will increase with the addition of a film from a dehydrated solution of CMC and CS
sprayed onto a surface of a cellulosic substrate whose density ranges from x - x
g/ .
The data at 25°C suggests that the dry modulus will increase with the addition of a film from a
dehydrated solution of CMC and CS sprayed onto a surface of a cellulosic substrate whose density
ranges from x - x g/ , yet the data at 80°C supports the null that the dry
modulus will not increase with the addition of a film from a dehydrated solution of CMC and CS
sprayed onto a surface of a cellulosic substrate whose density ranges from x - x
g/mm2.
As figure 5-4 suggests, the blend with no CNC’s performed the best in saturated conditions,
while the dry modulus increased with the amount of CNC’s added to the blend. This data suggests that
the CNC’s affect the stoichiometry of the blend creating a more porous structure to allow water to have
a greater effect on the paper substrate. The CNC blends do improve strength of dry modulus as a result
of increased length of the fibrous network.
Page 60
49
For CNC incorporation, the hypotheses for dry modulus are as follows:
8o- Incorporation of cellulose nanocrystals into dehydrated solution of CMC and CS sprayed onto a
surface of a cellulosic substrate whose density ranged from x - x g/ modulus
will not increase dry modulus.
8- Incorporation of cellulose nanocrystals into dehydrated solution of CMC and CS sprayed onto a
surface of a cellulosic substrate whose density ranged from x - x g/ will
increase dry modulus.
The data suggests that at 25°C, the null can be rejected, thus supporting that incorporation of cellulose
nanocrystals into dehydrated solution of CMC and CS sprayed onto a surface of a cellulosic substrate
whose density ranged from x - x g/ will increase dry modulus. Yet, no
significant improvements were witnessed at 80°C.
5.5. Effects of Polysaccharide Blend on Liquid Penetration Time
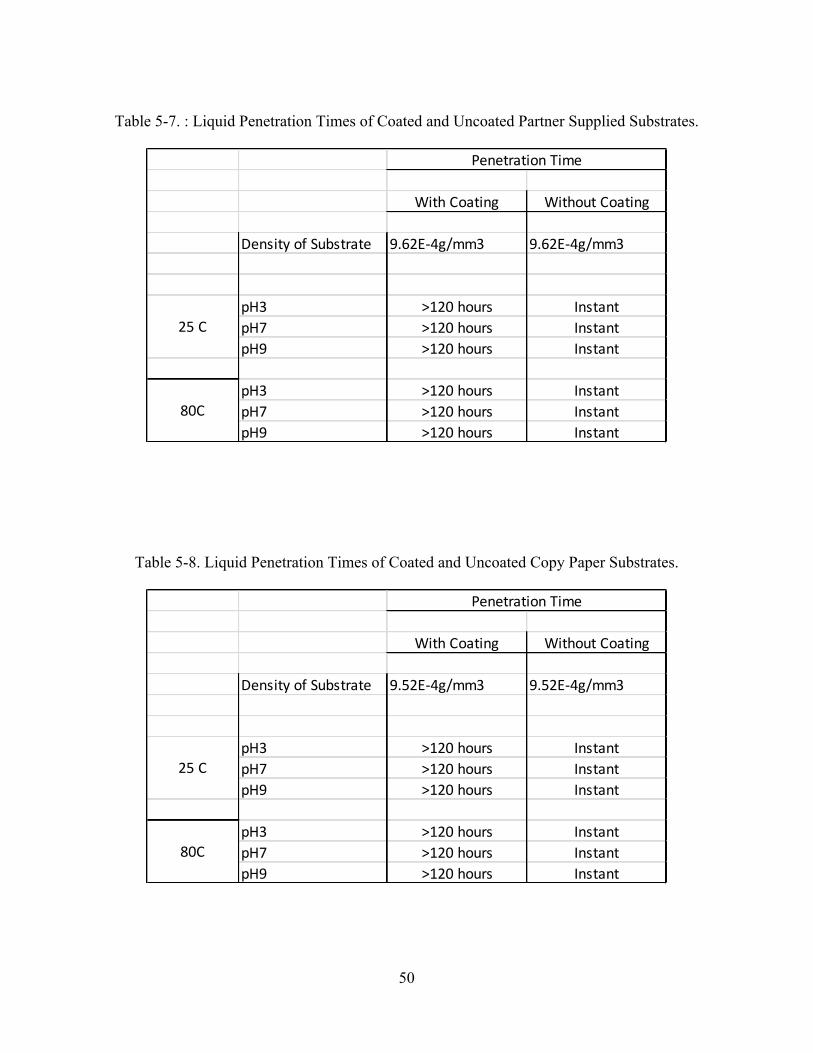
The addition of a CMC and CS blend greatly increased liquid penetration time from the
uncoated samples. Results for the partner supplied substrates’ liquid penetration times can be seen in
table 4. Similarly, results for the commercial copy paper substrates’ liquid penetration times can be
seen in table 5.
Page 61
50
Table 5-7. : Liquid Penetration Times of Coated and Uncoated Partner Supplied Substrates.
With%Coating Without%Coating
Density%of%Substrate 9.62E94g/mm3 9.62E94g/mm3
pH3 >120%hours InstantpH7 >120%hours InstantpH9 >120%hours Instant
pH3 >120%hours InstantpH7 >120%hours InstantpH9 >120%hours Instant
25%C
80C
Penetration%Time
Table 5-8. Liquid Penetration Times of Coated and Uncoated Copy Paper Substrates.
With%Coating Without%Coating
Density%of%Substrate 9.52E94g/mm3 9.52E94g/mm3
pH3 >120%hours InstantpH7 >120%hours InstantpH9 >120%hours Instant
pH3 >120%hours InstantpH7 >120%hours InstantpH9 >120%hours Instant
Penetration%Time
25%C
80C
Page 62
51
Liquid penetration time was also measured for blends containing CNC’s. Figure 5-6 shows the
times to penetration for each blend for pH 3, 7, and 9. The data suggests that the increasing content of
CNC increases porosity, allowing water to penetrate through the substrate at a higher rate. This data
supports the theory of increased porosity first described with the witness of a decreased wet modulus
with an increasing CNC content.
Figure 5-6: Liquid Penetration Time of Various CMC:CS:CNC Ratios on Commercial Copy Paper at
Various pH Values.
Revisiting the hypotheses from Chapter 3:
2o- A film formed from a dehydrated solution of CMC and CS, sprayed onto a surface of a cellulosic
Page 63
52
substrate whose density ranged from x - x g/ , will not resist penetration of a
liquid whose pH ranges from 3-9.
2- A film formed from a dehydrated solution of CMC and CS, sprayed onto a surface of a cellulosic
substrate whose density ranged from x - x g/ , will resist penetration of a
liquid whose pH ranges from 3-9.
The data does not support the null hypothesis therefore suggesting that a film formed from a
dehydrated solution of CMC and CS, sprayed onto a surface of a cellulosic substrate whose density
ranged from x - x g/ , will resist penetration of a liquid whose pH ranges from
3-9.
Furthermore, hypotheses were made with the incorporation of CNC’s into the blend, stating:
6o- Incorporation of cellulose nanocrystals into dehydrated solution of CMC and CS sprayed onto a
surface of a cellulosic substrate whose density ranged from x - x g/ will not
resist penetration of a liquid whose pH ranges from 3-9.
6- Incorporation of cellulose nanocrystals into dehydrated solution of CMC and CS sprayed onto a
surface of a cellulosic substrate whose density ranged from x - x g/ will
resist penetration of a liquid whose pH ranges from 3-9.
Due to the theory of nanoporosity, this phenomenae cannot yet be explained and should be explored
further in future experimentation.
Page 64
53
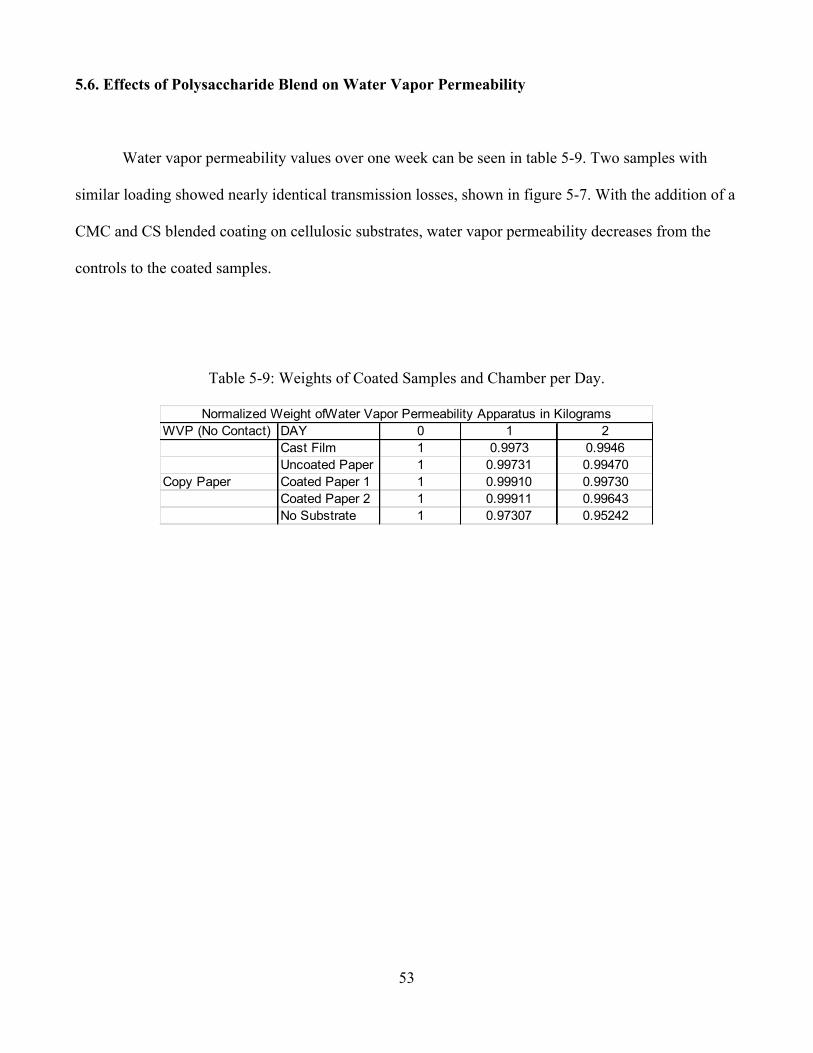
5.6. Effects of Polysaccharide Blend on Water Vapor Permeability
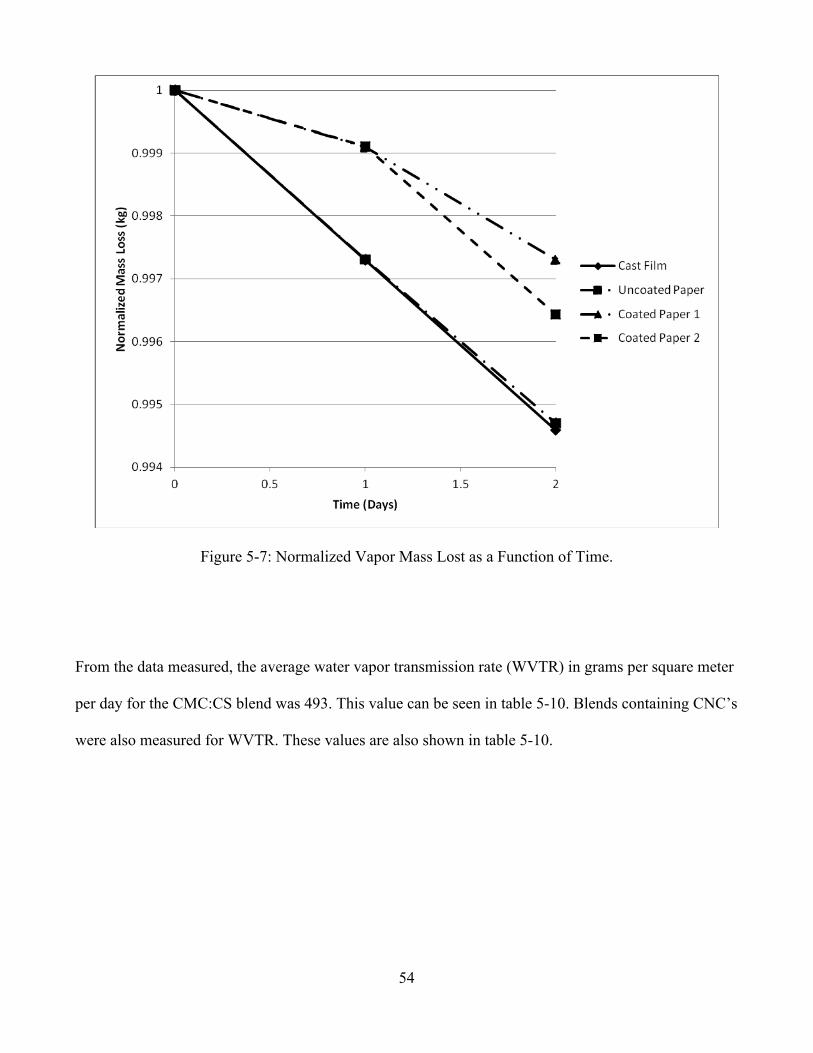
Water vapor permeability values over one week can be seen in table 5-9. Two samples with
similar loading showed nearly identical transmission losses, shown in figure 5-7. With the addition of a
CMC and CS blended coating on cellulosic substrates, water vapor permeability decreases from the
controls to the coated samples.
Table 5-9: Weights of Coated Samples and Chamber per Day.
WVP (No Contact) DAY 0 1 2Cast Film 1 0.9973 0.9946Uncoated Paper 1 0.99731 0.99470
Copy Paper Coated Paper 1 1 0.99910 0.99730Coated Paper 2 1 0.99911 0.99643No Substrate 1 0.97307 0.95242
Normalized Weight ofWater Vapor Permeability Apparatus in Kilograms
Page 65
54
Figure 5-7: Normalized Vapor Mass Lost as a Function of Time.
From the data measured, the average water vapor transmission rate (WVTR) in grams per square meter
per day for the CMC:CS blend was 493. This value can be seen in table 5-10. Blends containing CNC’s
were also measured for WVTR. These values are also shown in table 5-10.
Page 66
55
Table 5-10: Water Vapor Transmission Rates for Various CMC:CS:CNC Ratios and a Low Density
Polyethylene Control.
Hypotheses 5o and 5 state:
5o- Water vapor transmission rate will not decrease with the addition of a film from a dehydrated
solution of CMC and CS sprayed onto a surface of a cellulosic substrate whose density ranges from
x - x g/ .
5- Water vapor transmission rate will decrease with the addition of a film from a dehydrated solution of
CMC and CS sprayed onto a surface of a cellulosic substrate whose density ranges from x -
x g/ .
The data here suggests that the null hypothesis be rejected; therefore, supporting the hypothesis that
water vapor transmission rate will decrease with the addition of a film from a dehydrated solution of
CMC and CS sprayed onto a surface of a cellulosic substrate whose density ranges from x -
x g/ .
Page 67
56
For CNC incorporation, the hypotheses from Chapter 3 are as follows:
9o- Incorporation of cellulose nanocrystals into dehydrated solution of CMC and CS sprayed onto a
surface of a cellulosic substrate whose density ranged from x - x g/ modulus
will not decrease water vapor transmission rate.
9- Incorporation of cellulose nanocrystals into dehydrated solution of CMC and CS sprayed onto a
surface of a cellulosic substrate whose density ranged from x - x g/ will
decrease water vapor transmission rate.
The data suggests that water vapor transmission rate increases from the control of a CMC:CS blend
without CNC’s. This increase means that the null can be accepted and incorporation of cellulose
nanocrystals into dehydrated solution of CMC and CS sprayed onto a surface of a cellulosic substrate
whose density ranged from x - x g/ modulus will not decrease water vapor
transmission rate.
Page 68
57
Chapter 6
Conclusions and Direction
6.1. Conclusions:
The results of this study show that a blend of cationic and anionic polysaccharides, notably
carboxymethyl cellulose and chitosan, can be applied via spray and dehydrated to successfully enhance
cellulosic substrates in wet-mechanical properties as well as liquid barrier properties.
The CMC:CS coating successfully creates a barrier that segregates liquid water and water vapor
from the cellulosic substrate for a period greater than 120 hours without the addition of CNC’s. CNC
content decreased liquid barrier properties. Such a barrier could be utilized to coat food packaging
products to prevent water damage to the packaging or even the contents within the packaging
themselves.
Tensile tests suggest that the coating also aids in improving the mechanical properties of the
packaging material, potentially aiding in a greater weight capacity for food storage. Dry tensile tests
show that CNC incorporation into the blend creates a stronger film, yet, decreases the strength of the
blend in wet conditions.
The invention of this coating will lead to the enhancement of the biological materials
engineering field by opening doors to other polysaccharide blends.
Page 69
58
6.2. Future Consideration:
The results of this study have the potential to inspire future research in the area of
polysaccharide blends. One way to improve on the current formulation is to be mindful of industrial
needs. For example, if one of the constituents could be replaced by a cheaper product without
sacrificing a large decrease in mechanical and liquid barrier properties, companies can save on cost.
One such potential substitution could be replacing chitosan with a cationic starch.
Some literature has suggested the use of plasticizers such as glycerol with polysaccharide films
to increase folding endurance and elasticity. Some preliminary research was conducted, but was not
completed for this study. Future studies should pursue the use of plasticizers for various applications.
Furthermore, depending on application, other base constituents may be worth pursuing. For
example, if the substrate does not require food grade materials, a dioctehedral clay may be used with a
one of the ionic components of the blend to create an impermeable barrier for construction materials.
Other areas need to be explored further such as degradation time and antimicrobial activity. If
the blend promotes growth as a polysaccharide substrate, an additive may need to be explored to
eliminate such activity.
These suggestions should be explored to further improve the field and science as a whole.
Page 70
59
References
Ashland. 2011. Food Ingredient Solutions. Wilmington, DE: Ashland Specialty Ingredients. Available
at: www.ashland.com/Ashland/Static/Documents/ASI/PC_10238_Food_Ingredient_Solutions.
pdf. Accessed 29 September 2012.
Byrd, J.A., B.M. Hargis, D.J. Caldwell, R.H. Bailey, K.L. Herron, J.L. Reynolds, R.L. Brewer, R.C.
Anderson, K.M. Bischoff, T.R. Callaway, and L.F. Kubena. 2000. Effect of Lactic Acid in the
Drinking Water During Preslaughter Feed Withdrawal on Salmonella and Campylobacter
Contamination of Broilers. Poultry Science.
Chanliaud, E., K.M. Burrows, G. Jeronimidis, and M.J. Gidley. 2002. Mechanical Properties of
Primary Plant Cell Wall Analogues. Planta.
Chawla, P. R., I. B. Bajaj, S. A. Survase, and R. S. Singhal. 2009. Microbial Cellulose: Fermentative
Production and Applications. Food Technology and Biotechnology. 107-124.
Cheng, K. C., J. M. Catchmark, and A. Demirci. 2009. Effect of Different Additives on Bacterial
Cellulose Production by Acetobacter xylinum and Analysis of Material Property. Springer
Science + Business Media.
EPA. 2012. Plastics. Washington D.C.: Environmental Protection Agency. Available at:
Page 71
60
http://www.epa.gov/osw/conserve/materials/plastics.htm. Accessed 24 September 2012.
Fatehi, P., L. Qian, R. Kititerakun, T. Rirksomboon, and H. Xiao. 2009. Complex Formation of
Modified Chitosan and Carboxymethyl Cellulose and its Effect on Paper Properties. Paper
Strength Additives.
Fatehi, P., R. Kititerakun, Y. Ni, H. Xiao. (2010) Synergy of CMC and modified chitosan on strength
properties of cellulosic fiber network. Carbohydrate Polymers. Vol: 80. 208-214.
FDA. 2012. Bisphenol A: Use in Food Contact Application. Silver Spring, MD: Food and Drug
Administration. Available at:
http://www.fda.gov/NewsEvents/PublicHealthFocus/ucm064437.htm. Accessed 25 September
2012.
Garcia, M. A., A. Pinotti, and N. E. Zaritzky. 2006. Physiochemical, Water Vapor Barrier and
Mechanical Properties of Corn Starch and Chitosan Composite Films. Starch.
Gardlund, L., L. Wagberg, and R. Gernandt. 2003. Polyelectric complexes for surface modification of
wood fibres II. Influence of complexes on wet and dry strength of paper. Colloids and Surfaces
A: Physicochemical and Engineering Aspects. 137-149.
Ha, S., R. Larsen, Y. Zhu, R.I. Masel. 2004. Direct Formic Acid Fuel Cells with 600 mA cm-2 at
Page 72
61
0.4 V and 22� C. Fuel Cells. Vol 4: 337-343.
Haug, A., and O. Smidsrod. 1970. Selectivity of Some Anionic Polymers for Divalent Metal Ions.
Acta Chemica Scandinavica. Vol 24: 843-854.
Humphrey, T.J., D.G. Lanning. 1987. The vertical transmission of salmonellas and formic acid
treatment of chicken feed: A possible strategy for control. Epidemiology and Infection.
Vol: 100. 43-49.
Jakab, C. 2007. Clean Air and Water. North Mankato, MN: Smart Apple Media.
Kanie, O., H. Tanka, A. Mayumi, T. Kitaoka, and H. Wariishi. 2005. Composite Sheets with
Biodegradable Polymers and Paper, the Effect of Paper Strengthening Agents on Strength
Enhancement, and an Evaluation of Biodegradability. Wiley InterScience.
Koch, H., W. Haaf. 1-Adamantanecarboxylic Acid. Organic Syntheses. Vol 5: 20.
Li, H., Y. Du, Y. Xu, H. Zhan, and J. F. Kennedy. 2004. Interactions of Cationized Chistosan with
Components in a Chemical Pulp Suspension. Science Direct.
Linden, J.C., R.J. Stoner, K.W. Knutson, and C.A. Gardner-Hughes. 2000. Organic Disease Control
Elicitors. Agro Food Industry Hi-Tech.
Page 73
62
Mark, H.F., 2011. Encyclopedia of Polymer Science and Technology. Hoboken, NJ: Wiley
Interscience. Print.
Marshall, R.T., M.F. Bell. 2006. Microbiological and sensory tests of beef treated with acetic and
formic acids. Journal of Food Science. Vol: 64. 336-339.
Mucha, M., and D. Miskiewicz. 1999. Chitosan Blends as Fillers for Paper. Journal of Applied
Polymer Science. Vol: 77. 3210-3215.
Myllytie, P., L. Salmen, E. Haimi, and J. Laine. 2009. Viscoelasticity and Water Plasticization of
Polymer-Cellulose Composite Films and Paper Sheets. Cellulose.
Onsosyen, E., O. Skaugrud. 1990. Metal recovery using chitosan. Journal of Chemical Technology and
Biotechnology. Vol: 49. 395-404.
OSHA. 1991. Occupational Safety and Health Guideline for Formic Acid. Washington D.C.:
Occupational Safety and Health Administration. Available at:
http://www.osha.gov/SLTC/healthguidelines/formicacid/recognition.html. Accessed on: 29
October 2012.
Pilizota, V., D. Subaric, T. Lovric. 1996. Rheological Properties of CMC Dispersions at Low
Temperatures. Faculty of Food Technology and Biotechnology. Vol: 34. 87-90.
Page 74
63
Rachtanapun, P., and N. Rattanapanone. 2011. Synthesis and Characterization of Carboxymethyl
Cellulose Powder and Films from Mimosa pigra. Journal of Applied Polymer Science.
Vol 122: 3218-3226.
Salminen, K., J. Kataja-aho, H. Lindqvist, E. Retulainen, T. Rantanen, and A. Sundberg. 2011. The
Effects of Certain Polymers on Tensile Strength and Tension Relaxation of Wet Web.
PaperCon.
Samir, A., F. Alloin, A. Dufresne. 2005. “Review of Recent Research into Cellulose Whiskers, Their
Properties and Their Application in Nanocomposite Field.” Biomacromolecules. 612-626.
Saxena, A., T.J. Elder, A.J. Rangauskas. 2011. Moisture barrier properties of xlan composite films.
Carbohydrate Polymers. Vol: 84. 1371-1377.
Silvestrini-Biavati, A., F. Angiero, F. Gibelli, A. Signore, S. Benedicenti. 2011. In vitro determination
of the mechanical and chemical properties of a fibre orthodontic retainer. Eauropean Journal of
Orthodontics. Vol: 34. 693-697.
Symon, K.R., 1971. Mechanics. 3rd ed. University of Wisconsin.
Wang, Y., D. Zhang. 2013. Bioinspired assembly of layered double hydroxide/ carboxymethyl chitosan
bionanocomposite hydrogel films. Journal of Materials Chemistry B. Vol: 2. 1024-
1030.
Page 75
64
Woodruff, T.J., A.R. Zota, and J.M. Schwartz. 2011. Environmental Chemicals in Pregnant Women in
the United States: NHANES 2003-2004. Environmental Health Perspectives.
Xu, W. L., J. Wu, and C. L. Fu. 2001. Synthesis of Chitosan Quaternary Ammonium Salts.
Chinese Chemical Letters. Vol: 12. 1081-1084.
Zumdahl, S., T.S. Hummel, S.A. Zumdahl. 2003. Student Solutions Guide: Chemistry, 6th Edition.
Boston: Houghton Mifflin.