EngD Thesis IMPROVEMENTS TO THE BIODIESEL PROCESS by MATTHEW SLINN Supervisor: Professor Kevin Kendall Department of Chemical Engineering School of Engineering The University of Birmingham Edgbaston Birmingham B15 2TT United Kingdom 22 February 2008
Transcript
EngD Thesis
IMPROVEMENTS TO THE BIODIESEL PROCESS
by
MATTHEW SLINN
Supervisor: Professor Kevin Kendall
Department of Chemical Engineering School of Engineering
The University of Birmingham Edgbaston
Birmingham B15 2TT United Kingdom
22 February 2008
University of Birmingham Research Archive
e-theses repository This unpublished thesis/dissertation is copyright of the author and/or third parties. The intellectual property rights of the author or third parties in respect of this work are as defined by The Copyright Designs and Patents Act 1988 or as modified by any successor legislation. Any use made of information contained in this thesis/dissertation must be in accordance with that legislation and must be properly acknowledged. Further distribution or reproduction in any format is prohibited without the permission of the copyright holder.
ii
ABSTRACT
Biodiesel (fatty acid methyl ester, FAME) is a renewable diesel fuel made from vegetable
oil and methanol. The two main problems with the process are disposal of waste streams
and product purity. This thesis studies biodiesel process improvements, especially
glycerol conversion to hydrogen and improved mass transfer to increase ester yield.
Experiments on steam reforming with glycerol and waste water over a platinum alumina
catalyst were used to convert the combined waste product streams of a biodiesel plant.
Mass spectroscopy with internal standard was chosen to measure reformer gas yield and
conversion. The glycerol steam reforming was shown to depend on several reaction
variables. Therefore a solid oxide fuel cell was used as a sensor to measure the effects.
The results showed that good syngas yield, conversion and reformer life could be
obtained using this process.
The purity of the biodiesel product was examined using real-time optical microscopy and
gas chromatography to fit the FAME standard EN14214. It was observed that droplet
size had a major influence on reaction end point and that the reaction was mass-transfer
limited. This observation was confirmed by developing a mass-transfer based reaction
model using the data from the batch reactor which agreed with results from other
researchers. The model predicted better conversion with more mixing intensity. Finally,
on the basis of these results, a high mixing intensity continuous reactor was developed
which achieved the 96.5% standard with high flow rate and short reactor length.
iii
The conclusion was that significant cost effective improvements could be made to the
conventional FAME process.
iv
ACKNOWLEDGMENTS When writing this thesis I was supported buy several people morally, financially and
scientifically.
First I would like to thank Kevin Kendall my supervisor for his guidance, teaching and
editorial help with this thesis. I want to thank Richard Greenwood for giving me the
opportunity to do this EngD, for moral support and for correcting my drafts. I have been
given so many opportunities at the University of Birmingham and I have benefitted
greatly as a result. I thank the EPSRC for financially supporting this work.
I thank every one at Green Biodiesel and BHR Biofuels for their experience in the
process industry and help with this EngD. Chris Buttler, Matthew Cowling, Richard
Jackson and Matthew Davies have all been a great guiding influence on helping to find
the industrial problems this thesis deals with.
I would like to thank Christian Mallon for his advice on scientific writing and graphs. I
would like to thank Graham Burns and John Futter for teaching me analytical chemistry.
I would like to thank my parents and friends and my girl friend Heather for putting up
with me while this work was completed.
v
CONTENTS CHAPTER 1 INTRODUCTION 1 1.1. Background 1 1.2. Biodiesel problems 2 1.3. Objectives 4 1.4. Layout of this thesis 6 CHAPTER 2 THE INDUSTRIAL VIEW 7 2.1. Tax and incentives 7 2.2. Price of oil 8 2.3. The desire to be environmentally friendly 9 2.4. Future challenges to Biodiesel and other alternative fuels 12 2.5. Industrial benefits of this EngD 15 CHAPTER 3 LITERATURE SURVEY 16 3.1. Background 16
3.1.2. Introduction to Biodiesel 17 3.1.3. Description of Biodiesel process 18 3.1.4. Overview of Biodiesel process research 23
3.2. Problem areas global 26 3.2.2. Sustainability of biodiesel 26 3.2.3. Optimisation of biomass production 27 3.2.4. Separation and purification 28 3.2.5. Alternative processes 28
3.3. Problems addressed in this thesis 31 3.3.2. By-product use 31 3.3.3. Biodiesel reaction and reactor design 33 3.3.4. The future of biodiesel 35
3.4. What does it mean for thesis? 37 CHAPTER 4 STEAM REFORMING OF BIODIESEL BY-PRODUCT TO MAKE RENEWABLE HYDROGEN 38 4.1. Introduction to Steam reforming 38 4.2. Steam reforming theory 39
5.5.2. Proofing the mass transfer mechanism 88 5.5.3. Finding order of reaction and rate constants 93 5.5.4. Modelling reaction conversion 95 5.5.5. Effect of mixing 100 5.5.6. Effect of temperature 102 5.5.7. Effect of methanol ratio 104 5.5.8. Effect of NaOH concentration 105 5.5.9. Waste oil Impurity results 107
5.6. Discussion of possible solutions to the phase separation problem 110 5.6.2. Single phase 110 5.6.3. Co-surfactants and co-solvents 111 5.6.4. Optimisation of mixing 112
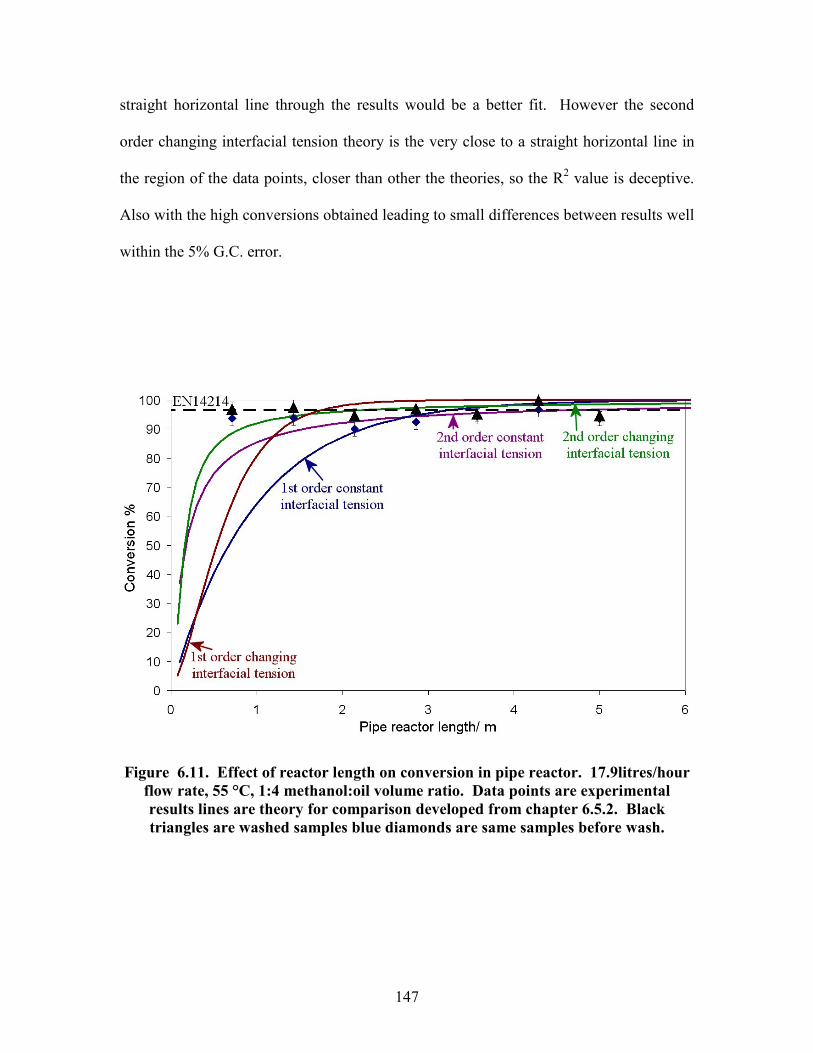
6.5. Results 134 6.5.2. Modelling reaction conversion 134 6.5.3. Tanks in series reactor 139 6.5.4. Pipe reactor results 142
6.6. Discussion 153 6.7. Conclusion 155 CHAPTER 7 CONCLUSIONS AND FUTURE WORK 156 7.1. Conclusions 156 7.2. Recommended future work 158 REFERENCES 160
viii
LIST OF FIGURES Figure 3.1. The number of biodiesel papers published year on year is exponentially increasing. 17 Figure 4.1: Reaction mechanism for glycerol reforming. 41 Figure 4.2: Carbon-Hydrogen-Oxygen equilibrium phase diagram. 42 Figure 4.3: Experimental set-up. 53 Figure 4.4: Activities of the different catalysts for reforming reactions. 55 Figure 4.5: Electrical performance of long run experiments for pure and by-product glycerol. 57 Figure 4.6: Effect of temperature on gas yield and H2 selectivity. 59 Figure 4.7: Effect of temperature on product gas stream composition. 60 Figure 4.8: Effects of feed steam/carbon ratio on gas yield, H2 selectivity and fuel cell current. 61 Figure 4.9: Effects of feed steam/carbon ratio on product gas stream composition. Theory lines from thermodynamic theory. Data points are results from mass spectrometer. 62 Figure 4.10: Reforming at differing flow rates. Effect of reformer flow rate on gas composition. 64 Figure 4.11: Effect of flow rate on gas yield, H2 selectivity and fuel cell current. Catalyst and fuel cell weighed differently but had same gas flow causing graphs not to overlap. 65 Figure 4.12: Fuel cell current degradation test running on pure glycerol. 66 Figure 4.13: HPLC of water trap components. Too many peaks with concentrations which were too small for identification. 67 Figure 5.1 Stepwise reaction mechanism. 72 Figure 5.2 Ester saponification to form soap (or soap esterification in reverse). Tri-glycerides, mono-glycerides, di-glycerides and fatty acids can also be saponified. 75 Figure 5.3 Ester hydrolysis to form fatty acids (or esterification in reverse). Tri-glycerides, mono-glycerides and di-glycerides can also be hydrolysed. 76
ix
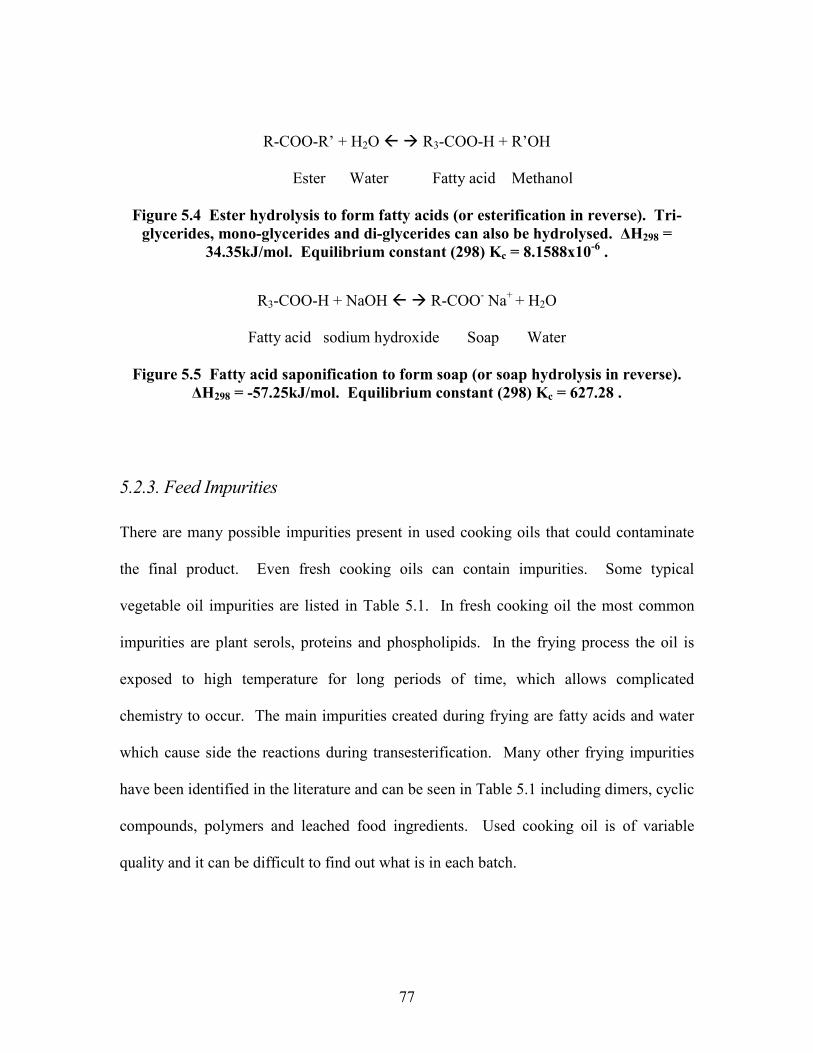
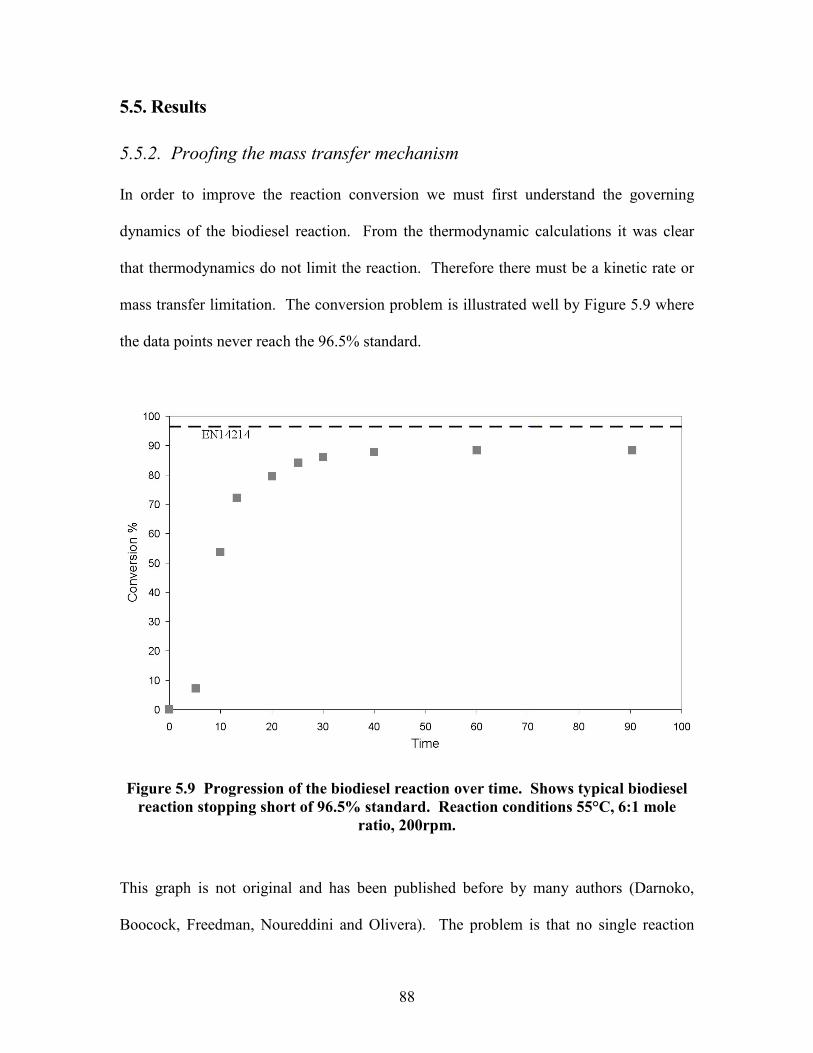
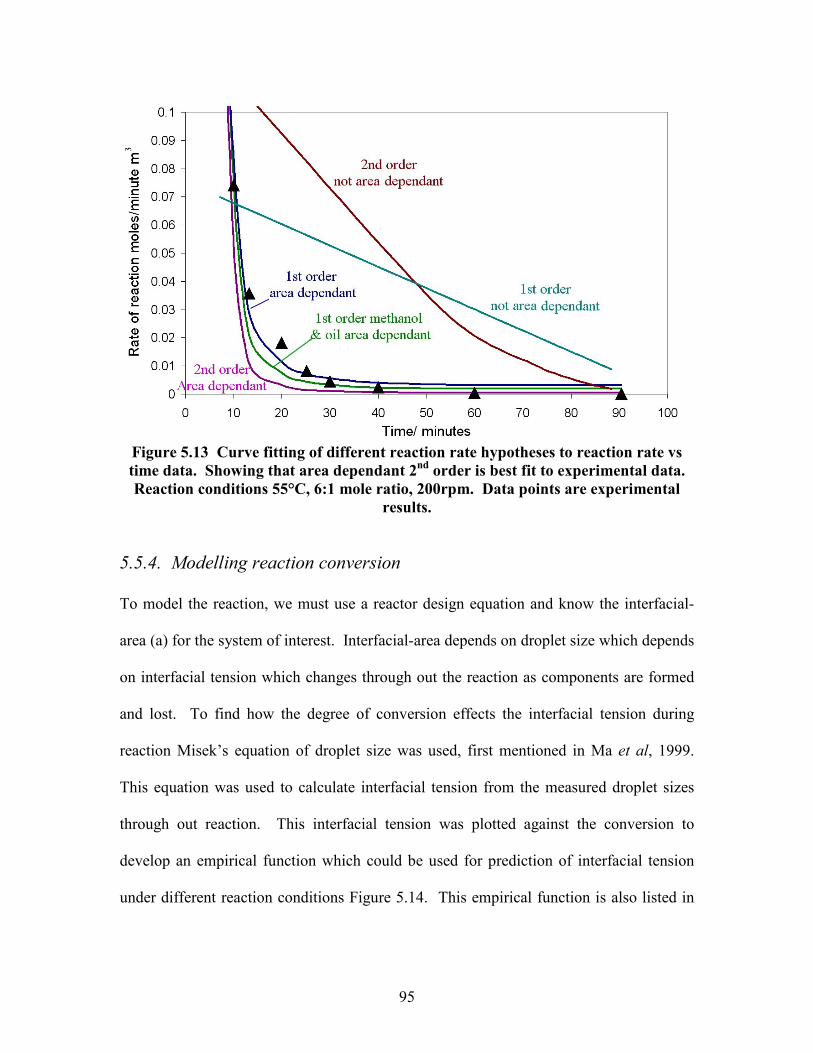
Figure 5.4 Fatty acid saponification to form soap (or soap hydrolysis in reverse). 77 Figure 5.5 A flow diagram of the batch process used at Green Biodiesel. The reaction is a two stage process both stages occur in the same reactor. Washing is a three stage process all of which occur in the same wash tank. There are multiple reactors settle tanks and wash tanks to increase capacity. 77 Figure 5.6 Mass transfer limited model. Reaction only occurs in thin film surrounding the droplet. 80 Figure 5.7 Equipment diagram. 84 Figure 5.8 Typical gas chromatograph used to calculate ester content in EN14214. 86 Figure 5.9 Progression of the biodiesel reaction over time. Shows typical biodiesel reaction stopping short of 96.5% standard. 88 Figure 5.10 Product ratio of reactions involving different ratios of ethanol to methanol reactant. Indicates mass transfer limitation. 89 Figure 5.11 Changes in average droplet size over the course of the biodiesel reaction. Each data point is an average of 300 measurements. 91 Figure 5.12 Images of biodiesel reaction droplet sizes through progression of reaction. 92 Figure 5.13 Curve fitting of different reaction rate hypotheses to reaction rate vs time data. Showing that area dependant 2nd order is best fit to experimental data. Data points are experimental results. 95 Figure 5.14 Interfacial tension vs ester content relationship. Showing how interfacial tension changes during reaction. Data points are experimental results, line is theory for comparison. 96 Figure 5.15 Ester content vs. time graph showing goodness of fit to reaction rate hypotheses. Showing 2nd order changing interfacial tension is the best fit to experimental data. Data points are experimental results from two data sets, lines are theory for comparison. 99 Figure 5.16 Effect of Reynolds number from changing speed on ester content. Data points are experimental results, line is theory for comparison. 102 Figure 5.17 Reaction conversion vs. time curves at different temperatures. Data points are experimental results, lines are theory for comparison. 103
x
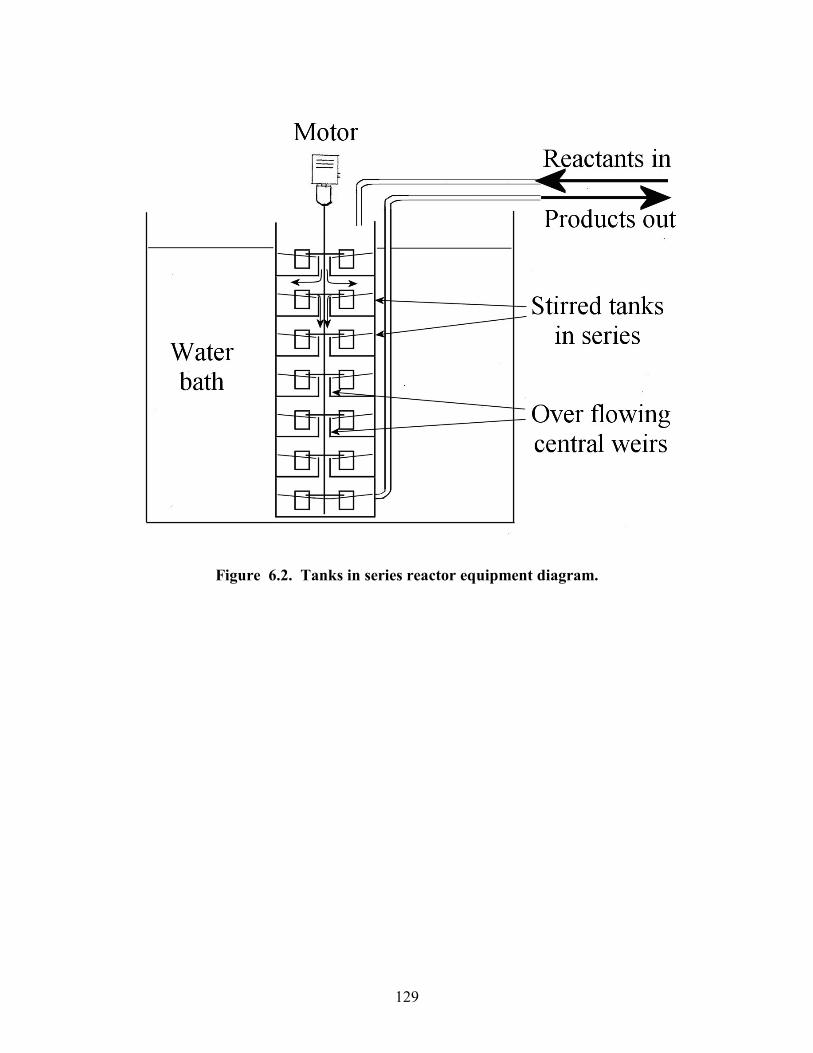
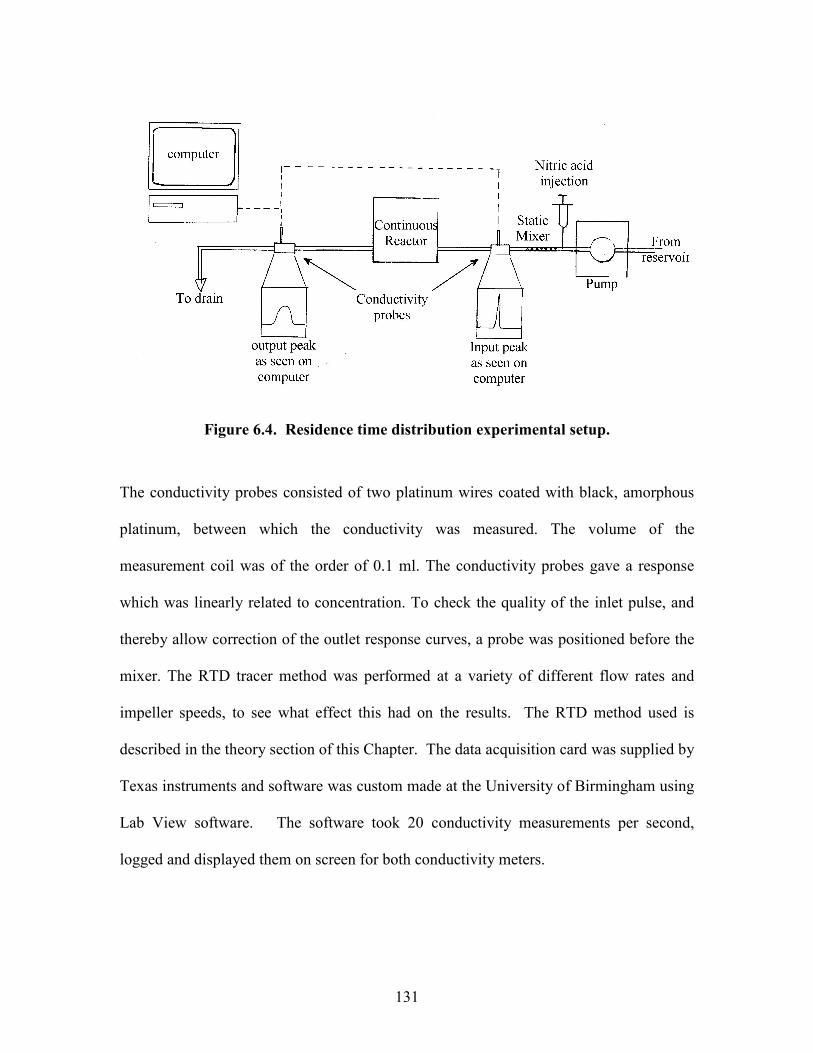
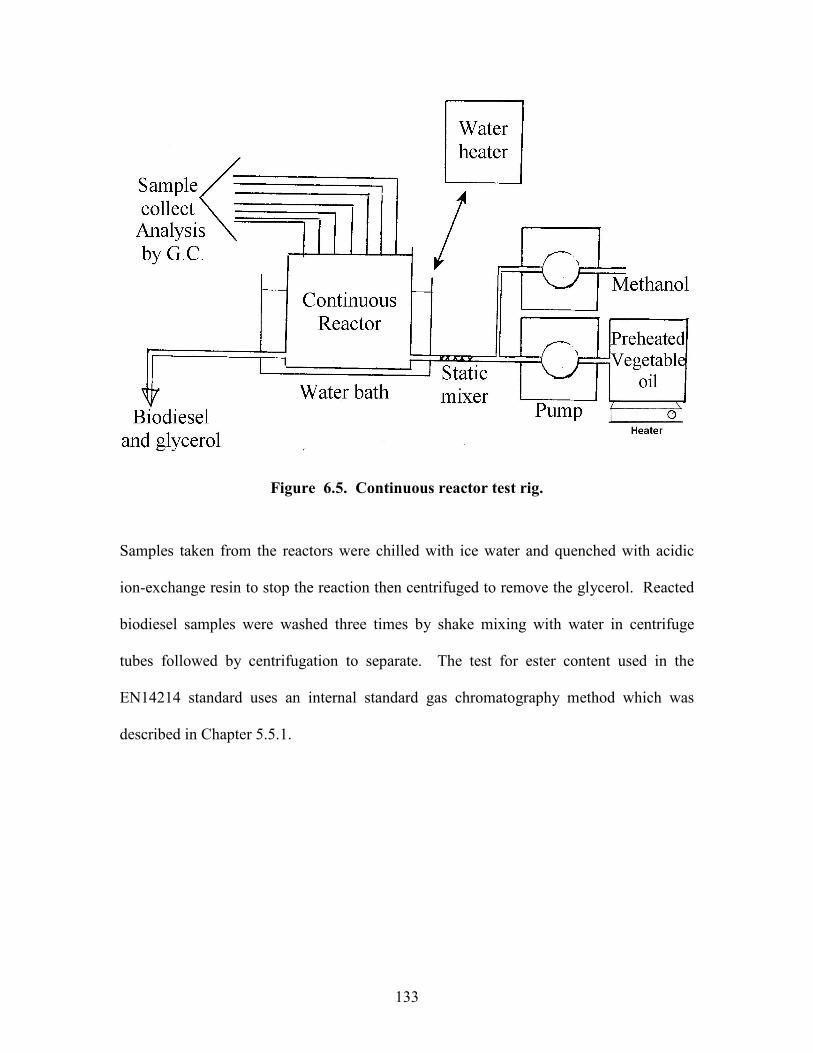
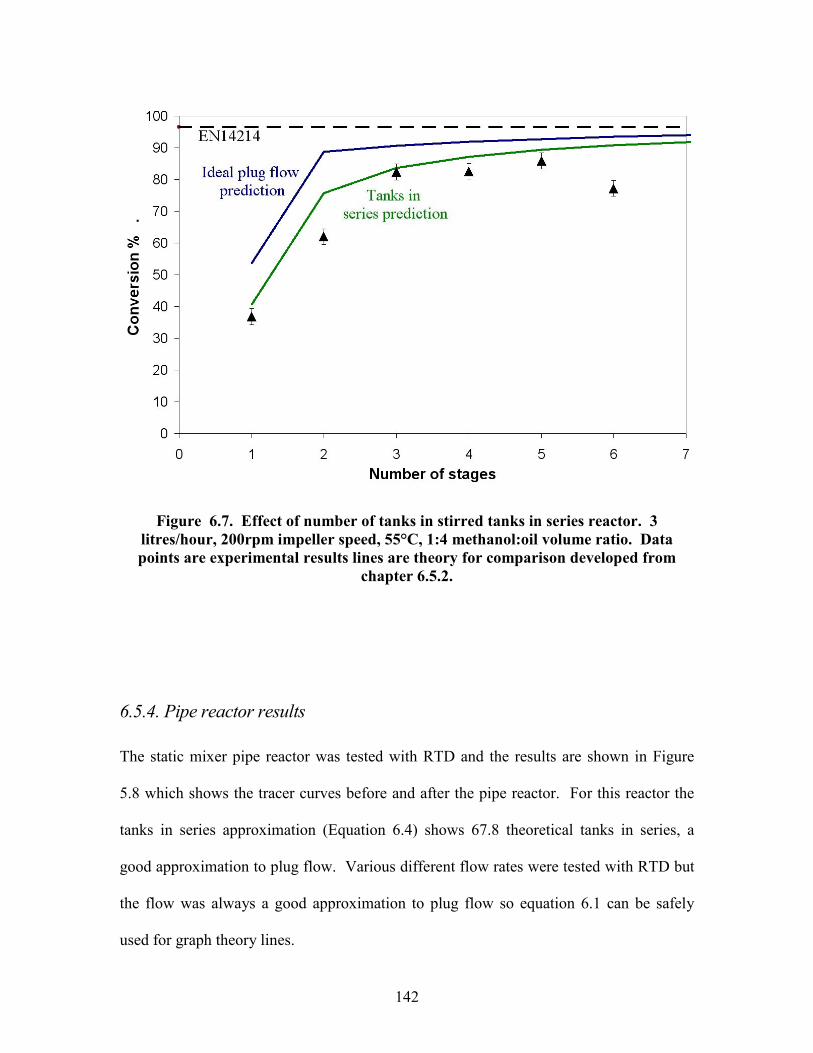
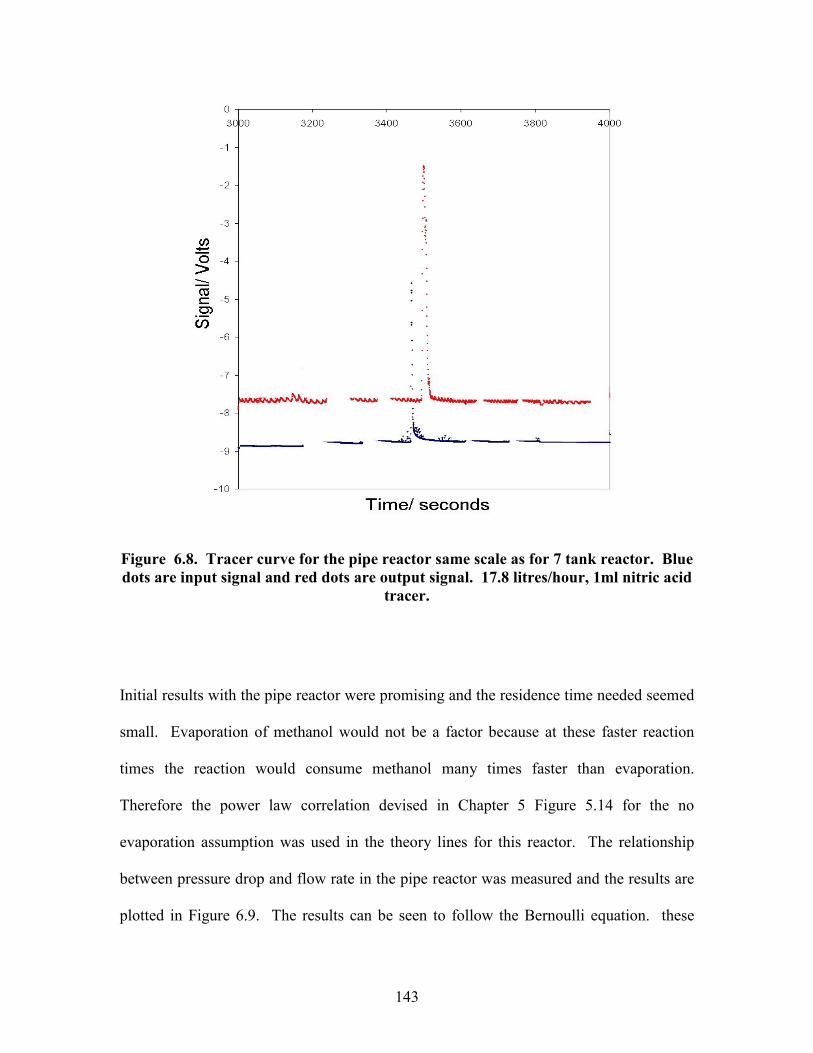
Figure 5.18 Effect of methanol ratio on reaction conversion. Data points are experimental results, line is theory for comparison. 105 Figure 5.19 Effect of NaOH concentration on reaction conversion. Data points are experimental results, line is theory for comparison. 107 Figure 5.20 Mass spec data showing presence of dimers. 110 Figure 6.1. Reynolds number power number relationship for various impellers. 120 Figure 6.2. Tanks in series reactor equipment diagram. 129 Figure 6.3. Pipe reactor equipment diagram. 130 Figure 6.4. Residence time distribution experimental setup. 131 Figure 6.5. Continuous reactor test rig. 133 Figure 6.6. Tracer curves for re-designed 7 tanks in series reactor. Blue dots are input signal and red dots are output signal. 140 Figure 6.7. Effect of number of tanks in stirred tanks in series reactor. Data points are experimental results lines are theory for comparison. 142 Figure 6.8. Tracer curve for the pipe reactor same scale as for 7 tank reactor. Blue dots are input signal and red dots are output signal. 143 Figure 6.9. Pressure drop vs. flow rate correlation for the pipe reactor. 144 Figure 6.10. Effect of flow rate on conversion in pipe reactor. Data points are experimental results, lines are theory for comparison. 146 Figure 6.11. Effect of reactor length on conversion in pipe reactor. Data points are experimental results, lines are theory for comparison. Black triangles are washed samples blue diamonds are same samples before wash. 147 Figure 6.12. Effect of temperature on conversion in pipe reactor. Data points are experimental results, line is theory for comparison. Black triangles are washed samples blue diamonds are same samples before wash. 148 Figure 6.13. Effect of methanol ratio on conversion in pipe reactor. Line is theory prediction of results. 150 Figure 6.14. Effect of catalyst concentration on conversion in pipe reactor. Data points are experimental results line is theory for comparison. Black triangles are washed
xi
samples blue diamonds are same samples before wash. High catalyst concentration causes side reaction in washing stage which was unpredicted by the theory. 151 Figure 6.15. Energy used per litre of Biodiesel produced vs. conversion in each reactor. 153 LIST OF TABLES Table 4.1. Reactions involved in steam reforming glycerol. 40 Table 4.2. Economic calculation for steam reforming. 68 Table 4.3. Efficiency calculation of steam reforming. 69 Table 5.1. Cooking oil impurities. 78 Table 5.2. Fit parameters batch reactor model. 98 Table 5.3. Typical compositional analysis of used cooking oil methylesters. 108 Table 6.1. Constants for Song and Han’s equation of friction factor in Kenics static mixers. 126 Table 6.2 Fit parameters plug flow reactor model. 136 Table 6.3 Fit parameters mixed flow reactor model. 138 LIST OF EQUATIONS Equation 4.1. Effect of temperature on equilibrium constant. 51 Equation 4.2. Calculating equilibrium constant. 51 Equation 5.1. Misek's equation describes droplet diameter in a stirred tank. 80 Equation 5.2. Rate equation of mass transfer limitation. 81 Equation 5.3. Equation used to calculate ester content in EN14214. 86 Equation 5.4. Reaction rate equation for first order. 94 Equation 5.5. Reaction rate equation for second order. 94
xii
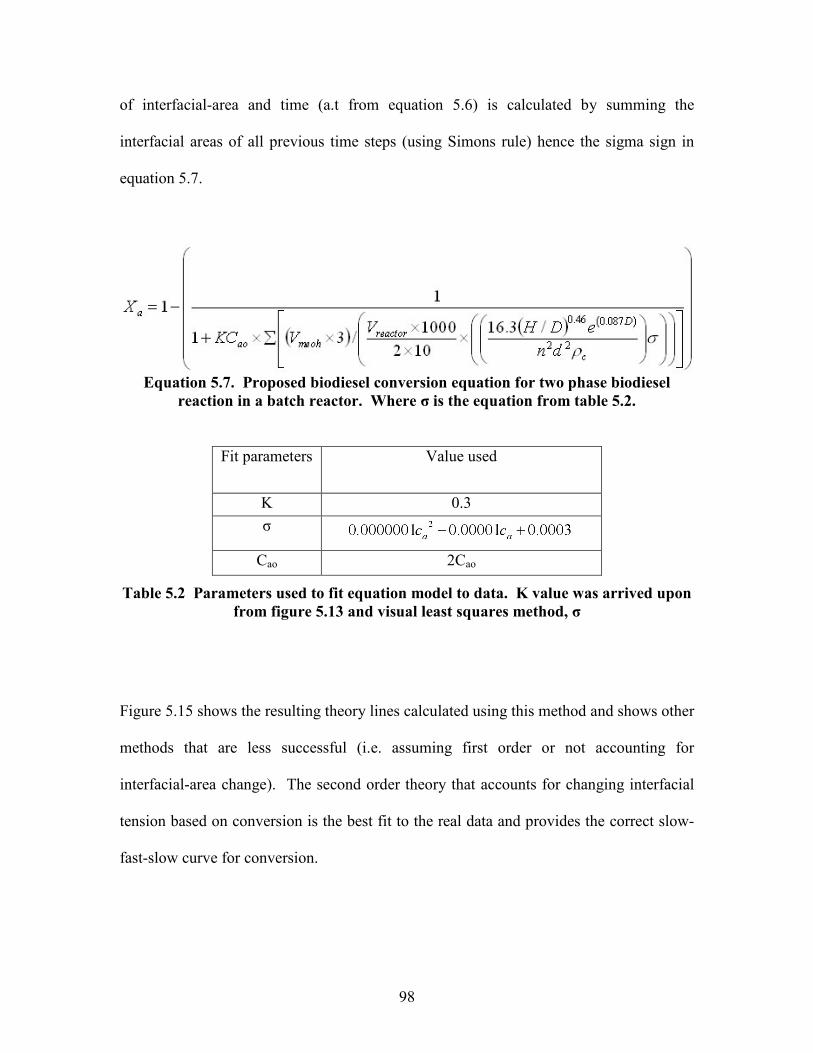
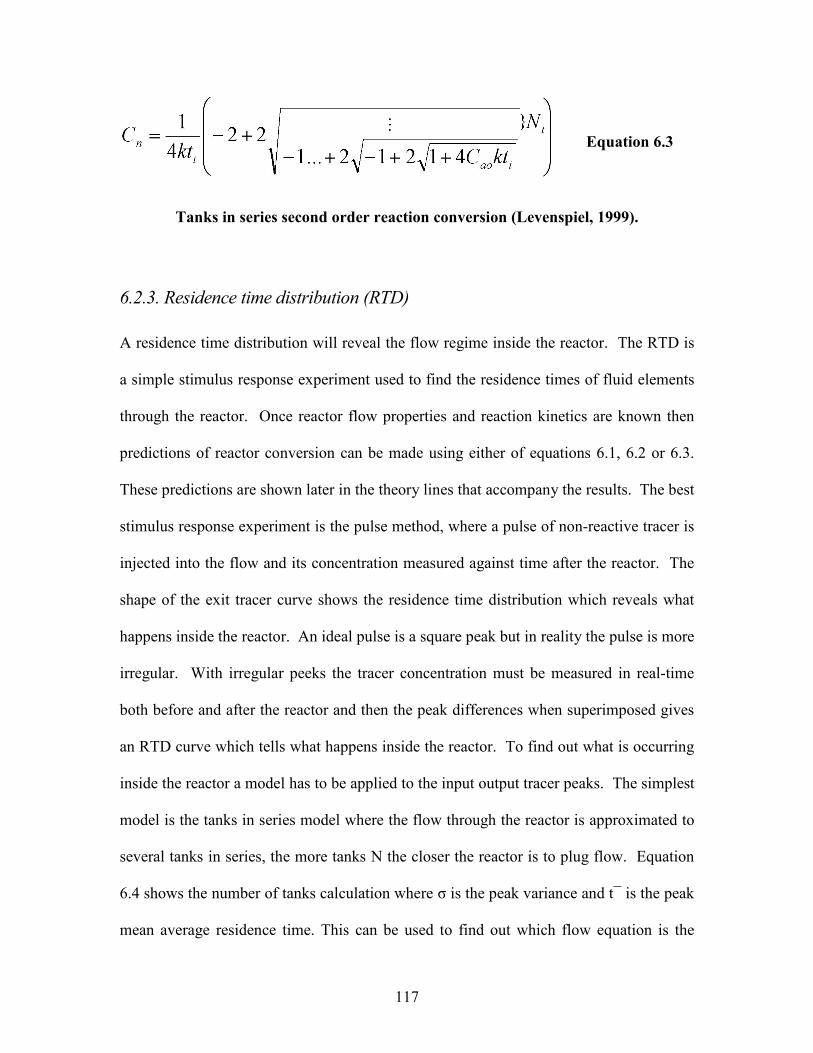
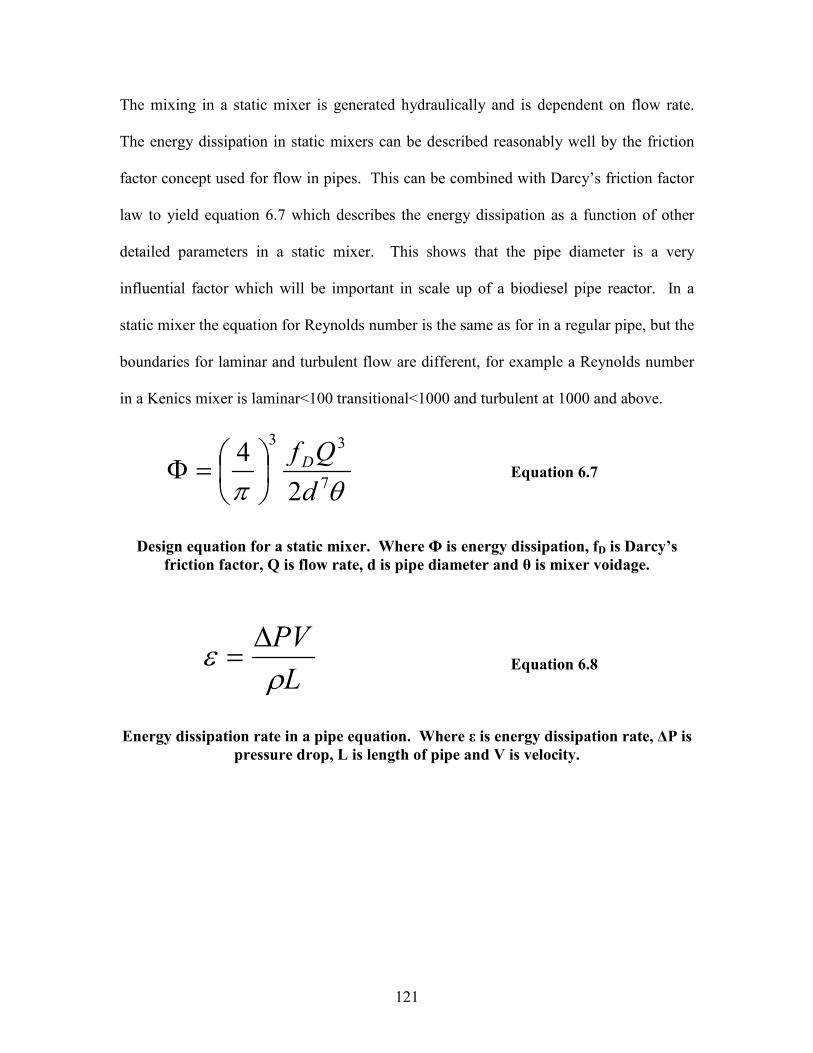
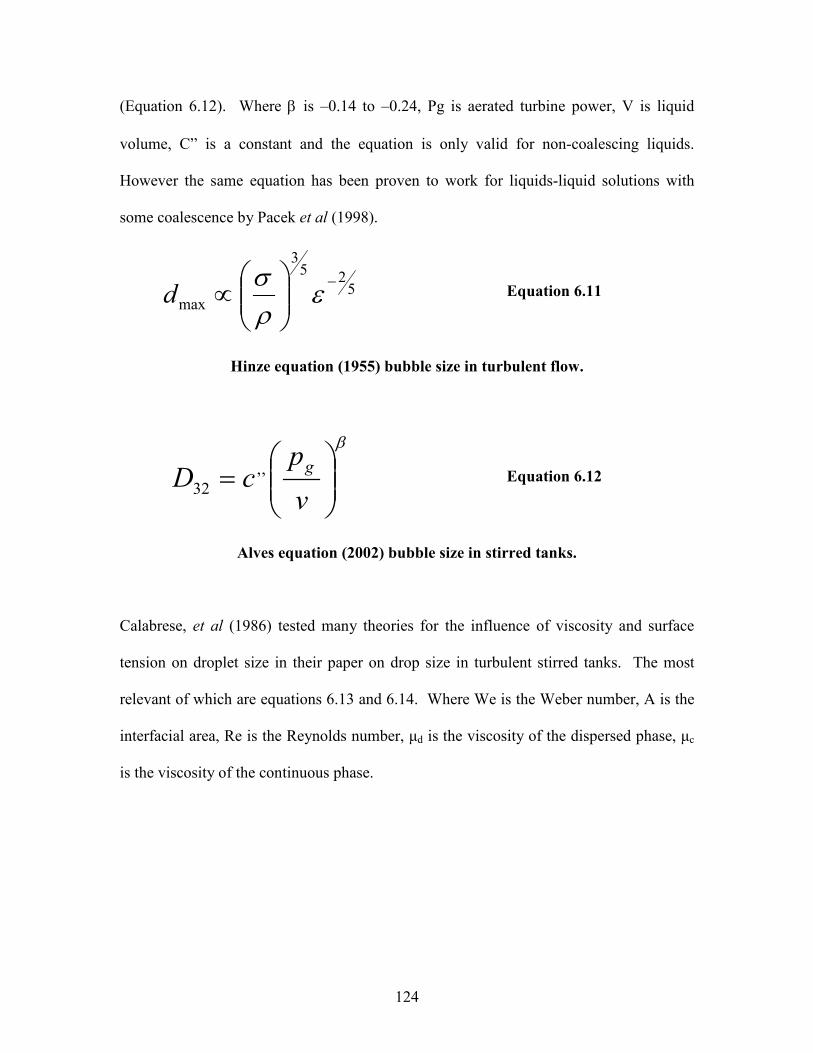
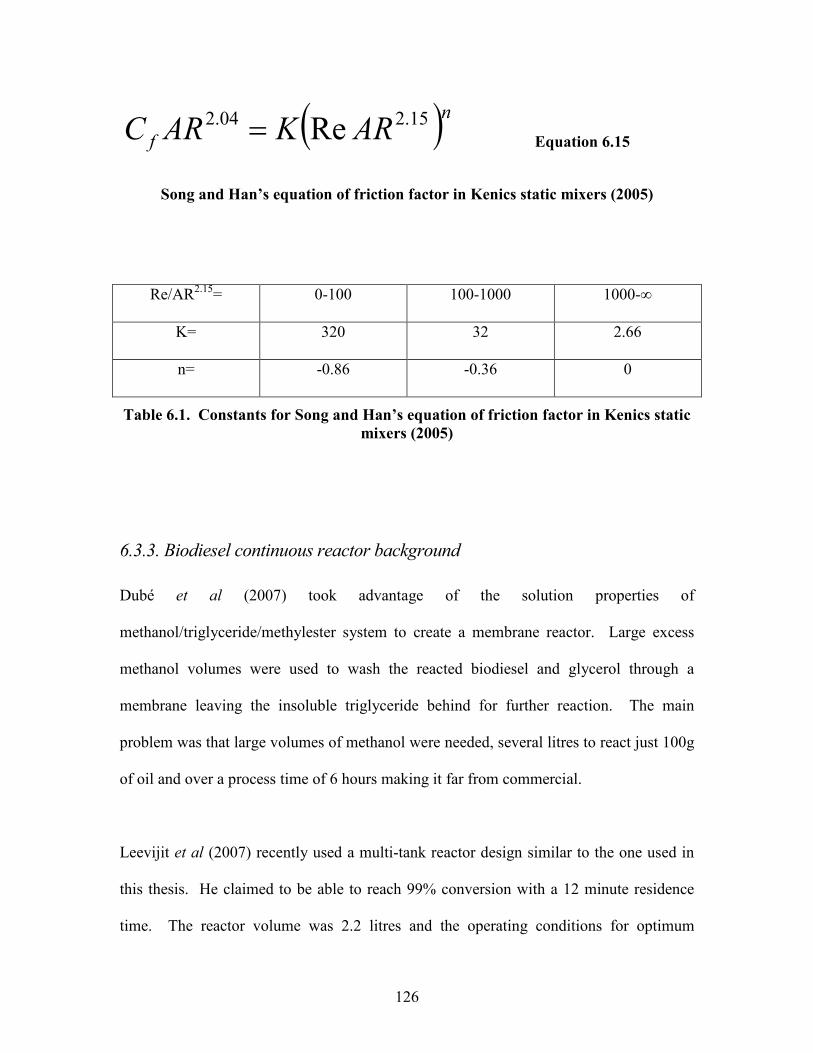
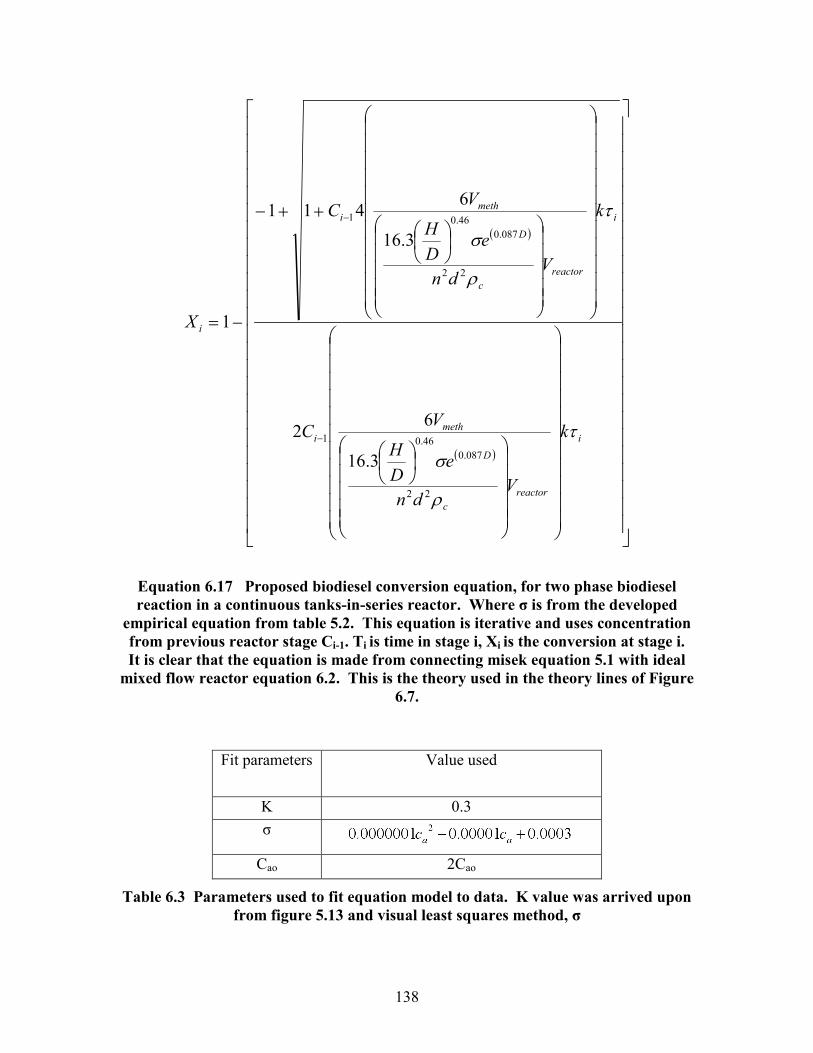
Equation 5.6 Conversion of second order reaction in a batch reactor. 97 Equation 5.7. Proposed biodiesel conversion equation for batch reactor. 98 Equation 6.1. Ideal plug flow second order reaction conversion. 116 Equation 6.2. Ideal mixed flow second order reaction conversion. 116 Equation 6.3. Tanks in series second order reaction conversion (Levenspiel, 1999). 117 Equation 6.4. Number of tanks calculation. 118 Equation 6.5. Definition of power number. 119 Equation 6.6. Power in a static mixer. 120 Equation 6.7. Design equation for a static mixer. 121 Equation 6.8. Energy dissipation rate in a pipe equation. 121 Equation 6.9. Definition of Weber number. 122 Equation 6.10. Kolmogoroff’s length scale. 123 Equation 6.11. Hinze equation (1955) bubble size in stirred tanks. 124 Equation 6.12. Alves equation (2002) bubble size in stirred tanks. 124 Equation 6.13. Influence of viscosity and surface tension on droplet size in turbulent stirred tanks (Calabrese et al, 1986). 125 Equation 6.14. Influence of viscosity and surface tension on droplet size in turbulent stirred tanks (Calabrese et al, 1986). 125 Equation 6.15. Song and Han’s equation of friction factor in Kenics static mixers (2005) 126 Equation 6.16. Proposed biodiesel conversion equation for plug flow reactor. 135 Equation 6.17. Proposed biodiesel conversion equation for mixed flow reactor. 138
xiii
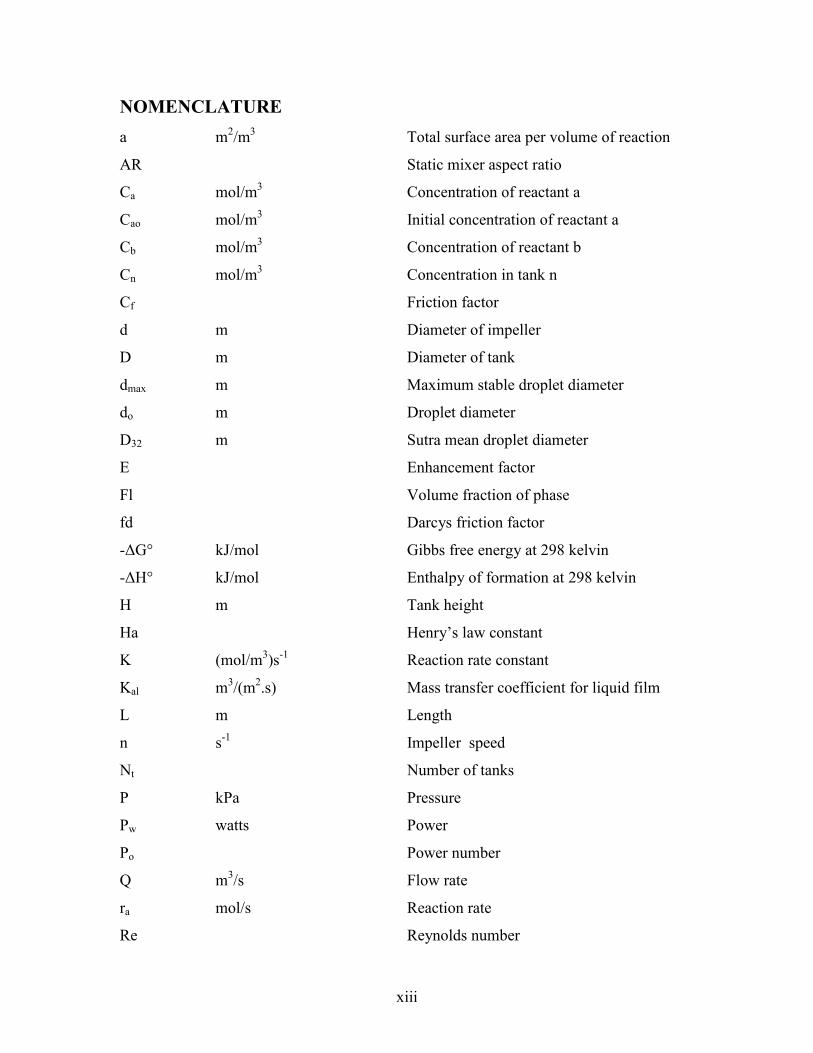
NOMENCLATURE a m2/m3 Total surface area per volume of reaction
AR Static mixer aspect ratio
Ca mol/m3 Concentration of reactant a
Cao mol/m3 Initial concentration of reactant a
Cb mol/m3 Concentration of reactant b
Cn mol/m3 Concentration in tank n
Cf Friction factor
d m Diameter of impeller
D m Diameter of tank
dmax m Maximum stable droplet diameter
do m Droplet diameter
D32 m Sutra mean droplet diameter
E Enhancement factor
Fl Volume fraction of phase
fd Darcys friction factor
-ΔG° kJ/mol Gibbs free energy at 298 kelvin
-ΔH° kJ/mol Enthalpy of formation at 298 kelvin
H m Tank height
Ha Henry’s law constant
K (mol/m3)s-1 Reaction rate constant
Kal m3/(m2.s) Mass transfer coefficient for liquid film
L m Length
n s-1 Impeller speed
Nt Number of tanks
P kPa Pressure
Pw watts Power
Po Power number
Q m3/s Flow rate
ra mol/s Reaction rate
Re Reynolds number
xiv
R Gas constant
t s Residence time
ti s Residence time in tank i
T ºC Temperature
t¯ s Mean residence time
V m3 Volume
Vmeth m3 Volume of methanol in reactor
v m/s Velocity
We Weber number
Xa Conversion
Greek symbols ε watts/kg Energy dissipation rate
Φ J/kg Energy dissipation
ρ kg/m3 Density
ρc kg/m3 Density of continuous phase
μ kg/m.s Viscosity
ν Kinematic viscosity
σ Surface tension
φ2 Varience of tracer distribution
τ Shear stress
θ Static mixer voidage
Acronyms UCOME Used cooking oil methyl ester
UCO Used cooking oil
Veg oil Vegetable oil
GC Gas chromatography
MS Mass spectroscopy
WID Waste incineration directive
xv
HPLC High performance liquid chromatography
SOFC Solid oxide fuel cell
ROC Renewable energy obligation certificate
LSM Lanthanum strontium manganite
TPO Temperature programmed oxidation
S/C ratio steam/carbon ratio
O/C ratio Oxygen/carbon ratio
RTFO Renewable transport fuels obligation
CNG Compressed natural gas
LPG Liquid petroleum gas
PHEV Plug in hybrid electric vehicle
FID Flame ionization detector
RTD Residence time distribution
Re Reynolds number
1
CHAPTER 1
INTRODUCTION
1.1. Background
Biodiesel is a renewable diesel fuel made from organic oils called tri-glycerides. It is
produced by reacting vegetable oil with an alcohol and a catalyst followed by separation
from its glycerol by-product. Biodiesel molecules contain 11% oxygen which causes
leaner fuel/air mixtures and a cleaner burn than regular diesel, giving environmental
benefit (SAE, 1990).
Another significant benefit is that vegetable oils can be grown all over the world so could
reduce western dependence on Middle Eastern oil, besides giving a massive boost to
agriculture either locally or in developing nations where labour is cheap. But by far the
single most important benefit of biodiesel is the fact that it is made from plant materials
which absorb carbon dioxide from the atmosphere off-seting that produced when the fuel
is combusted. Studies have shown that biodiesel is on average 66% carbon neutral
depending upon where the raw material is from, 95% with used oils (ADEME 2002,
Elsayed 2003, ENVOC 2005, IEA 1999, JRC 2003, Levington 2000). This could
potentially allow all diesel vehicles to become low carbon vehicles and reduce their
contribution to the greenhouse effect. Because of these benefits the UK government has
given biodiesel a 20p/litre tax incentive to encourage its use.
2
Biodiesel can be made from many different sources of tri-glycerides, including but not
limited to, rapeseed oil, soya oil, palm oil, jatropha oil, and tallow. Biodiesel made from
different feed-stocks, different production processes or different land use situations will
have different carbon emission reductions (Royal society, 2008), as discussed later in
chapter 2. It is possible to run a diesel engine on unmodified cooking oil, however this is
not recommended because the fuel is too viscous and studies have shown it can lead to
degradation of the engine such as gumming of pistons and injectors (Ramadhas et al
2004, Pryde 1983 and Ryan et al 1983)
1.2. Biodiesel Problems
My work at the companies Green Biodiesel Ltd and BHR Biofuels Ltd uncovered a range
of interesting process problems which are discussed below, including by-product
conversion and improved product yield. Some of these problems have been solved in the
later chapters of this thesis.
The water and glycerol waste of biodiesel production are costly to dispose of and should
be fully utilized in order to maximize the carbon reductions biodiesel can offer. Glycerol
and waste water both need to be either utilized or avoided with a more advanced
production process. Historically waste glycerol was mixed with other waste oil and
burnt, but this practice was stopped in 2005 when the WID (Waste Incineration
Directive) effectively banned burning of waste (European parliament and council of the
European communities, 2000). Currently waste glycerol and water are likely to be
treated by digestion at a water treatment plant where fuel gas yield is low and process
3
time high. These wastes would be best converted to biofuels either through a fast
chemical conversion processes or in a WID compliant co-fired power generation.
The reaction needs to be improved so that fuel quality standards such as EN14214 can be
met to guarantee the quality of biodiesel and increase its selling price. Currently (2003-
2008) sub-standard fuel is allowed to qualify for the biodiesel tax break, as long as it is
from a transesterification process. However the law states that only 96.5% biodiesel
should qualify for the tax break so this is a difficult situation for biodiesel producers
because the enforcement of this tax rule could change at any time. The current reaction
scheme is also slow, taking hours to even approach completion.
The separation and purification stages need to be improved. This is often the bottle-neck
of the whole process. Currently there are many methods of “polishing” the biodiesel but
many of these treatments contaminate the biodiesel in other ways. For instance washing
the biodiesel to reduce methanol, glycerol and soaps leaves the biodiesel contaminated
with water and can cause a slight reverse reaction. Heating the biodiesel to evaporate
water can lead to reduced oxidative stability and increased acid value. Heating the
biodiesel to recover methanol before washing can lead to viscosity increase and soap
formation. Using ion exchange resin to remove soap impurities can lead to increased
acid value. The purification of biodiesel to meet the standard seems to be a very difficult
balancing act and in many cases it is impossible to reach the standard if the original oil or
biodiesel is of poor quality.
4
The use of sodium hydroxide catalyst is thought to be a crude method because it leads to
emulsification of product and waste. This reduces yield and necessitates expensive down
stream purification. It would be a major breakthrough to find a non-soluble
heterogeneous catalyst which would not leave the same problems. However, no
heterogeneous catalyst has yet been developed that gives sufficient yield under normal
reaction conditions. Supercritical and sub critical processes have been developed both
with and without heterogeneous catalysts to give the required yield, but these seem to be
very expensive and have not been widely adopted.
1.3. Objectives
The objectives set out in the beginning of the EngD were very broad. This was because
the original sponsor (UK Biofuels) was a fresh start up company still learning their
chemistry and they did not want to restrict research to a specific area. The initial EngD
objectives were as follows.
• Testing standards and specifications and forming a quality control lab.
• Improve yield
• Improve purity
• Water saving
• Glycerol saving
• Any process gains
• Speed up process time
5
With experience the work soon became focused on areas where there were obvious
process problems that could be improved through proper application of chemical
engineering.
Utilization of waste water and waste glycerol was always a key objective and work soon
focused on steam reforming of waste because this showed the most potential and had not
been previously researched. Therefore, a major part of this thesis describes an
investigation of glycerol reforming.
Purification of product to meet the EN standard was the second major issue which
became increasingly important as product samples failed to meet the purity level
expected in the market. Independent testing revealed that the reaction was not reaching
completion, which was affecting product quality. Very little was known about the
reaction and the mechanism was unclear so finding out why the samples were failing and
coming up with a solution was paramount. This led the work to focus on real-time
optical microscopy and gas chromatography ester determination to show that mass
transfer was the main obstacle.
Once the by-products were dealt with and the purity was established, the objective was to
demonstrate an improved design of plant which would operate more effectively. This
was the final part of the study.
6
1.4. Layout of this thesis
This thesis consists of 7 chapters. Chapter 1 is the introduction. Chapter 2 gives an
insight into the politics and driving forces of the biodiesel industry and also describes the
benefits stemming from this research. Chapter 3, the literature survey, is an overview of
all the work done in the field of biodiesel. Detailed literature specific to the work in this
thesis is included later in the results chapters specific to that literature. Results chapters
4,5 & 6 are written in the style of research papers and can be understood separately.
Each of these chapters describes a separate industry problem, but taken together, the three
improvements show that significant advances can be made in the biodiesel process.
Chapter 7 lists the conclusions of the thesis and objectives for future work. This is
followed by a list of references.
7
CHAPTER 2
THE INDUSTRIAL VIEW
2.1. Tax and incentives
The selling price for biodiesel is usually the same as, or less than, the price of petro-
diesel. Without tax concessions, biodiesel is not economically viable with the current oil
price and therefore the success of biodiesel is dependent on government backing. The
UK government currently gives biodiesel a 20p/litre tax incentive over petro-diesel.
Governments give incentives for bio-fuels for many reasons but the main one is because
they are seen as environmentally friendly fuels. Therefore the success of biodiesel
depends on its green image.
When the petro-diesel price is high and the vegetable oil price is low then biodiesel
producers make profit. The profit margin for making biodiesel in the UK has been very
tight in the last few years (2003-2007) usually under 10 pence per litre and a large capital
investment is required for big plants. Unfortunately many of the biodiesel producing
companies in the UK are having difficulty. The original sponsor of this work (UK
Biofuels and then in 2004 Green Biodiesel) has gone bankrupt and been bought out 3
times in 4 years. So far, lots of people have lost money on biodiesel and there have been
few real winners, but there is no shortage of investors ready to pump in money.
8
In 2007 the government removed the tax on biodiesel producers making under 2500
litres/year. This made biodiesel production for personal consumption very attractive but
caused a rise in the vegetable oil price which has put some of the small and medium
producers out of business. This was done because it was impossible to catch individuals
using and making their own fuel and it took too many resources from UK Customs and
Excise. The pre-established big oil collectors, who control the raw material, are making
all the money in this new industry . However the UK government declared in November
2005 that it would take part in the RTFO (road transport fuel obligation) which will come
into effect in April 2008. The RTFO will make it mandatory for fuel retailers to include a
percentage of biofuels in their fuel or face harsh financial penalties. The mandated blend
will start at 2 % in April 2008 and go to 5 % in 2010 (Knott, 2007). This will have the
effect of artificially increasing the demand for biodiesel which will increase its price
beyond that of petro-diesel. With the RTFO biodiesel producers and farmers will make
more money. Requirements on carbon savings and sustainability will eventually be
introduced into the RTFO (Cave, 2007) which should at last guarantee the environmental
credentials of biodiesel.
2.2. The price of oil
The price of fossil oil determines the selling price of biodiesel or any road transport fuel.
The price of fossil oil is steadily increasing as demand increases and world oil production
peaks (McKillop 2005, Alhajji 2002 and Bentley 2002). When the peak occurs there will
be oil shortages and the oil price will rise, maybe dramatically. As the oil price increases,
biodiesel becomes more attractive. There have been short periods of time where
9
biodiesel did not require subsidies to be profitable because the price of oil was so high.
There is still some disagreement over when peak oil production will occur, with some
researchers saying that the peak has already occurred in 2003 and some say that it will
occur in 2018 (Goose., 2007.) The mean of all peak oil predicted dates of is currently
2010 (McKillop 2005, Goose 2007 and Bentley 2002). The worlds remaining oil
reserves are increasingly held in unfriendly countries (Bentley, 2002). Governments seek
energy security by reducing their oil demand for foreign oil. Biodiesel could replace
some of the demand for oil and extend the remaining world fossil oil reserves. Each unit
of biodiesel replaces 2/3 of a unit of diesel (Frondel and Peters, 2007.) Investment in
biodiesel creates jobs in the countries agricultural and industrial sectors.
2.3. The desire to be environmentally friendly
While some consumers do chose their fuel based on its effect on the planet, this market
segment is not thought to be significant and so the selling price for biodiesel is usually
the same as or less than the price of petro-diesel. However, the tax incentives that make
biodiesel viable are because of its green image, so this is very important. At the
beginning of this course of study in late 2003 very few people knew about biodiesel in
the UK, and those who did saw it in a very positive way. Now in 2008 the biodiesel
industry seems to be approaching a critical stage with the coming of the RTFO (road
transport fuels obligation) and much more is known about it. With this knowledge has
come a growing anti-biofuels movement worried about the competition between food and
fuel and destruction of carbon sinks for biofuel plantations. Groups such as Biofuelwatch
10
have demonstrated against biofuels at industry trade shows in 2007. Some of these
concerns are warranted, like the destruction of rain forest (carbon sinks) to make way for
biofuel plantations. In 2007 the Biofuelwatch website referenced several non peer-
reviewed reports to support its claims of biofuels causing accelerated climate change
(Boswell et al, 2007). Now there seems to be a growing realisation that biofuels are not
as simple a solution as that they were once thought to be and recent papers are finding
problems with biofuel sustainability and life cycle analysis (Royal society, 2008). Not all
biofuels are the same, corn ethanol from maize for example is a very poor biofuel from a
CO2 saving point of view and uses only slightly less carbon than fossil fuel. However,
from the point of view of creating US jobs and increasing security of US energy supply
there is a more positive benefit. There are also substantial differences in emissions
between different biofuel feed stocks and farming processes. Even within the same
biofuel process there can be wide variations in green house gas emissions depending
upon land use changes, the use of co-products and the impact of fertilisers. This means
that biofuel supply chains have to be evaluated on a location specific basis. For example
ethanol from sugar beet was shown in Royal society (2008) to vary between 30 - 90 kg
CO2 equivalent per GJ of fuel, a massive variation depending on many factors. Petrol and
diesel were for comparison around 100 kg CO2 equivalent per GJ. Ethanol was reported
to have, at worst case, 40 kg CO2 equivalent per GJ of fuel if it was produced from wood,
but if it was produced from beets, straw or cereal the figures were 90, 70 or 80
respectively. The issue of by-products, such as cake or glycerol, is another problem.
Because the total green house gas needs to be allocated between products, there are a
number of different ways of accounting for this which leads to arbitrary or subjective
11
decisions (Royal society, 2008). Another problem is that land use changes to make
biofuels from traditional carbon sinks such as peat land or tropical forests can mean a net
release of carbon. Use of fertilizers can release substantial amounts of N2O, a potent
green house gas, and these need to be carefully controlled to maximise green house gas
savings (Royal society, 2008). So it is by no means a simple story that biofuels reduce
carbon emissions. All the different types of biofuels affect carbon emissions differently
and some may even increase carbon emissions. Therefore each biofuel application needs
to be examined by its own merit before it is supported.
Government subsidies and the RTFO may exacerbate this problem because they are
based on the volume of fuel and not the carbon savings given, therefore making
profitable the use of unsustainable feedstock’s such as palm oil. The problem is that
important green house gas savings could be missed with existing policy frameworks and
targets. Unless biofuels development is supported by appropriate policies and economic
instruments then there is a risk that we may become locked into inefficient biofuel supply
chains that could create more harm that good (Royal society, 2008). Another problem
with biofuels is that it promotes the “business as usual” idea, leading some people to
believe they can use large polluting vehicles and biodiesel will make this environmentally
acceptable. Since biofuels are not 100% carbon neutral and in limited supply this
approach is unsustainable.
Most current research shows the life cycle analysis of biodiesel is very positive, and
future advances should further improve this situation. Recent studies (ADEME 2002,
12
Elsayed 2003, ENVOC 2005, IEA 1999, JRC 2003, Levington 2000) have shown that
biodiesel from virgin oil is, at present, 2/3 carbon neutral. This is a big CO2 reduction,
which will secure the future of biodiesel to combat climate change. Work by North
Eastern Biofuels Ltd (2007) has shown that 97% energy savings and 94% green house
gas savings can be achieved when farming practices are optimised for the purpose of
biofuels manufacture instead of food production. Several recent studies have attempted
to quantify the externalities i.e. environmental benefits, of biodiesel in monetary terms, to
examine whether government incentives are value for money. The studies (Wassell et al
2006, Demirbas 2007 and Frondel and Peters 2007) all conclude that biodiesel is worth
the monetary incentives given to it. However there is still disagreement over whether
biodiesel is the best green house gas abatement strategy, (Frondel and Peters, 2007). This
may be true but the nature of the road transport application i.e. non-centralized, limited
by space and weight and the fact that it accounts for over 23% of green house gases
(Kyoto GHG Data, 2006) means that biodiesel will be a very important part of the
solution. In conclusion, the current view is that biodiesel can be a very good way to
mitigate climate change (Kirschbaum, 2003). However, there is some disagreement and
much more research needs to be done (Pearce and Aldhous, 2007). A complete and
accurate life cycle analysis of biofuels is a very difficult task to undertake and one that is
only recently being properly undertaken.
2.4. Future challenges to biodiesel and other alternative fuels
Other low carbon transport fuels need not threaten the growth of biodiesel because land
use will limit biodiesel to about 13% of the current road fuel market (Wassell et al,
13
2006). Therefore there is still plenty of room for other alternative fuels. Since no single
current alternative fuel can replace 100% of demand for oil, it would be best that all
alternative fuel technologies should be developed with the aim to stop climate change.
Only by developing all the alternatives can we find the best solution to sustainable
transport, which will probably be a combination of approaches.
There is still disagreement over which fuels will be best because the knowledge and
technology is evolving all the time. Following the RTFO, biofuels are certain to be a big
part of reducing emissions from road transport. The most popular alternative fuel is
biodiesel because of the aforementioned advantages, economics and ease of use. Other
popular alternative fuels are Bio-ethanol, Bio-methane, CNG (compressed natural gas),
(e.g. biomass-to-liquid, using Fischer Tropsch) and gas-to-liquid. Ethanol was popular
but recent studies have shown that some ethanol processes are only 13% carbon neutral
(Frondel and Peters, 2007.) Bio-methane is potentially very good because it can be
produced from waste and almost any biomass feedstock can be used. Therefore it offers
good carbon reductions. However the fermentation process is slow and is currently not
as profitable as biodiesel. Bio-methane can be blended with CNG or LPG and this will
become more commonplace as natural gas is used for cars. However significant vehicle
modifications are needed to run on gas, but the infrastructure for natural gas already
exists. CNG and LPG are said to be much lower carbon than gas-to-liquid because the
chemical conversion for gas-to-liquid is very energy intensive (Baldwin, 2007.) BP and
Dupont have invested in Bio-butanol because of its easier blending with petrol (Harman,
14
2007.) There is a lot of hype about so called second generation biofuels from
lignocellulose, however these are still far from being commercial. By the time these fuels
become available the world may already be committed to a level of catastrophic climate
change. Another possibility is battery and fuel cell electric vehicles. We are starting to
see more electric vehicles on UK roads from the smart electric, g-wiz and NICE mega
down to the humble electric bicycle. Running battery electric from solar power is
obviously carbon neutral and sidesteps the monitoring uncertainty issue with sustainable
biofuels. The limited range of the battery could easily be overcome with a series hybrid
to charge the batteries the odd time when a long journey is needed. A plug in hybrid
electric vehicle (PHEV) would reduce the cost of the batteries needed because the range
could be shortened to just the average daily city drive and would not need to hold
capacity for rare long range journeys. An electric drive train is twice the efficiency of
conventional cars (Ahman, 2001) and the engine-generator could be set to run at its speed
of optimum efficiency. Biodiesel could be used to part fuel these plug in hybrid vehicles.
Fuel cells could also replace the engine in a PHEV offering a further weight advantage
and quiet operation. PHEV’s would offer the most CO2 reduction especially if the
electricity or fuel could be generated from renewables (e.g. wind power or biofuels.)
Currently only hybrids and small low power electric vehicles are sold but this does not
have to be the case and performance electric sports cars are planned such as the Chevrolet
Volt and Tesla Roadster. This author believes that PHEV’s are the best low carbon
option and will have a bigger role to play in future road transport.
15
2.5. Industry benefits of this EngD
The biodiesel company sponsor has received the following benefits from this EngD:
• Installation of a Biodiesel quality control laboratory.
• 2 years worth of quality control work, checking their raw materials and product.
• 2 years worth of research and development by a graduate chemical engineer.
• Possible savings of 4p/litre benefit from dealing with waste streams onsite using
steam reforming other than paying for contractors to come and collect.
• Possible extra profit of 2p/litre because increased purity of biodiesel will generate
a better selling price.
• Possible savings of 1p/litre on energy bill because continuous process makes heat
exchange possible. This makes the fuel greener which could in future be taken
into account with RTFO subsidies or carbon credits.
• Safe guarding the essential tax break by ensuring quality standards are meet. The
tax break is only given to biodiesel, which is defined by law as fuel which meets
the EN14214 standard.
• Removing liability and risk from potential law suits arising from poor quality fuel
harming vehicles.
16
CHAPTER 3
LITERATURE SURVEY
3.1. Background
The purpose of this literature survey is to give an overview of biodiesel properties and
processes. More detailed literature is found later in the relevant results chapters. At the
beginning of this study in 2004 there were 134 biodiesel papers and by the end of the
course in 2008 there were 670 biodiesel research papers. The number of papers
published each year is exponentially increasing (see Figure 3.1.) which indicates the
growing interest in this field. However the total amount of research is still much less
than other energy related fields, such as fuel cells with 12,229 papers in 2008. This may
be because biodiesel seemed to be more commercial than fuel cells which will require
more research breakthroughs in order to make them commercial. However there is still
much to learn about biodiesel and many things that need to be re-examined. It seems
strange that comparatively so little biodiesel research has been done yet biodiesel is about
to become standard across Europe with the onset of the RTFO.
17
Figure 3.1. The number of biodiesel papers published year on year is exponentially increasing. In the first two months of 2008 there have already been over 100
biodiesel papers published.
3.1.2. Introduction to biodiesel
Biodiesel can be used alone or mixed in any amount with regular diesel (Tickell, 1999).
Because of this biodiesel can be used in any diesel engine or infrastructure without the
need for modification. Engines run normally on biodiesel because the fuel has similar
properties to regular diesel. Biodiesel has a high cetane rating which improves engine
performance. Biodiesel is more lubricating than regular diesel fuel and it can be used to
replace sulphur compound lubricating agents which when burned produce sulfur dioxide
which is the main cause of acid rain, whereas biodiesel contains no sulphur (Tickell,
1999) Much research has been done on how biodiesel effects engine performance and
18
emissions and there are several good reviews of this work (Graboski and McCormick
Figure 4.4: Activities of the different catalysts for reforming reactions. The catalyst active metal concentrations on x-axis are shown in weight %. The graph y-axis
shows % of theoretical maximum yield and selectivity. Data is from experiment.
Figure 4.4 shows that platinum was by far the best catalyst for the water-gas-shift activity
and so this catalyst was selected for use in the research. Other catalysts did show activity
56
for methane production which can also be used in generators and fuel cells. Good gas
yield was displayed by all the catalysts and this is the most important characteristic as its
important not to clog the reactor with liquid products and char.
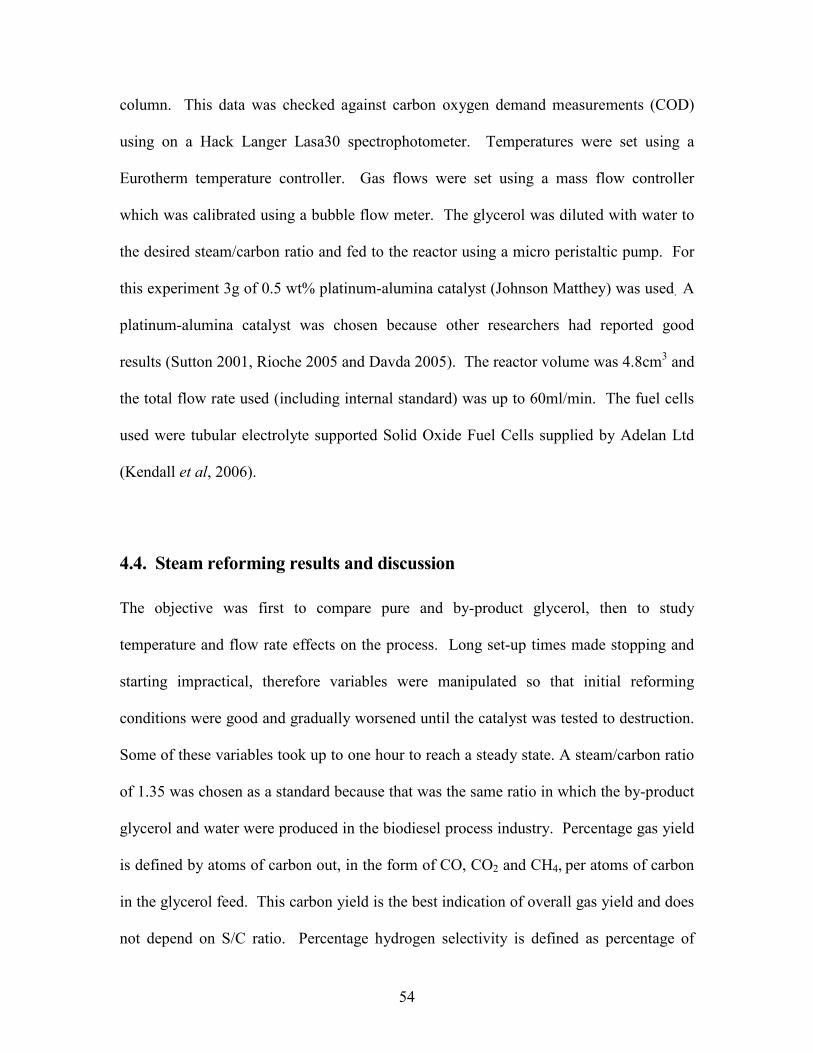
4.4.3. Performance of pure and by-product glycerol
The yield of by-product glycerol was on average only 70% of the yield of pure glycerol
(selectivity was the same). This is probably because the long chain (C18) fatty acid
impurities (40 %) are harder to reform, and are likely to form more carbon deposition on
the catalyst than pure glycerol (C3). This experiment was supported by long run
experiments where reformer lifetime and carbon deposition was accurately measured.
With pure glycerol the longest run reached 30 hours (Figure 4.5), after which the
reformer and fuel cell were still functional. This was achieved at S/C = 1.35, 800 ºC and
a flow rate of 0.013 ml/min(glycerol). During this time 30 g of glycerol was reformed,
0.12 g of carbon deposition was observed inside the reformer (0.4% of feed stock) and
the water trap contained only trace amounts of pyrolysis products 0.034 g (0.1 % of feed
stock). With by-product glycerol, the longest run under constant operating conditions
reached 10 hours of operation, after which the fuel cell was fully degraded by carbon
deposition. This flow rate was higher than the pure glycerol result. In this time 20 g of
by-product passed through the reformer and 0.4 g of carbon was deposited on the catalyst
(2 %). To cope with these impurities harsher reaction conditions will be needed, for
example, longer residence time, higher temperatures and a higher steam/carbon ratio.
57
Figure 4.5: Electrical performance of long run experiments for pure and by-product glycerol.
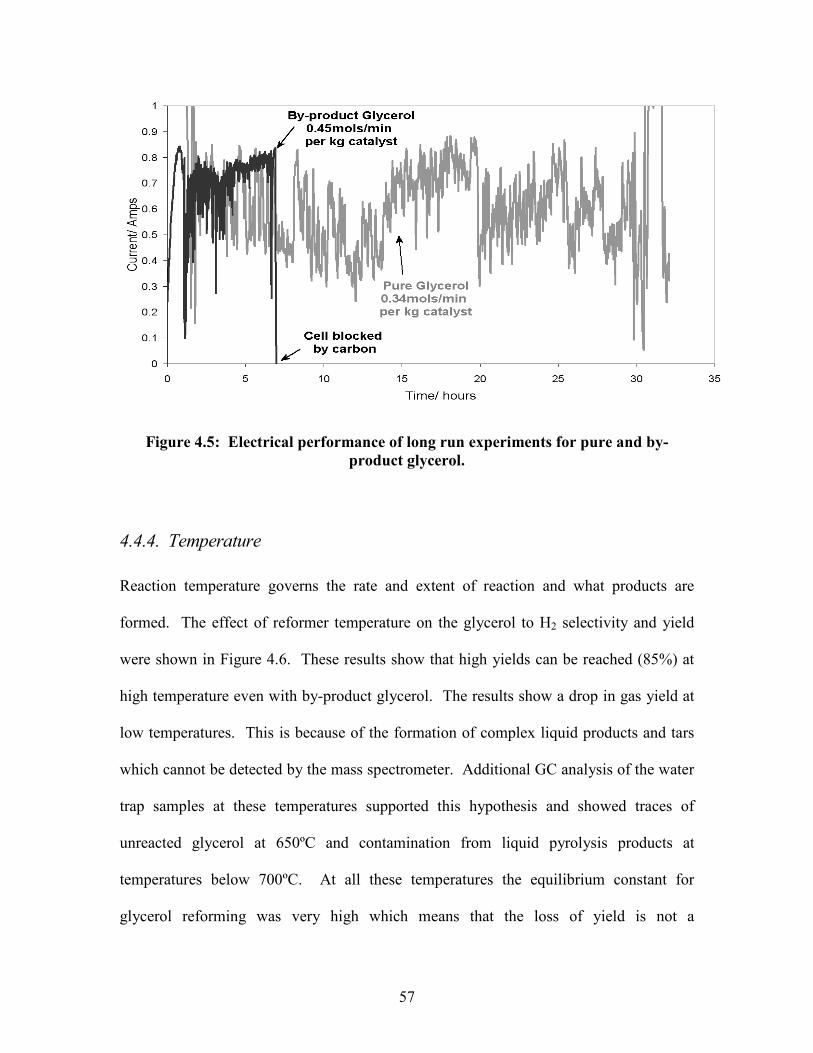
4.4.4. Temperature
Reaction temperature governs the rate and extent of reaction and what products are
formed. The effect of reformer temperature on the glycerol to H2 selectivity and yield
were shown in Figure 4.6. These results show that high yields can be reached (85%) at
high temperature even with by-product glycerol. The results show a drop in gas yield at
low temperatures. This is because of the formation of complex liquid products and tars
which cannot be detected by the mass spectrometer. Additional GC analysis of the water
trap samples at these temperatures supported this hypothesis and showed traces of
unreacted glycerol at 650ºC and contamination from liquid pyrolysis products at
temperatures below 700ºC. At all these temperatures the equilibrium constant for
glycerol reforming was very high which means that the loss of yield is not a
58
thermodynamic effect, but instead caused by either reaction kinetics (at low
temperatures) or by production of liquids and tars.
The effect of temperature on dry gas composition is shown by the data points in Figure
4.7. This reasonably matches with the predicted effect of temperature on equilibrium gas
composition (theory lines) especially at the higher temperatures (above 600°C). At
higher temperatures more pyrolysis (Table 4.1) takes place which produces CO. At
around 800°C there is an increase in the relative amount of CO2 to CO in the gas product.
This is because of reactions 3 and 8 (Table 4.1), which are endothermic and produce CO.
Reducing the temperature will retard these reactions by Le Chatelier’s principle. At
lower temperatures H2 concentration is reduced and CH4 increased because of reactions
5,6 and 7 (Table 4.1), which are exothermic and consume H2 to make CH4. On Figure
4.7 the R2 values are 0.44, -2, -5 and -1 for H2, CO2, CH4 and CO respectively. Negative
R2 values show that the data points could be better fitted with a straight horizontal line
(average of points) than with the theoretical line. Although, most of these R2 values can
be made to rise above 0.9 with selective deletion of just one data point which shows that
maybe anomalous data points are ruining the fit. The error bars on Figure 4.7 show the
standard deviation of the results which is small. The error bars increase towards the low
temperature region where the data departs from theory, although the error still remains
small. Several data sets supported this deviation from theory at the low temperature
region so it is not random and could highlight a problem with the theory.
59
Figure 4.6: Effect of temperature on gas yield and H2 selectivity. S/C =1.35, glycerol feed rate = 0.0065 ml/min, by-product glycerol.
The results showed less CH4 than expected from theory, and CO increasing at lower
temperature. The CH4 difference was either due to catalyst effectiveness or reaction
kinetics. Forming CH4 is a five species collision (reaction 7, Table 4.1) and is less likely
to happen than other two species collisions (reaction 4, Table 4.1). The CO increase at
600°C seems to be counter to thermodynamic theory but occurred in 2 repeats, this may
be a systematic error.
For combustion applications, H2 selectivity is not as important as gas yield because most
gases burn. However some gas components may be undesirable (e.g. poisonous to fuel
cells). The results are supported by the fact that the gas flows measured by the mass
spectrometer match the reactant flows and the carbon atoms can be counted and balance
60
mostly to within 5%. The results for by-product glycerol are very similar to those of pure
glycerol except for a slight reduction in yield.
Figure 4.7: Effect of temperature on product gas stream composition. Theory lines from thermodynamic theory. Data points are results from mass spectrometer.
Error bars are standard deviation of results. Key to symbols: Hydrogen, ▲; carbon dioxide, ◊; methane, ■; carbon monoxide, *. S/C =1.35, glycerol feed rate = 0.0065
ml/min, by-product glycerol.
4.4.5. Concentration of glycerol feed
The effect of feed steam/carbon ratio on selectivity, yield and SOFC performance at
850°C is shown by Figure 4.8. The liquid feed rate to the reformer was kept constant
while its glycerol concentration was changed. The yield stays constant close to 100%,
but the selectivity decreases with reducing S/C ratio. There was a sharp decline in SOFC
61
performance at S/C = 0.5 because of carbon deposition. The effect of S/C ratio on
reformer gas composition is shown by Figure 4.9. As the steam/carbon ratio was reduced
less H2 was produced and CH4 production was increased. This is caused by a lack of
water molecules starving the water-gas-shift reaction so methanation takes over.
Figure 4.8: Effects of feed steam/carbon ratio on gas yield, H2 selectivity and fuel cell current. Temperature = 850°C, pure glycerol.
The increase in CH4 production can be explained in terms of reaction 6 (Table 4.1),
where a gas stream with a high concentration of CO and H2 and lack of water restores
equilibrium by producing water and CH4. The maximum H2 production is at 2.5 S/C
ratio. In Figure 4.9 the R2 values for the theory lines are -5.9, -1.1, -20 and -0.06 for H2,
CO2, CH4 and CO respectively. These show that the theory is not a good fit and that a
mean average would better fit the results. Clearly something is going on here that the
theory does not take into account.
62
Figure 4.9: Effects of feed steam/carbon ratio on product gas stream composition. Theory lines from thermodynamic theory. Data points are results from mass spectrometer. Key to symbols: Hydrogen, ▲; carbon dioxide, ◊; methane, ■;
carbon monoxide, *. Temperature = 850°C, pure glycerol.
The drop in electrical performance in Figure 4.8 is because at low S/C ratios methanation
starts to take over as the dominant reaction mechanism and the CH4 increases, which
reduces performance and ultimately overloads the fuel cell. The drop in electrical
performance in Figure 4.6, at 0.5 S/C, corresponds to the crossover point in Figure 4.9,
where CH4 becomes the most abundant gas. When the carbon is present as CO or CH4 it
must chemisorb on to an active site to react, however the active site will become blocked
if too much of this carbon accesses the active site simultaneously leading to a high carbon
concentration and carbon deposition. CO2 does not have the same effect because it is
already completely combusted and has no need to chemisorb to the fuel cell anode for
63
further combustion. At zero S/C ratio with minimal water-gas-shift reaction the fuel cell
dies in just under an hour.
A maximum in electrical performance is shown in Figure 4.8 because the total liquid
flow was kept constant, so as the glycerol concentration increased, reformer gas flow
would increase, causing electricity generation to increase. Therefore the degradation of
electrical generation due to carbon deposition will have started at higher S/C ratios, but
would have been masked by the increase in fuel gas flow rate. The optimum S/C ratio is
therefore closer to 2.5 than 0.5.
4.4.6. Flow rate of glycerol feed
The variation in gas composition against the reactant flow rate at 800°C and S/C ratio
1.35 is shown in Figure 4.10. At faster flow rates the H2 yield begins to decrease and CO
increases. This is the same when flow rate is controlled by carrier flow and by reactant
flow. This effect is caused by reactant gases by-passing the catalyst without sufficient
time to properly react. In order to water-gas-shift, a reactant molecule needs several
requirements to be met; an available active site, contact with a water molecule for a
certain period of time and enough energy to overcome the activation energy barrier. If
the flow rate per g of catalyst is too fast then one or all of these conditions may not be
met. Without these conditions the reactant molecules may just be pyrolysing (reaction 2,
Table 4.1) on the surface area of the support. The CH4 concentration increases with flow
rate, probably because the water-gas-shift reaction only occurs at the active site whereas
methanation can occur anywhere on the support (trend observed in 4 repeats). With
64
platinum alumina all the water trap samples were clean (G.C. showed no hydrocarbons
present) even at the highest flow rate tested.
Figure 4.10: Reforming at differing flow rates. Effect of reformer flow rate on gas composition. S/C = 1.35, temperature = 800°C, pure glycerol.
The yield, selectivity and SOFC performance at different flow rates are shown in Figure
4.11. The yield is constant throughout, but the H2 selectivity decreases with increasing
flow rate. The SOFC current increases (caused by more fuel) up to a maximum followed
by a decline in performance (caused by carbon deposition). The optimal electrical
performance was reached at a feed rate of 0.20 mols/min (glycerol) per kg catalyst. After
this point further flow actually decreased the current drawn. The fuel cell was
overloaded because too much carbon flowed through the fuel cell (per weight of cell) and
there were too few active sites to process it. Consequently, carbon blocked the active
sites by forming high local concentrations without the O2- ions coming through to react
and desorb so instead the carbon reacted with each other leading to tar formation. This
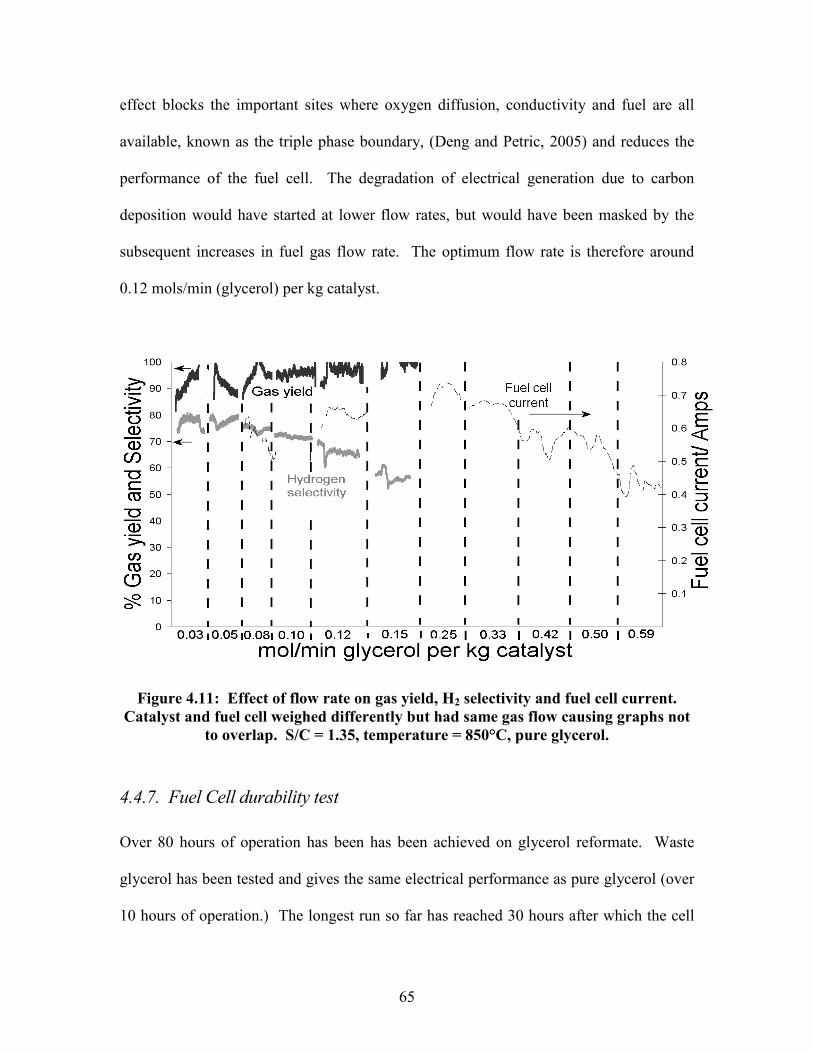
65
effect blocks the important sites where oxygen diffusion, conductivity and fuel are all
available, known as the triple phase boundary, (Deng and Petric, 2005) and reduces the
performance of the fuel cell. The degradation of electrical generation due to carbon
deposition would have started at lower flow rates, but would have been masked by the
subsequent increases in fuel gas flow rate. The optimum flow rate is therefore around
0.12 mols/min (glycerol) per kg catalyst.
Figure 4.11: Effect of flow rate on gas yield, H2 selectivity and fuel cell current. Catalyst and fuel cell weighed differently but had same gas flow causing graphs not
to overlap. S/C = 1.35, temperature = 850°C, pure glycerol.
4.4.7. Fuel Cell durability test
Over 80 hours of operation has been has been achieved on glycerol reformate. Waste
glycerol has been tested and gives the same electrical performance as pure glycerol (over
10 hours of operation.) The longest run so far has reached 30 hours after which the cell
66
was still functional (see Figure 4.12.) This was achieved with pure glycerol at S/C = 1.35
and a flow rate of 0.01302 ml/min(glycerol) and during this time 30 g of glycerol was
reformed. Very little carbon deposition was observed inside the reformer (only 0.12 g)
and the water trap contained only trace amounts of pyrolysis products 0.034 g.
Figure 4.12: Fuel cell current degradation test running on pure glycerol. 0.013ml/min(glycerol), 800ºC, 1.35 S/C.
4.4.8. Liquid pyrolysis product identification
High Performance Liquid Chromatography (HPLC) was used to analyse the water trap
samples. However, there were too many peaks with concentrations which were too small
to permit identification (40 components, most under 1mg see Figure 4.13). However,
glycerol was identified by mass spectrometer and could be recognised by its residence
time. Gas chromatographic analysis involved similar problems, although significant
concentrations of several light components could be seen in the liquid and in the head
67
space. Most of the water traps had a ‘bad egg’ smell which dissipated with time. No
discolouration of the water trap samples was observed.
Figure 4.13: HPLC of water trap components. Too many peaks with concentrations which were too small for identification.
4.4.9. Process economics
This process could potentially take all the waste from a Biodiesel plant and convert it to
useful energy. This would eliminate expensive disposal costs and generate money from
the sale of the energy and ROC’s. Next is an economic assessment of the process, with
the bottom line showing its effect on the price of a litre of biodiesel. The reforming
reaction takes place in the gas phase and energy is required to evaporate the reactants. In
the past some biomass gasification systems had required more energy to convert the
68
biomass than could be obtained from the product gas. However, these calculations show
that the product energy should be more than sufficient to supply the process energy.
Basis for calculation: production of 1000 litres of biodiesel The yield of by-product from 1000 litres of biodiesel…………………….
200 litres
Amount of which is glycerol……………………………………………
100 litres
Amount of water Assuming 2x stoichiometric ratio (S/C=1.35)………..
100 litres
Process energy cost Energy to heat glycerol to boiling point………………………………….
48.7MJ
Energy to heat water to boiling point……………………………………
49.4MJ
Energy to vaporise glycerol ………………………………………………
121.8MJ
Energy to vaporise water ……………………………………………… 344.6MJ Energy to heat gas to reaction temperature at 800ºC………………….. 354MJ Energy for endothermic reaction………………………………………..
173.5MJ
Energy cost total……………………………………………………….. 1092MJ Energy produced Hydrogen produced from 125kg glycerol………………………………..
18.05kg
Energy produced from calorific value of hydrogen………………………..
2708MJ
Net energy produced assuming 40% efficiency…………………………..
646MJ
Profit from sale of electricity …………………………………………….
0.448p/litre
Profit from sale of ROC’s …………………………………………………
0.807p/litre
Saving on waste disposal cost…………………………………………….
0.6p/litre
Total additional profit per litre of biodiesel………………………………
1.855p/litre
Table 4.2: Economic calculation
69
From the results (section 4.2 and Figures 4.7 and 4.10) we can see that almost all the glycerol is
converted to gas and only 0.5-2% is deposited as carbon. Power generated (in Figure 4.5) was …………………………………
0.35 Watts.
Glycerol flow rate to achieve this …………………………………...
1.8138x10⁻⁴ mol/min.
Hydrogen yield predicted using reaction equation 4.1 is …………….
1.2697x10⁻³ mol/min.
Calorific value of this hydrogen could generate energy of …………
0.3809kJ/min.
40% of the energy produced is required to heat the reactants leaving ..
3.81watts.
Efficiency compared to experimental results (figure 4.5) was …… ….
9.2% efficient.
Table 4.3: Efficiency calculation. Additionally, further efficiency could be gained by using condensers to recycle the waste heat after the reaction.
4.5. Conclusions to Steam reforming
Steam reforming of glycerol and biodiesel by-products has been studied using Pt/Al2O3
catalysts over a range of conditions. A SOFC has been run on glycerol and biodiesel by-
product for the first time. A thermodynamic analysis has been compared to the
experimental results and several discrepancies were observed. At high temperatures
almost 100% gas yield was reached and selectivities of up to 70% (dry basis) obtained.
Steam reforming of glycerol is the dominant mechanism at temperatures above 700ºC, at
flow rates under 0.6 mole/min per kg catalyst and at steam/carbon ratios of over 0.5.
Optimum reformer performance was reached at 880ºC, a flow rate of 0.12 mols/min
(glycerol) per kg catalyst and steam/carbon ratio of 2.5. The SOFC performance was
irreversibly degraded thus indicating high carbon deposition at flow rates above 0.20
70
mols/min (glycerol) per kg catalyst, and steam/carbon ratios below 0.5. The SOFC
would not operate at temperatures below 600 ºC because the zirconia did not allow
oxygen movement and quickly degraded at very low steam/carbon ratios.
Under the same reaction conditions the yield of by-product glycerol was on average only
70% of the yield of pure glycerol. This is because the long chain fatty acid impurities are
harder to reform and more likely to form carbon. In 30 hour experiments pure glycerol
deposited 0.4% of feed as carbon whereas by-product glycerol deposited 2% of feed.
Under the right conditions SOFCs can operate on reformed glycerol for a considerable
length of time which indicates the reformate is of good quality and compatible with gas
turbines or engine driven generation equipment. Steam reforming is a viable alternative
use for by-product glycerol and could potentially take all the waste from a biodiesel plant
and convert it to higher value product.
71
CHAPTER 5
KINETICS OF THE BIODIESEL REACTION IN A BATCH
REACTOR; ATTAINING 96.5% ESTER
5.1. Introduction
In the EU, biodiesel is sold to the EN14214 standard (European Committee for
Standardization, 2003) which stipulates 96.5% ester content. Typically, in the Green
Biodiesel company, biodiesel made from recovered cooking oil only reaches 90% ester
content or less (Table 5.3). This was a major problem because the product value was too
low, it had to be blended with higher quality fuels and some whole sellers would not
accept it. Commercial biodiesel is a relatively new industry and the theory behind the
process was not well understood. In the literature there are conflicting theories (Boocock
et al, 1996) and no numerical theories have been proposed that predict effects of
variables on ester content. The green biodiesel company did not know how to improve
their product quality so this author was tasked to investigate the problem. The problem
described in this chapter is the theory and practice of reaching 96.5% ester content in a
batch reactor.
The transesterification reaction is a cascade reaction where the triglyceride oil is stripped
of fatty acid chains in stages until only glycerol remains (Figure 5.1.). Initially progress
is fast with 85% conversion occurring in the first 5 minutes of the reaction but after this
the rate drops to almost nothing making it difficult to reach 96.5% (Noureddini et al,
72
1997). In this chapter a range of experiments ware conducted to find out what was
causing the low quality issue. The reaction kinetics of the batch reaction were evaluated
and a numerical theory was developed to help understand the reaction and predict
conversion. Mass spectrometry was also used to identify the impurities which affect
Figure 5.1 Stepwise reaction mechanism. (Adapted from Harvey et al., 2003)
5.1.2. Green biodiesel process
The Green Biodiesel process (Figure 5.2) starts with recovered cooking oil delivered to
the factory in 33,000 litre tankers. This oil was delivered at 50 °C and stored in heated
storage tanks to keep it from setting solid. Water and fatty acid was tested in the lab prior
to accepting the tanker. Loads with higher than 2% water or 7% fatty acid were either
rejected, or accepted at a discounted and blended down. No treatment was done to the oil
to remove water or fatty acid prior to reaction. Methanol was delivered to the plant by
tanker and stored at room temperature in flammable liquid storage tanks. Sodium
hydroxide was delivered to the plant in sacks of solid pellets.
73
The methanol was measured out into a 500 litre mixing tank and mixed with sacks of
sodium hydroxide which were manually loaded by an operator. There was no motor on
top of the vessel because it would have been an ignition source, instead the methanol was
pump mixed. Methanol was pumped out the conical bottom and pumped in at the tangent
to the vessel to create a cyclone motion which mixed the NaOH. The Reynolds number
was low. The sodium hydroxide reacted with the methanol to make methoxide and the
temperature increased to 40 °C. The reactor for the transesterification reaction was a
2000 litre mixing vessel with a 10 KW motor driving duel anchor type paddle impeller s.
The hot oil was loaded first and methoxide was pumped into the reactor and mixed to
start the reaction. To aid mixing, the reactants were also circulated from bottom to top
using a 5 KW pump. The Reynolds number of this mixing process was low, around
1000-2000, almost to the degree that the liquids would settle. The oil was usually mixed
with 20% methoxide (by volume of oil) and mixed for 1 hour at just below the boiling
point of methanol (~60 ºC). Usually 3.5 g of NaOH were used per litre of oil plus any
extra needed to neutralise the fatty acids. Using this process it was impossible to reach
the standard 96.5% ester content. When using lower quality oils the reaction process was
often altered by adding 80% of the methoxide and reacting for 1 hour, followed by a
second reaction with the remaining 20% methoxide, after separation of the glycerol
containing layer. This alteration made it possible to use high fatty acid oils (up to 7%)
but sacrificed yield (~75% yields). The impurities were removed in the first glycerol
extraction but soap also emulsified biodiesel into the glycerol layer, reducing the yield.
74
This alteration gives the same ester content and it was still impossible to reach the
standard 96.5%.
The whole operation was manually controlled by an operator pulling levers to open and
close valves and turn on/off pumps. No advanced control was used. Since every tanker
load of oil was different, operators were encouraged to “experiment” with the catalyst
and methanol concentrations on each 2000 litre batch. Lab tests were used to guide
dosage, and the volume of glycerol and other visual inspections were used to tell if a
batch was successful. It was expected that after 3 batches the optimum concentration
would be found, and the rest of the load could be reacted using the same conditions. The
parameters of each batch were documented and recorded to help with shift handovers and
track trends in plant performance.
After the reaction the products were pumped into one of many settling tanks. The settling
process would be allowed to last between 8 to 24 hours. The waste glycerol would settle
on the bottom and would be drained off and pumped into storage tanks waiting to be
tankered away for disposal. The settled fuel would than be pumped into a wash tank and
mixed with 10% water (by volume of oil) and mixed using compressed air jets for an
hour. This would emulsify the fuel and water and transfer impurities into the water. The
mixture would then be allowed to settle for 6-24 hours and the waste water would be
pumped into storage tanks awaiting disposal by tanker. The washing-settle process was
very ineffective and needed to be repeated 2 more times to remove enough impurities to
get complete emulsion separation to give clear fuel. This used 30% water (by volume of
75
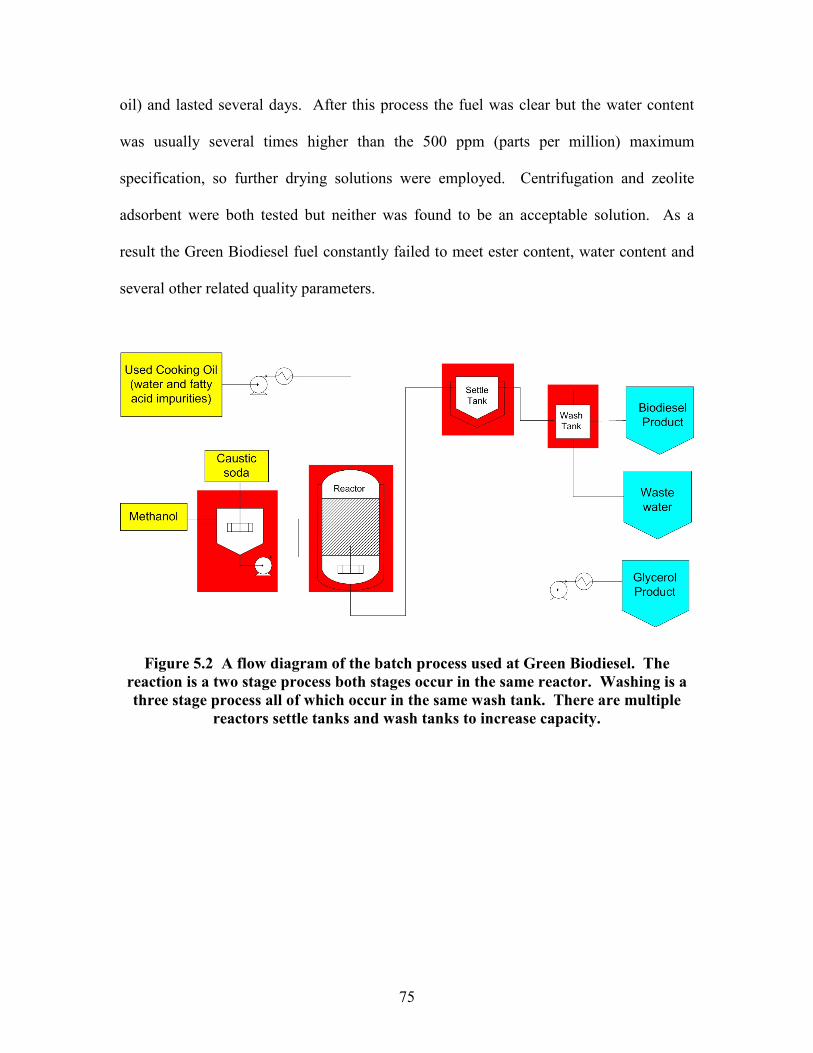
oil) and lasted several days. After this process the fuel was clear but the water content
was usually several times higher than the 500 ppm (parts per million) maximum
specification, so further drying solutions were employed. Centrifugation and zeolite
adsorbent were both tested but neither was found to be an acceptable solution. As a
result the Green Biodiesel fuel constantly failed to meet ester content, water content and
several other related quality parameters.
Figure 5.2 A flow diagram of the batch process used at Green Biodiesel. The reaction is a two stage process both stages occur in the same reactor. Washing is a three stage process all of which occur in the same wash tank. There are multiple
reactors settle tanks and wash tanks to increase capacity.
76
5.2. Theory
There can be several reasons why a reaction does not reach completion. The
thermodynamic equilibrium may limit conversion, feed impurities may contaminate the
product and the rate of reaction may be too slow. These limitations are discussed below.
5.2.2. Thermodynamic conversion
Thermodynamics can tell us what degree of completion a reaction should reach at
equilibrium. There are several complex reactions involved in transesterification but the
process can be simplified down to three competing reversible reactions; esterification,
hydrolysis and saponification. These reactions yield three competing products; fatty acid,
ester and soap. The reactions are shown in Figures 5.3, 5.4 and 5.5. Minimisation of
Gibbs free energy was used to calculate the equilibrium constants for these reactions,
which are shown in the Figure legend. Component mass balances combined with these
equilibrium constants can be solved to find ester content but certain assumptions and
iterations are needed. The result is a maximum conversion for biodiesel
transesterification reaction of 99.8% at 25ºC. This clearly shows that transesterification is
a very thermodynamically favourable reaction with high equilibrium constant and
potential for full conversion.
R-COO-R’ + NaOH R-COO- Na+ + R’OH
Ester Sodium hydroxide Soap Methanol
Figure 5.3 Ester saponification to form soap (or soap esterification in reverse). Tri-glycerides, mono-glycerides, di-glycerides and fatty acids can also be saponified.
Figure 5.4 Ester hydrolysis to form fatty acids (or esterification in reverse). Tri-glycerides, mono-glycerides and di-glycerides can also be hydrolysed. ΔH298 =
Most authors (Noureddini et al 1997, Boocock et al 1996, Dube et al 2007, Ma et al 1999
and Freedman et al 1984) agree that the transesterification reaction is initially mass
transfer limited because the oil and methanol reactants are immiscible. Therefore,
conversion could be modelled using a droplet size equation (Equation 5.1) and a reactor
design equation (Equation 5.2). Ma et al, (1999) concluded that for the biodiesel reaction
Misek’s equation (Equation 5.1) could be used to predict droplet diameter. The Misek’s
equation was selected for use in this work because it was the mentioned in a respected
biodiesel paper, it had simple parameters which were all known for the system of interest
and it seemed to fit with results later on. The Rate equation of mass transfer limitation
(Equation 5.2) was selected because it illustrates how surface area can be included in a
reaction rate equation for mass transfer limited reactions. It was published in a well
respected book and it is a physical equation, not empirical. This equation was simplified
into equations 5.4 and 5.5, for ease of use in this work to include only one concentration
and surface area term as is relevant for the fast reaction at surface model.
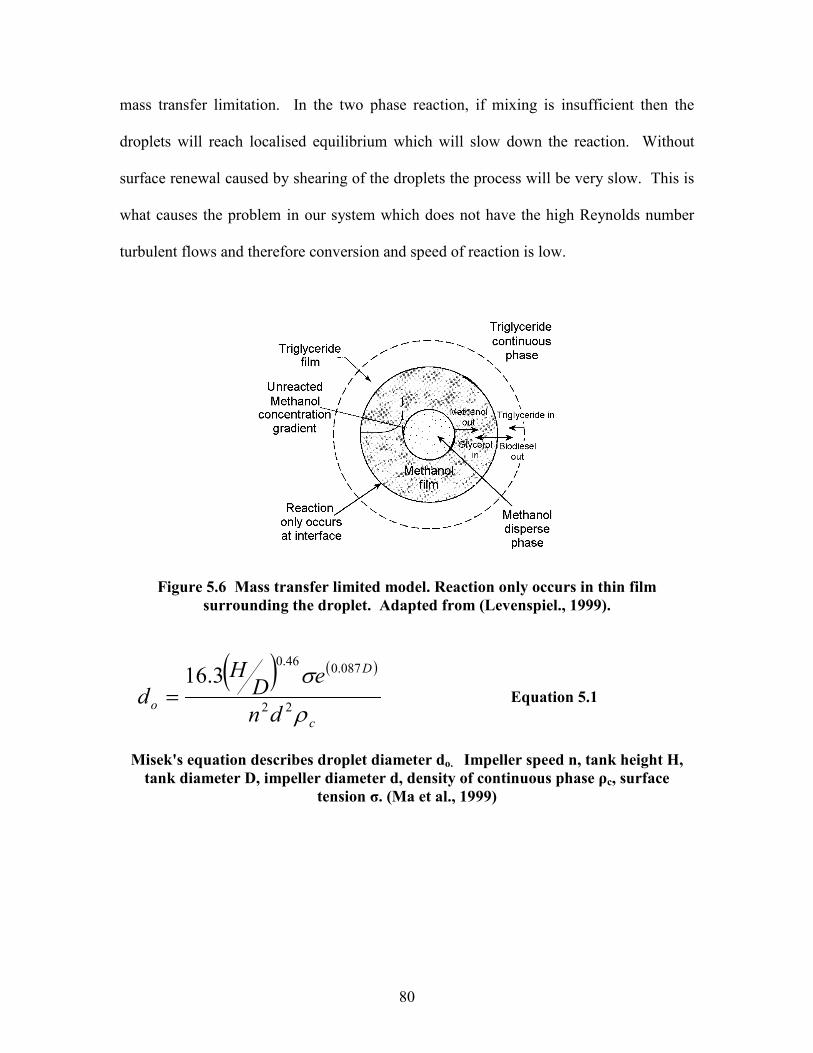
The droplets start off as methanol in a viscous oil phase and, through reaction, are
changed to viscous mostly glycerol droplets in a biodiesel phase. The glycerol phase is
often solid at room temperature which highlights the mass transfer problems. At reaction
temperatures there are no solids present in the reactor. The reaction itself takes place in a
thin film around the droplets because the reaction is very fast but limited by mass
transfer. This was demonstrated by Boocock et al, (1996) who used co-solvents to
achieve a single phase reaction that achieved very fast reaction times by removing the
80
mass transfer limitation. In the two phase reaction, if mixing is insufficient then the
droplets will reach localised equilibrium which will slow down the reaction. Without
surface renewal caused by shearing of the droplets the process will be very slow. This is
what causes the problem in our system which does not have the high Reynolds number
turbulent flows and therefore conversion and speed of reaction is low.
Figure 5.6 Mass transfer limited model. Reaction only occurs in thin film surrounding the droplet. Adapted from (Levenspiel., 1999).
( ) ( )
c
D
o dn
eDH
dρ
σ22
087.046.03.16
=
Equation 5.1
Misek's equation describes droplet diameter do. Impeller speed n, tank height H, tank diameter D, impeller diameter d, density of continuous phase ρc, surface
tension σ. (Ma et al., 1999)
81
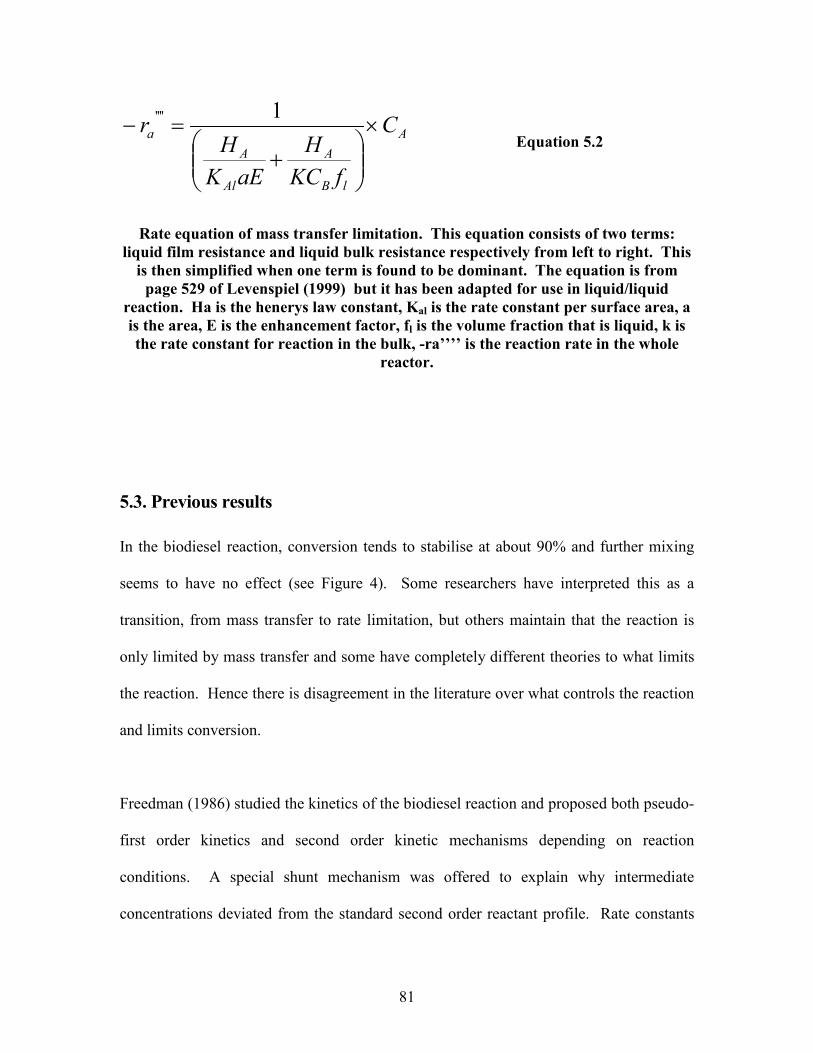
A
lB
A
Al
Aa C
fKCH
aEKH
r ×
+
=−1''''
Equation 5.2
Rate equation of mass transfer limitation. This equation consists of two terms: liquid film resistance and liquid bulk resistance respectively from left to right. This
is then simplified when one term is found to be dominant. The equation is from page 529 of Levenspiel (1999) but it has been adapted for use in liquid/liquid
reaction. Ha is the henerys law constant, Kal is the rate constant per surface area, a is the area, E is the enhancement factor, fl is the volume fraction that is liquid, k is the rate constant for reaction in the bulk, -ra’’’’ is the reaction rate in the whole
reactor.
5.3. Previous results
In the biodiesel reaction, conversion tends to stabilise at about 90% and further mixing
seems to have no effect (see Figure 4). Some researchers have interpreted this as a
transition, from mass transfer to rate limitation, but others maintain that the reaction is
only limited by mass transfer and some have completely different theories to what limits
the reaction. Hence there is disagreement in the literature over what controls the reaction
and limits conversion.
Freedman (1986) studied the kinetics of the biodiesel reaction and proposed both pseudo-
first order kinetics and second order kinetic mechanisms depending on reaction
conditions. A special shunt mechanism was offered to explain why intermediate
concentrations deviated from the standard second order reactant profile. Rate constants
82
were calculated by plotting Arhennius graphs (Lnk vs 1/T). Noureddini and Zhu (1997)
studied the kinetics of the transesterification of soy oil. They concluded that the reaction
was only mass transfer limited in the initial slow region after which a single phase was
formed and the reaction rate increased. The reaction was said to be rate limited from then
on, by a second order kinetic. They stated that the matching reaction rate curves from
different impeller speeds proved that the reaction was rate imitated. They plotted
Arhennius graphs and calculated rate constants for the reaction.
Boocock et al., (1996) noticed that transesterification using butanol at 30 ºC was 15 times
faster than using methanol at 40 ºC. They concluded that this was because the methanol
transesterification was a two phase system compared to the single phase butanolysis
reaction. These realisations led them to develop a co-solvent system that used THF in
1.25 times the volume of methanol to form a single phase. The process dramatically
increased the initial rate of reaction although there was still difficulty reaching the desired
conversion. In their 1998 paper Boocock et al tested the kinetics of their new THF co-
solvent method and tried to reach full conversion. They found the THF diluted and
slowed the reaction and they could not get full conversion with one methanol injection
because the amount of THF needed to achieve a single phase diluted the reaction too
much. They explained the absence of mono and di-glycerides without recourse to
Freedman’s shunt mechanism. They reasoned that, the reaction takes place in the
methanol where the hydroxyl groups of the created intermediates would be more soluble
causing them to react further.
83
Ma et al., (1999) looked at the effect of mixing in beef tallow methyl-ester including
droplet size observations. A difference was noted between adding the methanol while
mixing compared to before mixing. Drop size verses impeller speed correlations were
proposed for the beginning of the reaction. It was concluded that after reaction initiation
a stable emulsion was created and the effect of stirrer speed was insignificant on
conversion in the range 110 - 330rpm. Zheng (2006) concluded that no significant
difference in the yield of biodiesel was found within the Reynolds number range of 6000
– 12,000 (100 - 600rpm). Darnoko and Cheryan., (2000) studied the effects of
temperature on the reaction kinetics of the biodiesel reaction. They observed that higher
temperatures did not reduce time for maximum conversion. They plotted Arhennius
graphs (Lnk vs 1/T graphs) and calculated rate constants and activation energies for all
the component reactions. Olivera et al., (2007) studied the effect of agitation intensity on
alkali catalysed methanolysis of sunflower oil. They found droplet size distribution
became smaller and narrower during reaction or with increased impeller speed. They
observed the drop size to stay constant then reduce then level out which corresponded to
the slow fast slow parts of the biodiesel reaction. They put the slowing of the reaction
down to the nearing of a state of equilibrium.
It is evident from this discussion of previous work that the question of mass transfer in
the biodiesel reaction has not been fully answered. Therefore, experiments were
designed to show the phase separation in a small reactor, and theory was proposed to
explain these new observations (Slinn and Kendall 2008).
84
5.4. Experimental
Figure 5.7 Equipment diagram. Equipment developed by Pacek et al (1998). For experiments where droplet size measurements were important reactions were done in
a 2 litre closed glass vessel and filmed using a camera-microscope-strobe light
arrangement as shown in Figure 5.7. Samples taken from the reactor were chilled with
ice water and quenched with acidic ion-exchange resin to stop the reaction then
centrifuged to remove the glycerol. For experiments where multiple data points were
needed whilst ensuring that temperature and mixing conditions remained constant, sealed
centrifuge tubes were used in a large culture shaker. Reacted biodiesel samples were
washed three times by shake mixing with water in centrifuge tubes followed by
centrifugation to separate. For biodiesel distillation a single stage vacuum distillation
85
apparatus was used with pressures set around 0.3 mbar and temperatures set between 132
ºC-170 ºC inside a fume cupboard.
The EN14214 standard test uses an internal standard gas chromatography method
(European Committee for Standardization, 2003). It is based on the fact that only ester
elutes from the chromatography column between the specified residence times (10 - 25
minutes) whereas the mono, di and triglyceride components will stick to the column. The
test uses methylheptadecanoate, a 17 carbon chain ester which does not naturally occur in
nature, as an internal standard with which to compare the areas of the ester peaks. Two
drops of sample are weighed, then doped with a known weight of methylheptadecanoate
in heptane and then injected into the gas chromatography (G.C.), where the peak areas
are recorded. The area of the internal standard peak was related back to its weight in the
sample. This provided a ratio which could be used to calculate the weight of ester from
the total ester peak areas. This calculated weight of ester was then divided by the actual
sample weight, to provide a percentage ester content for the sample (see Equation 5.4).
This work used a HP5890 series II gas chromatograph with a HP1 column, split injection
and flame ionisation detector (FID). In repeatability trials this method was accurate to
within ±1% ester which is the basis for the error bars on the graphs in this thesis. A
typical G.C. trace is given in Equation 5.3.
86
Equation 5.3
Used to calculate ester content in EN14214.
Figure 5.8 Typical gas chromatograph used to calculate ester content in EN14214.
This simple method eliminates the error incurred by varying injection volumes. However
several assumptions have to be made this method; that all methylesters are detected
equally in the flame ionization detector, that all methylesters are detected linearly with
concentration in the flame ionization detector and that everything between the 10 - 25
minute residence time is methylester. The problem with this method is that not all the
sample passes through the column and the heavy components stay stuck to the column
until they eventually degrade enough to become volatile. There are arguably better
87
methods than this official standard. One method uses a high temperature column through
which all the sample components can pass including the mono, di and triglycerides. This
method doesn’t involve an internal standard, but instead assumes that the peaks make up
everything in the sample and that the ester peak area can be divided by the total peak area
of the sample to give the ester content. This method can be used at the same time to give
the mono, di and triglycerides content.
5.4.2. Materials
The methanol used was supplied by sigma Aldrich >99% purity, CAS number 67-56-1,
other names: Methyl alcohol, wood alcohol, monohydroxymethane. The vegetable oil
(rapeseed oil) used was supplied by KTC ltd and was edible food grade quality >99.9%,
CAS number 8001-22-7, also called tri-glyceride, tri-glycerol, triaclyglycerol. The
caustic soda (sodium hydroxide, NaOH) was supplied by sigma Aldrich and was 97%
pure, CAS number 1310-73-2. The ethanol was supplied by sigma Aldrich, >99.5%
purity, CAS number 64-17-5, also known as ethyl-alcohol. The heptane, supplied by
sigma Aldrich, was chromatography grade, purity >99.5%, CAS number 142-82-5. The
methlyheptadecanoate was chromatography grade, 99.7% pure. Other synonyms used
are: Methyl margarate, Heptadecanoic acid methyl ester, C17-methylester. It was
supplied by sigma Aldrich, CAS number 1731-92-6.
88
5.5. Results
5.5.2. Proofing the mass transfer mechanism
In order to improve the reaction conversion we must first understand the governing
dynamics of the biodiesel reaction. From the thermodynamic calculations it was clear
that thermodynamics do not limit the reaction. Therefore there must be a kinetic rate or
mass transfer limitation. The conversion problem is illustrated well by Figure 5.9 where
the data points never reach the 96.5% standard.
Figure 5.9 Progression of the biodiesel reaction over time. Shows typical biodiesel reaction stopping short of 96.5% standard. Reaction conditions 55°C, 6:1 mole
ratio, 200rpm.
This graph is not original and has been published before by many authors (Darnoko,
Boocock, Freedman, Noureddini and Olivera). The problem is that no single reaction
89
mechanism has explained the sudden change in reaction rate and there is substantial
disagreement in the literature over its cause. First or second order reaction models do not
level out to the same degree as shown in the graph.
Figure 5.10 Product ratio of reactions involving different ratios of ethanol to methanol reactant. Indicates mass transfer limitation. Reaction conditions 55°C,
2:1 volume ratio, 200rpm.
Subsequent experiments involved using both ethanol as well as methanol for the alcohol
reactant. This work showed an interesting correlation as shown in Figure 5.10.
Ethylester is the product of the reaction involving ethanol and oil just like methylester is
the product of reaction involving methanol and oil. This graph shows that the ratio of
ethyl to methyl ester is equal to the ratio of concentrations of ethanol to methanol which
would only be the case if the reaction was mass transfer limited. If the reaction were
90
kinetic limited the product ratio would correlate to the relative rates of reaction of
methanol and ethanol with oil. This graph indicates that the reaction is for the most part
mass transfer limited; however, it does not explain what causes the sudden level out in
conversion. There could still be a change in mechanism as suggested by Noureddini and
Zhu (1997) which would not be shown on this graph.
Since the reaction is at some point mass transfer limited the next step was to look more
closely at droplet sizes through out the reaction. This is difficult work as the droplets are
very small and diffract light well. However using the technique of real-time optical
microscopy it was possible, at lower impeller speeds, to measure droplet size vs. time in
several reactions. The results are shown in Figure 5.11 and the screen shots in Figure
5.12. This shows the droplet size initially reducing and then increasing.
Only one other group has taken this approach (Olivera et al., 2007) but they used lower
temperatures in order to make the droplets visible to the technique via increased
viscosity. They reported a reduction of droplet size, but noticed no subsequent increase
in size because they were not using actual reaction conditions. Evaporation is an
important factor because most biodiesel manufacturers operate open non pressurised
reactors.
91
Figure 5.11 Changes in average droplet size over the course of the biodiesel reaction. Each data point is an average of 300 measurements. Detection limit
Figure 5.12 Images of biodiesel reaction droplet sizes through progression of reaction. Width of all images the same = 2.38mm
In the reaction soap, together with mono and di-glycerides are formed which are very
surface active. These would reduce interfacial tension so it makes sense that the droplet
size would reduce as these intermediates are created. It also makes sense that the droplet
size would increase again as they are consumed or trapped inside viscous glycerol
droplets. Other droplet size results showed that droplet size was highly sensitive to
methanol concentration. Droplet size seemed to increase with decreasing methanol
93
concentration and decrease with added methanol. This was probably because of viscosity
variation. Because the reaction takes a long time and is nearly at methanol’s boiling
point, it is likely that some methanol will evaporate which would therefore reduce droplet
size. It was realised that this size variation could be pivotal to explaining the slow-fast-
slow nature of the biodiesel reaction, and why it does not reach completion. The next
step was to incorporate this mass transfer limitation into a kinetic model which could be
used to make predictions that could be tested.
5.5.3. Finding order of reaction and rate constants
The real time droplet size data was used to calculate surface area and plotted against the
real time ester content to derive the reaction kinetics order of reaction. The reaction rate
equation governing mass transfer limitation can be simplified for the biodiesel reaction to
Equation 5.4 for first order or Equation 5.5 for second order. This form of rate equation
allows the total interfacial area (a) to be included in the rate equation which is important
for mass transfer limited reactions. In reality the rate would be dependant on both
methanol and oil concentration, but simplifications have to be made to make the maths
solvable. Equation 5.4 is a fair assumption if methanol is in a large excess and Equation
5.5 is a fair assumption if the concentrations of reactants are stoichiometric. However
our reaction is in between these simplifications so a fudge factor of 2 is required for the
concentration term. Concentration is doubled for the modelling equation, this is listed in
Table 5.2 fit parameters.
94
aa kaCr =
Equation 5.4
For First order (A → products)
2aa kaCr =
Equation 5.5
For Second order (2A → products) or (A + B → products when Cao = Cbo)
Curve fitting was used to determine the reaction order by seeing which hypothesis best fit
the data points. Figure 5.13 shows a reaction rate vs. time plot with real data points set
against different order of reaction predictions. Real time droplet size data was used in
some of the lines to see if that helped the fit. A visual closeness of fit, trial and error
method was used to find the rate constant for the curves to match the data points as
closely as possible. The hypothesis which fit the closest and was solvable was second
order with changing interfacial area during reaction. The R2 value for this fit was 0.92.
The two theory lines which do not involve drop size were clearly the worst fit to the real
data which is further proof that mass transfer is pivotal to the reaction mechanism.
95
Figure 5.13 Curve fitting of different reaction rate hypotheses to reaction rate vs time data. Showing that area dependant 2nd order is best fit to experimental data. Reaction conditions 55°C, 6:1 mole ratio, 200rpm. Data points are experimental
results.
5.5.4. Modelling reaction conversion
To model the reaction, we must use a reactor design equation and know the interfacial-
area (a) for the system of interest. Interfacial-area depends on droplet size which depends
on interfacial tension which changes through out the reaction as components are formed
and lost. To find how the degree of conversion effects the interfacial tension during
reaction Misek’s equation of droplet size was used, first mentioned in Ma et al, 1999.
This equation was used to calculate interfacial tension from the measured droplet sizes
through out reaction. This interfacial tension was plotted against the conversion to
develop an empirical function which could be used for prediction of interfacial tension
under different reaction conditions Figure 5.14. This empirical function is also listed in
96
the fit parameters in Table 5.2. This was developed using trial and error comparing to
data points and quadratic function was the simplest function that best fit the results.
Figure 5.14 Interfacial tension vs ester content relationship. Showing how interfacial tension changes during reaction. Reaction conditions 55°C, 6:1 mole
ratio, 200rpm. Data points are experimental results line is theory line for comparison.
This method does not give an accurate measure of interfacial tension because it is based
on indirect measurements. This is necessary though because it is a fast reaction which is
changing as it is being measured and an online measurement is needed to see the changes
with time. Pendent-drop method was used to confirm ball-park measurement accuracy,
on samples of reaction mixture. The error bars are large, plus or minus a quarter of full
scale movement of the variable. Figure 5.14 shows a quadratic function of conversion
was the best continuous function to fit the interfacial tension data. The R2 value of this fit
was 0.81, although this may be because of the lack of data points. If a completely sealed
reactor is used then evaporation would not be a factor and a different function would be
97
needed also shown on the Figure 5.14. Because of the changing interfacial tension
observed it is necessary to relate interfacial tension to conversion and use an iterative
formula when trying to model the conversion.
( )
××+
−=ao
a CatkX
111
Equation 5.6
Modified equation for conversion of second order reaction in a batch reactor. Area term added. Modified from (Levenspiel., 1999)
To model biodiesel conversion the second order batch reactor design equation (Equation
5.6) can be modified and used. This equation was selected because it was the simplest
equation that could represent our reaction system -second order, batch reactor. It is a
physical equation, not empirical and it was found in a respected book. The equation was
then modified to include an area term to reflect the changing interfacial-area, which is
mass transfer limiting. It is limited because it is designed to predict conversion from
initial set of parameters that are not supposed to change in reaction, therefore our model
needs to be integrated over the reaction to compensate for the changes at each time step
during the reaction. Misek’s equation can be used to find this area and the empirical
equation for σ (in table 5.2) can be used to estimate interfacial tension used in the Misek
equation. The result of adding these formulae together is the equation shown in equation
5.7 which can be used to predict biodiesel conversion in reactions.
The conversion used in the empirical equation for σ (table 5.2) is always taken from the
previous time step, therefore making equation 5.7 iterative. At each time step the product
98
of interfacial-area and time (a.t from equation 5.6) is calculated by summing the
interfacial areas of all previous time steps (using Simons rule) hence the sigma sign in
equation 5.7.
Equation 5.7. Proposed biodiesel conversion equation for two phase biodiesel
reaction in a batch reactor. Where σ is the equation from table 5.2.
Fit parameters Value used
K 0.3 σ
Cao 2Cao
Table 5.2 Parameters used to fit equation model to data. K value was arrived upon from figure 5.13 and visual least squares method, σ
Figure 5.15 shows the resulting theory lines calculated using this method and shows other
methods that are less successful (i.e. assuming first order or not accounting for
interfacial-area change). The second order theory that accounts for changing interfacial
tension based on conversion is the best fit to the real data and provides the correct slow-
fast-slow curve for conversion.
99
Figure 5.15 Ester content vs. time graph showing goodness of fit to reaction rate hypotheses. Showing 2nd order changing interfacial tension is the best fit to
experimental data. Reaction conditions 55°C, 6:1 mole ratio, 200rpm. Data points are experimental results from two data sets, lines are theory lines for comparison.
One point worth noting is that the model is simplified to the form (oil) → (ester) and does
not show mono and di-glycerides concentration which is negligible most of the time.
Mono and di-glycerides are more soluable in the methanol reactant and tend to react
preferentially (Boocock et al, 1996). One time where these concentrations may not be
negligible is at the beginning of the reaction where the theory line shows a sharper
increase than the real data points. This may be because the reaction has to first produce
mono and di- glycerides to lower the interfacial-tension and boost reaction where as the
theory assumes that conversion is straight to ester.
100
This model is not absolutely accurate, there are ways to improve upon it, but it is a good
theory for how a better model could be developed. The model has an R2 value of 0.79.
The theory is only applicable within the limitations of the study i.e. in a non-pressurized,
two phase, batch reactor. Also the results themselves are very difficult to interpret
because gas chromatography is only accurate to within about 5% and some of the trends
observed in these results had very minor differences, close to this error range. The fit
parameter in table 5.2, although many, were needed and sensible. The model could be
improved if it was made to be first order in methanol and oil but still second order
overall. This would put the maths beyond this authors ability but would remove the need
for the 2Cao fit parameter. The goodness of fit could also be improved by a better droplet
size expression than Misek’s equation or a more accurate surface tension vs conversion
correlation. The model is good at predicting the end result of the reaction.
This method shows that the reaction is always, both mass transfer limited and rate
limited, and that there is no need to split the data into different zones which have
different theories. This is a first which no-one else has observed. This theory can now be
used to show how conversion depends on the various reaction variables and to predict
how new reactor designs will behave.
5.5.5. Effect of mixing
Figure 5.16 shows the effect that different Reynolds numbers created by different
impeller speeds have on the conversion. The second order mass transfer limited theory is
a good fit to the results but evaporation of methanol has meant that the results are slightly
101
lower than predicted. Strong mixing was required which mean that a sealed vessel
couldn’t be used in this experiment. The theory explains why Ma et al., 1999 observed
that “impeller speed does not affect conversion.” Impeller speed does affect conversion
but there must be excessive mixing in order to see a difference within the experimental
error of all the equipment. Note that the theory predicts 96.5% conversion after one hour
at 4000 Re, which is very strong mixing beyond most commercial biodiesel reactors. For
a low viscosity ratio fluid such as this, the shear rate required for breakage is so large that
droplet breakage only occurs in the impeller region (Olivera et al., 2007). Therefore a
new highly mixed reactor is needed. One limitation of the theory on this graph is that the
Misek equation of droplet size does not take into account settling which will increase
droplet coalescence at the lower Reynolds numbers. Therefore the theory will mistakenly
show higher ester content than the data at the lower Reynolds numbers. The R2 value is
low (0.32). This low value shows the poor quality of the results therefore more data must
be obtained before any proper conclusions can be made here.
102
Figure 5.16 Effect of Reynolds number from changing speed on ester content. Reaction conditions 55°C, 6:1 mole ratio, 1 hour batch reaction. Data points are
experimental results line is theory line for comparison. 5.5.6. Effect of temperature
Now the Arrhenius’ equation can be used to calculate the dependence of rate upon
temperature and make predictions of reaction rate at higher temperatures. Using
Noureddini and Zhu’s data (1997) for conversion vs time at different temperatures a
graph can be drawn of Ln(k) vs. 1/T which exhibits a straight line. The gradient of this
straight line is equal to –E/R where R is the ideal gas constant. Once the constants ko and
E have been calculated, rate constants at different temperatures can be generated. For the
mass transfer limited second order theory Figure 5.17 shows how these new rate
constants work at the different temperatures used in the Noureddini data. Noureddini
himself noted that “the effects of temperature look a lot like the effects of impeller speed”
103
this is because the terms that are affected are in the same place in the overall rate
equation.
Figure 5.17 Reaction conversion vs. time curves at different temperatures. Reaction conditions 6:1 mole ratio, 3100Re. Data points are experimental results lines are
theory lines for comparison.
Temperature affects viscosity which would affect Reynolds number, but this is not taken
into account in the Misek equation for droplet size. Therefore there could be deviations
from this theory that could be solved by using a better equation for droplet size which
includes a viscosity term. However the theory clearly holds up even without this. The R2
values for the curves are 0.82, 0.98 and 0.8 for the 70ºC, 50ºC and 30ºC lines
respectively. The initial difference between theory and data points for the 30 ºC data
maybe due to mono and di-glyceride formation and settling. Often at insufficient
104
impeller speeds or poor vessel configurations the methanol reactant can stay floating on
top of the oil and the impeller will only suck down a few droplets at a time until the
reaction has progressed to the extent that the viscosity and interfacial tension is lowered
enough to fully disperse the methanol reactant. This has the effect of artificially delaying
the start of reaction.
5.5.7. Effect of methanol ratio
Increasing methanol ratio is the easiest way to increase conversion but also the most
expensive for commercial producers. The reason it is so effective is because there is
more oil than methanol, so increasing the methanol fraction directly increases the
interfacial area of the two phases (up to 50% v/v). The theory shows a fit to the
experimental results as shown in Figure 5.18. However the R2 value of -0.44 shows that
the fit is poor, worse than the mean of the results. This is because there is too much
scatter in the results and more data is needed before meaningful conclusions can be made.
Most commercial producers will not increase methanol ratio above 0.2 volume ratio
because it is not economical, therefore this is not a viable way of reaching standard.
Because the reaction takes an hour to complete, evaporation of methanol is an important
factor. A sealed or pressurised vessel would be an advantage because it would help
prevent evaporation over the course of reaction. It could also allow the use of higher
reaction temperatures.
105
Figure 5.18 Effect of methanol ratio on reaction conversion. Reaction conditions 55°C, 1 hour reaction, 175rpm. Data points are experimental results line is theory
line for comparison.
5.5.8. Effect of NaOH concentration
Another way to increase conversion is by using more NaOH catalyst. Boocock et al
(1996) stated that the reaction is dependant on the methoxide and oil concentration (not
methanol) therefore increasing the NaOH will push the methoxide forming reaction and
result in increased conversion. The results of increasing NaOH ratio are shown in Figure
5.19. The theory had to be changed to take into account methoxide concentration. The
theory line shown in Figure 5.19 was adapted to this new data set and a new equilibrium
constant was selected. The method was to assume that reaction was first order in both
methoxide and oil (2nd order overall) and to assume that the methoxide concentration was
proportional to NaOH. The theory matches the data in that it shows an increase in
106
conversion with increasing NaOH concentration. However the data shows a maximum
point followed by a fall in ester content. The reason for the drop is increased back
reaction in the washing process which may be a thermodynamic limitation. The R2 value
of the fit, not including the final point, is 0.53. Because of the high degree of error and
small differences in the results it is difficult to draw any strong conclusions. In addition
to the drop in conversion a reduction in yield was also noted with higher NaOH
concentrations. This has been noted by other authors and is put down to the NaOH
forming soap surfactants which emulsify the product biodiesel into the glycerol layer.
This clearly shows that there is an optimum NaOH ratio above which there is no further
benefit to increasing the NaOH concentration. The methanol ratio used in these results
was 0.5 volume ratio, much higher than usual, which is why the results are very high for
this batch reactor.
107
Figure 5.19 Effect of NaOH concentration on reaction conversion. Data points are experimental results line is theory line for comparison.
5.5.9. Waste oil Impurity results
Next waste oils were tested to see if impurities would affect the ester content. The G.C.
analysis of several failed Green Biodiesel samples is shown in Table 5.2. The Table
shows the magnitude of the problem where the average ester content was only 87.9%.
The Table shows that there are two problems preventing the samples reaching the
standard. When the ester, mono, di and tri-glyceride contents are all added together the
total does not reach 100%. This indicates that there is some impurity(s) which are not
esterifiable. The average total esterifiable matter of the samples was 93.4%. This leaves
an average 6.6% of unesterifiable impurities. The average sample also contained 5.3% of
unconverted but esterifiable material due to incomplete reaction. Both of these problems
108
(incomplete reaction and impurities) cause biodiesel to fail EN14214 and are of equal
importance for the purpose of reaching the standard from used cooking oil.
slightly lower than with normal reactants. However it was noted in the results for NaOH
concentration that there is a limit to the gains which can be made by adding surface active
chemicals to the reaction. The down stream clean up is made less efficient and yield of
biodiesel is sacrificed to the glycerol waste.
5.6.4. Optimisation of mixing
Of all the different variables the most promising is the mixing intensity. Figure 5.16
predicts that 96.5% ester is possible through increased mixing alone. Increasing the
mixing will make the reaction progress faster and limit the evaporation of methanol
ensuring smaller droplets at the tail end of reaction. Increasing the mixing energy is the
cheapest and most effective way of increasing reaction conversion and product quality.
However in most industrial biodiesel reactors the tank and impeller sizes are such that it
would be impossible to achieve sufficient turbulence. Therefore we must reduce the
reactor size. The only way to reduce the reactor size yet still maintain high throughput is
to use a flow reactor.
For a low viscosity ratio fluids such as the biodiesel reaction, the shear rate required for
breakage is so large that droplet breakage only occurs in the impeller region (Olivera et
al., 2007). Therefore the reaction only occurs in the impeller region. This means that, in
addition to strong mixing, we need a reactor where the mixing region covers the entire
reactor so as to prevent dead zones. Therefore a new continuous flow reactor is needed
113
which has strong mixing throughout. In a batch reactor the reaction may have a long
residence time but if properly mixed in a flow reactor the residence time could be greatly
reduced. It is a fast reaction but only seems slow because the wrong reaction conditions
were being used. This shorter residence time could lead to shorter required reactor
lengths.
Plug flow reactors are not unusual in the petrochemical industry. In large scale chemical
plant almost all reactions are done in flow reactors. In refineries all the catalytic
reactions are done in plug flow reactors. Reactions such as fluidic catalytic cracking,
hydrotreating, hydrodesulphurisation and reforming are all done in plug flow reactors.
Biodiesel should be done in a similar way.
5.7. Conclusions
The biodiesel reaction was studied using optical microscopy to measure droplet size
during reaction. The droplet size was observed to initially decrease and then increase
which correlated with the creation of surface active intermediary’s and then the
consumption and evaporation of methanol. This observation was seen to explain the
slow-fast-slow nature which limits the biodiesel reaction. For the first time both mass
transfer and reaction rate were show to be liming conversion throughout the reaction. For
the first time a numerical theory was developed which seemed to fit the data under the
limitations of the study (non-pressurized, two phase, batch reactor). Predictions were
made about ester content against different variables which were tested and found to agree
114
with the theory. With waste cooking oil, feed impurities were found to be as important as
reaction mechanism for determining ester content. Mass spectroscopy identified these
waste oil impurities as dimers which can only be removed by distillation. Increasing the
mixing intensity was identified as the best way of increasing conversion. A new
continuous reactor was needed with stronger mixing throughout its volume. This reactor
will be described in the next chapter.
115
CHAPTER 6
BIODIESEL CONTINUOUS REACTORS
6.1. Introduction
A plug flow reactor is like a string of individual batch reactors set up along a pipe, so one
might expect that the same residence time is needed in a plug flow reactor as in a batch
system. Therefore a simple pipe reactor would need to be extremely long to give both the
necessary residence time and maintain turbulent flow to prevent back-mixing. However
by packing the pipe with mixing elements turbulent flow can be achieved at much lower
flow rates, thus reducing the length of reactor. Since the reaction is mass transfer limited
the greater mixing that this offers may actually reduce the residence time needed,
compared to the poor mixing achieved in a batch reactor, a double benefit.
This Chapter looks at two different continuous reactor designs that use different strategies
to reach 96.5% conversion. One reactor uses long residence times whilst the other
reactor uses strong mixing. Both have the potential to reach 96.5% conversion so a
process and economic comparison is needed.
116
6.2. Theory
6.2.2. Conversion dependence on flow properties
To understand what is happening inside the reactor, the reaction and reactor must first be
studied separately. Chapter 4 dealt with the reaction kinetics which was found to be
second order and dependant on interfacial area. Now this Chapter examines reactor
design and performance. Real reactors are never completely mixed flow (Equation 6.2)
or completely plug flow (Equation 6.1), always a mixture of both flow properties
(Equation 6.3). Equation 6.1 is the equation for conversion of a second order reaction in
an ideal plug flow reactor. Equation 6.2 is the equation for conversion of a second order
reaction in a single ideal mixed flow reactor. Equation 6.3 is the equation for conversion
of a second order reaction in a series of ideal mixed flow reactors. These three equations
are all derived from first principles (non-empirical) and are limited because their
parameters are not supposed to change during reaction.
+
−=KtC
Xa
a01
11
Equation 6.1
Ideal plug flow second order reaction conversion.
++−−=
KtCKtC
Xa
aa
0
0
2411
1
Equation 6.2
Ideal mixed flow second order reaction conversion.
117
Equation 6.3
Tanks in series second order reaction conversion (Levenspiel, 1999).
6.2.3. Residence time distribution (RTD)
A residence time distribution will reveal the flow regime inside the reactor. The RTD is
a simple stimulus response experiment used to find the residence times of fluid elements
through the reactor. Once reactor flow properties and reaction kinetics are known then
predictions of reactor conversion can be made using either of equations 6.1, 6.2 or 6.3.
These predictions are shown later in the theory lines that accompany the results. The best
stimulus response experiment is the pulse method, where a pulse of non-reactive tracer is
injected into the flow and its concentration measured against time after the reactor. The
shape of the exit tracer curve shows the residence time distribution which reveals what
happens inside the reactor. An ideal pulse is a square peak but in reality the pulse is more
irregular. With irregular peeks the tracer concentration must be measured in real-time
both before and after the reactor and then the peak differences when superimposed gives
an RTD curve which tells what happens inside the reactor. To find out what is occurring
inside the reactor a model has to be applied to the input output tracer peaks. The simplest
model is the tanks in series model where the flow through the reactor is approximated to
several tanks in series, the more tanks N the closer the reactor is to plug flow. Equation
6.4 shows the number of tanks calculation where σ is the peak variance and t¯ is the peak
mean average residence time. This can be used to find out which flow equation is the
118
correct assumption or to calculate the number of tanks N for use in the tanks in series
flow model.
( )( )2
2
ϕ∆∆
=tN
Equation 6.4
Number of tanks calculation (Levenspiel, 1999).
Another more accurate but more complicated method is to use Laplace transforms to
subtract the input tracer curve from the output tracer curve to find the true reactor RTD.
It can then be easily judged which model best fits the reactor RTD curve -tanks in series,
convection model or compartment model. For this system the tanks in series model was
chosen because it is a good approximation and is simple to use.
6.2.4. Power of mixing in stirred tanks
To compare the reactors there must be some fair basis for comparison. Pressure drop or
stirrer speed can’t be compared because the reactor configurations are too different. The
pipe reactor has no stirrer but a high pressure drop where as the 7 tanks reactor has a
strong stirrer and negligible pressure drop. The fairest way to compare reactors is mixing
energy used per volume of fluid.
119
Mixing power used in a stirred tank can be expressed as Equation 6.5. The power
number is Po, impeller power is Pw, impeller speed is N and impeller diameter is D. For
fully baffled vessels, Po can be correlated with Reynolds number using Figure 6.1.
53dnPP w
o ρ=
Equation 6.5
Definition of power number.
In a stirred tank there is a Reynolds number power number relationship (see Figure 6.1)
which can be used with this equation 6.5 to calculate the mixing power if the stirrer
speed, impeller diameter and Reynolds number are known. This relationship can be used
to estimate the rate of mixing in the 7 tank continuous reactor. The flow in a stirred tank
is laminar at Reynolds number <10, transitional<100,000 and fully turbulent above
100,000 (Harnby et al., 1985). In our reactor Figure 6.1 shows that the power number Po
is approximately 4.2 over the whole range of Re numbers used.
120
Figure 6.1. Reynolds number power number relationship for various impellers. Adapted from Harnby et al., 1985.
6.2.5. Power of mixing in pipes
Mixing power used in a pipe reactor is simply the product of pressure drop (ΔP) and flow
rate Q (Equation 6.6).
PQPw ∆×= Equation 6.6
Power in a static mixer
121
The mixing in a static mixer is generated hydraulically and is dependent on flow rate.
The energy dissipation in static mixers can be described reasonably well by the friction
factor concept used for flow in pipes. This can be combined with Darcy’s friction factor
law to yield equation 6.7 which describes the energy dissipation as a function of other
detailed parameters in a static mixer. This shows that the pipe diameter is a very
influential factor which will be important in scale up of a biodiesel pipe reactor. In a
static mixer the equation for Reynolds number is the same as for in a regular pipe, but the
boundaries for laminar and turbulent flow are different, for example a Reynolds number
in a Kenics mixer is laminar<100 transitional<1000 and turbulent at 1000 and above.
θπ 7
33
24
dQf D
=Φ
Equation 6.7
Design equation for a static mixer. Where Ф is energy dissipation, fD is Darcy’s friction factor, Q is flow rate, d is pipe diameter and θ is mixer voidage.
LPVρ
ε ∆=
Equation 6.8
Energy dissipation rate in a pipe equation. Where ε is energy dissipation rate, ΔP is pressure drop, L is length of pipe and V is velocity.
122
6.2.6. Droplet size theory
Droplet break-up occurs when the cohesive forces are smaller than local shear forces
exerted by the surrounding fluid. This interaction can be characterized by the Weber
number equation 6.9, which is defined by the ratio of fluid inertial to superficial forces.
0dWe σ
τ=
Equation 6.9
Definition of Weber number. Where τ is the shear stress, and d0 is droplet diameter.
Turbulent motion can be considered to be a superposition of different sized velocity
fluctuations. Kolmogorov (Harnby et al., 1985) argued that, for large Reynolds numbers,
the smaller eddies are independent of bulk flow and mixer geometry. The largest eddies
are the size of the mixer and hold the most energy which gets cascaded down to
numerous smaller eddies which hold less energy. Eventually the energy is dissipated as
heat in the smallest eddies by viscous forces. These smallest eddies are said to be of the
Kolmogorov length scale. The Reynolds number is the balance between inertial and
viscous forces and at the Kolmogorov length scale Re=1 (Harnby et al., 1985). From
dimensional reasoning, the Kolmogorov length scale is defined in Equation 6.10. where
ν is the kinematic viscosity and ε is the energy dissipation rate.
123
41
3
=
εν
kL
Equation 6.10
Kolmogoroff’s length scale.
6.3. Previous results
6.3.2. Droplet size equations
Prince and Blanch (1990) used a droplet column to investigate droplet collisions arising
from turbulence, buoyancy and laminar shear flows. They assume the predominant cause
of collisions in turbulent systems are turbulent eddies and used Kolmogoroff’s theory to
estimate the collision rates and contact times. Eddies of the inertial sub-range are
considered to be responsible for the random motion of droplets, as those smaller than the
droplet length contain insufficient energy to affect droplet motion, whilst those much
larger will transport groups of droplets with little relative motion.
Alves et al (2002) investigated local bubble size in a dual turbine stirred tank and used a
similar relationship to that developed by Hinze for liquid-liquid dispersions see equation
6.10. Hinze’s equation can be used to predicted droplet size assuming D32 α dmax. Where
ε is the impeller power per unit mass, σ is the interfacial tension dmax is the maximum
stable droplet size and D32 is the droplet sauter mean diameter. This equation was used to
make the theory line for the pipe reactor graphs in this thesis. Alves et al concluded that
the bubble size in stirred tanks could be correlated using the following equation
124
(Equation 6.12). Where β is –0.14 to –0.24, Pg is aerated turbine power, V is liquid
volume, C” is a constant and the equation is only valid for non-coalescing liquids.
However the same equation has been proven to work for liquids-liquid solutions with
some coalescence by Pacek et al (1998).
525
3
max−
∝ ε
ρσd
Equation 6.11
Hinze equation (1955) bubble size in turbulent flow.
β
=
vp
cD g,,32
Equation 6.12
Alves equation (2002) bubble size in stirred tanks.
Calabrese, et al (1986) tested many theories for the influence of viscosity and surface
tension on droplet size in their paper on drop size in turbulent stirred tanks. The most
relevant of which are equations 6.13 and 6.14. Where We is the Weber number, A is the
interfacial area, Re is the Reynolds number, μd is the viscosity of the dispersed phase, μc
is the viscosity of the continuous phase.
125
Equation 6.13
Influence of viscosity and surface tension on droplet size in turbulent stirred tanks (Calabrese et al, 1986).
Equation 6.14
Influence of viscosity and surface tension on droplet size in turbulent stirred tanks (Calabrese et al, 1986).
Song and Han (2005) used computer modelling (CFD), dimensional analysis and
graphical analysis to develop a pressure drop correlation for Kenics static mixers which
covered both laminar and turbulent conditions. They found that the aspect ratio, AR
(length of mixing element/diameter) was of particular importance to the friction factor
and hence the pressure drop, especially at high Reynolds numbers. Their results showed
that above Reynolds numbers of 100 lower AR ratio elements gave higher friction factors
and pressure drops. They produced a correlation for the friction factor which covered all
Reynolds numbers but has different constants for laminar, transitional and turbulent
regions (as shown in Table 6.1.) Where Cf is the friction factor, AR is the aspect ratio, K
is a constant from the table, Re is Reynolds number and n is number of mixer elements.
126
( )nf ARKARC 15.204.2 Re=
Equation 6.15
Song and Han’s equation of friction factor in Kenics static mixers (2005)
Re/AR2.15= 0-100 100-1000 1000-∞
K= 320 32 2.66
n= -0.86 -0.36 0
Table 6.1. Constants for Song and Han’s equation of friction factor in Kenics static mixers (2005)
6.3.3. Biodiesel continuous reactor background
Dubé et al (2007) took advantage of the solution properties of
methanol/triglyceride/methylester system to create a membrane reactor. Large excess
methanol volumes were used to wash the reacted biodiesel and glycerol through a
membrane leaving the insoluble triglyceride behind for further reaction. The main
problem was that large volumes of methanol were needed, several litres to react just 100g
of oil and over a process time of 6 hours making it far from commercial.
Leevijit et al (2007) recently used a multi-tank reactor design similar to the one used in
this thesis. He claimed to be able to reach 99% conversion with a 12 minute residence
time. The reactor volume was 2.2 litres and the operating conditions for optimum
127
conversion and yield were 17.3 litres/hour, 0.6 Watts/m3, 6 minutes residence time, 200
rpm impeller speed. Their results show an optimum stirrer speed above which the
reaction was slowed by increased mixing speed, but no scientific explanation was offered
for this observation and the decrease was within experimental error for the measurement
technique. A non standard thin layer chromatography method was used to measure ester
content which is not that stated in EN14214 specification.
Harvey et al., (2003) used an oscillatory plug flow reactor with 8 theoretical tanks in
series to produce biodiesel that meet the standards for mono, di and tri-glycerides.
However there was little in house testing of fuel and no graphs of ester content published.
The residence times were between 10 – 30 minutes and optimisation is on going.
Noureddini et al (1998) identified mixing as a key concern that has not been fully
addressed. He tested both high shear and static mixer continuous reactors. His results
showed that the variation in mixing between 0-1000 rpm gave a difference of about 10 %
conversion. He used a 2 litre reactor with flow rates of 18 litres/hour. As with the
Leevijit results the conversion was found to decline after an optimum impeller speed but
at the much higher speed of 2000 rpm and by a significant amount. Only a confused
scientific explanation was offered for this observation. No sample neutralisation or
quenching method was mentioned to stop reaction and so samples could have reacted
further outside the reactor. The static mixer was proved to give higher conversion than
the high shear mixer.
128
It is clear from this discussion that the question of how a continuous flow reactor should
be set up has not been fully answered. Therefore, experiments were designed to
distinguish two types of reactor; one made from continuous pipe containing static
mixers; the other from a series of stirred tanks.
6.4. Experimental
6.4.2. RTD measurement method
The two reactors studied in this Chapter are shown in Figures 6.2. and Figure 6.3. One is
a pipe reactor 5.4 m long, 10 mm internal diameter, 300 ml void volume and filled with
3.5 m of evenly spaced Kenics static mixer elements. The other is made up of 7 tanks
stacked on top of each other with a central impeller running down the middle. The tanks
are 140 mm internal diameter and 70 mm high with a liquid volume of 2.9 litres. The
reactants move from tank to tank by an over flowing weir mechanism flowing from top to
bottom which prevents back mixing. Both reactors were installed with taps along the
reactor length so that samples could be extracted mid reactor to see the progress of the
reaction through out its length.
129
Figure 6.2. Tanks in series reactor equipment diagram.
130
Figure 6.3. Pipe reactor equipment diagram.
The experimental set-up used for the RTD measurements is shown in Figure 6.4. Nitric
acid was manually injected into the pipe before a small static mixer and several diameters
before the input conductivity meter. Mains water was pumped at a constant flow rate
through the reactor and past two conductivity meters. The length of empty straight pipe
upstream of the reactor test section was always greater than 50 diameters.
131
Figure 6.4. Residence time distribution experimental setup.
The conductivity probes consisted of two platinum wires coated with black, amorphous
platinum, between which the conductivity was measured. The volume of the
measurement coil was of the order of 0.1 ml. The conductivity probes gave a response
which was linearly related to concentration. To check the quality of the inlet pulse, and
thereby allow correction of the outlet response curves, a probe was positioned before the
mixer. The RTD tracer method was performed at a variety of different flow rates and
impeller speeds, to see what effect this had on the results. The RTD method used is
described in the theory section of this Chapter. The data acquisition card was supplied by
Texas instruments and software was custom made at the University of Birmingham using
Lab View software. The software took 20 conductivity measurements per second,
logged and displayed them on screen for both conductivity meters.
The purpose of the experiments was to test the ester content of the biodiesel produced by
different continuous reactor configurations, flow rates and mixing intensities. Two
continuous reactor configurations were tested, a pipe reactor and a tanks in series reactor.
The sodium methoxide reactant was prepared before the experiment, the oil was heated to
70 ºC and then temperature equalised with the water bath prior to use. The reactants were
pumped by peristaltic pumps and initially mixed by injection nozzle followed by a short
static mixer section before the reactor. In the reactor the temperature was automatically
controlled by a hot water bath thermostat. Temperature was measured by both K-type
thermocouples and checked using an infra-red thermometer. The pressure drop in the
reactor was measured by a pressure gauge. Flow rate was set by calibration of the
peristaltic pump revolutions with flow rate measurements and the pump revolutions were
closely monitored during experiment to account for load variations. For each reactor
steady state was obtained by waiting for 5 reactor volumes to flow through before
samples were taken. The flow rates ranged from one reactor volume per hour (similar to
batch) down to one volume per 5 minutes.
133
Figure 6.5. Continuous reactor test rig.
Samples taken from the reactors were chilled with ice water and quenched with acidic
ion-exchange resin to stop the reaction then centrifuged to remove the glycerol. Reacted
biodiesel samples were washed three times by shake mixing with water in centrifuge
tubes followed by centrifugation to separate. The test for ester content used in the
EN14214 standard uses an internal standard gas chromatography method which was
described in Chapter 5.5.1.
134
6.5. Results
6.5.2. Modeling reaction conversion
A theory can be developed for modelling pipe reactors in the same way that the
successful theory was developed for the batch reactor. A droplet size equation and a
design equation for conversion can be put together and integrated to account for changing
interfacial-tension along the reactor length. For the pipe reactor, the design equation 6.1
was selected and modified to include a surface area term. The Misek equation that was
used in chapter 5 batch theory equation, refered to tank size dimension and so cannot be
used for coutinuous pipe reactor theory. Instead Hinze equation 6.11 can be used because
it refers to only interfacial-tension and energy dissipation rate. The Hinze equation can
supply the droplet size and thus surface area term for the design equation. Interfacial
tension for the Hinze equation must be calculated using the empirical correlation
developed in chapter 5 in Table 5.2 and Figure 5.14. In the case of the pipe mixer the
enclosed pipe, high pressure and fast reaction ensure that no methanol evaporates so the
no evaporation correlation on Figure 5.14 is selected. The energy dissipation rate (ε) for
the Hinze equation can be calculated using equation 6.8 which is generic for all pipe
flow. When all these equations are put together the result is equation 6.16 which can be
used to predict conversion in a pipe reactor.
This model assumes that there is no back mixing, no evaporation and it assumes that the
surface tension follows the correlation described in Figure 5.14. The second order plug
flow reactor design equation was selected because it was the simplest equation that could
represent our reaction system -second order, plug flow reactor. It is a physical equation,
135
not empirical and it was found in a respected book (Levenspiel, 1999). It is limited
because the equation was designed to predict conversion from an initial set of parameters
that are not supposed to change in reaction, therefore our model needs to be integrated
over the reaction to compensate for the changes at each time step during the reaction.
The fit parameters are shown in table 6.2. The model could be improved if it was made
to be first order in methanol and oil but still second order overall. This would put the
maths beyond this author’s ability but would remove the need for the 2Cao fit parameter.
The goodness of fit could also be improved by a better or a more accurate surface tension
vs conversion correlation. The model is used in graphs 6.10 – 6.14 to predict the theory
lines for comparison with results.
Equation 6.16. Proposed biodiesel conversion equation, for two phase biodiesel reaction in a continuous pipe reactor. where ΔP is pressure drop, L is reactor
length and v is velocity. It is clear that the equation is made from connecting Hinze equation 6.11 with ideal plug flow reactor equation 6.1 and energy dissipation rate equation 6.8. This is the theory used in the theory lines of Figures 6.10 and 6.11.
( )
∆××∑×+
−=−− 6.05478.04.0
0005.010
1000/61
11
c
a
creactor
meohao
a
CL
PvVVkC
X
ρρ
136
Fit parameters Value used
K 0.3 σ 5478.00005.0 −
aC
Cao 2Cao
Table 6.2 Parameters used to fit equation model to data. K value was arrived upon from figure 5.13 and visual least squares method, σ
The same thing can be done for a continuous tanks-in-series reactor as it was for batch
reactors in chapter 5 and above for pipe reactors. A droplet size equation and a design
equation for conversion can be put together and iterated to account for changing
properties during reaction. For tanks in series the design equation to use is Equation 6.3
which is for ideal mixed flow in a tank reactor. The droplet size equation to use could be
either the Misek’s equation or Hinze Equation 6.11. In the end Misek’s equation was
selected because it was simpler and did not require a separate equation to find the energy
dissipation rate. To integrate the tanks in series reactor model the tanks can be calculated
individually, one after the other, and the results of one tank feed into the calculation for
the next. Just like in reality how the concentration of the tank before cascades in to the
next tank. This replaces the need to use Simons rule to integrate an equation over time or
length, because discrete reactor elements (tanks) can be calculated with changing
parameters through out the reactor. this removes that limitation.
This model assumes that there is no back mixing and it assumes that the surface tension
follows the correlation described in Figure 5.14 and shown in table 6.3. The second order
137
mixed flow reactor design equation was selected because it was the simplest equation that
could represent our reaction system -second order, mixed flow reactor. It is a physical
equation, not empirical and it was found in a respected book (Levenspiel, 1999). The fit
parameters are shown in table 6.3. The model could be improved if it was made to be
first order in methanol and oil but still second order overall. This would put the maths
beyond this author’s ability but would remove the need for the 2Cao fit parameter. The
goodness of fit could also be improved by a better or a more accurate surface tension vs
conversion correlation. The model is used in graph 6.7 to predict the theory lines for
comparison with results. An ideal plug flow theory line is also shown on figure 6.7 for
comparison and this uses the equation described in Equation 6.16.
138
( )
( )
++−
−=
−
−
i
reactorc
D
methi
i
reactorc
D
methi
i
k
Vdn
eDH
VC
k
Vdn
eDH
VC
X
τ
ρ
σ
τ
ρ
σ
22
087.046.01
22
087.046.01
3.16
62
3.16
6411
1
Equation 6.17 Proposed biodiesel conversion equation, for two phase biodiesel reaction in a continuous tanks-in-series reactor. Where σ is from the developed
empirical equation from table 5.2. This equation is iterative and uses concentration from previous reactor stage Ci-1. Τi is time in stage i, Xi is the conversion at stage i. It is clear that the equation is made from connecting misek equation 5.1 with ideal
mixed flow reactor equation 6.2. This is the theory used in the theory lines of Figure 6.7.
Fit parameters Value used
K 0.3 σ
Cao 2Cao
Table 6.3 Parameters used to fit equation model to data. K value was arrived upon from figure 5.13 and visual least squares method, σ
139
6.5.3. Tanks in series reactor
The first reactor to be tested was the tanks in series reactor. Before the reactor was used
to make biodiesel it was tested with RTD method to check its flow characteristics. This
allowed problems with the reactor to be diagnosed early before use with more
complicated biodiesel. Originally the reactor was slightly different but was re-designed
because of problems. The reactor was originally completely full and the flow between
tanks was achieved through small holes in the plates separating the tanks instead of weirs,
however this design meant that reactants could diffuse between tanks. The RTD tests for
this reactor indicated serious back mixing at the intended flow rates and the reactor had to
be altered. The redesigned reactor as shown in Figure 6.2 uses overflowing weirs to
eliminate the back mixing problem. Figure 6.6 shows the tracer curves before and after
the overflowing weir reactor. Using equation 6.4 to calculate the theoretical number of
tanks in series gives 5.8 tanks which is closer to plug flow. Several RTD’s were done at
different flow rates and impeller speeds to see how this affected the RTD. The results
showed no significant change in number of theoretical tanks with impeller speed or flow
rate, 0.1 tanks difference when impeller speed was doubled therefore the is no significant
back mixing and the mixing is not flow rate dependant.
140
Figure 6.6. Tracer curves for re-designed 7 tanks in series reactor. Blue dots are input signal and red dots are output signal. 3 litres/hour, 10ml of nitric acid tracer
200rpm impeller speed. The results from the biodiesel reaction in this reactor are shown in Figure 6.7, which
shows conversion vs. no of stages. The maximum impeller speed the motor could deliver
was 200 rpm. It was realised that with the same mixing as in the batch reactor the same
or better residence time would be needed. Therefore reaction conditions were set to be
the same as in the batch reactor. The theory lines for both ideal plug flow (Equation 6.1)
and for stirred tanks in series (Equation 6.3 or 6.2) are included on the graph and the
141
reaction conditions are written below. It is assumed for the theory lines that there is no
back mixing because of the results from the RTD experiments. It is assumed for the
theory lines that there is evaporation similar to in a batch reactor, because the residence
time and temperature is the same as in a batch reactor and the vessel was open to
atmosphere. The results roughly fit the tanks in series theory prediction and never reach
96.5% conversion. The R2 value of the fit is 0.76, which, despite the irregular final data
point, is fairly high. The high R2 value was because the differences in data points, due to
low conversions, was much higher than the error in the results. The theory predicts that
the reactor will reach 96.5% conversion if the impeller speed is increased to 400 rpm or
the residence time increased to 3.5 hours or the number of tanks is increased to 20. Work
with this reactor was stopped because the results were deemed to be worse than that of
the batch reactor and the design limited the experimental variables that could be tested.
These results seem to conflict with the results of Leevijit et al., 2007 who claimed to
reach 96.5% conversion using residence times of only 12 minutes at only 100 rpm with
six series stirred tanks in series. This casts doubt on the accuracy of the Leevijit results
and it may be down to their non standard ester measurement technique.
142
Figure 6.7. Effect of number of tanks in stirred tanks in series reactor. 3 litres/hour, 200rpm impeller speed, 55°C, 1:4 methanol:oil volume ratio. Data points are experimental results lines are theory for comparison developed from
chapter 6.5.2.
6.5.4. Pipe reactor results
The static mixer pipe reactor was tested with RTD and the results are shown in Figure
5.8 which shows the tracer curves before and after the pipe reactor. For this reactor the
tanks in series approximation (Equation 6.4) shows 67.8 theoretical tanks in series, a
good approximation to plug flow. Various different flow rates were tested with RTD but
the flow was always a good approximation to plug flow so equation 6.1 can be safely
used for graph theory lines.
143
Figure 6.8. Tracer curve for the pipe reactor same scale as for 7 tank reactor. Blue dots are input signal and red dots are output signal. 17.8 litres/hour, 1ml nitric acid
tracer.
Initial results with the pipe reactor were promising and the residence time needed seemed
small. Evaporation of methanol would not be a factor because at these faster reaction
times the reaction would consume methanol many times faster than evaporation.
Therefore the power law correlation devised in Chapter 5 Figure 5.14 for the no
evaporation assumption was used in the theory lines for this reactor. The relationship
between pressure drop and flow rate in the pipe reactor was measured and the results are
plotted in Figure 6.9. The results can be seen to follow the Bernoulli equation. these
144
results were used in the theory lines for the pipe reactor. The pressure drop was assumed
to be a linear correlation to the reactor length for the theory lines.
Figure 6.9. Pressure drop vs. flow rate correlation for the pipe reactor.
The effect of flow rate in the pipe reactor is shown in Figure 6.10. The results exceed a
conversion of 96.5% conversion over a range of flow rates, a result which few authors
have managed to achieve. The results over this flow rate range can be compared with the
theory line to show that the theory developed in Chapter 5 using low intensity batch
reactors can be modified for use in the strongly mixed pipe reactor geometry. If the
theory is valid for both of these different geometries then it this is further proof of its
validity. The R2 value of the fit is 0.92, this is very good considering the small
differences between results. Theory lines predicting biodiesel reaction conversion have
not been published before. In the pipe reactor the flow rate will affect the reaction
145
conversion in two ways, it will reduce residence time but it will increase mixing intensity.
These two effects on conversion work against each other but residence time seems to be
the limiting factor because it goes down. No optimum mixing speed was identified and
decreases in ester content were solely due to reduction in residence times. The second
order changing interfacial tension theory is closest to the actual results. Theory predicts
that this reactor will no longer produce to 96.5% standard when the flow rate is increased
to 40 litres per hour and the result would seem to agree with that. The theory may not be
accurate at very low flow rates because gravitational settling and agglomeration would
lead to phase separation which the theory does not take into account. At zero flow rate
the conversion should also be zero but soon after this, the conversion should increase to
where the theory lines are set.
146
Figure 6.10. Effect of flow rate on conversion in pipe reactor. temperature 55 °C, 1:4 methanol:oil volume ratio, 5.4m reactor length. Data points are experimental
results lines are theory for comparison developed from chapter 6.5.2.
The results for pipe reactor length vs. conversion are shown in Figure 6.11. These results
show just how effective the static mixers are at mixing and converting the reactants. The
96.5% conversion is reached within the first metre of the reactor. The remaining length
of reactor is not seen to increasing the conversion much further and only serves to
increase the pressure drop. The results show this reactor could be optimised by reducing
its length and hence reducing the pressure drop. The results roughly agree with the
theory which shows that the standard should be meet with a 2 metre reactor length.
Discrepancies between results and theory could be because of the difficulties involved in
extracting samples mid reactor which give extra time for reaction, even if only a few
seconds and experimental error. The second order changing interfacial tension theory is
again the closest to the actual results. The R2 value of the fit was -8.9 which means that a
147
straight horizontal line through the results would be a better fit. However the second
order changing interfacial tension theory is the very close to a straight horizontal line in
the region of the data points, closer than other the theories, so the R2 value is deceptive.
Also with the high conversions obtained leading to small differences between results well
within the 5% G.C. error.
Figure 6.11. Effect of reactor length on conversion in pipe reactor. 17.9litres/hour flow rate, 55 °C, 1:4 methanol:oil volume ratio. Data points are experimental results lines are theory for comparison developed from chapter 6.5.2. Black triangles are washed samples blue diamonds are same samples before wash.
148
The effect of temperature on the conversion in the pipe reactor is shown in Figure 6.12.
The results roughly agree with theory. The theory predicts that around temperatures of
40 °C are needed in the reactor to reach the standard 96.5% conversion. The actual
results showed the correct trend but the conversions were slightly higher than predicted.
This may be due to experimental or measurement error. These results show that
temperature is not as important as other variables such as flow rate or reactor length and
that the reaction could be done at room temperature with a longer reactor.
Figure 6.12. Effect of temperature on conversion in pipe reactor. 17.9litres/hour flow rate, 5.4m length, 1:4 methanol:oil volume ratio. Data points are experimental results line is theory for comparison developed from chapter 6.5.2. Black triangles
are washed samples blue diamonds are same samples before wash.
149
The effect of methanol concentration on the biodiesel conversion is shown in Figure
6.13. The results predict how much methanol is needed to reach the standard 96.5%
conversion under the stated reaction conditions. Since methanol is an expensive raw
material most biodiesel producers would like to minimise its use. The industrial standard
methanol ratio is 0.2 volume ratio. With the strong mixing of the pipe reactor it was
conceivable that less methanol might be necessary. When this graph is compared to the
batch reactor graph (Figure 5.18) this is shown to be true, although 0.2 volume ratio is
still needed to reach the 96.5% standard even with the enhanced mixing. Without the
enhanced mixing it was not possible to reach the standard unless 0.4 volume ratio was
used. This graph, with its enhanced mixing, is probably close to the limit set by the
thermodynamic equilibrium. This graph confirms that the industrial standard is very
close to the optimum ratio. Some industrial biodiesel producers have inadequate reactors
and compensate by using extra methanol to increase interfacial area, with this reactor it is
not necessary. The theory lines shown assume plug flow and no evaporation of
methanol.
150
Figure 6.13. Effect of methanol ratio on conversion in pipe reactor. 17.9litres/hour flow rate, 5.4m length, 55 °C. Line is theory prediction of results.
The effect of NaOH concentration on the biodiesel conversion is shown in Figure 6.14.
The results show how much NaOH is needed to reach the standard 96.5% conversion
under the stated reaction conditions. Since excess NaOH reduces yield by emulsifying
the product biodiesel into the waste glycerol, most biodiesel producers would like to
minimise its use. In industry between 0.35% -1% (m/m) NaOH is used. With the strong
mixing of the pipe reactor it was conceivable that less NaOH might be necessary. This
graph shows that this is not the case, the same amount of NaOH is needed but with the
pipe reactor it is now possible to reach the standard using this amount. The data shows a
maximum point followed by a fall in ester content with the washed sample results but not
with the unwashed results. The reason for the drop is increased back reaction in the
151
washing process which may be a thermodynamic limitation. The maximum is in the
same place as compared to the results from the batch reactor graph Figure 5.19 which
would confirm that this is a thermodynamic limitation. Any other comparisons between
the two graphs are difficult because of the high methanol ratio used in the batch reactor
results.
Figure 6.14. Effect of catalyst concentration on conversion in pipe reactor. 17.9litres/hour flow rate, 55°C, 1:4 methanol:oil volume ratio, 5.4m length. Data points are experimental results line is theory for comparison. Black triangles are
washed samples blue diamonds are same samples before wash. High catalyst concentration causes side reaction in washing stage which was unpredicted by the
theory.
152
The energy used per litre of biodiesel produced is plotted in Figure 6.15 vs. the
conversion in the two reactors. The graph clearly shows that the pipe reactor is far
superior in conversion attained, but also in the minimum energy that is used. In the pipe
reactor the mixing occurs across the whole of the reactor diameter and nothing can by-
pass the mixing elements. In the tanks in series reactor, as in the batch reactor before it,
mixing only occurs in the impeller region. This has the effect of back mixing in a batch
reactor, the well mixed parts of the vessel will mix with parts of the vessel that are less
well mixed, and hence less well reacted, to ensure that higher conversion is not possible.
This also has the effect that a lot more total mixing is required in order to meet the
conversion required. This combined with the less ideal flow characteristics of the tanks
in series reactor mean that the tanks in series reactor requires a lot more mixing for the
same degree of conversion.
153
Figure 6.15. Energy used per litre of biodiesel produced vs. conversion in each reactor. 55°C, 1:4 methanol:oil volume ratio, other conditions differ due to
different reactor configurations.
6.6. Discussion
Any biodiesel reactor has to either have long residence times or strong mixing but those
which have long residence times must also eliminate the evaporation of methanol by
using sealed or pressurised reactors. High temperature also slightly helps in pressurised
reactors but it will cause problems if the methanol is free to evaporate in open to
atmosphere reactors. Evaporation in a pipe reactor still occurs but is much less of a
problem because of the high pressure and fast speed of reaction. In the pipe reactor the
evaporating gases had the effect of pushing the flow faster and reducing residence time.
154
The pipe reactor tested used strong mixing in the form of static mixers to achieve the
desired conversion quickly before evaporation could take place. The tanks in series
reactor was designed to work using long residence times but the initial linked tanks
design allowed back-mixing which contaminated the products with the reactants. Theory
suggests that the initial linked tanks design could work if flow rate were increased
enough that back mixing became insignificant and mixing were increased to allow the
reaction to reach completion in such a limited residence time. However the mixing and
flow rate required to reach conversion were beyond the means available for a reactor of
this diameter and a thinner and longer reactor with more stages would be needed. Thus
the ideal linked tanks reactor would be a pipe reactor. The overflowing weirs reactor was
an improvement because it eliminated back mixing and made flow rate independent from
the number of theoretical tanks in series. This meant that a long residence time could be
used with out back mixing problems and in theory the quality standard could be meet in
this reactor with sufficient mixing and residence time assuming that evaporation of
methanol could be minimised. Overall the best design was easily the static mixer pipe
reactor because less mixing energy was used per litre of fluid reacted and because its
control and manufacture is so much easier. Using the pipe reactor in conjunction with an
input/output heat exchanger could result in considerable energy cost savings compared to
the batch reactor. However there could be problems with scale up due to the nature of
static mixers where as the over-flowing weirs tanks in series reactor would be easily
scaleable
155
6.7. Conclusion
This Chapter looked at two different continuous reactor designs that use different
strategies to reach 96.5% conversion. The tanks in series reactor used long residence
time, and the pipe reactor used strong mixing. The strongly mixed pipe reactor produced
biodiesel better than 96.5% quality. The tanks in series reactor failed to reach this
standard by a wide margin. The theory developed in Chapter 5, was proven to work well
in predicting the conversions in reactors of vastly different designs. Using this theory the
operating conditions necessary for reaching 96.5% conversion was predicted for both
reactors. Evaporation and back mixing were identified as important factors in long
residence time reactors. It was concluded that strongly mixed pipe reactor was superior
to the tanks in series design. This was because pipe reactor gave a better conversion, it
required less energy per unit of biodiesel produced, was closer to the ideal plug flow
model and was simpler to control. This new pipe reactor could help gain a better selling
price for the biodiesel product by increasing the fuel quality. Significant savings could
also be made on the energy bills because heat transfer could be easily implemented
making the fuel better for the environment.
156
CHAPTER 7
CONCLUSIONS AND FUTURE WORK
7.1. Conclusions
1. It is possible to produce significant improvements in biodiesel processing by the
methods described in this thesis;
a. By reforming the by-product glycerol with the waste water to hydrogen to
add value.
b. By enhancing the mass transfer to increase the purity of product ester.
c. By moving from a batch to a continuous esterification reactor.
2. The scientific conclusions.
Steam reforming conclusions
a. Thermodynamic calculations can be used to predict steam reforming
conversion but there are some discrepancies.
b. A SOFC will run on glycerol and biodiesel by-product.
c. Catalyst life is reduced with by-product glycerol because of the longer
carbon chains in the contamination.
d. At high temperatures almost 100% gas yield was reached and selectivities
of up to 70% (dry basis) obtained
157
Reaction kinetic conclusions
a. Observations of droplet size were seen to explain the slow-fast-slow
nature which limits the biodiesel reaction. Droplet size was reduced then
increased, first by formation of surface active intermediaries then followed
by consumption of methanol by reaction and evaporation.
b. Both mass transfer and reaction rate were show to be liming conversion
throughout the reaction.
c. A numerical theory was developed which seemed to roughly fit the data in
the non-pressurized, two phase, batch reactor studied.
d. With waste cooking oil, dimer -feed impurities were found to be as
important as reaction mechanism for determining ester content. This often
made it impossible to reach 96.5% using used cooking oil.
Continuous reactor conclusions
a. The theory developed in Chapter 5, was adapted for a continuous reactor
and proven to work in predicting the conversion for the continuous
reactor.
b. Two strategies can be used to reach 96.5% conversion: long residence
time or strong mixing.
c. Evaporation is a problem for long residence time reactors and back mixing
is a problem for continuous reactors. Both problems can prevent the
biodiesel from reaching the EN14214 standard.
158
3. The economic benefits
a. Possible 4p/litre additional profit if on site steam reforming of waste
products is employed as opposed to paying for tanker waste disposal
services.
b. Possible extra profit of 2p/litre because increased purity of biodiesel will
generate a better selling price.
c. Possible 1p/litre energy saving because continuous process makes heat
exchange possible. This makes the fuel greener which could in future be
taken into account with RTFO subsidies or carbon credits.
d. Safe guarding the essential tax break by ensuring quality standards are
meet. The tax break is only given to biodiesel, which is defined by law as
fuel which meets the EN14214 standard.
e. Removing liability and risk from potential law suits arising from poor
quality fuel harming vehicles.
7.2. Recommended future work
This work is part of a bigger picture of biodiesel research. Other areas which need
further work are as follows.
159
1. The separation and purification stages need to be tested and optimized. There are
many options for biodiesel purification and they need to be selected, ordered and
tested to guarantee biodiesel passes all quality tests present in EN14214.
2. Scale up of continuous reactor. Scale up from 17 litres/hour to 1000 litres/hour is
needed to reach industrial scale demonstration. Issues involved would be:
a. Scale up of static mixer elements
b. Scale up of separation technology
3. Crop production methods and yields need to be optimised to biofuel production
instead of food production. How the biomass is produced is as important as how it is
converted if biodiesel is ever to be developed for wide spread use to combat climate
change. As the chemical conversion process are optimised so must the bio-oil
production process. This should involve bioreactors or genetically engineered energy
crops.
4. A heterogeneous catalyst should be developed for use in continuous reactor. A break
through in biodiesel heterogeneous catalysis would eliminate the need for many of
the downstream purification processes currently needed.
5. Discussion with larger petrochemical industries about the methanolysis process versus
other options such as hydrotreating of vegetable oils and blending with fossil fuel
oils.
160
References
ADEME, 2002. Energy and greenhouse gas balances of biofuels production chains in
France, Direction of Agriculture and Bioenergies of the French Environment and Energy
Management Agency and the French Direction of the Energy and Mineral Resources,
of Biodiesel Catalyzed by Solid Super Base of Calcium Oxide and Its Refining Process,
Chinese Journal of Catalysis, Volume 27, Issue 5, Pages 391-396.
179
Appendix
There have been several journal publications in connection with this work. These articles
are printed here in chronological order. The titles include Formulating liquid ethers for
microtubular SOFC’s, Steam reforming of biodiesel by-product to make renewable
hydrogen and Developing the reaction kinetics for a biodiesel reactor. The later paper
has been reviewed and accepted for publication in Bioresource Technology but the author
is awaiting proofs. The other papers are already published. The first paper was based on
research done by the author and data collected which was later not used in the thesis. The
other two papers are based on chapters of this thesis.
This author’s involvement for the first paper was only that of some limited data collection
and experimentation involving diesel engines. Kevin Kendall was the main author who
wrote the paper and John Precce was also involved in experimentation and data collection
with fuel cells.
For the steam reforming paper this author did all the work and was the main author. The
other named authors were only used to check formatting, grammar (Christian Mallon)
and checking mathematics (James Andrews).
For the Biodiesel kinetics paper this author did all the work and was the main author.
The other named author, Kevin Kendall, helped with structure and formatting.
180
184
191
DEVELOPING THE REACTION KINETICS FOR A BIODIESEL REACTOR
Matthew Slinn *, Kevin Kendall The school of Chemical Engineering, University of Birmingham B15 2TT, United Kingdom.
Abstract
The aim of this paper was to investigate the kinetics of the biodiesel reaction in order to find out how best to reach 96.5% methyl ester. The purity of the biodiesel product was examined using gas chromatography to the EN14214 FAME standard and real-time optical microscopy was used to observe the reaction. The problem was the reaction doesn’t reach completion and the mechanism is not understood. It was observed that droplet size had a major influence on reaction end point and that the reaction was mass-transfer limited. This observation was confirmed by developing a mass-transfer based reaction model using the data from the batch reactor which agreed with results from other researchers. The model predicted better conversion with more mixing intensity. The results show that significant improvements could be made to the conventional FAME process. Key words: Biodiesel, reactor, reaction, transesterification, theory.