Florida International University FIU Digital Commons FIU Electronic eses and Dissertations University Graduate School 7-24-2012 Improving Caches in Consolidated Environments Ricardo Koller Florida International University, rkoll001@fiu.edu DOI: 10.25148/etd.FI12080801 Follow this and additional works at: hp://digitalcommons.fiu.edu/etd is work is brought to you for free and open access by the University Graduate School at FIU Digital Commons. It has been accepted for inclusion in FIU Electronic eses and Dissertations by an authorized administrator of FIU Digital Commons. For more information, please contact dcc@fiu.edu. Recommended Citation Koller, Ricardo, "Improving Caches in Consolidated Environments" (2012). FIU Electronic eses and Dissertations. 708. hp://digitalcommons.fiu.edu/etd/708
Transcript
Florida International UniversityFIU Digital Commons
FIU Electronic Theses and Dissertations University Graduate School
7-24-2012
Improving Caches in Consolidated EnvironmentsRicardo KollerFlorida International University, [email protected]
DOI: 10.25148/etd.FI12080801Follow this and additional works at: http://digitalcommons.fiu.edu/etd
This work is brought to you for free and open access by the University Graduate School at FIU Digital Commons. It has been accepted for inclusion inFIU Electronic Theses and Dissertations by an authorized administrator of FIU Digital Commons. For more information, please contact [email protected].
Recommended CitationKoller, Ricardo, "Improving Caches in Consolidated Environments" (2012). FIU Electronic Theses and Dissertations. 708.http://digitalcommons.fiu.edu/etd/708
A dissertation submitted in partial fulfillment of the
requirements for the degree of
DOCTOR OF PHILOSOPHY
in
COMPUTER SCIENCE
by
Ricardo Koller
2012
To: Dean Amir MirmiranCollege of Engineering and Computing
This dissertation, written by Ricardo Koller, and entitled Improving Caches in Con-solidated Environments, having been approved in respect to style and intellectualcontent, is referred to you for judgment.
We have read this dissertation and recommend that it be approved.
3.1 Page cache hits for the web-vm (top), mail (middle), and homes (bot-tom) workloads. A single day trace was used with an infinite cacheassumption. . . . . . . . . . . . . . . . . . . . . . . . . . . . . . . . . 14
3.2 Contrasting content and sector reuse distances for the web-vm (top),mail (middle), and homes (bottom) workloads. . . . . . . . . . . . . 15
3.4 Data structure for the content-addressed cache. The cache is address-able by both sector and content-hash. vc entries are unique persector. Solid lines between vc entries indicate that they may havethe same content (they may not in case of hash function collisions.)Dotted lines form a link between a sector (vc entry) and a givenpage (vc page.) Note that some vc entries do not point to any page– there is no cached content for these entries. However, this indicatesthat the linked vc entries have the same data on disk. This happenswhen some of the pages are evicted from the cache. Additionally,pages form an LRU list. . . . . . . . . . . . . . . . . . . . . . . . . . 18
3.5 Per-day page cache hit ratio for content- and sector- addressed caches forread operations. The total number of pages read are 0.18, 2.3, and0.23 million respectively for the web-vm, mail and homes workloads.The numbers in the legend next to each type of addressing representthe cache size. . . . . . . . . . . . . . . . . . . . . . . . . . . . . . . 23
3.6 Comparison of ARC and LRU content-addressed caches for pages readonly (top) and pages read/write operations (bottom). A single daytrace (0.18 million page reads and 2.09 million page read/writes) ofthe web workload was used as the workload. . . . . . . . . . . . . . 24
3.7 Overhead of content and sector lookup operations with increasing sizeof the content-addressed cache. . . . . . . . . . . . . . . . . . . . . . 25
4.4 Working set sizes and wastage on multi-workload MRC. Curves a and bare the MRCs of the individual workloads and combined is the MRCof both a and b running together. The reuse set sizes (RSS) of a,b and combined are 155, 251 and 431 respectively. Notice how theRSS of combined is larger than the sum of a and b’s RSS. . . . . . . 40
x
4.5 Wastage with multiple workloads. Figure on top shows wastage in MBand figure at the bottom shows wastage as a percentage of the totalamount of cache: 100*W/RSSc, where W is wastage and RSSc is thereuse set size of the combined workload. Notice how wastage as apercentage increases linearly with the number of workloads . . . . . 42
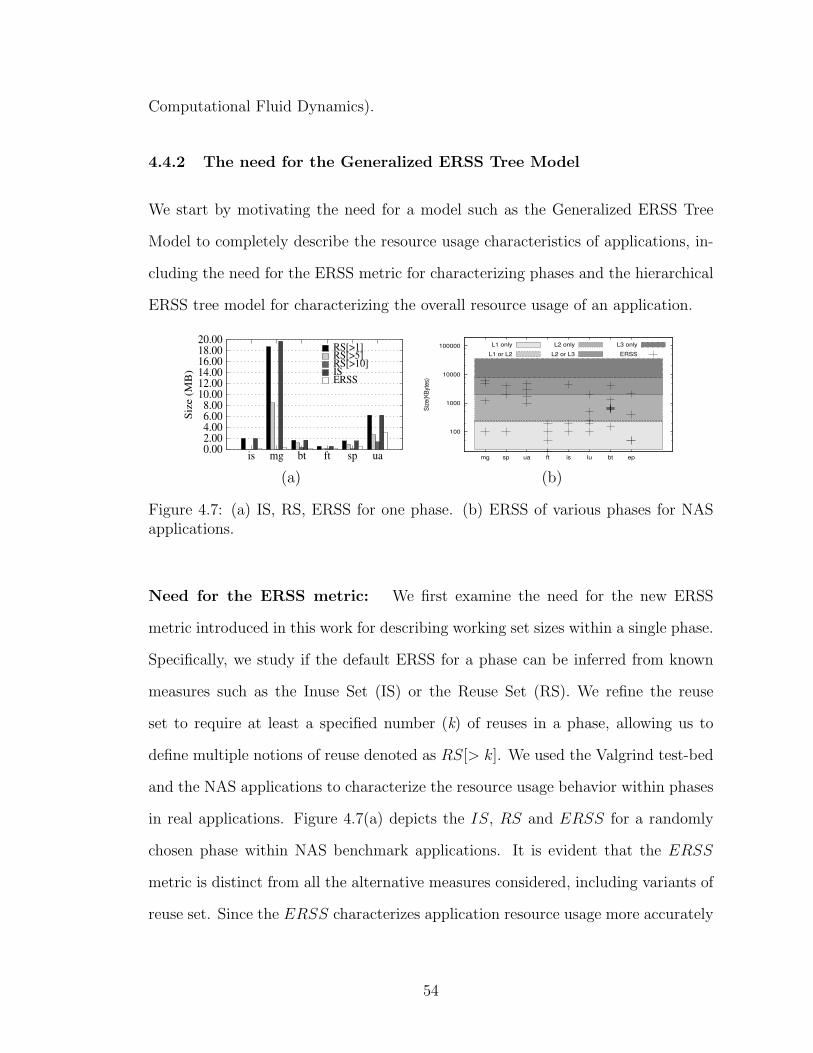
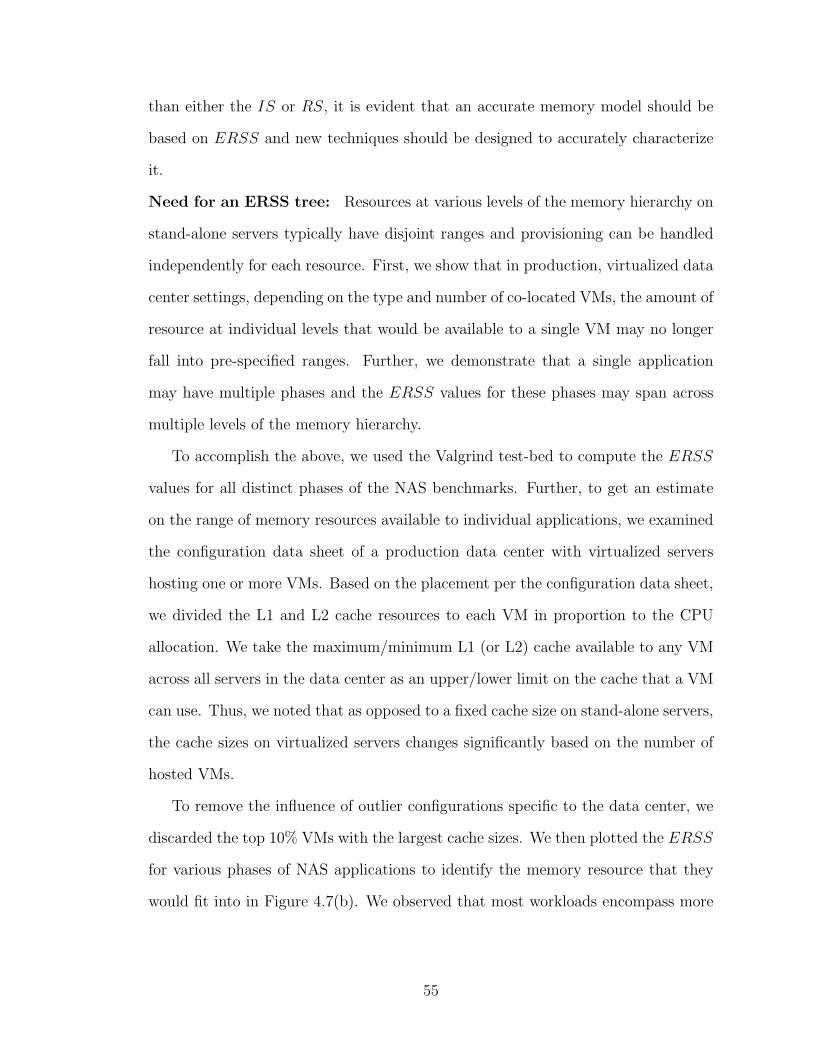
4.7 (a) IS, RS, ERSS for one phase. (b) ERSS of various phases for NASapplications. . . . . . . . . . . . . . . . . . . . . . . . . . . . . . . . 54
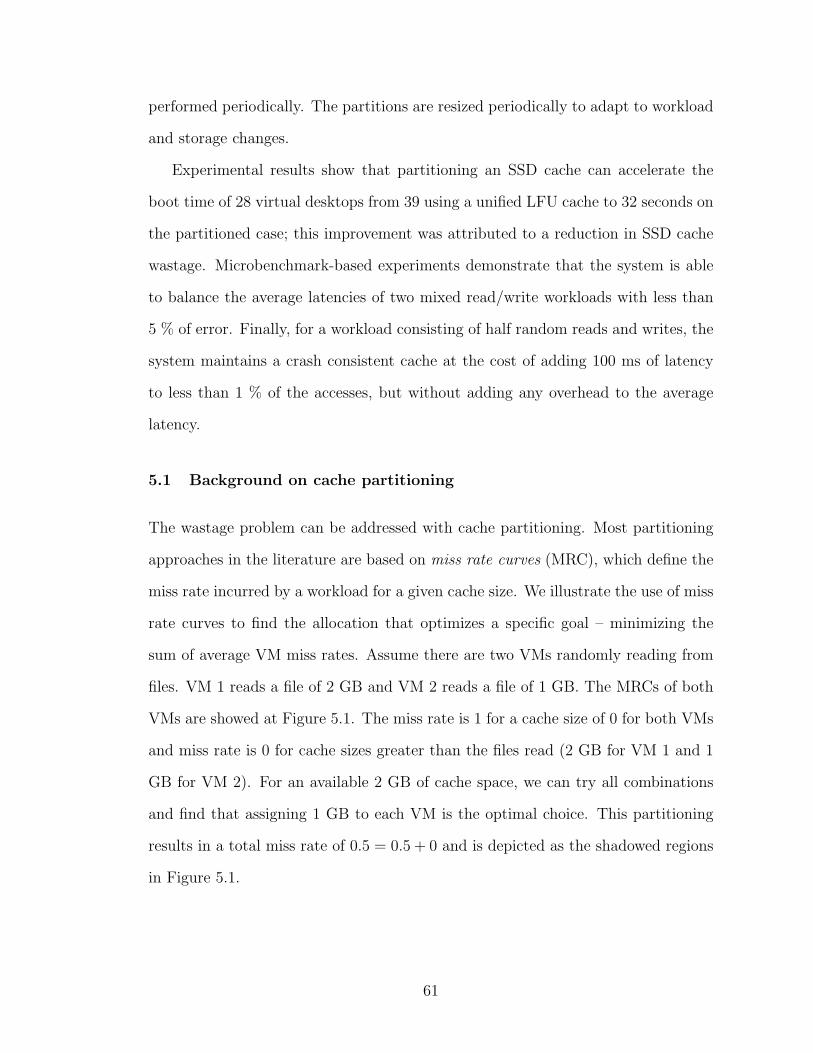
5.1 Example of cache partitioning. A cache of size 2 is partitioned acrosstwo VMs. Both VMs MRCs are shown with the optimal assignmentof cache shown in grey: one cache unit to each VM. . . . . . . . . . . 62
5.2 Example of MRC and its convex minorant. . . . . . . . . . . . . . . . . 62
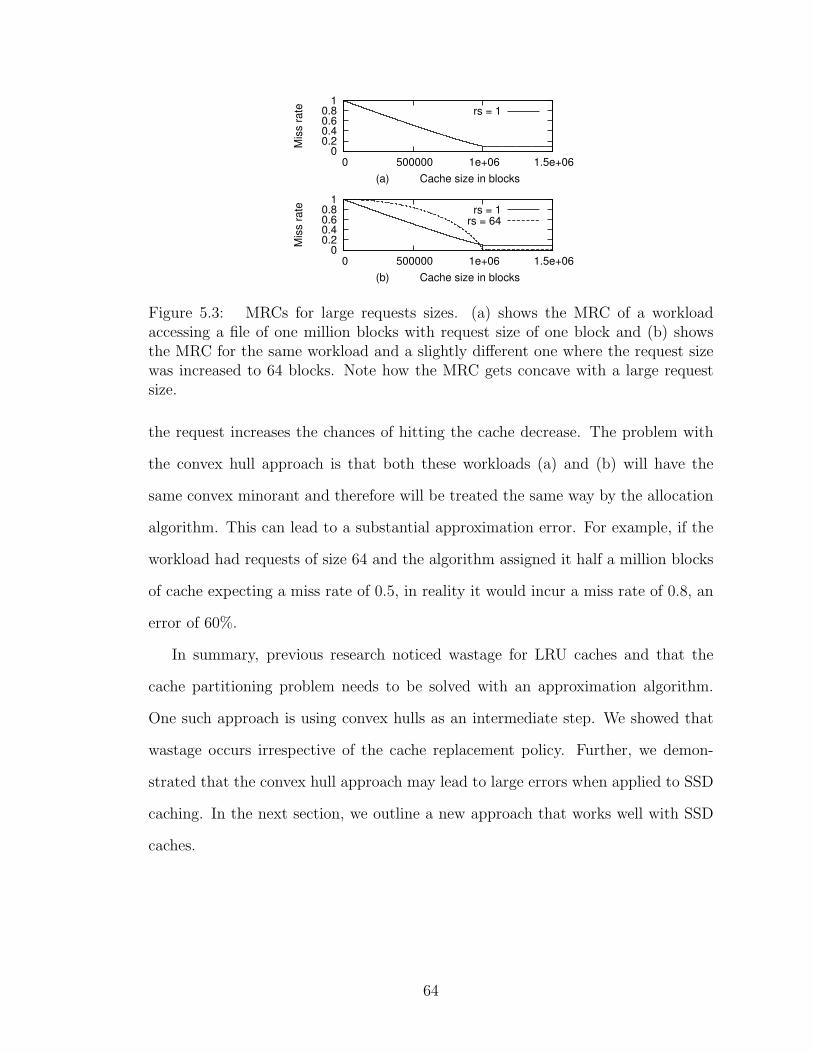
5.3 MRCs for large requests sizes. (a) shows the MRC of a workload ac-cessing a file of one million blocks with request size of one block and(b) shows the MRC for the same workload and a slightly differentone where the request size was increased to 64 blocks. Note how theMRC gets concave with a large request size. . . . . . . . . . . . . . . 64
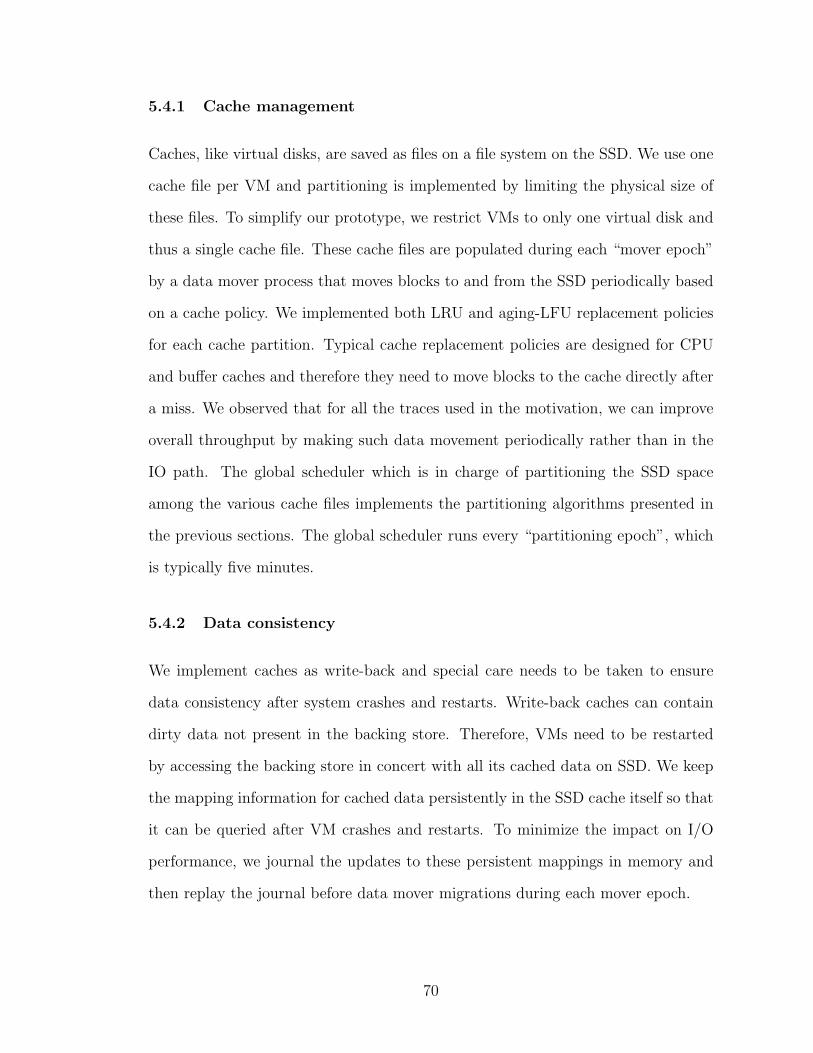
5.5 28 Virtual Linux desktops booting simultaneously using an 6 GB SSDcache. This figure shows the boot time using a global LFU cacheand a partitioned LFU cache. . . . . . . . . . . . . . . . . . . . . . . 72
5.6 System performance compared to vanilla disk and a simplified cache.4kb aligned random reads/writes on 1GB using 100MB of cache. . . 73
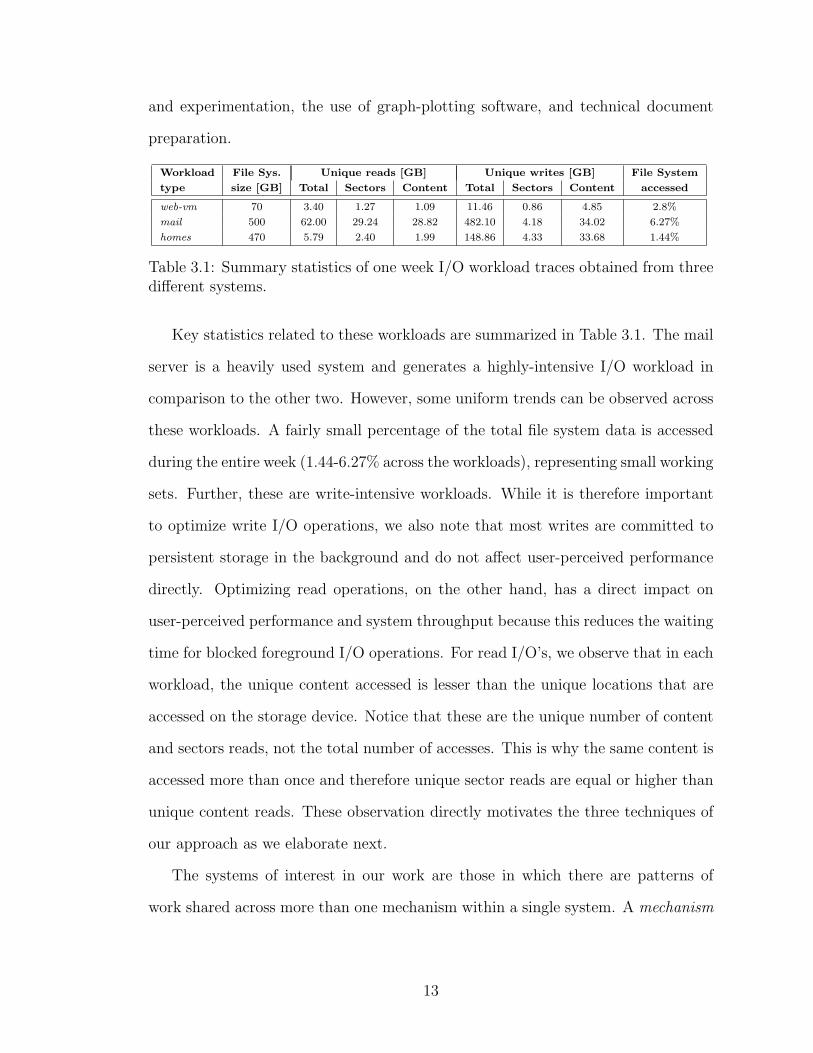
type size [GB] Total Sectors Content Total Sectors Content accessed
web-vm 70 3.40 1.27 1.09 11.46 0.86 4.85 2.8%
mail 500 62.00 29.24 28.82 482.10 4.18 34.02 6.27%
homes 470 5.79 2.40 1.99 148.86 4.33 33.68 1.44%
Table 3.1: Summary statistics of one week I/O workload traces obtained from threedifferent systems.
Key statistics related to these workloads are summarized in Table 3.1. The mail
server is a heavily used system and generates a highly-intensive I/O workload in
comparison to the other two. However, some uniform trends can be observed across
these workloads. A fairly small percentage of the total file system data is accessed
during the entire week (1.44-6.27% across the workloads), representing small working
sets. Further, these are write-intensive workloads. While it is therefore important
to optimize write I/O operations, we also note that most writes are committed to
persistent storage in the background and do not affect user-perceived performance
directly. Optimizing read operations, on the other hand, has a direct impact on
user-perceived performance and system throughput because this reduces the waiting
time for blocked foreground I/O operations. For read I/O’s, we observe that in each
workload, the unique content accessed is lesser than the unique locations that are
accessed on the storage device. Notice that these are the unique number of content
and sectors reads, not the total number of accesses. This is why the same content is
accessed more than once and therefore unique sector reads are equal or higher than
unique content reads. These observation directly motivates the three techniques of
our approach as we elaborate next.
The systems of interest in our work are those in which there are patterns of
work shared across more than one mechanism within a single system. A mechanism
13
1000
10000
100000
1e+06
1e+07
Read Write Read+Write
SectorContent
1e+06
1e+07
1e+08
Read Write Read+WriteN
um
be
r o
f ca
ch
e h
its
SectorContent
10000
100000
1e+06
1e+07
Read Write Read+Write
SectorContent
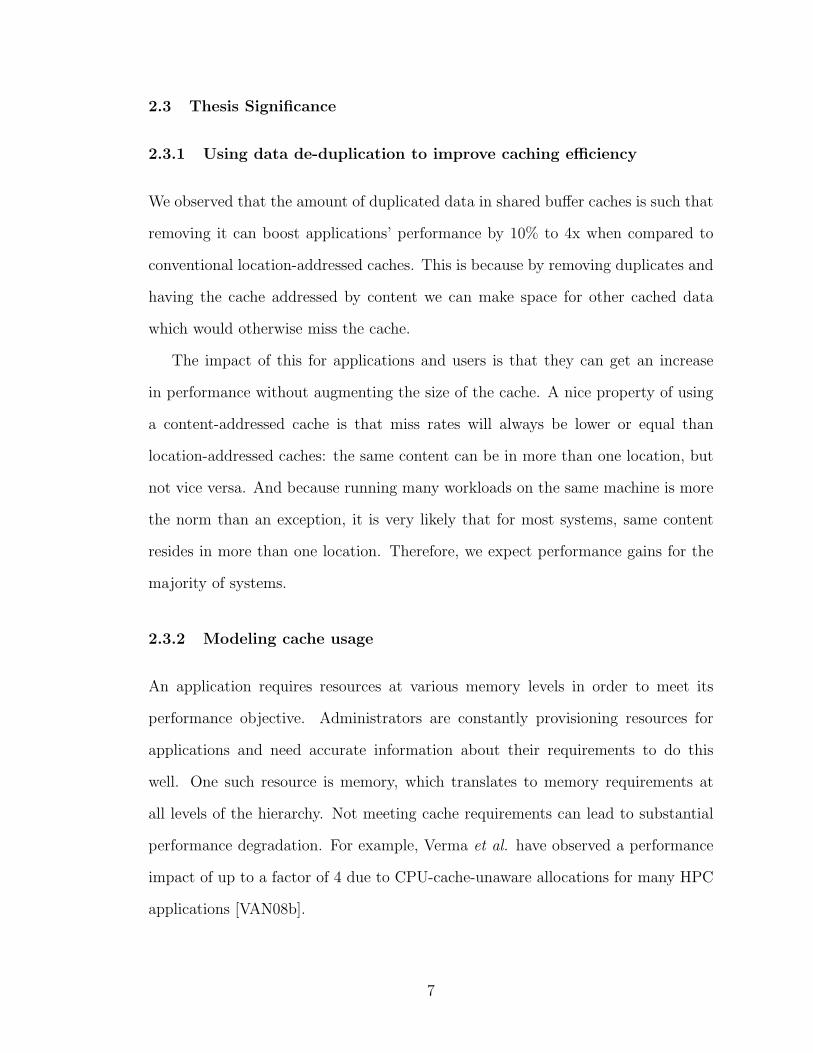
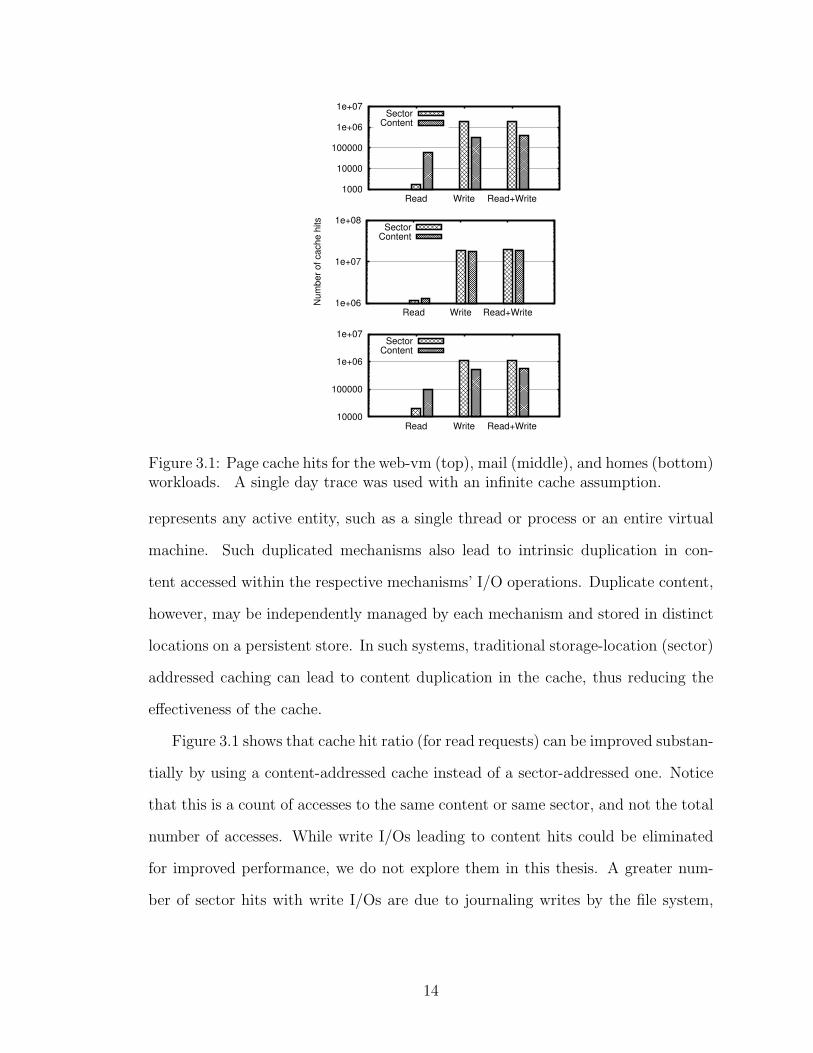
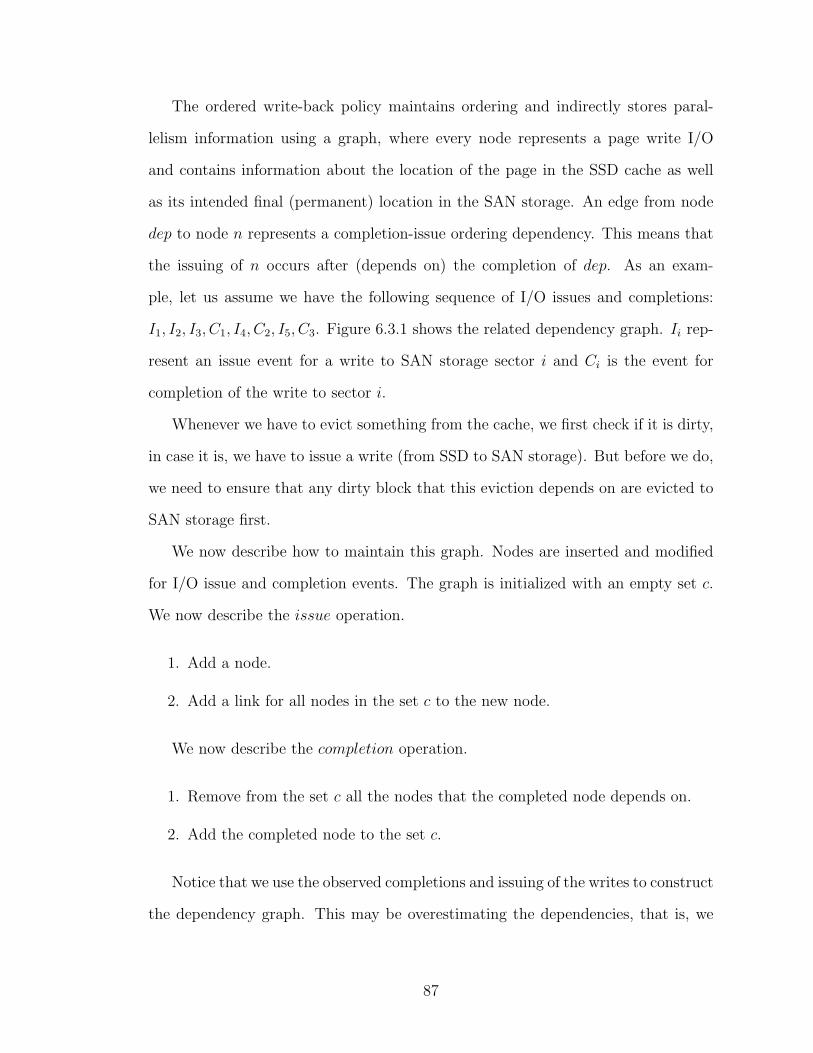
Figure 3.1: Page cache hits for the web-vm (top), mail (middle), and homes (bottom)workloads. A single day trace was used with an infinite cache assumption.
represents any active entity, such as a single thread or process or an entire virtual
machine. Such duplicated mechanisms also lead to intrinsic duplication in con-
tent accessed within the respective mechanisms’ I/O operations. Duplicate content,
however, may be independently managed by each mechanism and stored in distinct
locations on a persistent store. In such systems, traditional storage-location (sector)
addressed caching can lead to content duplication in the cache, thus reducing the
effectiveness of the cache.
Figure 3.1 shows that cache hit ratio (for read requests) can be improved substan-
tially by using a content-addressed cache instead of a sector-addressed one. Notice
that this is a count of accesses to the same content or same sector, and not the total
number of accesses. While write I/Os leading to content hits could be eliminated
for improved performance, we do not explore them in this thesis. A greater num-
ber of sector hits with write I/Os are due to journaling writes by the file system,
14
1000
10000
100000
1e+06
Read Write Read+Write
SectorContent
100000
1e+06
1e+07
Read Write Read+WriteA
ve
rag
e r
eu
se
dis
tan
ce
SectorContent
100000
1e+06
1e+07
Read Write Read+Write
SectorContent
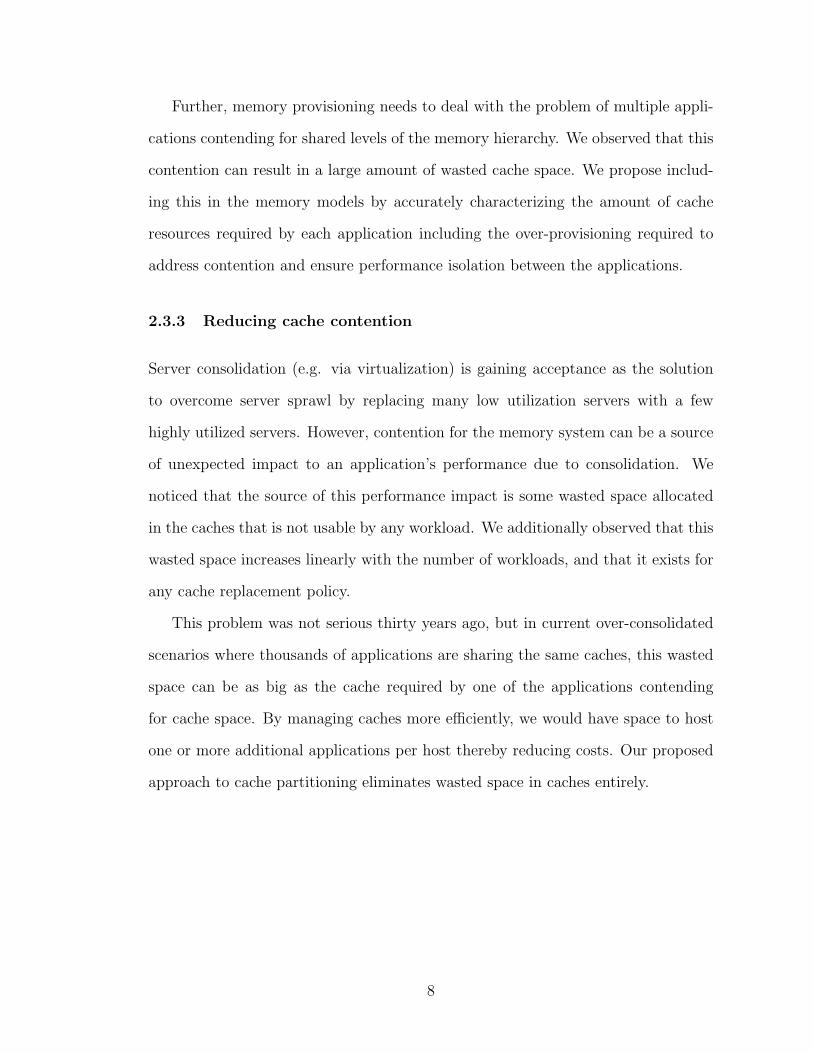
Figure 3.2: Contrasting content and sector reuse distances for the web-vm (top),mail (middle), and homes (bottom) workloads.
repeatedly overwriting locations within a circular journal space.
For further analysis, we define the average sector reuse distance for a workload as
the average number of requests between successive requests to the same sector. The
average content reuse distance is defined similarly over accesses to the same content.
Figure 3.2 shows that the average reuse distance for content is smaller than for sector
for each of the three workloads that we studied for both read and write requests.
For such workloads, data addressed by content can be cache-resident for lesser time
yet be more effective for servicing read requests than if the same cached data is
addressed by location. Write requests on the other hand do not depend on cache
hits since data is flushed to rather than requested from the storage system. These
observations and those from Figure 3.1 motivate content-addressed caching.
15
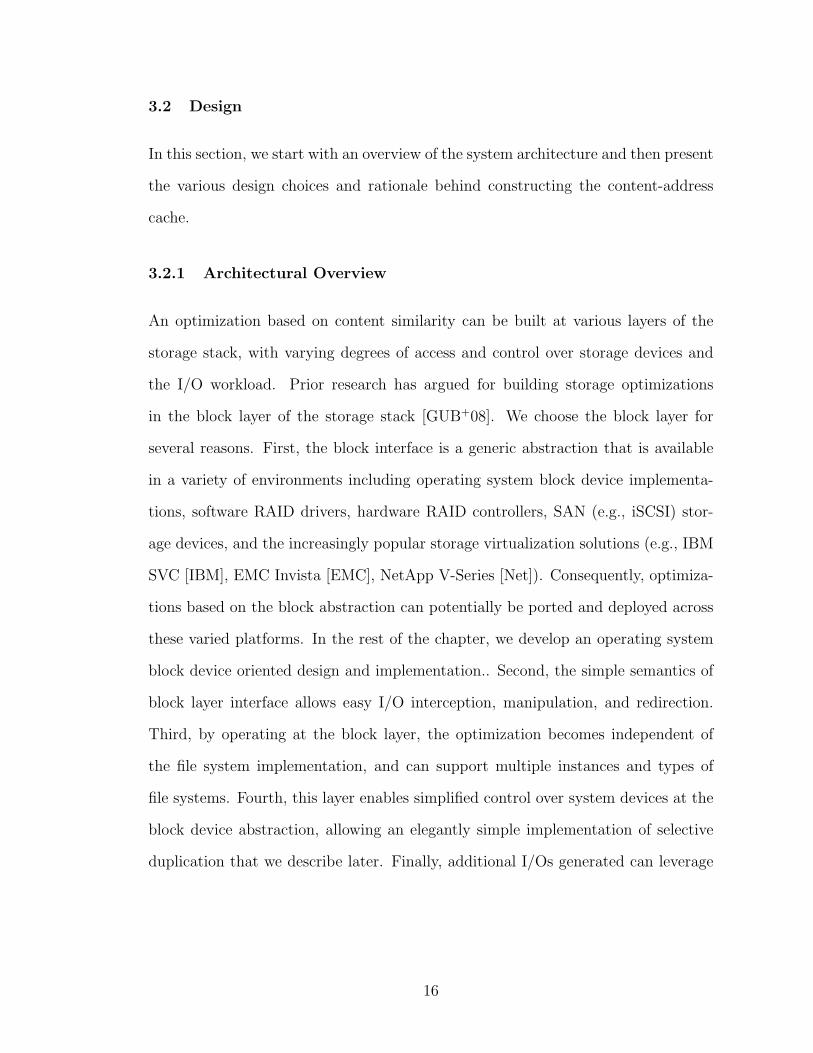
3.2 Design
In this section, we start with an overview of the system architecture and then present
the various design choices and rationale behind constructing the content-address
cache.
3.2.1 Architectural Overview
An optimization based on content similarity can be built at various layers of the
storage stack, with varying degrees of access and control over storage devices and
the I/O workload. Prior research has argued for building storage optimizations
in the block layer of the storage stack [GUB+08]. We choose the block layer for
several reasons. First, the block interface is a generic abstraction that is available
in a variety of environments including operating system block device implementa-
tions based on the block abstraction can potentially be ported and deployed across
these varied platforms. In the rest of the chapter, we develop an operating system
block device oriented design and implementation.. Second, the simple semantics of
block layer interface allows easy I/O interception, manipulation, and redirection.
Third, by operating at the block layer, the optimization becomes independent of
the file system implementation, and can support multiple instances and types of
file systems. Fourth, this layer enables simplified control over system devices at the
block device abstraction, allowing an elegantly simple implementation of selective
duplication that we describe later. Finally, additional I/Os generated can leverage
16
Applications
VFS
Page Cache
File System:
EXT3, JFS, · · ·
Content-
addressed
caching
I/O Scheduler
Device Driver
Selective duplicator
Selective Duplicator Content based cache
Dynamic replica retriever
: New components : Existing Components : Control Flow
Figure 3.3: System Architecture.
I/O scheduling services, thereby automatically addressing the complexities of block
request merging and reordering.
Figure 3.3 presents the architecture of content-addressed caching for a block
device in relation to the storage stack within an operating system. We augment
the storage stack’s block layer with additional functionality, which we term the
I/O dedup layer, to implement the three major mechanisms: the content-addressed
cache, the dynamic replica retriever, and the selective duplicator. The content-
addressed cache is the first mechanism encountered by the I/O workload, which
filters the I/O stream based on hits in a content-addressed cache. The dynamic
replica retriever subsequently optionally redirects the unfiltered read I/O requests
to alternate locations on the disk to avail the best access latencies to requests.
The selective duplicator is composed of a kernel sub-component that tracks content
accesses to create a candidate list of content for replication, and a user-space process
that runs during periods of low disk activity and populates replica content in scratch
space distributed across the entire disk. Thus, while the kernel components run
17
Sector-to-H
ashFunction
Sector
Digest-to-Hash Function
MD5 Digest
e
e
e
e
p
e
e
e
e
e
e
e
p
Legend
p Page (vc page) e Entry (vc entry)
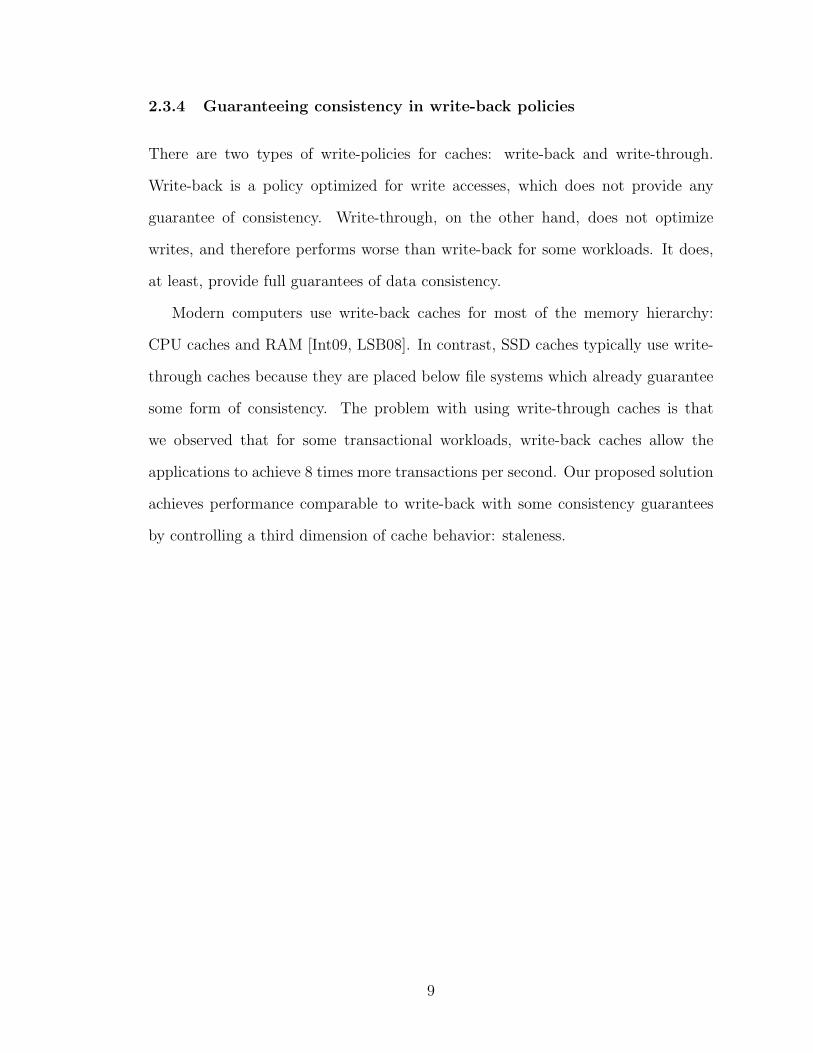
Figure 3.4: Data structure for the content-addressed cache. The cache is address-able by both sector and content-hash. vc entries are unique per sector. Solid linesbetween vc entries indicate that they may have the same content (they may not incase of hash function collisions.) Dotted lines form a link between a sector (vc entry)and a given page (vc page.) Note that some vc entries do not point to any page –there is no cached content for these entries. However, this indicates that the linkedvc entries have the same data on disk. This happens when some of the pages areevicted from the cache. Additionally, pages form an LRU list.
continuously, the user-space component runs sporadically. Separating out the actual
replication process into a user-level thread allows greater user/administrator control
over the timing and resource consumption of the replication process, an I/O resource-
intensive operation. Next, we elaborate on the design of the content addressed
caching mechanism.
18
3.2.2 Content addressed caching
Building a content-addressed cache at the block layer creates an additional buffer
cache separate from the virtual file system (VFS) cache. Requests to the VFS
cache are sector-based while those to the content-addressed cache cache are both
sector- and content-addressed. The content-addressed cache layer only sees the read
requests for sector misses in the VFS cache. We discuss exclusivity across these
caches shortly. In the content-addressed cache layer, read requests identified by
sector locations are queried against a dual sector- and content-addressed cache for
hits before entering the I/O scheduler queue or being merged with an existing request
by the I/O scheduler. Population of the content-addressed cache occurs along both
the read and write paths. In case of a cache miss during a read operation, the I/O
completion handler for the read request is intercepted and modified to additionally
insert the data read into the content-addressed cache after I/O completion only if
it is not already present in the cache and is important enough in the LRU list to be
cached. A write request to a sector which had contained duplicate data is simply
removed from the corresponding duplicate sector list to ensure data consistency for
future accesses. The new data contained within write requests is optionally inserted
into the content-addressed cache (if it is sufficiently important) in the onward path
before entering the request into the I/O scheduler queue to keep the content cache
up-to-date with important data.
The in-memory data structure implementing the content-addressed cache sup-
ports look-up based on both sector and content-hash to address read and write
requests respectively. Entries indexed by content-hash values contain a sector list
(list of sectors in which the content is replicated) and the corresponding data if it
was entered into the cache and not replaced. Cache replacement only replaces the
19
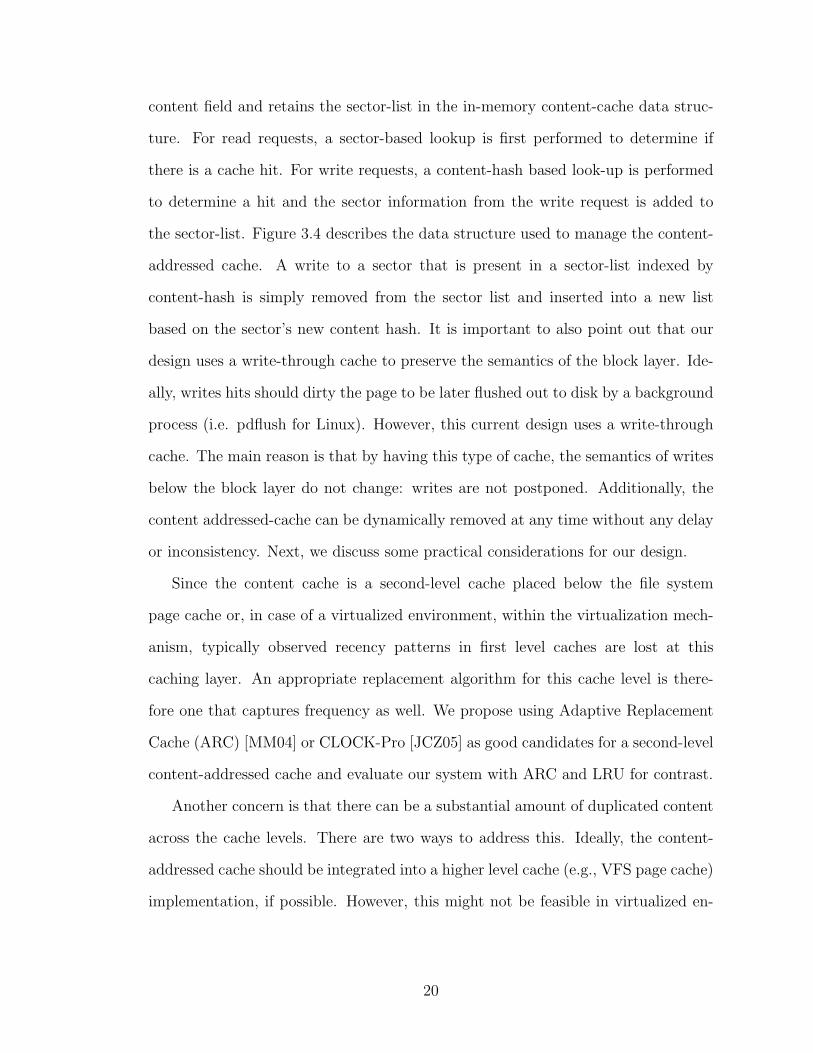
content field and retains the sector-list in the in-memory content-cache data struc-
ture. For read requests, a sector-based lookup is first performed to determine if
there is a cache hit. For write requests, a content-hash based look-up is performed
to determine a hit and the sector information from the write request is added to
the sector-list. Figure 3.4 describes the data structure used to manage the content-
addressed cache. A write to a sector that is present in a sector-list indexed by
content-hash is simply removed from the sector list and inserted into a new list
based on the sector’s new content hash. It is important to also point out that our
design uses a write-through cache to preserve the semantics of the block layer. Ide-
ally, writes hits should dirty the page to be later flushed out to disk by a background
process (i.e. pdflush for Linux). However, this current design uses a write-through
cache. The main reason is that by having this type of cache, the semantics of writes
below the block layer do not change: writes are not postponed. Additionally, the
content addressed-cache can be dynamically removed at any time without any delay
or inconsistency. Next, we discuss some practical considerations for our design.
Since the content cache is a second-level cache placed below the file system
page cache or, in case of a virtualized environment, within the virtualization mech-
anism, typically observed recency patterns in first level caches are lost at this
caching layer. An appropriate replacement algorithm for this cache level is there-
fore one that captures frequency as well. We propose using Adaptive Replacement
Cache (ARC) [MM04] or CLOCK-Pro [JCZ05] as good candidates for a second-level
content-addressed cache and evaluate our system with ARC and LRU for contrast.
Another concern is that there can be a substantial amount of duplicated content
across the cache levels. There are two ways to address this. Ideally, the content-
addressed cache should be integrated into a higher level cache (e.g., VFS page cache)
implementation, if possible. However, this might not be feasible in virtualized en-
20
vironments where page caches are managed independently within individual virtual
machines. In such cases, techniques that help make in-memory cache content across
cache levels exclusive such as cache hints [LAS+05], demotions [WW02a], and pro-
motions [Gil08] may be used. An alternate approach is to employ memory dedu-
plication techniques such as those proposed in the VMware ESX server [Wal02a],
Difference Engine [GLV+08], and Satori [MMHF09]. In these solutions, duplicate
pages within and across virtual machines are made to point to the same machine
frame with use of an extra level of indirection, such as the shadow page tables. In
memory, duplicate content across multiple levels of caches is indeed an orthogonal
problem, and any of the referenced techniques could be used as a solution directly
within content-addressed caching.
3.2.3 Persistence of metadata
A final issue is the persistence of the in-memory data structure so that the system
can retain intelligence about content similarity across system restart operations.
Persistence is important for retaining the locations of on-disk intrinsic and artifi-
cially created duplicate content so that this information can be restored and used
immediately upon a system restart event. We note that while persistence is useful to
retain intelligence that is acquired over a period of time, “continuous persistence” of
metadata in a content-addressed cache is not necessary to guarantee the reliability
of the system, unlike other systems such as the eager writing disk array [ZYKW02]
or doubly distorted mirroring [OS93]. In this sense, selective duplication is similar
to the opportunistic replication as performed by FS2 [HHS05] because it tracks up-
dates to replicated data in memory and only guarantees that the primary copy of
data blocks are up-to-date at any time. While persistence of the in-memory data
is not implemented in our prototype yet, guaranteeing such persistence is relatively
21
straightforward. Before the content-addressed cache kernel module is unloaded (oc-
curring at the same time the managed file system is unmounted), all in-memory data
structure entries can be written to a reserved location of the managed scratch-space.
These can then be read back to populate the in-memory metadata upon a system
restart operation when the kernel module is loaded into the operating system.
3.3 Experimental Evaluation
In this section, we evaluate the performance impact of using a content-addressed
cache. We also evaluate the CPU and memory overhead incurred by an content-
addressed cache. We used the block level traces for the three systems that were
described in detail in § 3.1 for our evaluation. The traces were replayed as block
traces in a similar way as done by blktrace [Axb07]. Blktrace could not be used as-is
since it does not record content information; we used a custom Linux kernel module
to record content-hashes for each block read/written in addition to other attributes
of each I/O request. Additionally, the blktrace tool btreplay was modified to include
traces in our format and replay them using provided content. Replay was performed
at a maximum acceleration of 100x, with care being taken in each case to ensure that
block access patterns were not modified as a result of the speedup. Measurements for
actual disk I/O times were obtained with per-request block-level I/O tracing using
blktrace and the results reported by it. Finally, all trace playback experiments were
performed on a single Intel(R) Pentium(R) 4 CPU 2.00GHz machine with 1 GB of
memory and a Western Digital disk WD5000AAKB-00YSA0 running Ubuntu Linux
8.04 with kernel 2.6.20.
22
1e-05
0.0001
0.001
0.01
0.1
1
web-vm mail homes
Hit r
atio
Sector 4MBContent 4MB
Sector 200MBContent 200MB
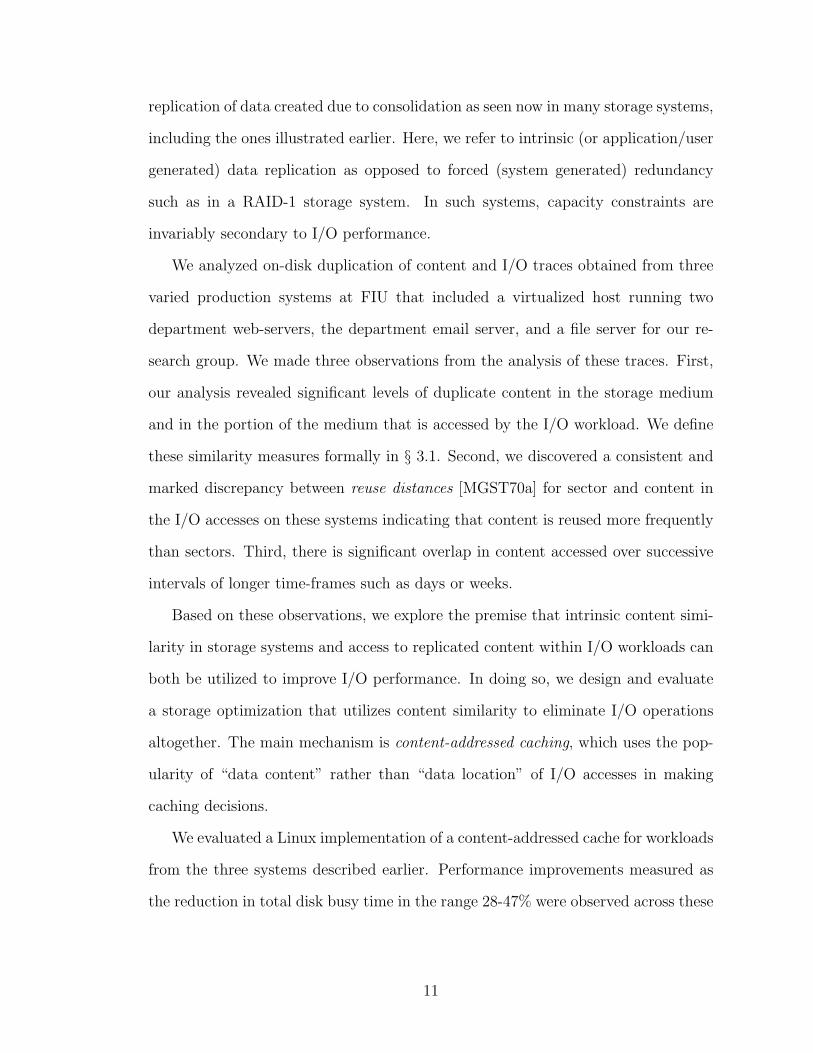
Figure 3.5: Per-day page cache hit ratio for content- and sector- addressed cachesfor read operations. The total number of pages read are 0.18, 2.3, and 0.23 millionrespectively for the web-vm, mail and homes workloads. The numbers in the legendnext to each type of addressing represent the cache size.
3.3.1 Evaluating performance
In our first experiment, we evaluated the effectiveness of a content-addressed cache
against a sector-addressed one. The primary difference in implementation between
the two is that for the sector-addressed cache, the same content for two distinct
sectors will be stored twice. We fixed the cache size in both variants to one of two
different sizes, 1000 pages (4MB) and 50000 pages (200MB). We replayed two weeks
of the traces for each of the three workloads; the first week warmed up the cache
and measurements were taken during the second week. Figure 3.5 shows the average
per-day cache hit counts for read I/O operations during the second week when using
an adaptive replacement cache (ARC) in two modes, content and sector addressed.
This experiment shows that there is a large increase in per-day cache hit counts
for the web and the home workloads when a content-addressed cache is used (rela-
tive to a sector-addressed cache). The first observation is that improvement trends
are consistent across the two cache sizes. Both cache implementations benefit sub-
stantially from a larger cache size except for the mail workload, indicating that
mail is not a cache-friendly workload validated by its substantially larger working
set and workload I/O intensity (as observed in Section 3.1). The web-vm workload
23
0.0001
0.001
0.01
0.1
1
1 10 100 1000 10000
Hit r
atio
Cache size (MBytes)
ARC - ReadLRU - Read
0.0001
0.001
0.01
0.1
1
1 10 100 1000 10000
Hit r
atio
Cache size (MBytes)
ARC - Read/WriteLRU - Read/Write
Figure 3.6: Comparison of ARC and LRU content-addressed caches for pages readonly (top) and pages read/write operations (bottom). A single day trace (0.18million page reads and 2.09 million page read/writes) of the web workload was usedas the workload.
shows the biggest increase with an almost 10X increase in cache hits with a cache
of 200MB compared to the home workload which has an increase of 4X. The mail
workload has the least improvement of approximately 10%.
We performed additional experiments to compare an LRU implementation with
the ARC cache implementation (used in the previous experiments) using a single
day trace of the web-vm workload. Figure 3.6 provides a performance comparison of
both replacement algorithms when used for a content-addressed cache. For small and
large cache sizes, we observe that ARC is either as good or more effective than LRU
with ARC’s improvement over LRU increasing substantially for write operations at
small to moderate cache sizes. More generally, this experiment suggests that the
performance improvements for a content-addressed cache are sensitive to the cache
replacement mechanism, which should be chosen with care.
24
100
1000
10000
100000
1e+06
1e+07
1e+08
0 50000 100000
Lookup C
PU
Cycle
s
Number of unique pages
sector 25
sector 225
content 25
content 225
Figure 3.7: Overhead of content and sector lookup operations with increasing sizeof the content-addressed cache.
3.3.2 Evaluating Overhead
While the gains due to addressing a cache by content are promising, it incurs resource
overhead. Specifically, the implementation uses content- and sector- addressed hash-
tables to simplify lookup and insert operations into the content-addressed cache.
We evaluate the CPU overhead for insert/lookup operations and memory overhead
required for managing hash-table metadata.
CPU Overhead
To evaluate the overhead, we measured the average number of CPU cycles re-
quired for lookup/insert operations as we vary the number of unique pages (i.e.,
size) in the content-addressed cache (i.e., cache size) for a day of the web workload.
Figure 3.8 depicts these overheads for two cache configurations, one configured with
225 buckets in the hash tables and the other with 25 buckets. Read operations
perform a sector lookup and additionally content lookup in case of a miss for in-
sertion. Write operations always perform a sector and content lookup due to our
write-through cache design. Content lookups need to first compute the hash for the
page contents which takes around 100K CPU cycles for MD5. With few buckets
(25) lookup times approach O(N) where N is the size of the hash-table. However,
25
100
1000
10000
100000
1e+06
1e+07
25
210
215
220
225
230
Lookup C
PU
Cycle
s
Hash-table Buckets
sector content
Figure 3.8: Overhead of sector and content lookup operations with increasing hash-table bucket entries.
given enough hash-table buckets (225), lookup times are O(1).
Next, we examined the sensitivity to the hash-table bucket entries. As the
number of buckets are increased, the lookup times decrease as expected due to
reduction in collisions, but beyond 220 buckets, there is an increase. We attribute
this to L2 cache and TLB misses due to memory fragmentation, under-scoring that
hash-table bucket sizes should be configured with care. In the sweet spot of bucket
entries, the lookup overhead for both sector and content reduces to 1K CPU cycles
or less than 1µs for our 2GHz machine. Note that the content lookup operation
includes a hash computation, which inflates its cycles requirement by at least 100K.
Memory Overhead
The management of a content-addressed cache introduces memory overhead for
managing metadata for the content-addressed cache. Specifically, the memory over-
head is dictated by the size of the cache measured in pages (P ), the degree of
workload static similarity (WSS), and the configured number of buckets in the hash
tables (HTB), which also determine the lookup time, as we saw earlier. WSS is
defined as the average number of copies per block accessed by the I/O workload. In
our current unoptimized implementation, the memory overhead in bytes (assuming
4 byte pointers and 4096 byte pages) :
26
mem(P,WSS,HTB) = 13 ∗ P + 36 ∗ P ∗WSS + 8 ∗HTB
These overheads include 13 bytes per-page to store the metadata for a a specific
page content (vc page), 36 bytes per page per duplicated entry (vc entry), and 8
bytes per hash-table entry for the corresponding linked list. For a 1GB content
cache (256K pages), a static similarity of 4, and a hash-table of size 1 million entries,
the metadata overhead is ∼48MB or approximately 4.6%.
3.4 Related work
Content similarity in both memory and archival storage have been investigated in
the literature. Memory deduplication has been explored before in the VMware ESX
server [Wal02a], Difference Engine [GLV+08], and Satori [MMHF09], each aiming to
eliminate duplicate in-memory content both within and across virtual machines shar-
ing a physical host. Of these, Satori has apparent similarities to our work because
it identifies candidates for in-memory deduplication as data is read from storage.
Satori runs in two modes: content-based sharing and copy-on-write disk sharing. For
content-based sharing, Satori uses content-hashes to track page contents in memory
read from disk. Since its goal is not I/O performance optimization, it does not
track duplicate sectors on disk and therefore does not eliminate duplicated I/Os
that would read the same content from multiple locations. In copy-on-write disk
sharing, the disk is already configured to be copy-on-write enabling the sharing of
multiple VM disk images on storage. In this mode, duplicated I/Os due to multiple
VMs retrieving the same sectors on the shared physical disk would be eliminated in
the same way as a regular sector-addressed cache would do. In contrast, our work
eliminates duplicated I/Os by retrieving their content irrespective of where they
27
reside on storage. Additionally, our work improves I/O performance by reducing
head movement. Thus, the contributions of Satori are complementary to our work
and can be used simultaneously.
Data deduplication in archival storage has also gained importance in both the
research and industry communities. Current research on data deduplication uses
several techniques to optimize the I/O overheads incurred due to data duplication.
Venti [QD02] proposed by Quinlan and Dorward was the first to propose the use of a
content-addressed storage for performing data deduplication in an archival system.
The authors suggested the use of an in-memory content-addressed index of data
to speed up lookups for duplicate content. Similar content-addressed caches were
used in data backup solutions such as Peabody [MIG03] and Foundation [RCP08].
Content-addressed caching is inspired by these works. Recent work by Zhu and
his colleagues [ZLP08] suggests new approaches to alleviate the disk bottleneck via
the use of Bloom filters [Blo70] and by further accounting for locality in the con-
tent stream. The Foundation work suggests additional optimizations using batched
retrieval and flushing of index entries and a log-based approach to writing data
and index entries to utilize temporal locality [RCP08]. The work on sparse index-
ing [LEB+09] suggests improvements to Zhu et al.’s general approach by exploit-
ing locality in the chunk index lookup operations to further mitigate the disk I/O
bottleneck. Content-addressed caching addresses an orthogonal problem, that of
improving I/O performance for foreground I/O workload based on the use of dupli-
cates, rather than their elimination. Nevertheless, the above approaches do suggest
interesting techniques to optimize the management of a content-addressed index and
cache in main-memory that is complementary to and can be used directly within
content-addressed caching.
28
3.5 Summary
System and storage consolidation trends are driving increased duplication of data
within storage systems. Past efforts have been primarily directed towards the
elimination of such duplication for improving storage capacity utilization. With
content-addressed caching, we take a contrary view that intrinsic duplication in a
class of systems which are not capacity-bound can be effectively utilized to improve
I/O performance – the traditional Achilles’ heel for storage systems. The content-
addressed caching mechanism increased memory caching effectiveness by increasing
cache hit rates by 10% to 4x for read operations when compared to traditional
sector-addressed caching.
The work presented in this chapter was reported in ACM Transactions in Storage
2010 [KR10].
As said before, consolidation brings two big problems: data duplication and
cache contention. In this chapter we observed that the first problem, can be used
as an opportunity to improve performance. In the next chapter, we examine and
address the problem of cache contention due to consolidation which introduces a
large performance overhead which we could only model and minimize.
29
CHAPTER 4
MODELING CACHE REQUIREMENTS AND CONTENTION
In order to meet the performance goals of applications, we need to provision cache
space across the memory hierarchy. Existing techniques for cache estimation have
severe drawbacks when used for consolidated environments. In this chapter, we
present a unifying Generalized ERSS Tree Model that characterizes the resource
usage at all levels of the memory hierarchy and accurately models the impact of
sharing a cache with many workloads.
The ever-increasing gap between processing speed and disk bandwidth ensures
that the allocation of resources at all levels of the memory hierarchy (henceforth
also referred to simply as memory levels) significantly influence the performance
of applications. The memory levels used by an application include on-chip caches
(L1 and L2), off-chip caches (e.g., L3), DRAM, and other external memory caches
(e.g., a flash-based disk cache [krm08]). Characterizing the resource utilization of
an application at various memory levels has been an active research area over the
years. While the consolidation of multiple applications on a shared hardware is
not new, the rise of virtualization has made such systems more the norm than the
exception. In virtualized systems, multiple applications run on the same physical
server and compete for resources at all memory levels. For instance, it has been
shown that contention in a shared cache can lead to performance degradation — as
much as 47% [LLD+08] and 75% [VAN08b] depending on the workload. Contrast
this problem with duplication (previous chapter’s focus). Duplication can be used
to boost I/O performance; contention on the other hand is more a problem than an
opportunity.
An accurate characterization of the implications of this problem is a prerequisite
to ensuring that all applications meet their performance goals [LLD+08, VAN08b,
30
KRDZ10, VAN08a]. Specifically, there is a need for an accurate characterization of
the resource requirement of resident applications within each virtual machine (VM),
while carefully taking into account the impact of resource contention due to other
applications.
Research in memory characterization can be broadly classified into models of
memory usage and techniques that instantiate these models. The modeling work
can be summarized using three related but disparate concepts. One of the most pop-
ular ways to characterize the main memory usage of an application is the classical
working set model [Den80]. The core of this model is the concept of a resident set
that defines the set of memory-resident pages of an application at any given point in
time. An alternative modeling approach uses the Miss Rate Curve (MRC) [RSG93]
of an application to model the influence of the allocated memory cache size on
the performance-influencing cache miss rate of the application. MRCs offer an ad-
vantage over the working set of being able to model the performance impact of
arbitrarily sized caches. Finally, the concepts of phases and phase transitions have
been proposed to model the memory resource usage behavior of an application as
it changes over time [BM76]. A phase denotes stability of the active data set used
by the application and phase transitions indicate a change in application behavior
resulting in a change in the set of active data used. and several techniques have
been proposed to identify phase transitions [BDB00, DS02, BABD00].
In this work, motivated by the multi-tenancy of applications within virtualized
enterprise data centers and clouds, we investigate the problem of characterizing
the resource requirement of an application at all levels of the memory hierarchy for
accurately provisioning resources in a shared environment. We identify the following
properties for a memory model to be relevant in such shared environments.
31
1. Address all memory levels: The degree of sharing in a consolidated en-
vironment determines the amount of resources available to an application at
each memory level. As opposed to a dedicated system, the resources available
to an application at various memory levels in a shared environment do not
have clearly demarcated values (e.g, 4KB L1, 2MB L2, 16MB L3 cache). A
holistic view of resource consumption across all memory levels during an ap-
plication’s entire lifetime is thus necessary to provision memory resources for
the application.
2. Identify dominant phases: The phases that are long-running have the
greatest impact on application performance. On the other hand, reserving
memory resources for short-lived phases, even though they may constitute
larger working sets, may not be required. Therefore, model should adequately
inform about the lifetime of the phases.
3. Address impact of contention: In spite of the copious work on partitioning
caches at the hardware or the OS kernel level, solutions for cache partitioning
are available only in high-end systems and that too only for certain memory
levels. Today’s commodity systems do not support flexible cache partition-
ing at any level. Hence, the model should address the impact of resource
contention in a shared environment as a first class concern.
4. A commodity solution: Typical virtualized data centers run on commod-
ity systems wherein administrators have little or no control on the internal
operations of the guest VMs. Hence, a practically viable model should be
built primarily from high level system parameters that do not require intru-
sive changes to the systems under consideration.
32
4.1 Gaps in Existing Models and Characterization
Existing memory models are insufficient to adequately model memory usage in a
shared environment. First, existing techniques do not adequately capture the dis-
tinct phases of memory resource usage during an application’s lifetime; working sets
typically model the resource requirement for a fixed phase in the application while
MRCs unify multiple phases into one, losing important distinctions between their
individual resource consumption characteristics. Second, existing models focus on a
specific level of memory; working sets are used for main memory [Den80] and MRCs
for caches [DS02]. With the increasingly diverse levels of memory resources (L1, L2,
L3, main memory, flash, and disks), a unified view of all memory resources is criti-
cally important for memory provisioning. For instance, if the working-set of a phase
cannot be accommodated in L2, it may be possible to provision for it in L3, and pro-
visioning a greater amount of L3 cache can reduce memory bandwidth requirement.
Third, these models were not designed to model the impact of contention between
applications which is important for ensuring performance isolation. An application’s
actual memory requirement may be very small, i.e., capacity misses may be close
to 0, but it may have a large number of compulsory misses (e.g., streaming data
access) which would effectively pollute the cache and thus impact other co-located
applications significantly. Finally, most existing techniques for identifying phases or
to infer the working set or the MRC are fairly intrusive, requiring direct access to
the operating system page tables or fragment cache [BDB00] that are only available
within the kernel. Typical data centers use commodity software and administrators
do not have kernel level access to individual virtual machine instances.
We present the Generalized ERSS Tree Model, a new model for memory usage
which both refines and unifies existing models. The Generalized ERSS Tree Model
33
is based on a novel characterization that we term Effective Reuse Set Size (ERSS),
which refines the working set by accounting for the reuse of data and architectural
advances like prefetching. We define ERSS relative to the miss rate allowing it to
model MRC concepts. The ERSS tree additionally captures hierarchical phases and
their transitions. Additionally, we introduce two new parameters that intuitively
model resource contention. The Reuse Rate captures the average rate at which an
application reuses its Effective Reuse Set and the Flood Rate captures the rate at
which an application floods a resource with non reusable data. We show that the
former captures the vulnerability of an application’s performance to competition
from other applications, whereas the latter captures the adverse impact of an ap-
plication on the performance of co-located applications. We overcome significant
technical challenges to design a practical methodology for instantiating the model
on commodity hardware without access to the target application or operating sys-
tem. Our methodology uses (i) existing as well as new memory resource partitioning
techniques to get the hit/miss rates for applications and (ii) a new phase detection
technique that can be built solely from hit and miss rates for all levels of the mem-
ory hierarchy. Finally, we demonstrate the use of the model to characterize the
amount of memory required to ensure performance isolation for applications in a
consolidated environment.
4.2 The Generalized ERSS Tree Model
We now present the Generalized ERSS Tree Model that unifies and refines the
classical concepts of working set, miss rate curves, and phases. In line with previous
work [BM76], we define a phase as a maximal interval during which a given set
of memory lines, each referenced at least once, remain on top of an LRU stack.
The model is based on a characterization of the core parameters that determine the
34
memory capacity requirement of an application within a single phase of its execution.
We extend this core concept to a tree-based structural model that characterizes the
memory requirements of an application across all of its phases. We finally enrich
this model with parameters based on access rates at various memory levels to model
resource contention in shared environments. For the rest of the chapter, we use the
term memory line to denote the basic unit of access, thus denoting both cache lines
and memory pages based on the context.
4.2.1 Capacity Related Parameters
A key characteristic of an application’s memory usage is the number of memory lines
the application requires to avoid capacity misses within a single phase of its execu-
tion. This metric assumes that there is no contention from any other application
for the resource.
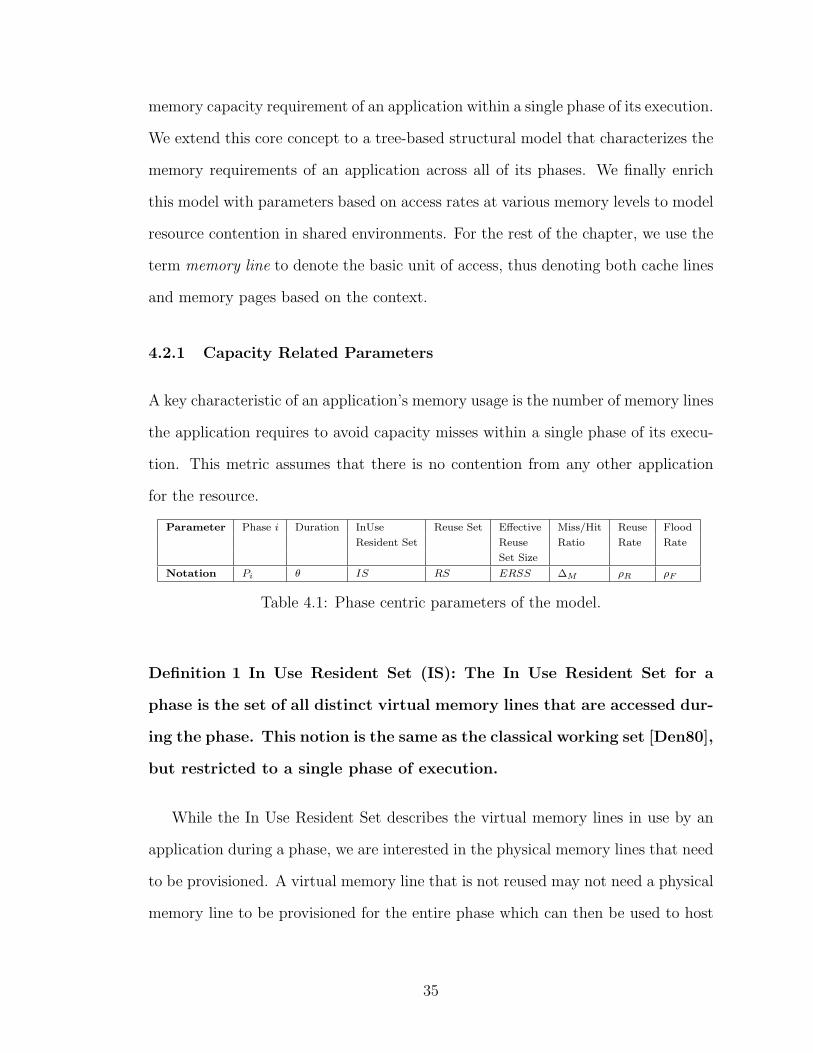
Parameter Phase i Duration InUse Reuse Set Effective Miss/Hit Reuse Flood
Resident Set Reuse Ratio Rate Rate
Set Size
Notation Pi θ IS RS ERSS ∆M ρR ρF
Table 4.1: Phase centric parameters of the model.
Definition 1 In Use Resident Set (IS): The In Use Resident Set for a
phase is the set of all distinct virtual memory lines that are accessed dur-
ing the phase. This notion is the same as the classical working set [Den80],
but restricted to a single phase of execution.
While the In Use Resident Set describes the virtual memory lines in use by an
application during a phase, we are interested in the physical memory lines that need
to be provisioned. A virtual memory line that is not reused may not need a physical
memory line to be provisioned for the entire phase which can then be used to host
35
other lines. Hence, the In Use Resident Set does not adequately capture the amount
of physical memory needed by the application.
Definition 2 Reuse Set (RS): The Reuse Set is the subset of In Use Res-
ident Set that is accessed more than once during a phase.
While the Reuse Set is a better approximation for the memory requirement of an
application, it lacks certain key properties. First, the Reuse Set does not capture any
capacity that is required to prevent the non-reusable data from evicting the reusable
data. The actual memory requirement of the application during a phase may thus
be larger than the Reuse Set. Second, the Reuse Set may contain some virtual
memory lines that are reused very infrequently. The performance degradation of the
application by not provisioning physical memory for these lines may be negligible
and thus these lines do not contribute in a significant way to the effective memory
requirement of the application during the phase. Finally, prefetching may hide
latencies for accesses that are part of a stream of accesses if the rate of data access
is low. This may further reduce the effective number of memory lines required by an
application below the Reuse Set size. Thus, we define a metric that more accurately
captures the amount of memory required by an application within a phase.
Definition 3 Effective Reuse Set Size (ERSS): The Effective Reuse Set
Size is the minimum number of physical memory lines that need to be
assigned to the program during a phase for it to not exhibit thrashing
behavior [Den68a]. The ERSS is defined with respect to a miss/hit ratio
∆M and is denoted by ERSS(∆M).
Definition 4 Miss/Hit Ratio (∆M): This parameter defines the ratio be-
tween the number of misses and the number of hits during a phase for a
given memory resource allocation.
36
for (idx = 0; idx <A.length ; idx++) {sum = sum + A[idx];}
Figure 4.1: An illustration of the model concepts.
The new phase centric metrics introduced above are summarized in Table. 4.1.
We illustrate the above concepts with an example in Figure 4.1. Consider a phase
where a program computes the sum of all the elements in an array in the variable
sum (Figure 4.1(a)). The Inuse Resident Set (IS) of the program in this phase is
the array A and the variables idx and sum. Since all accesses to A are compulsory
misses and only the two variables idx and sum get reused, the size of the reuse set is
2. The minimum Miss/Hit Ratio (∆M) is 1/2 which can be achieved by provisioning
physical memory for 3 integers — 2 integers to hold the reuse set and 1 more as a
buffer for the current array element. Hence, the ERSS(1/2) is 3 and different from
the size of both IS or RS.
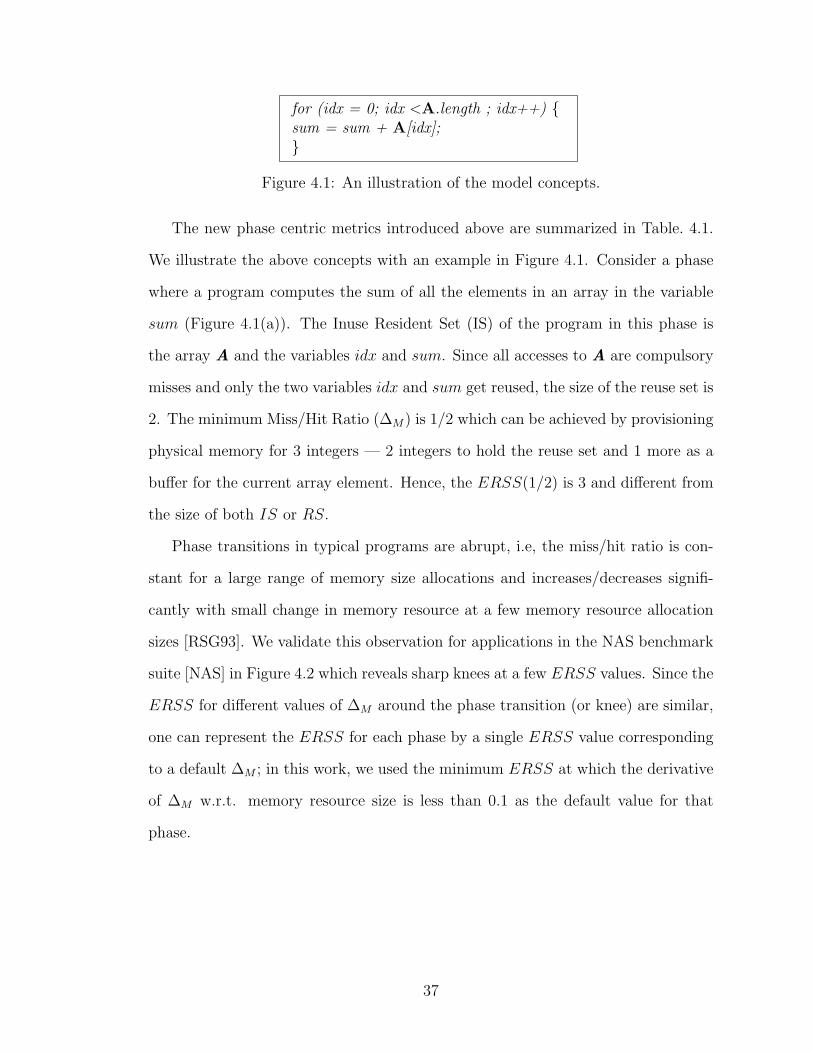
Phase transitions in typical programs are abrupt, i.e, the miss/hit ratio is con-
stant for a large range of memory size allocations and increases/decreases signifi-
cantly with small change in memory resource at a few memory resource allocation
sizes [RSG93]. We validate this observation for applications in the NAS benchmark
suite [NAS] in Figure 4.2 which reveals sharp knees at a few ERSS values. Since the
ERSS for different values of ∆M around the phase transition (or knee) are similar,
one can represent the ERSS for each phase by a single ERSS value corresponding
to a default ∆M ; in this work, we used the minimum ERSS at which the derivative
of ∆M w.r.t. memory resource size is less than 0.1 as the default value for that
phase.
37
7e4
1e5
0 1e+06
bt.W
8e4
1e6
0 1e+06
dc.W
2e6
5e6
0 1e+06
ft.W
3e5
6e5
0 1e+06
is.W
9e5
1e6
0
lu.W
5e5
6e5
0 1e+06
mg.W
3e6
0 1e+06
sp.W
1.2e6
2.2e6
0 2e+06 4e+06
ua.W
Figure 4.2: MRCs for the NAS benchmark applications.
4.2.2 Generalized ERSS Tree
So far, we have introduced the parameters that describe the memory requirement
of an application in a single phase. We now present the Generalized ERSS Tree
Model that characterizes all the phases of an application. The Generalized ERSS
Tree of an application is a tree structure, where each phase is represented as a node
specified by its duration (θ) and ERSS(∆M) function. The phase duration is defined
in terms of number of virtual memory accesses and is thus platform-independent. If
the ERSS(∆M) function has a sharp knee, we replace the function with a default
ERSS value. Smaller phases contained within a larger phase are captured by a
parent-child relationship in the tree. Further, if a small phase occurs multiple times
within a larger phase, the edge weight between the two nodes represent the number
of small phases. Finally, since a single phase may contain multiple phases with
38
(32768 , 6e+08)
(16384 , 3.43e+08) (16384 , 2.57e+08)
(4096 , 2e+07)
11
(1024 , 8e+06) (1024 , 15e+06)
(256 , 8e+06) (256 , 7e+06)
(4096 , 17e+07) (4096 , 8e+06)
32768
16384
4096
1024
256
Figure 4.3: A sample Generalized ERSS Tree.
different characteristics, a node may have multiple children.
An example ERSS tree is shown in Figure 4.3 that describes the resource usage
of the bt application in the NAS benchmark suite. Each node represents a phase
with two parameters (ERSS,θ). The tree contains 5 levels of phases with the largest
phase having a length of 6×10⁸ memory accesses and containing two smaller phases,
each with an ERSS of 16MB. The first phase has a length of 3.43 × 10⁸ memory
accesses and the second phase has a length of 2.57 × 10⁸. The second phase has
three embedded phases of 4MB each, where the first child phase repeats 11 times.
Given such a tree, one can easily identify the phases that would be resident in any
level of memory. A typical example of resident locations of the phases at various
levels of the memory hierarchy is shown using dotted lines in the figure.
4.2.3 Wastage
Sharing introduces another dimension of complexity to the resource usage behavior
of applications. Since commodity systems do not support strict isolation of various
cache resources across applications, the effective cache size (at any level of the cache
39
hierarchy) available to an application is directly influenced by the resident sizes and
rates of accesses of co-located applications.
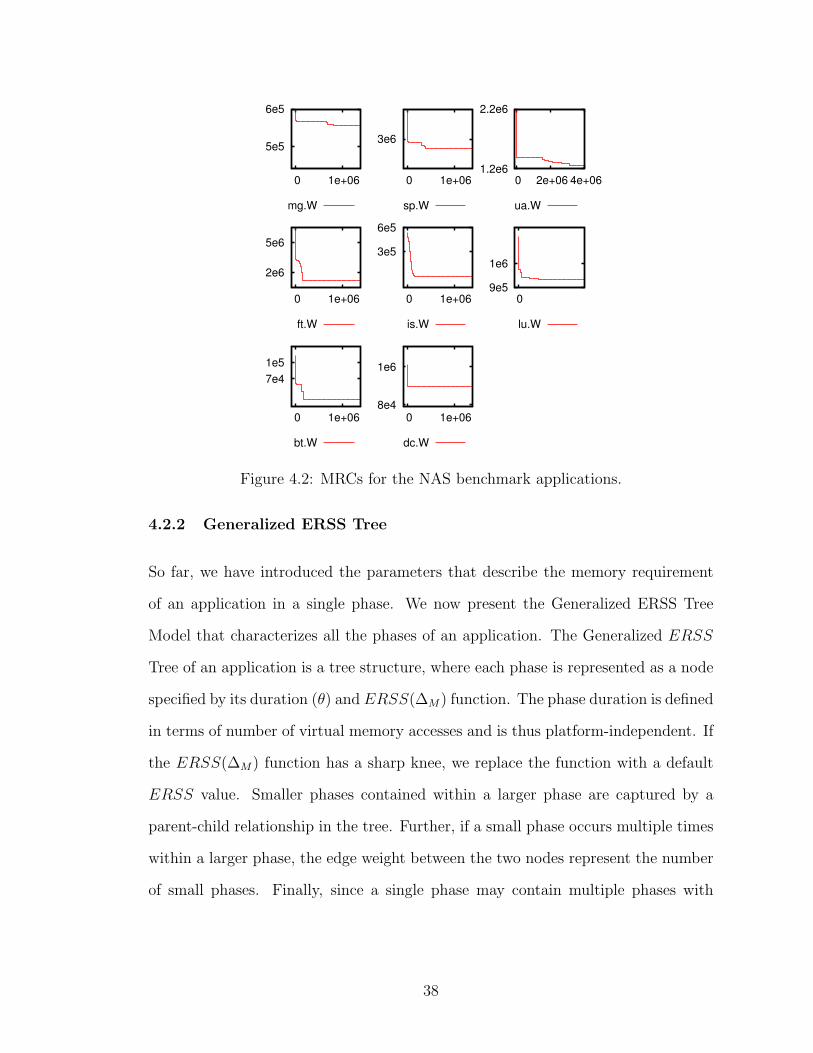
A common method to estimate reuse set sizes (RSS) is using the miss rate curve
(MRC) which characterizes the cache miss rate that the workload would experience
at various cache sizes (see Figure 4.4). If we take one of the MRCs on the figure
and follow the curve from left to right, the RSS is the size at which the curve
becomes completely horizontal: any increase in cache size is futile when attempting
to decrease misses. Given the MRC, the cache can be provisioned to match the
reuse set size. This works well when a single workload uses the cache exclusively.
However, when multiple workloads share a storage cache, this approach does not
usually work.
0.4
0.6
0.8
1
0 155 251 406
Mis
s r
ate
Cache size in MB
ab
0.4
0.6
0.8
1
0 431
Mis
s r
ate
+ =
combined
406 431
wastage
Figure 4.4: Working set sizes and wastage on multi-workload MRC. Curves a and bare the MRCs of the individual workloads and combined is the MRC of both a andb running together. The reuse set sizes (RSS) of a, b and combined are 155, 251and 431 respectively. Notice how the RSS of combined is larger than the sum of aand b’s RSS.
Figure 4.4 illustrates how using individual workload MRCs is not adequate for
computing the combined cache requirement of two workloads. We ran two web server
traces from a university CS department for a day on a aging-LFU cache simulator.
We ran the two workloads first individually to obtain their reuse set sizes (RSS); we
40
did the same next but with the two workloads running at the same time to obtain
the RSS of the combined workload. We would expect the combined workload to
have a RSS equal to the sum of both individual RSS. However, the real RSS is
25MB more than the expected 406MB. We term this additional cache requirement
on reuse set sizes as wastage.
Several researchers have observed this problem for Least Recently Used (LRU)
caches [TSW92a, QP06a, STW92, KVR10] when two or more applications are shar-
ing a cache. The common observation they made was that a cache is not guaranteed
to entirely host the reuse sets of two applications even when the sum of the indi-
vidual reuse sets sizes are less than the cache size. This observation also triggered
the division of Level 1 CPU caches into instructions and data for most architec-
tures [STW92, Int09].
To quantify the extent of wastage with many workloads, we replayed combi-
nations of I/O workloads from a set of eight actively used systems including 2
production web servers, 5 student desktops and a production University CS depart-
ment email server. Workload durations were three hours and combination workloads
were created by merging based on timestamps, an approximation of how the I/O
scheduler would combine the I/O streams before dispatching to the backing store.
The combined workloads were replayed on simulators using both LRU (Least Re-
cently Used) and an aging-LFU (Least Frequently Used) replacement policies. We
used two migration policies for each replacement: on-demand migrations where a
block is moved to the cache just after a miss, and periodic migrations where blocks
are moved to the cache every 5 minutes. On-demand migrations are necessary for
CPU and buffer caches as blocks must ultimately be used from the cache. On the
other hand, SSD caches can be populated periodically, and most caching systems
or first level tiers [GPG+11] do so in order to not interfere with the foreground I/O
41
0 2 4 6 8
10 12 14 16
2 3 4 5 6 7 8W
asta
ge in %
Number of simultaneous workloads
y=1.4x+2.7y=0.7x+0.5y=0.4x+0.2
0
100
200
300
400
500
600
Wasta
ge in M
B
LRU on-demandLRU periodic
LFU on-demandLFU periodic
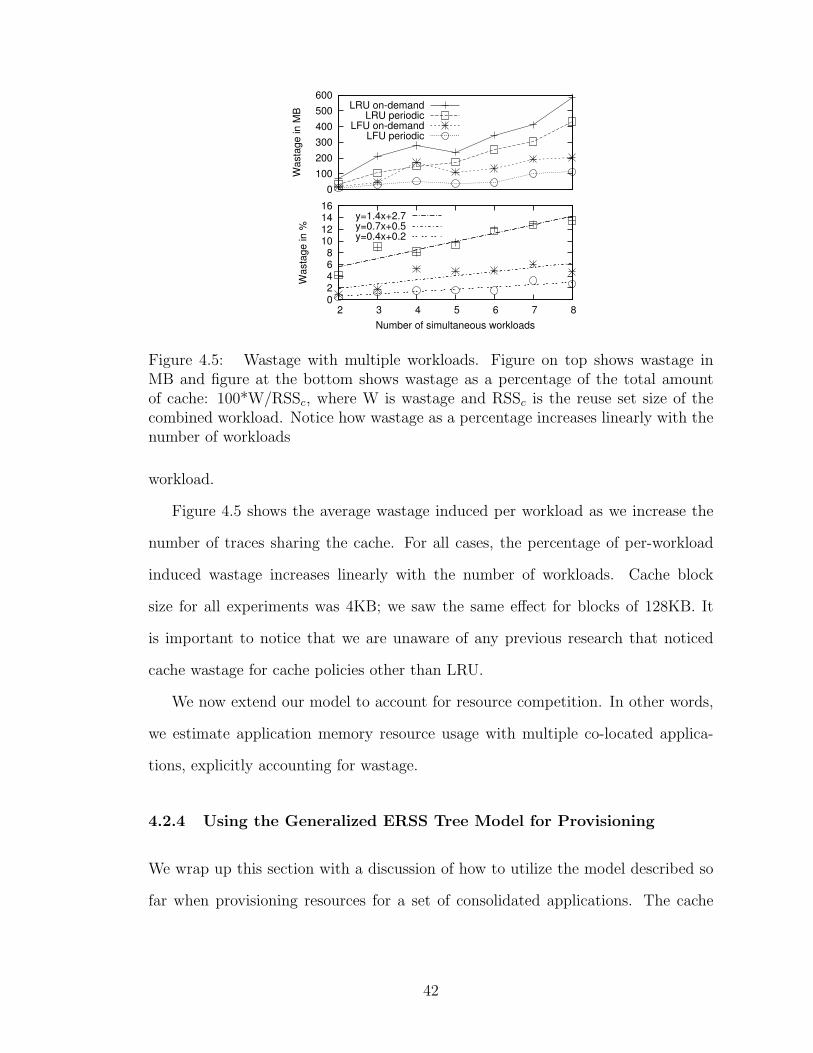
Figure 4.5: Wastage with multiple workloads. Figure on top shows wastage inMB and figure at the bottom shows wastage as a percentage of the total amountof cache: 100*W/RSSc, where W is wastage and RSSc is the reuse set size of thecombined workload. Notice how wastage as a percentage increases linearly with thenumber of workloads
workload.
Figure 4.5 shows the average wastage induced per workload as we increase the
number of traces sharing the cache. For all cases, the percentage of per-workload
induced wastage increases linearly with the number of workloads. Cache block
size for all experiments was 4KB; we saw the same effect for blocks of 128KB. It
is important to notice that we are unaware of any previous research that noticed
cache wastage for cache policies other than LRU.
We now extend our model to account for resource competition. In other words,
we estimate application memory resource usage with multiple co-located applica-
tions, explicitly accounting for wastage.
4.2.4 Using the Generalized ERSS Tree Model for Provisioning
We wrap up this section with a discussion of how to utilize the model described so
far when provisioning resources for a set of consolidated applications. The cache
42
provisioning approaches in the literature today all suggest allocating an amount
equal to the sum of the working sets of each application. The proposed ERSS
metric leads to a more accurate estimate of the cache requirements of an application
but yet assumes that the application is running in isolation. To address this gap, we
modeled the impact of contention due to co-located applications with the additional
parameter of Wastage that enable us to perform cache provisioning more reliably.
If we assume an LRU-based eviction policy (typically employed in caches today),
then applications memory lines can get evicted by applications that are not reusing
their elements. If an application access a memory line, it will get to the top of the
LRU stack, as it is the most recent line. This happens even if the line is not reused
again. The problem is that this line can evict the line of a second application that
will actually be reused: a useful line is evicted by a useless line. This is more likely
to occur when an application accesses these useless lines faster than the second
application reuses its lines. We define the rate at which an application i reuses its
lines as Reuse Rate ρRI , and the rate at which an application j accesses lines that
will not be reused as Flood Rate ρF j.
Definition 5 Reuse Rate for an application i during a phase. We define
reuse rate as ρRi = Ri/n, where Ri is the number of reuses performed
by application i and n is the total number of accesses by all applications
during the phase.
Definition 6 Flood Rate for an application i during a phase. We define
flood rate as ρFi = Fi/n, where Fi is the number of accesses to lines that
are not going to be reused during the phase by an application i, and n is
the total number of accesses by all applications during the phase.
43
During a phase, we define the wastage that an application i flooding a cache
incurs on an application j reusing elements as Wi→j.
Definition 7 Wastage from application i to j during a phase. We define
wastage as:
Wi→j = ⌈ERSSj∗ρFi
ρFi+ρRj⌉ (4.1)
when i! = j and 0 otherwise.
Wastage has an cumulative effect: an application flooding the cache affects all
other applications sharing it. We observed this effect in figure 4.5.
Definition 8 Wastage: A set of N applications sharing a cache incur
wastage on each other as:
W =∑N
i=1
∑Nj=1 Wi→j (4.2)
Here we make a simplifying assumption that wastage can be characterized by the
sum of pairwise effects. In reality, arbitrary sets of applications can jointly impact
each other in terms of cache usage. We now define the isolation condition for a set
of applications sharing a cache.
Definition 9 Isolation Condition: A set of N applications Ai sharing a
cache of capacity C are said to satisfy the isolation condition iff the fol-
lowing condition holds:
∑Ni=1 ERSSi +W ≤ C (4.3)
Before consolidating, it is critical that the isolation condition holds at various
levels of the memory hierarchy to ensure performance isolation. To determine if this
is true, the ERSS tree for each application must first be created. All phases that
44
were resident in a specific level of the memory hierarchy when the application ran
stand-alone is determined. Consequently, the phase, termed Pbig, with the largest
ERSS for each application and whose duration is above a pre-determined threshold,
is identified. These are the phases for which we would need to ensure the isolation
condition (Equations 4.3) must be met. This process is then applied to each level of
the cache hierarchy for a given system to conclusively establish if the applications
can be consolidated on the given hardware. Finally, in applications with hierarchical
phases (smaller phases embedded within larger ones), the hit rate and ERSS for
larger phase includes access to memory lines of the smaller phase as well. However,
an accurate characterization of the larger phase should be made independent of
the accesses to any embedded smaller phases. Hence, the ERSS and Hit Rate is
calculated as the marginal (or additional) ERSS and Hit Rate respectively over the
smaller phase.
4.3 Building the Generalized ERSS Tree Model
We now present a methodology to construct a generalized ERSS tree (henceforth
referred to as ERSS tree), representing an instantiation of the Generalized ERSS
Tree Model for the application under consideration.
4.3.1 Methodology Overview
The Generalized ERSS Tree Model is a recursive model with a subtree composed
of smaller phases embedded within a larger phase. Our methodology to create the
ERSS tree is based on the observation that one can create a coarse tree (with few
levels) and increase the resolution of the tree by identifying phases for additional
resource sizes iteratively. We start with the root node of the tree which corresponds
45
to the largest unit in the memory hierarchy (typically disk-based storage) and use a
three-step node generation process to identify and incorporate phases of the longest
duration. We then recursively refine it to include phases at lower levels of the tree
by iteratively applying the node generation process for decreasing sizes of memory.
To deal with noise or data-dependent execution, the process is repeated for multiple
runs and only the phases that are identified in all runs are included in the model.
The node generation process consists of
1. Refinement Level Identification. In this step, we identify the next size of
memory resource, Availmem, (e.g, 2 MB) using which the tree should be refined
further.
2. Resource Limited Execution. In this step, we identify the memory resource
R that best matches Availmem and ensure that the application executes with only
Availmem amount of R available. The techniques to ensure this reservation depends
on the memory resource R and is detailed in Sec. 4.3.3. This step also creates an
execution trace including the hits and misses for application requests to the specific
resource, which serves as the input to Atomic Refinement step.
3. Atomic Refinement. This step uses the execution trace following the Resource
Limited Execution to refine the ERSS tree. Atomic refinement is described in detail
in Section 4.3.4.
It is straightforward to use the ERSS tree for an application generated using
the above node generation process iteratively in a consolidation scenario. Prior to
consolidation, we refine the tree to closely reflect the proposed allocation of various
memory resources for each application to determine actual ERSS sizes at various
levels of the memory hierarchy. We then use Equation 4.3 to determine if the
planned allocations are adequate or over-provisioned for the dominant phases at
each memory level. Next, we elaborate on the steps of the node generation process.
46
4.3.2 Refinement Level Identification
The node generation process must be applied for various levels (sizes) of memory
resources in order to create the ERSS tree. A significant advantage of the three
step process is the complete flexibility in refining the ERSS tree at the required
granularity. The refinement level identification step allows a model that focuses
on interesting parts of the tree to create higher resolution sub-trees. Selection of
the refinement level in this step would ideally be based on the level of provisioning
granularity required and candidate allocation sizes for each memory resource. Thus,
the methodology allows easy refinement of the tree for the range of the actual
memory assignments (e.g., at all candidate sizes for the L1, L2, and L3 caches
and main memory).
4.3.3 Resource Limited Execution
Resource limited execution facilitates application execution for a specific size of the
resource under consideration and records the memory hit and miss counters for the
application. For example, to identify the memory phases at ERSS = 2MB on a
machine with 64KB L1 and 4MB L2, a user would run the application with a resource
limited L2 cache size of 2MB and measure the L2 hit and miss rates. The hit and
miss rate information is available by default on most commodity platforms for all
levels of the memory hierarchy. We now present techniques for resource limited
execution of the application for a user-specified size limit for various memory levels.
External Memory. The external memory phases of an application form the
highest level of the ERSS tree. In legacy systems, the external memory data for an
application is different from the other levels of memory in the sense that there are no
resource miss events at this level. Consequently, phases and ERSS descriptions in
47
legacy systems are inconsequential for application performance. On the other hand,
these considerations are relevant for systems which employ an external memory
device as a cache. Examples of such systems abound in the literature including
performance-improving caches [AS95, BGU+09] and energy-saving caches [krm08,
UGB+08]. Such external memory devices are typically block devices (e.g., disk drives
or solid-state drives). Controlling the size of a block device cache for resource limited
execution is achieved easily with block device partitioning. Block I/O tracing tools
are available in most commodity operating systems (e.g., Linux blktrace [Axb07])
which work irrespective of the type of the underlying block device. These tools
support execution tracing at the partition granularity to ensure non-interference
with other block I/O operations in the system. By associating the cache partition
block accesses with hits and non-cache partition block accesses to misses, hit and
miss events can be recorded.
Main Memory. Techniques for limiting the main memory (henceforth RAM)
available to the entire operating system to a specific fraction of the physical RAM
exist in many systems. In AIX, we use the rmss command to ensure that the
operating system can use only the specified size (fraction) of the total physical
memory. Once we ensure memory reservation, we run the application and log the
page fault rate through the lifetime of the application.
The Atomic Refinement step of the node generation process optionally uses the
hit rate for higher accuracy. The hit rate for memory pages can be estimated using
a binary rewriting API like Dyninst [Ope]. The Dyninst API can attach itself to an
executing binary and dynamically instrument the application to get the complete
memory trace. An alternative approach to obtain RAM hit rates is to use a full
system simulator (e.g., Mambo, QEMU, etc.) and run the application with different
RAM configurations.
48
Processor Caches (L1 / L2 / L3). Various techniques have been proposed
to partition the L2 cache at both hardware and software levels. These techniques,
however, are not available in commodity systems and implementing these intrusive
changes on a production server is not always feasible. The lack of flexible user-
level partitioning schemes and fine-grained cache line monitoring counters creates
significant challenges in further refining the models for cache resident phases in a
non-intrusive fashion.
We developed and implemented two new techniques to partition the cache and
record the hit and miss events. Our techniques are accurate for L2 and L3 caches and
work with limited accuracy for L1 cache as well. The first technique uses ideas from
page-coloring typically employed by the operating system [LLD+08, STS08] to en-
sure that the application uses only a fixed amount of cache. However, this technique
requires application re-compilation. Our second technique, named CacheGrabber
runs a probe process on the server that continuously utilizes a fixed amount of cache
resources, reusing the utilized cache in a manner such that it becomes unavailable
to the application being characterized. In addition to these, we directly implement
two previously proposed techniques for inferring the miss rate curve (MRC) for
caches. The first technique uses a cache simulator to simulate caches of different
sizes which directly leads to the MRC. The second technique uses sampling of per-
formance monitoring unit (PMU) registers to create a memory trace and replays the
trace through a LRU stack simulator to infer the MRC [TASS09]. Further details
on these techniques are beyond the scope of this thesis.
4.3.4 Atomic Refinement
The atomic refinement step uses the hit and miss events in the execution trace to
refine the ERSS tree for that level of memory. If hit rate information is not available
49
for a memory level, only the miss rate information is used for the refinement. There
are two components to atomic refinement at a high level: (i) it detects phases and
phase transitions, size estimates, and the instruction time-line during which they
occur and (ii) it uses these phases for ERSS tree refinement. This ability to detect
phases with only the hit/miss information at various levels of the memory hierarchy
makes model instantiation feasible in real data center environments.
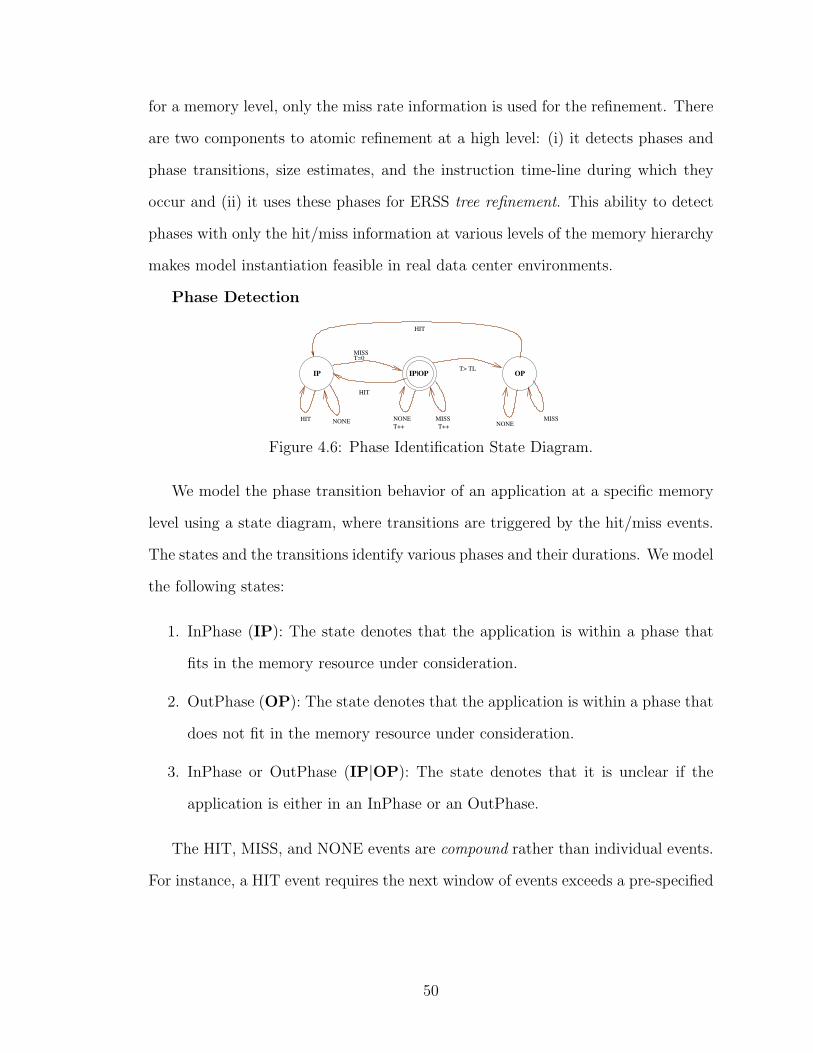
Phase Detection
IP
HIT NONE
HIT
MISST=0
OP
MISSNONE
HIT
NONE
T++
MISS
T++
T> TLIP|OP
Figure 4.6: Phase Identification State Diagram.
We model the phase transition behavior of an application at a specific memory
level using a state diagram, where transitions are triggered by the hit/miss events.
The states and the transitions identify various phases and their durations. We model
the following states:
1. InPhase (IP): The state denotes that the application is within a phase that
fits in the memory resource under consideration.
2. OutPhase (OP): The state denotes that the application is within a phase that
does not fit in the memory resource under consideration.
3. InPhase or OutPhase (IP|OP): The state denotes that it is unclear if the
application is either in an InPhase or an OutPhase.
The HIT, MISS, and NONE events are compound rather than individual events.
For instance, a HIT event requires the next window of events exceeds a pre-specified
50
threshold percentage of hits, rather than a single hit event; if hit events are un-
available, then the we conversely use the requirement that the percentage of misses
should be below a certain threshold. A MISS event is defined similarly. A NONE
event is one which is neither a HIT nor MISS.
The thresholds used in the above definitions can be computed from the miss rate
trace (typically available for all memory levels) for the application as follows. Using
the histogram of the miss rates in the trace, we define the lower threshold at the 10th
percentile and the upper threshold at the 90th percentile. Due to the steep nature
of ERSS(∆M) (Figure 4.2), such a thresholding is sufficient to identify if the phase
fits in the available memory resource or not.
The starting state is (IP |OP ), indicating that the initial state is unknown. A
HIT event in (IP |OP ) indicates the start of a phase that fits in the available memory
resource and we transition to (IP ) state. The absence of a HIT indicates either a
phase transition or an OutPhase state. We distinguish between the two by using a
threshold TL to limit the maximum length of a phase transition. If the time T spent
in (IP |OP ) exceeds TL, an OutPhase is detected marked by a transition to (OP )
state. A MISS event from (IP ) indicates a phase transition (IP |OP ) and a HIT
event in (OP ) indicates the start of a phase that fits in memory and is captured by a
transition to (IP ). The detailed state transition diagram is described in Figure 4.6.
Tree refinement. The Tree refinement step uses the node generation process
to add new levels in the ERSS tree and/or refine the existing nodes of the tree.
The choice of the level to refine is closely determined by the target architecture and
the sizes of the various hardware resources in the memory hierarchy. Let Mi be the
memory level currently being investigated and let ERSSP be the ERSS for a parent
phase P , s.t. ERSSP > Mi The goal is to determine sub-phases within P that may
potentially be impacted by the memory level Mi. If phase detection within P for
51
memory level Mi leads to more than one child phase (IP or OP ), a child node for
each child phase is added to the parent node. Each InPhase (IP ) fits in Mi memory
and is marked with an ERSS of Mi in the child node, whereas the ERSS of each
OutPhase (OP ) node is set to the parent memory value Mi−1 (as it does not fit
in the memory level Mi). If the node generation process with memory level Mi
does not identify more than one phase, the parent phase is refined in the following
manner. If the number of misses in the parent phase is found to be equal to those
observed with Mi, we refine the ERSS value at the parent node as Mi. However,
if the number of misses are larger at the memory value Mi, we retain the earlier
ERSSP value for the parent node.
4.4 Experimental Validation of the Model
We now evaluate the need and accuracy of Generalized ERSS Tree Model. In
particular, we address the following questions.
1. What is the need for a unified ERSS tree model?
2. How do reuse rate and flood rate impact memory provisioning?
3. Is the model sufficiently accurate to ensure isolation for consolidated work-
loads?
4.4.1 Experimental Setup
We used three different experimental testbeds in our evaluation. Our first test-bed
was an IBM JS22 Bladecenter cluster with 4 3.2 GHz processors and 8 GB RAM
with 4MB L2 cache. The experiments conducted on this test-bed used the L2
hit/miss counters available on the system. Our second test-bed was the QEMU full
system emulator. QEMU runs memory accessing instructions natively on the host
52
via dynamic binary translation. We modified the software-MMU version of QEMU
and inserted tracing code at binary translation points. Specifically, each time a
translation block (i.e., binary blocks between jumps and jump return points) is sent
to the inline compiler, we insert code for recording every load and store instruction.
Since the addresses used by loads and stores may be unknown at translation block
compile time, the appropriate register values are recorded at run time. Timestamp
information is collected from the tsc register in x86 and IA64. We ran Linux on the
modified QEMU emulator configured with 1.8GB of physical memory with several
workloads. The emulator itself ran on a 2.93 GHz Intel Xeon X7350 processor. The
traces were then fed into a LRU stack simulator to build the MRCs. As our final
test-bed, we used Valgrind to perform fine-grained analysis on single application
instances and their resource usage behavior across the memory hierarchy, primarily
for generating data to support our approach leading to the Generalized ERSS Tree
Model.
Two sets of workloads were used in conducting the evaluation. The first set
were the daxpy and dcopy benchmarks from the Basic Linear Algebra Programs
(BLAS) library [BDD+02], which represent building blocks for basic matrix and
vector operations. We modified these benchmarks to control the size of memory
used, the number of iterations, and injected appropriate idle periods to program-
matically control memory access rates. These benchmarks mimic behavior common
in many high-performance, scientific computing workloads and the fine-grained con-
trol allowed us to experiment with a wide variety of memory reuse and flood rates.
Our second set of workloads are from the NAS Parallel Benchmark [NAS]. The
NAS benchmarks mimic a wide spectrum of representative application behaviors,
from CPU intensive to memory intensive. It also includes benchmarks that repre-
sent computational science applications (e.g., bt captures the basic calculation of
53
Computational Fluid Dynamics).
4.4.2 The need for the Generalized ERSS Tree Model
We start by motivating the need for a model such as the Generalized ERSS Tree
Model to completely describe the resource usage characteristics of applications, in-
cluding the need for the ERSS metric for characterizing phases and the hierarchical
ERSS tree model for characterizing the overall resource usage of an application.
RS[>1]RS[>5]RS[>10]ISERSS
0.00 2.00 4.00 6.00 8.00
10.00 12.00 14.00 16.00 18.00 20.00
is mg bt ft sp ua
Siz
e (
MB
)
100
1000
10000
100000
mg sp ua ft is lu bt ep
Siz
e(K
Byt
es)
L1 only
L1 or L2
L2 only
L2 or L3
L3 only
ERSS
(a) (b)
Figure 4.7: (a) IS, RS, ERSS for one phase. (b) ERSS of various phases for NASapplications.
Need for the ERSS metric: We first examine the need for the new ERSS
metric introduced in this work for describing working set sizes within a single phase.
Specifically, we study if the default ERSS for a phase can be inferred from known
measures such as the Inuse Set (IS) or the Reuse Set (RS). We refine the reuse
set to require at least a specified number (k) of reuses in a phase, allowing us to
define multiple notions of reuse denoted as RS[> k]. We used the Valgrind test-bed
and the NAS applications to characterize the resource usage behavior within phases
in real applications. Figure 4.7(a) depicts the IS, RS and ERSS for a randomly
chosen phase within NAS benchmark applications. It is evident that the ERSS
metric is distinct from all the alternative measures considered, including variants of
reuse set. Since the ERSS characterizes application resource usage more accurately
54
than either the IS or RS, it is evident that an accurate memory model should be
based on ERSS and new techniques should be designed to accurately characterize
it.
Need for an ERSS tree: Resources at various levels of the memory hierarchy on
stand-alone servers typically have disjoint ranges and provisioning can be handled
independently for each resource. First, we show that in production, virtualized data
center settings, depending on the type and number of co-located VMs, the amount of
resource at individual levels that would be available to a single VM may no longer
fall into pre-specified ranges. Further, we demonstrate that a single application
may have multiple phases and the ERSS values for these phases may span across
multiple levels of the memory hierarchy.
To accomplish the above, we used the Valgrind test-bed to compute the ERSS
values for all distinct phases of the NAS benchmarks. Further, to get an estimate
on the range of memory resources available to individual applications, we examined
the configuration data sheet of a production data center with virtualized servers
hosting one or more VMs. Based on the placement per the configuration data sheet,
we divided the L1 and L2 cache resources to each VM in proportion to the CPU
allocation. We take the maximum/minimum L1 (or L2) cache available to any VM
across all servers in the data center as an upper/lower limit on the cache that a VM
can use. Thus, we noted that as opposed to a fixed cache size on stand-alone servers,
the cache sizes on virtualized servers changes significantly based on the number of
hosted VMs.
To remove the influence of outlier configurations specific to the data center, we
discarded the top 10% VMs with the largest cache sizes. We then plotted the ERSS
for various phases of NAS applications to identify the memory resource that they
would fit into in Figure 4.7(b). We observed that most workloads encompass more
55
than one resource level owing to distinct ERSS values within phases of different
granularities. Further, the ERSS of some phases have sizes that overlap in the
range for two memory resources. Hence, during memory provisioning, if a phase
does not fit in a low level cache, it may be possible to provision a higher level cache
for the phase. This underscores the importance of a unified model that captures
resource usage across all levels for better cache and memory provisioning.
Table 4.2: Distinct, dominant phases for NAS applications.
Need for phase duration: We use the phase duration (θ) parameter in our
model to characterize the relative importance of a phase. Table 4.2 presents the
total number of phases as well as the phases that are long-lived. We define a phase
as long-lived if running the phase located within and outside of its required memory
level leads to a difference of at least 10% in total number of misses at that memory
level (across all phases). We noted (not shown) that even for applications with a
large number of distinct sized phases, we can safely ignore a large number of the
phases (e.g., 10 out of 12 phases for bt are very small). It is adequate to provision
memory resources only for long-lived phases because doing so would lead to little or
no impact to application performance.
4.5 Related work
The most popular model for application main memory usage is the classical working
set model and its refinements [Den80, Den68b]. The working set model is based on
the concept of resident set, or the set of active memory pages within an execution
56
window. Once the resident set for an application is identified, the operating system
may allocate memory to the application accordingly. A second popular model
for resource usage in the memory hierarchy is the Miss Rate Curve (MRC) model,
typically used to allocate processor caches [RSG93, TASS09]. These models capture
the memory usage characteristics of an application during a window of execution,
termed as a phase. Phases are a third important memory resource usage characteris-
tic of applications. Batson and Madison [BM76] define a phase as a maximal interval
during which a given set of segments, each referenced at least once, remain on top
of the LRU stack. They observe that programs have marked execution phases and
there is little correlation between locality sets before and after a transition. Another
important observation made by Batson and Madison and corroborated by others is
that phases typically form a hierarchy [RSG93, KS00]. Hence, smaller phases with
locality subsets are nested inside larger ones. Rothberg et al. [RSG93] present such
a working set hierarchy for several parallel scientific applications. However, the
working set hierarchy does not capture the frequency of each phase and its impact
on performance.
In contrast to previous work, we show that the amount of memory resource
required by an application is more accurately reflected by a new metric that we
introduce, the Effective Reuse Set Size (ERSS). Further, memory provisioning re-
quires the identification of all the phases of an application and their durations to
ensure that dominant phases are resident in a sufficiently fast level of the mem-
ory hierarchy. An important aspect of memory usage not captured by any existing
model is the rate of memory usage by an application. The Reuse Rate and the
Flood Rate significantly determine the amount of memory resource required by an
application. When multiple applications share a common memory resource, these
rate parameters dictate the amount of memory available to each application. Hence,
57
memory provisioning in a consolidated virtualized environment requires significant
refinements to existing memory usage models for them to be applicable.
4.5.1 Mechanisms to build memory usage models
Several techniques have been proposed to identify the optimal working set during
program execution. Carr et al. [CH81] combine the local working set with a global
clock to design WSClock virtual memory management algorithm. Ferrari et al. re-
fine the classical working set to variable interval size, where the size of the interval
is controlled using three parameters – the minimum interval size M , the maximum
interval size L, and the maximum page fault Q [FY83]. The page-fault frequency
(PFF) algorithm [CO72, GF78] uses the PFF concept to determine the resident set
size, enlarging it if the PFF is high and shrinking it otherwise. There are two popular
approaches to infer the MRC for an application. The first approach creates the MRC
statically by running the application multiple times, typically in a simulator with
different memory resource allocations [RSG93, KS00, WOT+96]. A second approach
uses a memory trace and a LRU stack simulator [KHW91] to infer the MRC. MRCs
in filesystem caches have been estimated using ghost buffers [KCK+00, PGG+95].
Dynamically estimating cache MRCs is much more challenging and estimation meth-
ods exist only on specific platforms [TASS09, ZPS+04a]. Detecting phase transi-
tions for taking reconfiguration actions has been explored before. The Dynamo
system [BDB00] optimizes traces of the program to generate fragments, which are
stored in a fragment cache; an increase in rate of fragment formation is used to
detect phase transition. Balasubramonian et al. [BABD00] use the dynamic count
of conditional branches to measure working set changes. Dhodapkar et al. com-
pute a working set signature and detect a phase change when the signature changes
significantly [DS02].
58
4.6 Summary
We have presented the Generalized ERSS Tree Model that addresses two signifi-
cant gaps in our current understanding of application resource usage characteristics
for the multi-level memory hierarchy. First, the model characterizes the memory
resource usage of an application for its entire lifetime with a high degree of ac-
curacy. We have presented a methodology to build model instances for arbitrary
workloads on commodity hardware without making intrusive changes. Second, and
more significantly, this model can be utilized for highly accurate provisioning of
the memory hierarchy in a shared application environment. Our model compre-
hensively addresses the resource usage characteristics when competing workloads
introduce non-trivial isolation requirements. It does so by explicitly characterizing
the complex interaction between the resource reuse rates and flood rates of various
workloads at each memory level. We have demonstrated that the model can be
used to predict when isolation conditions are not satisfied as well as to determine
resource provisioning requirements to ensure application performance isolation in
shared environments. Finally, by experimenting with a wide mix of applications,
we have established the utility and accuracy of our model in practice. In the next
chapter, we pursue a complementary direction to reduce the contention introduced
by co-located workloads that applies to partitionable caches.
The work presented in this chapter was reported in PERFORMANCE 2010
[KVR10] and MASCOTS 2011 [KVR11].
59
CHAPTER 5
PARTITIONING FOR EXTERNAL MEMORY CACHES
In the previous chapter we observed that sharing caches can lead to wasted space
and increases linearly with the number of workloads. In this section, we propose
some solutions to reduce cache wastage for out of memory caches, specifically flash-
based solid state drive (SSD) caches for disk. It is important to notice that while
this chapter considers and valuates proposals for flash-based caches, the system
proposed would apply to other persistent caching devices with equivalent or better
performance characteristics relative to flash.
Previous researchers noticed the occurrence of wastage in CPU and RAM caches
and proposed simple cache partitioning techniques in order to minimize it. These
methods are based on assumptions made over the replacement algorithm used and
the type of accesses. However, these assumptions do not hold for external memory
caches, and can lead to large inaccuracies. For instance, external memory caches
do not require blocks to be moved to the cache after a miss (on-demand) and many
external memory caches move blocks to the caches periodically.
We propose addressing these inaccuracies by not making any assumption about
the frequency of the migrations, the replacement algorithm used, nor the shape of
the miss rate curve. We propose having an iterative partitioning algorithm using
probabilistic searches that is capable of achieving several performance goals like:
minimizing overall miss rate, or minimizing the sum of VMs’ average latencies.
We implemented a partitioned write-back host-side SSD cache for virtual disks
in the VMware ESX hypervisor. To maintain data consistency after crashes and
reboots, we keep the disk-to-SSD address mappings persistent and all cache allo-
cations and demotions journaled on the SSD. Cache partitions are managed by a
local LRU or LFU replacement policy with all SSD/disk block migrations being
60
performed periodically. The partitions are resized periodically to adapt to workload
and storage changes.
Experimental results show that partitioning an SSD cache can accelerate the
boot time of 28 virtual desktops from 39 using a unified LFU cache to 32 seconds on
the partitioned case; this improvement was attributed to a reduction in SSD cache
wastage. Microbenchmark-based experiments demonstrate that the system is able
to balance the average latencies of two mixed read/write workloads with less than
5 % of error. Finally, for a workload consisting of half random reads and writes, the
system maintains a crash consistent cache at the cost of adding 100 ms of latency
to less than 1 % of the accesses, but without adding any overhead to the average
latency.
5.1 Background on cache partitioning
The wastage problem can be addressed with cache partitioning. Most partitioning
approaches in the literature are based on miss rate curves (MRC), which define the
miss rate incurred by a workload for a given cache size. We illustrate the use of miss
rate curves to find the allocation that optimizes a specific goal – minimizing the
sum of average VM miss rates. Assume there are two VMs randomly reading from
files. VM 1 reads a file of 2 GB and VM 2 reads a file of 1 GB. The MRCs of both
VMs are showed at Figure 5.1. The miss rate is 1 for a cache size of 0 for both VMs
and miss rate is 0 for cache sizes greater than the files read (2 GB for VM 1 and 1
GB for VM 2). For an available 2 GB of cache space, we can try all combinations
and find that assigning 1 GB to each VM is the optimal choice. This partitioning
results in a total miss rate of 0.5 = 0.5 + 0 and is depicted as the shadowed regions
in Figure 5.1.
61
+
0 1 2 0 1 2
Cache space Cache space
VM 1 VM 2
Miss
rate
Miss
rate
cache
assigned
to VM 1
cache
assigned to
VM 2
0
1
0.5
0
1
0.5
Figure 5.1: Example of cache partitioning. A cache of size 2 is partitioned acrosstwo VMs. Both VMs MRCs are shown with the optimal assignment of cache shownin grey: one cache unit to each VM.
Mis
s-r
ate
Cache size
MRCConvex minorant of the MRC
Figure 5.2: Example of MRC and its convex minorant.
While this seems straightforward, in practice, the number of possible partitions
grows exponentially with the number of workloads. Rajkumar et al. prove that
optimal cache partitioning is NP-hard [RLLS]. Therefore, approximation algorithms
have been proposed to solve the partitioning problem. Stone et al. first proposed
using convex hulls as an intermediate step for solving this problem [STW92]. This
approach and its variants have been used by several researchers for partitioning CPU
and main memory or storage buffer caches since then [GJMT03, QP06b, PGSK09,
PSPK09, SLG+09, SRD04, TSW92b, ZPS+04b].
The convex hull approach Current approximation algorithms for cache parti-
tioning largely follow the convex hull approach. The convex hull of a set of points
is the smallest convex polygon that contains all the points. The convex minorant is
the greatest convex curve lying entirely below this polygon. An example is shown
in Figure 5.2. The partitioning algorithm first computes a convex minorant for the
62
MRC of every VM, and then applies a greedy search algorithm on the minorants to
find a close-to-optimal partitioning of cache space as follows:
1. Calculate the convex minorant mk(sk) of the MRC for each VM.
2. Initialize partition sizes sk to zero.
3. Increase by one unit the partition size of the VM which would benefit the most
from the increase. The benefit for a VM k is mk(sk)−mk(sk+1). Notice that
the convex minorant is used to calculate this benefit.
4. Repeat the previous step until all cache space has been assigned.
Problems with the convex hull approach While the above approach works
well for CPU and main memory buffer cache partitioning. However, it fails when
used for host-side SSD caches and will fail for other out-of-core caches with similar
properties. The SSD cache itself is not in the I/O path for all data, unlike CPU
and main memory caches, requiring additional work to access items from the cache.
Consequently, I/O request sizes that are larger than the cache block size require
special consideration. For a multi-block request, some blocks could be resident in
the SSD cache while others are not. A request is a cache hit only when all the
blocks accessed are in the cache. The effect of this is that for a specific cache size,
the chances of missing it increase with the request size. For example, if the cache
size is 10 MB, requests of 1 MB are more likely to miss more than requests of 4 KB.
Figure 5.3(a) shows the MRC for a workload that randomly reads a file of one
million blocks with a request size of one block. As expected, the miss rate decreases
as a straight line from 1 when there is no cache to a miss rate of 0 when the cache
has the size of the file. Figure 5.3(b) shows the MRC for the same workload but
with request size of 64 blocks. The curve becomes concave because as the size of
63
0 0.2 0.4 0.6 0.8
1
0 500000 1e+06 1.5e+06
Mis
s r
ate
(b) Cache size in blocks
rs = 1rs = 64
0 0.2 0.4 0.6 0.8
1
0 500000 1e+06 1.5e+06
Mis
s r
ate
(a) Cache size in blocks
rs = 1
Figure 5.3: MRCs for large requests sizes. (a) shows the MRC of a workloadaccessing a file of one million blocks with request size of one block and (b) showsthe MRC for the same workload and a slightly different one where the request sizewas increased to 64 blocks. Note how the MRC gets concave with a large requestsize.
the request increases the chances of hitting the cache decrease. The problem with
the convex hull approach is that both these workloads (a) and (b) will have the
same convex minorant and therefore will be treated the same way by the allocation
algorithm. This can lead to a substantial approximation error. For example, if the
workload had requests of size 64 and the algorithm assigned it half a million blocks
of cache expecting a miss rate of 0.5, in reality it would incur a miss rate of 0.8, an
error of 60%.
In summary, previous research noticed wastage for LRU caches and that the
cache partitioning problem needs to be solved with an approximation algorithm.
One such approach is using convex hulls as an intermediate step. We showed that
wastage occurs irrespective of the cache replacement policy. Further, we demon-
strated that the convex hull approach may lead to large errors when applied to SSD
caching. In the next section, we outline a new approach that works well with SSD
caches.
64
File
systems
VM 1 VM 2Guests
FiltersVirtual
disk 1
Virtual
disk 2
FS on
SSD
FS on
SAN
Data
mover
Global
scheduler
Figure 5.4: Solution architecture.
5.2 Solution overview
Host-side SSDs provide hypervisors a previously unavailable knob for storage per-
formance control. We propose that hypervisors manage this SSD directly as a cache
resource to be used within each VM’s storage access path. Hypervisors can thereby
control the storage performance of individual VMs directly by increasing or decreas-
ing the space made available in this additional cache layer.
Figure 5.4 depicts an architectural overview of the solution. Virtual disks man-
aged by individual VMs are distinct files stored within a file system managed by the
hypervisor. The VMs use these virtual disks to store their file systems and swap
spaces. In our solution approach, an administrator would assign some or all virtual
disks to SSDs for caching and specify goals related to performance maximization
and/or QoS on a per-VM basis.
The hypervisor then partitions the cache space across virtual machines in or-
der to meet these goals. Each partition is managed by its own local cache policy
(i.e. a cache per partition). Since the SSD is not in the data path for blocks that
miss in the SSD cache, unlike conventional demand-based caches, our solution only
periodically changes to the set of cached blocks using a data mover. Further, un-
like previous solutions for CPU caches that continuously partition [TSW92b], SSD
65
System goal typeUnified Partitioned
cache cache
I. Overall performance√
(∗) √
II. Sum of VMs average performance N/A√
(∗) incurs wastage because of cache sharing.
Table 5.1: Supported goal types.
cache partitions in our solution are only periodically resized by the global scheduler
in order to adapt to stable changes in the workloads and the storage system.
We anticipate our solution to be used by administrators towards meeting several
types of system goals. Table 5.1 shows the types of goals that an administrator
can configure a partitioned SSD cache in our current implementation as opposed to
managing the SSD as a unified cache for all VMs. The administrator can choose to
(i) maximize overall performance which translates to minimize overall cache miss
rate or average I/O latency across all VM I/Os or (ii) maximize the sum of per-VM
average performance which would translate to a fairness goal.
In contrast, a unified cache can support only the first of the two goals above and
will incur unwanted cache wastage when doing so.
5.3 The Partitioning Algorithm
Every epoch, the SSD cache partitions are resized in order to achieve some goal
defined by the administrator (see Table 5.1). In this section, we describe the process
for meeting goal types I and II.
5.3.1 Partitioning for latency minimization
We predict the sum of latencies for a set of potential partitionings and then use the
one with the smallest sum using the following steps:
1. Construct an Miss Rate Curve (MRC) for each VM.
66
2. Use the MRCs to predict latency for all VMs at all possible cache sizes and
refer to this as the latency curve for the VM.
3. Use a probabilistic search on the latency curves to find the partitioning can-
didate that produces the smallest sum of VM’s latencies.
Step 1: MRC construction for SSD caches. We construct the MRCs using
the I/O accesses of the previous partitioning epoch. Based on Denning’s locality
principle [Den06] it is very likely that the MRCs of two consecutive partitioning
epochs are similar. Our MRC construction is an adaptation of Mattson’s stack
algorithm [MGST70b] to account for the unique characteristics of out-of-core SSD
caches including periodic cache allocations (or migrations) and requests larger than
the cache block size. Periodic migrations tend to move the MRCs up and requests
larger than the cache size should give the MRC a concave shape (as seen in Figure
5.3). The problem is that Mattson’s algorithm does not account for these effects.
Mattson’s stack algorithm was originally designed to create MRCs for the LRU
cache policy; however, it can be used for other policies (e.g., LFU [BEP11]). For
every access, the algorithm emulates LRU aging and maintains a histogram of stack
distances. This histogram maintains the hit count at every possible stack distance,
which is then traversed to create the MRC. Our first modification to the Mattson’s
stack algorithm is at the histogram maintenance step to record a hit only if all the
blocks of a request are in the cache. If the request has more than one block, we
update the histogram only for the block that has the largest stack distance. The
second modification is done in order to account for periodic migrations. The basic
idea is to maintain the histogram of stack distances for an LRU stack whose blocks
are only updated periodically (and not after every access). More specifically, we use
2 LRU stacks where the first LRU stack maintains the histogram and the second
67
implements aging. We update the blocks of the first stack with the second every
period in order to mimic the effect of a periodic migration. Finally, the MRC is
calculated by traversing the histogram of stack distances.
Step 2: Latency curves construction. We construct a latency curves for VMs
using MRCs computed using our modified Mattson’s stack algorithm. Latency pre-
diction can be done similar to the approach of Soundararajan et al. [SLG+09]):
Lat = MR ∗ LatSSD + (1−MR) ∗ Latdisk (5.1)
where Lat is the predicted average latency, MR is the miss-rate as obtained from the
MRC, and LatSSD and Latdisk are the VMs recently measured latencies for SSD and
disk. However, using previously measured latencies can lead to large inaccuracies.
A simple scenario where this can happen is when the prediction leads to IOPS
saturation on the disk, while the measurements are from an unsaturated state. For
example, if the current state Latdisk is low, then a prediction of latency at higher
miss rates would fail because Latdisk would not be low anymore.
We handle the latency prediction inaccuracy by iteratively applying our algo-
rithm until we converge to an equilibrium state. The system (1) plans a partitioning,
(2) resizes the caches, (3) measurse the resulting latencies, and restarts the whole
process again. We stop this process when the deviation between the measured and
predicted latencies converge to a difference less than a small constant.
Step 3: Probabilistic search. Once the latency curves have been created, we
use a probabilistic search to evaluate potential allocations. These allocations are
evaluated by adding up the latencies for all VMs at the potential partition sizes.
We chose simulated annealing (SA) [KGV83] as the probabilistic search to look for
68
the best partitioning. While classic hill climbing only allows changing to a better
solution, SA probabilistically allows changes that may degrade the solution.
5.3.2 Partitioning for all other performance goals
The previous approach for minimizing sum of VM latencies can be easily adapted
to meet other goals such as maximizing overall IOPS performace. For overall IOPS
maximization, the only difference is that instead of using latency curves we use IOPS
curves. IOPS maximization and sum of VMs averages reduce to the same problem:
maximizing the sum of VMs IOPS obtained from the SSD cache. We minimize the
inverse of IOPS (IOPS−1) and predict IOPS using the following equation:
IOPS =IOPSdisk
MR(5.2)
where MR is miss rate and IOPSdisk are the recently measured IOPS of the disk
only. This equation uses the observation that each time the disk has an I/O, the
SSD has (1−MR)/MR I/Os. Therefore, the total I/Os in a second are IOPSdisk+
IOPSdisk ∗ (1−MR)/MR.
5.4 Implementation
An implementation of our proposed partitioned cache is integrated into VMware
ESX hypervisor. As in many virtualization architectures, all I/Os initiated by vir-
tual machines are handled by the hypervisor. As illustrated in Figure 5.4, the virtual
disk layer of the hypervisor translates a guest I/O into a file I/O to be stored in the
hypervisor file system on a SAN. Our system intercepts all I/Os at the virtual disk
layer using a filter. An instance of the filter is attached to a specific virtual disk and
redirects all I/Os to the SSD on a cache hit or to the SAN on a miss.
69
5.4.1 Cache management
Caches, like virtual disks, are saved as files on a file system on the SSD. We use one
cache file per VM and partitioning is implemented by limiting the physical size of
these files. To simplify our prototype, we restrict VMs to only one virtual disk and
thus a single cache file. These cache files are populated during each “mover epoch”
by a data mover process that moves blocks to and from the SSD periodically based
on a cache policy. We implemented both LRU and aging-LFU replacement policies
for each cache partition. Typical cache replacement policies are designed for CPU
and buffer caches and therefore they need to move blocks to the cache directly after
a miss. We observed that for all the traces used in the motivation, we can improve
overall throughput by making such data movement periodically rather than in the
IO path. The global scheduler which is in charge of partitioning the SSD space
among the various cache files implements the partitioning algorithms presented in
the previous sections. The global scheduler runs every “partitioning epoch”, which
is typically five minutes.
5.4.2 Data consistency
We implement caches as write-back and special care needs to be taken to ensure
data consistency after system crashes and restarts. Write-back caches can contain
dirty data not present in the backing store. Therefore, VMs need to be restarted
by accessing the backing store in concert with all its cached data on SSD. We keep
the mapping information for cached data persistently in the SSD cache itself so that
it can be queried after VM crashes and restarts. To minimize the impact on I/O
performance, we journal the updates to these persistent mappings in memory and
then replay the journal before data mover migrations during each mover epoch.
70
5.5 Experimental validation
We now present an evaluation of the techniques proposed in this chapter using an
implementation in the VMware ESX hypervisor. We first list the questions that we
want to answer through experiments:
1. How does a partitioned cache perform compared to a traditional unified cache?
2. What are the performance overheads and where they are coming from?
3. How do these techniques adapt to specific storage characteristics such as slow-
writing SSDs?
5.5.1 Experimental Setup
We implemented our SSD caching system as a filter at the virtual disk layer of the
VMware ESX hypervisor. The cache block size is 128 KB, partitioning epoch is 5
minutes, and mover epoch is 1 minute long. We use the aging-LFU replacement
policy [RD]. The host was an AMAX with a SuperMicro H8DA8 motherboard
and two AMD Opteron 270 dual cores processors, each running at 2Ghz and 4GB
memory. An Intel X25-M was used as the host-side SSD attached to the host.
The backing store was an EMC Clariion CX4 Model 120. The data mover and the
hypervisor were configured to have an issue queue length of 32 pending IOs each.
Thus, the data mover migrates 32 blocks at a time.
We evaluated the system with a diverse set of workloads running on various
VM operating systems to verify robustness under a variety of conditions. We used
two kinds of VMs: a Linux Ubuntu VM with a 30 GB virtual disk, one virtual
CPU, and 1 GB of memory; and a Windows 7 VMwith 40 GB of virtual disk,
one VCPU, and 2 GB of memory. We evaluated using a mix of microbenchmarks
and macrobenchmarks. The microbenchmarks used IOmeter [iom] on Windows and
71
fio [fio] on Linux for workload generation. We configured them to use different IO
sizes, percentage of randomness and reads, and the number of concurrent IOs. The
IO engine used in fio was libaio. All experiments used 32 concurrent IOs unless
stated otherwise. The macrobenchmarks used were Filebench [McD] OLTP and
webserver workloads.
5.5.2 Partitioned SSD cache
In our first experiment, we evaluated the effectiveness when maximizing average
I/O throughput with the partitioned SSD cache when compared against a unified
cache. Both variants used the same implementation with the only difference that in
the unified case the partitions do not have local cache policies and are managed by
a unified cache policy. We fixed the total cache size in both variants to 6 GB. The
partitioned cache was configured to maximize overall IOPS.
20
25
30
35
40
45
50
0 5 10 15 20 25
Boot tim
e in s
econds
VM number (sorted by boot time)
PartitionedGlobal
Figure 5.5: 28 Virtual Linux desktops booting simultaneously using an 6 GB SSDcache. This figure shows the boot time using a global LFU cache and a partitionedLFU cache.
We compared both caching options when booting 28 Ubuntu 10.04 desktop sys-
tems. The comparison metric is rebooting time as measured by Bootchart [boo].
Rebooting was needed to warm-up the caches. Figure 5.5 shows the booting time
of all 28 machines for global and partitioned caches. The x axis is sorted by re-boot
time. Average boot time was 32 seconds with our partitioned cache vs. 39 seconds
72
using a unified cache. We attribute this difference to wastage. By partitioning the
cache, wastage is eliminated, and hence the VMs incur less SSD cache misses on
SSD, get more IOPS, ultimately improving the boot time. The parititioned cache
also reduces the variance in boot time relative to the unified case wherein some
VMs boot up to two times faster than others owing to some VMs getting as much
as 3 times more cache space than others. On the other hand, the partitioned cache
maintained all partition sizes approximately the same. The reason for this difference
in variance is that in the unified case, the cache allocations of specific VMs change
more rapidly than in the partitioned case, and therefore small changes in its working
set leads to changes in cache allocated to a VM.
5.5.3 Overheads
This experiment measures overhead by comparing performance between 3 config-
urations: (1) our partitioned caching system, (2) when the workload accesses the
backing store (SAN) directly without any caching, and (3) a variant of our system
where we do not maintain persistent block mappings for the SSD cache.
0
500
1000
1500
fullsys.
van.disk
modif.sys.
IOPS
0
1
2
3
4
5
6
Avg latency in ms
100
101
102
103
104
Max latency in ms
fullsys.
van.disk
modif.sys.
fullsys.
van.disk
modif.sys.
Figure 5.6: System performance compared to vanilla disk and a simplified cache.4kb aligned random reads/writes on 1GB using 100MB of cache.
We used a single IOmeter workload within a Windows VM for this experiment.
The workload is a 50% mix of reads and writes on 1GB with a cache of 100MB. Fig-
ure 5.6 shows warm cache IOPS, and average and maximum latency for each of the
73
three configurations. The first observation is that in the average case, both caching
systems perform better than the system without caching. The caching variants both
provide approximately the same average latency and IOPS indicating that average
case overhead is acceptable. However, the maximum latency of the full system is
almost one order of magnitude higher than the one without persistent mappings.
We noticed that these spikes in latency occur every mover epoch, and specifically,
every time the journal is replayed. The second interesting observation is that the
IOPS of the full system are slightly higher than the non-persistent cache variant;
it turned out this was because journal replaying was merging and sequentializing
writes much better.
5.5.4 Adaptation to specific storage characteristics
Some SSD specific performance oddities are slow writes and sequential read per-
formance being comparable to that of a SAN store. Conventional caches would
minimize the number of I/Os going to the backing store, even if it were performing
faster. We adapt to such scenarios automatically by eliminating cache space for
VMs which do not benefit from SSD performance.
The next experiment mixes one sequential read with a random read workload.
The sequential read was setup in a way such that it gets the same IOPS when placed
in SAN or in SSD, but gets 8 times more latency when placed on SAN. This table
shows the specific performance characteristics of this workload on SAN and SSD:
seq (OIO=8, bs=32k) Latency (usec) IOPS
SSD 648 1886SAN 1548 1689
This sequential workload reads over a file of 5 GB and the random reader over
a file of 10 GB. The latency curves are showed on Figure 5.7(a). Based on these
74
curves, in order to minimize average latency the best allocation is giving half of the
cache to each VM.
012345
0 1 2 3 4 5 6 7 8 9 10
La
ten
cy
inm
s
Space in GB
(a) Latency curves
seq rand
00.0020.0040.0060.008
0 1 2 3 4 5 6 7 8 9 10
1/I
OP
S
Space in GB
(a) 1/IOPS curves
seqrand
Figure 5.7: Latency and IOPS−1 curves.
The best allocation for minimizing latency is half cache to each VM; however,
maximizing IOPS leads to entirely different allocations because the sequential work-
load gets the same IOPS from the SSD and from the RAID. Figure 5.7 (b) shows
the cost curves and how the best allocation to minimize 1/IOPS (i.e. maximize
IOPS) is to give all space to the random workload. Thus our solution produces the
expected behavior, i.e., not allocate SSD cache space to workloads that do not need
it.
5.6 Related work
We subdivide the related literature based on what type of caches are being parti-
tioned. We finalize this section with a description of the related research on storage
QOS.
CPU caches. Early work on partitioning shared cache resources was targeted for
CPU caches for instruction and data streams. Stone et al. [STW92] pointed out that
75
LRU caches suffer from slow convergence towards optimal allocations when multi-
ple workloads share the cache. They analytically show that for minimizing overall
miss rate and assuming convex MRC curves, optimal partitioning when minimizing
overall miss rate can be achieved by choosing allocation sizes for which derivatives
of miss rate is the same across all workloads. Thiebaut et al. [TSW92b] then de-
veloped a practical implementation of Stone’s algorithm by approximating MRC
derivatives rather than constructing full MRCs and then making them monotonic
to force convexness of the implied MRC. Unlike our approach of periodic partition-
ing, they continuously partition the cache using the robinhood approach (of taking
from the rich and giving to the poor) until the MRC derivatives equalize to achieve
Stone optimality.
Buffer caches. Arguing that pollution for LRU based main memory page replace-
ment cannot avoid cache pollution, Kim et al. [KCK+] demonstrated the benefits
of partitioning main memory. Their approach detects sequential accesses and then
assigns a single page to each sequential stream. MRCs have also been used to parti-
tion main memory. Zhou et al. [ZPS+04b] argue that most MRCs for main memory
workloads are convex and use a greedy MRC-based approach to partitioning main
memory for minimizing aggregate miss ratio. Soundararajan et al. [SLG+09] address
partitioning of multi-level caches including memory and storage caches. Assuming
that these caches can be made exclusive by implementing DEMOTE [WW02b], they
partition all the cache space (both levels) in order to minimize average latency us-
ing latency curves that are very similar to ours. Their search algorithm uses hill
climbing starting from a set of k random partitions to find an optimal one. Goyal
et al. [GJMT03] address the problem of dynamically partitioning storage memory
caches according to goals and changes in the workloads. They address both per-
76
formance maximization and QoS goals for latency only on a workload-class basis.
They use an MRC based approach similar to that used for CPU caches combined
with a greedy approach for benefit maximization. They also assume that MRCs are
convex.
SSD caches. Sehgal et. al. proposed a SSD cache that uses partitioning to
limit workloads’ average latencies [SVS12]. Their partitioning technique uses a
control loop of observing latency, and increase or decrease cache size in small steps.
Their feedback controller increases the partition size when the limit is not met and
decreases it when observed latency is better than expected. The problem with this
approach is that it is not capable to find minimum average latencies, and requires
the assumption of convex latency vs. cache sizes curves.
Our approach has the following distinguishing characteristics from all of the
related work. We generalize observations on wastage that have been demonstrated
exclusively for LRU caches to apply irrespective of the replacement policy. We
empirically demonstrate that the assumptions of convex MRCs or even translations
to convex minorants do not apply to out-of-core caches; and neither do current MRC
construction methods.
Storage QoS. Storage QoS has been addressed from several perspectives ranging
from partitioning memory to I/O throttling to storage migration. We can examine
QoS controls that are available to the hypervisor to compare how fast they react to
a change in the system. First, memory ballooning [Wal02b] can impact the guest
file system buffer cache quickly, but it is difficult to exactly control the size of the
buffer cache. Second, memory partitioning has been used in order to provide soft-
QoS controls for workloads [PSPK09, PGSK09]. Third, I/O throttling [GAW09]
allows for rapid control of the VM I/O performance in a cluster. Next, comes I/O
[Axb07] Jens Axboe. blktrace user guide, February 2007.
[BABD00] R. Balasubramonian, D. Albonesi, A. Buyuktosunoglu, andS. Dwarkadas. Memory hierarchy reconfiguration for energy and per-formance in general purpose architectures. In IEEE MICRO, 2000.
[BDB00] V. Bala, E. Duesterwald, and S. Banerjia. Dynamo: A transparentdynamic optimization system. In ACM SIGPLAN, 2000.
[BDD+02] L. S. Blackford, J. Demmel, J. Dongarra, I. Duff, S. Hammar-ling, G. Henry, M. Heroux, L. Kaufman, A. Lumsdaine, A. Petitet,R. Pozo, K. Remington, and R. C. Whaley. An updated set ofbasic linear algebra subprograms (blas). ACM Trans. Math. Soft.,28(2):135–151, 2002.
[BEP11] Gianfranco Bilardi, Kattamuri Ekanadham, and Pratap Pattnaik. Ef-ficient stack distance computation for priority replacement policies.In ACM International Conference on Computing Frontiers, 2011.
[BGU+09] Medha Bhadkamkar, Jorge Guerra, Luis Useche, Sam Burnett,Jason Liptak, Raju Rangaswami, and Vagelis Hristidis. BORG:Block-reorganization for self-optimizing storage systems. In Proc.of USENIX FAST, February 2009.
[Blo70] Burton H. Bloom. Space/time trade-offs in hash coding with allow-able errors. Communications of the ACM, 13(7):422–426, 1970.
[BM76] A. P. Batson and A. W. Madison. Measurements of major localityphases in symbolic reference strings. In Proc. of ACM Sigmetrics,1976.
[boo] Bootchart. http://www.bootchart.org.
[Car81] John L. Carr, Richard W. Hennessy. Wsclock-a simple and effec-tive algorithm for virtual memory management. SIGOPS Oper. Syst.Rev., 15:87–95, December 1981.
104
[CAVL09] Austin Clements, Irfan Ahmad, Murali Vilayannur, and Jinyuan Li.Decentralized deduplication in san cluster file systems. In Proc. ofthe USENIX Annual Technical Conference, June 2009.
[CH81] R. Carr and J. Hennessy. WSCLOCK – A simple and efficient al-gorithm for virtual memory management. In Proc. of ACM SOSP,1981.
[CO72] W. Chu and H. Opderbeck. The page fault frequency replacementalgorithm. In Proc. of AFIPS Conference, 1972.
[Den68a] P. J. Denning. Thrashing: Its causes and prevention. In Proc. ofAFIPS Fall Joint Computer Conference, 1968.
[Den68b] Peter J. Denning. The working set model for program behavior. Com-munications of the ACM, 11(5):323–333, 1968.
[Den80] Peter J. Denning. Working sets past and present. In IEEE Tran. onSoftware Engineerng, 1980.
[Den06] Peter Denning. The Locality Principle, Communication NetworksAnd Computer Systems (Communications and Signal Processing).Imperial College Press, London, UK, UK, 2006.
[FY83] D. Ferrari and Y.-Y. Yih. VSWS: The variable-interval sampled work-ing set policy. In IEEE Trans. on Software Engineering, 1983.
[GAW09] Ajay Gulati, Irfan Ahmad, and Carl A. Waldspurger. Parda: pro-portional allocation of resources for distributed storage access. InProccedings of the 7th conference on File and storage technologies,2009.
105
[GAW11] Ajay Gulati, Irfan Ahmad, and Carl A. Waldspurger. Pesto: On-line storage performance management in virtualized datacenters. InProceedings of the 2nd ACM Symposium on Cloud Computing, NewYork, NY, USA, 2011. ACM.
[GF78] R. K. Gupta and M. A. Franklin. Working set and page fault fre-quency replacement algorithms: A performance comparison. In IEEETransactions on Computers, 1978.
[Gil08] Binny S. Gill. On multi-level exclusive caching: offline optimality andwhy promotions are better than demotions. In Proc. of the USENIXFile and Storage Technologies, Feburary 2008.
[GJMT03] Pawan Goyal, Divyesh Jadav, Dharmendra S. Modha, and RenuTewari. Cachecow: Qos for storage system caches. In Proceedingsof the 11th international conference on Quality of service, IWQoS’03,2003.
[GKAK10] Ajay Gulati, Chethan Kumar, Irfan Ahmad, and Karan Kumar.Basil: Automated io load balancing across storage devices. In FAST,pages 169–182, 2010.
[GLV+08] Diwaker Gupta, Sangmin Lee, Michael Vrable, Stefan Savage, Alex C.Snoeren, George Varghese, Geoffrey Voelker, and Amin Vahdat. Dif-ference Engine: Harnessing Memory Redundancy in Virtual Ma-chines. Proc. of the USENIX OSDI, December 2008.
[GMV10] Ajay Gulati, Arif Merchant, and Peter J. Varman. mclock: handlingthroughput variability for hypervisor io scheduling. OSDI’10, 2010.
[GPG+11] Jorge Guerra, Himabindu Pucha, Joseph Glider, Wendy Belluomini,and Raju Rangaswami. Cost effective storage using extent baseddynamic tiering. In FAST, 2011.
[GS00] Jim Gray and Prashant Shenoy. Rules of Thumb in Data Engineering.Proc. of the IEEE International Conference on Data Engineering,February 2000.
[GUB+08] Jorge Guerra, Luis Useche, Medha Bhadkamkar, Ricardo Koller, andRaju Rangaswami. The Case for Active Block Layer Extensions.ACM Operating Systems Review, 42(6), October 2008.
106
[Hag87] R. Hagmann. Reimplementing the Cedar File System Using Log-ging and Group Commit. Proc. 11th ACM Symposium on OperatingSystem Principles, November 1987.
[HHS05] Hai Huang, Wanda Hung, and Kang G. Shin. FS2: Dynamic DataReplication In Free Disk Space For Improving Disk Performance AndEnergy Consumption. In Proc. of the ACM SOSP, October 2005.
[IBM] IBM Corporation. IBM System Stor-age SAN Volume Controller. http://www-03.ibm.com/systems/storage/software/virtualization/svc/.
[isc04] Internet small computer systems interface (iscsi). RFC 3720, April2004.
[Jac09] Bruce L. Jacob. The Memory System: You Can’t Avoid It, YouCan’t Ignore It, You Can’t Fake It. Synthesis Lectures on ComputerArchitecture. Morgan & Claypool Publishers, 2009.
[JCZ05] Song Jiang, Feng Chen, and Xiaodong Zhang. Clock-pro: An effec-tive improvement of the clock replacement. In Proc. of the USENIXAnnual Technical Conference, April 2005.
[JDT05] N. Jain, M. Dahlin, and R. Tewari. TAPER: Tiered Approach forEliminating Redundancy in Replica Synchronization. In Proc. of theUSENIX Conference on File And Storage Systems, 2005.
[JNW08] Bruce L. Jacob, Spencer W. Ng, and David T. Wang. Memory Sys-tems: Cache, DRAM, Disk. Morgan Kaufmann, 2008.
[JVW03] Minwen Ji, Alistair Veitch, and John Wilkes. Seneca: Remote mir-roring done write, 2003.
[KCK+] Jong Min Kim, Jongmoo Choi, Jesung Kim, Sam H. Noh, Sang LyulMin, Yookun Cho, and Chong Sang Kim. A low-overhead high-
107
performance unified buffer management scheme that exploits sequen-tial and looping references. OSDI’00.
[KCK+00] J. Kim, J. Choi, J. Kim, S. Noh, S. Min, Y. Cho, and C. Kim.A low-overhead high-performance unified buffer management schemethat exploits sequential and looping references. In Proc. of USENIXOSDI, 2000.
[KDLT04] P. Kulkarni, F. Douglis, J. D. LaVoie, and J. M. Tracey. RedundancyElimination Within Large Collections of Files. Proc. of the USENIXAnnual Technical Conference, 2004.
[KGV83] S. Kirkpatrick, C. D. Gelatt, and M. P. Vecchi. Optimization bysimulated annealing. Science, 1983.
[KHW91] Y. Kim, M. Hill, and D. Wood. Implementing stack simulation forhighlyassociative memories. In Proc. of ACM SIGMETRICS, 1991.
[KR10] Ricardo Koller and Raju Rangaswami. I/o deduplication: Utiliz-ing content similarity to improve i/o performance. Trans. Storage,6(3):13:1–13:26, September 2010.
[KRDZ10] Sajib Kundu, Raju Rangaswami, Kaushik Dutta, and Ming Zhao.Application performance modeling in a virtualized environment. InProc. of the IEEE HPCA, January 2010.
[krm08] taeho kgil, david roberts, and trevor mudge. improving nand flashbased disk caches. In proc. of isca, 2008.
[KS00] M. Karlsson and P. Stenstrom. An analytical model of the working-setsizes in decision-support systems. In Proc. of ACM SIGMETRICS,2000.
[KVR10] Ricardo Koller, Akshat Verma, and Raju Rangaswami. Generalizederss tree model: Revisiting working sets. Perform. Eval., 2010.
[KVR11] Ricardo Koller, Akshat Verma, and Raju Rangaswami. Estimatingapplication cache requirement for provisioning caches in virtualizedsystems. Modeling, Analysis, and Simulation of Computer Systems,International Symposium on, 0:55–62, 2011.
108
[LAS+05] Xuhui Li, Ashraf Aboulnaga, Kenneth Salem, Aamer Sachedina, andShaobo Gao. Second-tier cache management using write hints. InProc. of the USENIX File and Storage Technologies, 2005.
[LEB+09] Mark Lillibridge, Kave Eshghi, Deepavali Bhagwat, Vinay Deolalikar,Greg Trezise, and Peter Camble. Sparse indexing: large scale, inlinededuplication using sampling and locality. In Proc. of the USENIXFile and Storage Technologies, February 2009.
[LLD+08] J. Lin, Q. Lu, X. Ding, Z. Zhang, X. Zhang, and P. Sadayappan.Gaining insights into multicore cache partitioning: Bridging the gapbetween simulation and real systems. In Proc. of IEEE HPCA, 2008.
[LSB08] The Linux Standard Base. http://www.linuxbase.org, 2008.
[McD] Richard McDougall. Filebench:application level file system bench-mark.
[MCGC11] Ali Mashtizadeh, Emre Celebi, Tal Garfinkel, and Min Cai. Thedesign and evolution of live storage migration in vmware esx. In Pro-ceedings of the 2011 USENIX conference on USENIX annual technicalconference, USENIXATC’11, pages 14–14, Berkeley, CA, USA, 2011.USENIX Association.
[McK04] Sally A. McKee. Reflections on the memory wall. In Proceedings ofthe 1st conference on Computing frontiers, CF ’04, pages 162–, NewYork, NY, USA, 2004. ACM.
[MG99] Marshall Kirk McKusick and Gregory R. Ganger. Soft updates: atechnique for eliminating most synchronous writes in the fast filesys-tem. In Proceedings of the annual conference on USENIX AnnualTechnical Conference, ATEC ’99, pages 24–24, Berkeley, CA, USA,1999. USENIX Association.
[MGST70a] R. L. Mattson, J. Gecsei, D. R. Slutz, and I. L. Traiger. Evaluationtechniques for storage hierarchies. IBM Systems Journal, 9(2):78–117,1970.
[MGST70b] R. L. Mattson, J. Gecsei, D. R. Slutz, and I. L. Traiger. Evaluationtechniques for storage hierarchies. IBM Syst. J., 1970.
109
[MIG03] Charles B. Morrey III and Dirk Grunwald. Peabody: The TimeTravelling Disk. In Proc. of the IEEE/NASA MSST, 2003.
[MM04] Nimrod Megiddo and Dharmendra S. Modha. Outperforming lru withan adaptive replacement cache algorithm. Computer, 2004.
[MMHF09] G. Milos, D. G. Murray, S. Hand, and M. Fetterman. Satori: En-lightened Page Sharing. In Proc. of the Usenix Annual TechnicalConference, June 2009.
[NAS] NAS Parallel Benchmarks (NPB).http://www.nas.nasa.gov/resources/software/npb.html.
[Net] Network Appliance, Inc. NetApp V-Series of Heterogeneous StorageEnvironments. http://media.netapp.com/documents/v-series.pdf.
[New] New Implementation of a Log-structured File System (NILFS).www.nilfs.org.
[Ope] Open Source. Dyninst: An Application Program Interface (API) forRuntime Code Generation. Online, http://www.dyninst.org/.
[OS93] Cyril U. Orji and Jon A. Solworth. Doubly distorted mirrors. InProceedings of the ACM SIGMOD, 1993.
[PGG+95] R. Patterson, G. Gibson, E. Ginting, D. Stodolsky, and J. Zelenka.Informed prefetching and caching. In Proc. of ACM SOSP, 1995.
[PGSK09] C.M. Patrick, R. Garg, S.W. Son, and M. Kandemir. Improving i/operformance using soft-qos-based dynamic storage cache partitioning.In CLUSTER ’09, 2009.
[PSPK09] Ramya Prabhakar, Shekhar Srikantaiah, Christina Patrick, and Mah-mut Kandemir. Dynamic storage cache allocation in multi-server ar-chitectures. In Proceedings of the Conference on High PerformanceComputing Networking, Storage and Analysis, SC ’09, 2009.
[QD02] S. Quinlan and S. Dorward. Venti: A New Approach to Archival Stor-age. Proc. of the USENIX File And Storage Technologies, January2002.
110
[QP06a] Moinuddin K. Qureshi and Yale N. Patt. Utility-based cache par-titioning: A low-overhead, high-performance, runtime mechanism topartition shared caches. In Microarchitecture, 2006. MICRO-39. 39thAnnual IEEE/ACM International Symposium on, 2006.
[QP06b] Moinuddin K. Qureshi and Yale N. Patt. Utility-based cache par-titioning: A low-overhead, high-performance, runtime mechanism topartition shared caches. In MICRO2009, 2006.
[RCP08] Sean Rhea, Russ Cox, and Alex Pesterev. Fast, Inexpensive Content-Addressed Storage in Foundation. Proc. of USENIX Annual Techni-cal Conference, June 2008.
[RD] John T. Robinson and Murthy V. Devarakonda. Data cache manage-ment using frequency-based replacement. SIGMETRICS ’90.
[RLLS] R. Rajkumar, Chen Lee, J.P. Lehoczky, and D.P. Siewiorek. Practicalsolutions for qos-based resource allocation problems. In Real-TimeSystems Symposium, 1998.
[RO91] M. Rosenblum and J. Ousterhout. The Design And Implementationof a Log-Structured File System. Proc. 13th Symposium on OperatingSystem Principles, October 1991.
[RSG93] E. Rothberg, J. P. Singh, and A. Gupta. Working sets, cache sizesand node granularity issues for large-scale multiprocessors. In Proc.of ISCA, 1993.
[RT03] Ohad Rodeh and Avi Teperman. zfs ” a scalable distributed filesystem using object disks. In Proceedings of the 20 th IEEE/11 thNASA Goddard Conference on Mass Storage Systems and Technolo-gies (MSS’03), MSS ’03, pages 207–, Washington, DC, USA, 2003.IEEE Computer Society.
[SBSMWS12] Luis Pabn Steve Byan, James Lentini, Christopher Small, and Inc.Mark W. Storer, NetApp. Mercury: host-side flash caching for thedatacenter. 2012.
[Sit96] Richard L. Sites. It’s the memory, stupid! Microprocessor Report,1996.
111
[SLG+09] Gokul Soundararajan, Daniel Lupei, Saeed Ghanbari, Adrian DanielPopescu, Jin Chen, and Cristiana Amza. Dynamic resource allocationfor database servers running on virtual storage. In Proccedings of the7th conference on File and storage technologies, 2009.
[SRD04] G. E. Suh, L. Rudolph, and S. Devadas. Dynamic partitioning ofshared cache memory. The Journal of Supercomputing, 2004.
[SSZ12] Mohit Saxena, Michael M. Swift, and Yiying Zhang. Flashtier alightweight, consistent and durable storage cache. In EuroSys, pages267–280, 2012.
[STS08] L. Soares, D. Tam, and M. Stumm. Reducing the harmful effectsof last-level cache polluters with an os-level, software-only pollutebuffer. In IEEE MICRO, 2008.
[STW92] Harold S. Stone, John Turek, and Joel L. Wolf. Optimal partitioningof cache memory. IEEE Trans. Comput., 1992.
[SVS12] Priya Sehgal, Kaladhar Voruganti, and Rajesh Sundaram. SLO-awareHybrid Store. IEEE/NASA Goddard Conference on Mass StorageSystems and Technologies, April 2012.
[TASS09] David Tam, Reza Azimi, Livio Soares, and Michael Stumm. rapidmrc:approximating l2 miss rate curves on commodity systems for onlineoptimizations. In proc. of asplos, 2009.
[Tra] Transaction Processing Performance Council (TPC). TPC Bench-marks. http://www.tpc.org/information/benchmarks.asp.
[TSW92a] D. Thiebaut, H.S. Stone, and J.L. Wolf. Improving disk cache hit-ratios through cache partitioning. Computers, IEEE Transactionson, 41(6):665 –676, jun 1992.
[TSW92b] Dominique Thiebaut, Harold S. Stone, and Joel L. Wolf. Improv-ing disk cache hit-ratios through cache partitioning. IEEE Trans.Comput., 1992.
[Twe98] S. C. Tweedie. Journaling the Linux ext2fs File System. The FourthAnnual Linux Expo, May 1998.
112
[UGB+08] Luis Useche, Jorge Guerra, Medha Bhadkamkar, Mauricio Alarcon,and Raju Rangaswami. EXCES: EXternal Caching in Energy Sav-ing Storage Systems. Proc. IEEE International Symposium on High-Performance Computer Architecture (HPCA), February 2008.
[VAN08a] A. Verma, P. Ahuja, and A. Neogi. pmapper: Power and migrationcost aware application placement in virtualized systems. In Proc. ofACM Middleware, 2008.
[VAN08b] A. Verma, P. Ahuja, and A. Neogi. Power-aware dynamic placementof hpc applications. In Proc. of ACM ICS, 2008.
[Wal02a] Carl A. Waldspurger. Memory Resource Management in VMwareESX Server. Proc. of USENIX OSDI, 2002.
[Wal02b] Carl A. Waldspurger. Memory resource management in vmware esxserver. SIGOPS Oper. Syst. Rev., 36(SI):181–194, December 2002.
[WOT+96] S. Woo, M. Ohara, E. Torrie, J. P. Singh, and A. Gupta. Method-ological considerations and characterization of the splash-2 parallelapplication suite. In Proc. of ISCA, 1996.
[WW02a] Theodore M. Wong and John Wilkes. My Cache or Yours? MakingStorage More Exclusive. In Proc. of the USENIX Annual TechnicalConference, 2002.
[WW02b] Theodore M. Wong and John Wilkes. My cache or yours? makingstorage more exclusive. In Proceedings of the General Track of theannual conference on USENIX Annual Technical Conference, pages161–175, Berkeley, CA, USA, 2002. USENIX Association.
[ZLP08] Benjamin Zhu, Kai Li, and Hugo Patterson. Avoiding the Disk Bot-tleneck in the Data Domain Deduplication File System. Proc. of theUSENIX File And Storage Technologies, February 2008.
[ZPS+04a] P. Zhou, V. Pandey, J. Sundaresan, A. Raghuraman, Y. Zhou, andS. Kumar. Dynamic tracking of page miss ratio curve for memorymanagement. In Proc. of ASPLOS, 2004.
[ZPS+04b] Pin Zhou, Vivek Pandey, Jagadeesan Sundaresan, Anand Raghura-man, Yuanyuan Zhou, and Sanjeev Kumar. Dynamic tracking of page
113
miss ratio curve for memory management. SIGOPS Oper. Syst. Rev.,2004.
[ZYKW02] C. Zhang, X. Yu, A. Krishnamurthy, and R. Y. Wang. Configuringand Scheduling an Eager-Writing Disk Array for a Transaction Pro-cessing Workload. In Proc. of USENIX File and Storage Technologies,January 2002.
114
VITA
RICARDO KOLLER
November 6, 1982 Born, Cochabamba, Bolivia
2007–2012 Research AssistantFlorida International UniversityMiami, Florida
2005 B.S., Systems EngineeringBolivian Catholic UniversityNew York, New York
PUBLICATIONS AND PRESENTATIONS
Luis Useche, Ricardo Koller, Raju Rangaswami, Akshat Verma, (2011). Truly Non-Blocking Writes. Proceedings of the USENIX Workshop on Hot Topics in Storageand File Systems.
Ricardo Koller, Akshat Verma, and Raju Rangaswami, (2011). Estimating Applica-tion Cache Requirement for Provisioning Caches in Virtualized Systems. Proceed-ings of the IEEE International Symposium on Modeling, Analysis and Simulationof Computer and Telecommunication Systems.
Akshat Verma, Gautam Kumar, Ricardo Koller, Aritra Sen, (2011). CosMig: Model-ing the Impact of Reconfiguration in a Cloud. Proceedings of the IEEE InternationalSymposium on Modeling, Analysis and Simulation of Computer and Telecommuni-cation Systems.
Ricardo Koller, Akshat Verma, and Raju Rangaswami, (2010). Generalized ERSSTree Model: Revisiting Working Sets. Proceedings of the IFIP International Sym-posium on Computer Performance, Modeling, Measurements and Evaluation.
Ricardo Koller, Akshat Verma, Anindya Neogi, (2010). WattApp: An ApplicationAware Power Meter for Shared Data Centers. Proceedings of the IEEE Interna-tional Conference on Autonomic Computing.
115
Ricardo Koller and Raju Rangaswami, (2010). I/O Deduplication: Utilizing ContentSimilarity to Improve I/O Performance. Proceedings of the USENIX Conferenceon File and Storage Technologies.
Akshat Verma, Ricardo Koller, Luis Useche, and Raju Rangaswami, (2010). SR-CMap: Energy Proportional Storage Using Dynamic Consolidation. Proceedings ofthe USENIX Conference on File and Storage Technologies.
Ricardo Koller, Raju Rangaswami, Joseph Marrero, Igor Hernandez, Geoffrey Smith,Mandy Barsilai, Silviu Necula, S. Masoud Sadjadi, Tao Li, and Krista Merrill,(2008). Anatomy of a Real-time Intrusion Prevention System. Proceedings of theIEEE International Conference on Autonomic Computing.
Jorge Guerra, Luis Useche, Medha Bhadkamkar, Ricardo Koller, and Raju Ran-gaswami, (2008). The Case for Active Block Layer Extensions. Proceedings ofIEEE International Workshop on Storage and I/O Virtualization, Performance, En-ergy, Evaluation and Dependability.
HONORS AND AWARDS
2011 Overall outstanding graduate student awardFlorida International UniversityMiami, Florida
2010 International research fellowshipIBM/PIREMiami, Florida