+ All Categories
Home > Documents > Improving Diabetic Foot Screening Rates in an Academic Primary Care Clinic S Hata, CL Roumie, WM...

Improving Diabetic Foot Screening Rates in an Academic Primary Care Clinic S Hata, CL Roumie, WM...

Date post: 24-Dec-2015
Category:
Upload: natalie-hamilton
View: 215 times
Download: 2 times
Share this document with a friend
Popular Tags:
30
Improving Diabetic Foot Screening Rates in an Academic Primary Care Clinic S Hata, CL Roumie, WM Gregg, J Scott, K Hall, R Follett, P Johnston, C Brown, and GW Garriss Vanderbilt University Medical Center The speaker has no conflicts of interest to disclose pertinent to this presentation.
Transcript

Improving Diabetic Foot Screening

Rates in an Academic Primary Care Clinic

S Hata, CL Roumie, WM Gregg, J Scott, K Hall, R Follett, P Johnston, C Brown, and GW Garriss

Vanderbilt University Medical CenterThe speaker has no conflicts of interest to disclose pertinent to this presentation.

Context

Academic Chronic Care Collaborative sponsored by the AAMC

Promoted health care innovations in academic health centers

22 AHC participated in improving chronic illness care

Vanderbilt addressed diabetes care

Screening Diabetic Foot Exam

The American Diabetes Association recommends a yearly diabetic foot exam.

Early detection and intervention prevent morbidity and amputations.

Locally, our adherence to this guideline has been suboptimal.

What are you trying to accomplish?

Aims Measure our local data on documented foot

exams Improve the proportion of documented 4

element diabetic foot exams (DFE) to greater than 90%, through use of PDSA cycles to implement evidence-based guidelines

Hypothesis Percentage of completed/documented DFEs

would be improved by use of PDSA cycles to institute small tests of change in a year

How will you know a change is an improvement?

Process Measures Percent of foot exams documented

with each method• Templated note• Team DFE• Both• Other (free text writing in a note)

Outcome Measure Proportion of patients with diabetes

who have 4 element DFE documented within the past 12 months

Design and Setting

Study Design: Observational Study with multiple Plan-Do-Study-Act cycles

Setting: Adult Primary Care Clinic Vanderbilt University Medical Center, Nashville, TN

IRB approval obtained

Study Timeline

Registry created

Intervention #1 - Provider EducationIntervention #2 - PostersIntervention #3 - Note template

Intervention #5- Team approach

Study completed

Intervention #4 - Provider Feedback (quarterly)

July 2005

October2005

June 2004

June 2006

Methods - Population Inclusion Criteria

• Registry created, June 2004• Search problem lists for “diabetes”

or “DM”• ICD-9 CM = 250.x within the last 2

years Patients < 18 y.o. were excluded Study population

• 338 patients with diabetes (July 2005)

• Registry updated (April 2006) to 387 patients

What changes can you make?

Intervention #1 – Provider Education

July 2005 Met with primary care providers Encouraged cooperation by

sharing data regarding foot exam rates

Discussed the goals of the Diabetic Foot Exam Project

Standardized DFE method for resident and faculty providers

Complete Diabetic Foot Exam

Based on ABIM’s PIM for diabetes

Four elements:• Visual inspection• Pulses• Sensation• 10 g

monofilament

Singh N, Armstong DG, and Lipsky BA. Preventing Foot Ulcers in Patients with Diabetes. JAMA. 2005; 293:217-28.

Intervention #2 – Poster

Began July 2005

Intervention #3 – Note Template

Introduced July 2005 Included ADA guidelines for:

• Glycemic control• BP control• LDL goals• Annual DFE

Physical exam in template included 4 element DFE

Intervention #4 - Provider Feedback

Began July 2005 and continued quarterly

Practice report of patients with diabetes

Report included each patient’s most recent: • A1c • BP • LDL • DFE

Patient presents to

primary care

Intervention #5- Team Approach

Intervention began October 2005

Tech asks “Do you have

diabetes?”

Prompts pt to remove shoes

Alerts Nurse pt with DM

Nurse notifies doctor

pt is ready for visit

DFE completed & documented in medical record

Nurse performs

DFE

Analysis

Outcome extracted through manual and electronic chart review

Run Chart using a rolling 12 month period and updated monthly

Results- Patient characteristics

Characteristic Population=338 patients

N (%)

Age - years, mean ± SD

51.9 ± 14.3

Female sex 218 (64.5)

A1C <7% 118 (35)

LDL <100 (mg/dL) 176 (52)

BP <130/80 111 (33)

ACEi/ARB use 270 (80)

Results- Provider characteristics

Characteristic N=38 providers (%)

Age (mean ± SD) 31 ± 5

Sex 19 (50)

Attending MD 9 (23.7)

Resident MD 29 (76.3)

Clinics per month, attending mean (range)

12.5 (4-16)

Clinics per month, resident mean (range)

3 (2.6-3.6)

Pts per provider, mean (range) 9.9 (1 - 50)

Results – Method to Complete/Document DFE

0

10

20

30

40

50

60 July/August 2005

December 2005

June 2006

pe

rce

nt o

f to

tal f

oo

t e

xa

ms

0 1 2 3 4 5 6 7 8 9 10 11 120

20

40

60

80

100

Month of intervention

n = 338

n = 387

pe

rce

nt o

f pa

tien

ts w

ithd

ocu

me

nte

d D

FE

0

20

40

60

80

100

Month of intervention

n = 338n = 387

pe

rce

nt o

f pa

tien

ts w

ithd

ocu

me

nte

d D

FE

17%

82%

Absolute increase of 65%

Results

Per

cen

t o

f P

atie

nts

wit

h

Do

cum

ente

d “

Fu

ll” D

iab

etic

Fo

ot

Exa

m

Diabetic Foot Exam Run Chart

Data From ACCC Cohort and Controls

01020

3040506070

8090

100

AugOct

DecFeb Apr

Jun

AugOct

DecFeb

ACCC Cohort

*Controls

Bas

elin

e

Go

al

Registry updated/ expanded from n = 338 to 387

(April 2006)

Team DFE started in other Suites

(Jan 2006)

* Controls = 350 Randomly Selected Non-ACCC Cohort Patients

Limitations

One academic primary care clinic site

Small number of patients and providers

Multiple interventions employed simultaneously

Note templates may introduce some inaccuracy

Lessons Learned

• Weak links in our system• Lost monofilaments• Forgetful, busy providers• Resistance to change

• A team approach can fix problems• Redundancy to prevent missed opportunities• Time saving for providers• “Doctor-proofed”

Summary and Implications

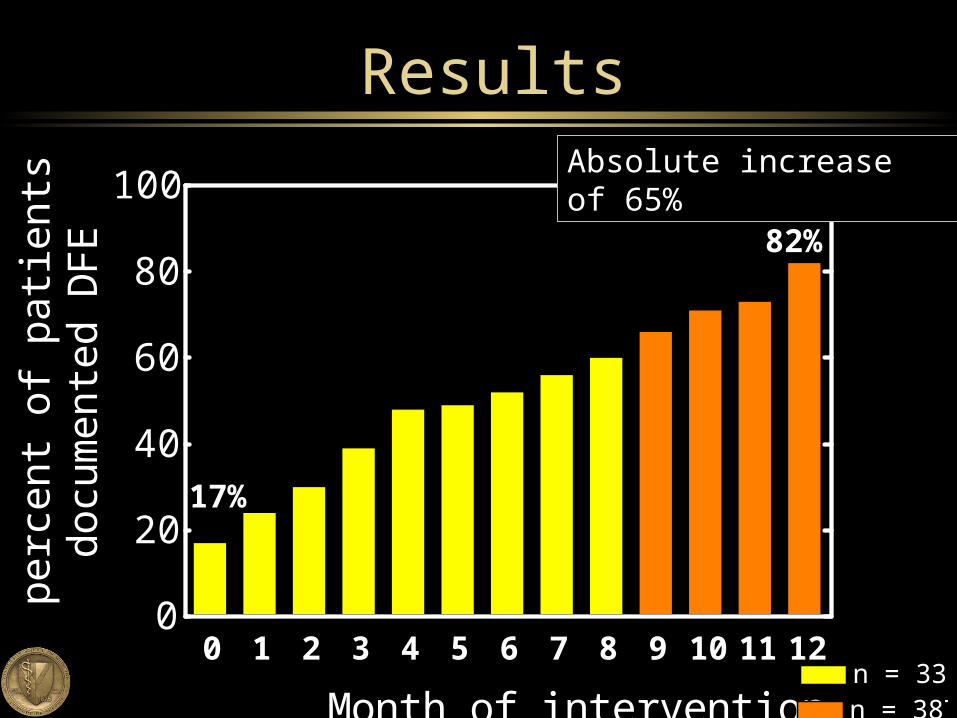
Multi-factorial interventions resulted in an absolute increase of 65% in annual DFE rate

Increased teamwork among physicians, nurses, techs

Improved quality of care for patients with diabetes

Plan to expand these interventions to all primary care clinics at Vanderbilt

Acknowledgements

Susan Hata, MD Christianne Roumie, MD MPH William Gregg, MD, MPH Julie Scott, RN Kara Hall, RN Robert Follett, BS Phil Johnston, Pharm D Charlotte Brown, BS

Excerpt of Note Template (Intervention #3)

“We are what we repeatedly do. Excellence, then, is not

an act, but a habit.”- Aristotle


Recommended