About the Center for Retirement Research The Center for Retirement Research at Boston College, part of a consortium that includes parallel centers at the University of Michigan and the National Bureau of Economic Research, was established in 1998 through a grant from the Social Security Administration. The Center’s mission is to produce first-class research and forge a strong link between the academic community and decision-makers in the public and private sectors around an issue of critical importance to the nation’s future. To achieve this mission, the Center sponsors a wide variety of research projects, transmits new findings to a broad audience, trains new scholars, and broadens access to valuable data sources.
Center for Retirement Research at Boston College
Hovey House 140 Commonwealth Ave Chestnut Hill, MA 02467
Individuals understand the need for life insurance, but they have a hard time determining how
much insurance is necessary. The need for disability insurance is even less clear – disability
incidence and the insurance product are not well understood and prone to behavioral biases – and
it is infrequently purchased.
The second study uses an online experiment to identify behavioral-economics-based
interventions that affect life and disability insurance participation and coverage levels (Coe,
Belbase, and Wu 2013). The results suggest that simple, personally relevant information,
provided at the time of enrollment, can nudge individuals to overcome behavioral impediments
and elect more optimal life and disability insurance coverage.
Unlike the first two studies, which focused on the employee’s decision, the present study
examines group benefits from the employer’s perspective. Data on employer practices, benefit
information, and aggregate employee characteristics are obtained through a firm-level survey
conducted by the Society for Human Resource Management (SHRM). Survey results are used to
describe the landscape of employer practices with respect to supplementary life and disability
insurance and to investigate correlations between employer practices (such as cross-advertising
group benefits with health insurance) and employee take-up.
2
This report proceeds as follows. Section 1 discusses the methodology, including the
survey instrument and resulting sample characteristics, data quality tests, and the empirical
strategy. Section 2 summarizes employer practices, both in general and specific to
supplementary life and disability insurance benefits. Section 3 presents the regression results
examining the association between employer practices and benefit take-up. Section 4 concludes
that timing enrollment and cross-advertising benefits in ways that maximizes the salience of life
and disability insurance benefits is associated with higher-take up of these benefits.
Methodology
The Survey. Traditional economic literature describes two factors that influence the take-
up of life and disability insurance: individual characteristics (demand-side factors) and product
characteristics (supply-side factors) (Frank 1989, Norman 2003). Using models that smooth
consumption over an individual’s lifetime, standard economic theory suggests that most people
will be better off with a positive amount of life and disability insurance (Yaari, 1965). But actual
life and disability insurance take-up does not reflect the predictions made by utility-maximizing
models, especially with respect to coverage among the young and poor (Chandra and Samwick
2009, Richard 1975). Behavioral economics offers an explanation for this deviation between
predicted and actual take-up by imposing limits on the extent to which human beings are able to
rationally process information. This limited rationality, in turn, makes decision architecture – the
way in which choices are presented – an important factor to consider when examining the take-
up of insurance products (Kahneman and Tversky 1979, Mullainathan, and Thaler 2000).
Supporting this notion, prior work in the current research program finds relatively simple
employer communication practices – such as on-screen personalized coverage recommendations
– can increase take-up of life and disability insurance in an experimental setting (Coe, Belbase,
and Wu 2012).
This project developed and conducted an online survey to collect information on factors
predicted by standard and behavioral economic theories to affect benefit take-up.1 The survey
includes questions on aggregate employee characteristics, characteristics of the life and disability 1 Using a survey to solicit information about supplementary benefits introduces a potential for confusion between employer-paid benefits and voluntary, employee-paid benefits. We attempt to address this potential problem through clear and consistent word choice. A preliminary version of the survey asked respondents to upload benefit enrollment documents to analyze pricing, benefit framing, and benefit-specific communication practices, but poor response rates during a pretest of the survey led us to abandon this approach.
3
insurance products offered by employers, and (both general and benefit-specific) employer
enrollment and communication practices. Table 1 summarizes the data solicited by the final 50-
question survey, and Appendix A includes the full survey instrument.
Table 1. Data Solicited by Employer Survey
Aggregate employee characteristics
General benefit practices
Life-insurance specific data
Disability-insurance specific data
Average age Benefits offered Take-up Take-up Percent female Enrollment timing Coverage level Coverage level
Percent married Enrollment channel Guaranteed issue amount Waiting period
Percent with children Enrollment cross-advertising
Maximum issue amount Exhaustion period
Average wage Benefit communication
channel and method
Monthly premium Monthly premium
Benefit administration arrangement Benefit framing Use of defaults
Coverage option
increment amount
Employer-provided coverage
Use of defaults Guidance provided Guidance provided
The Sample. The targeted sample consisted of 7,000 randomly selected participants from
completed the survey, with 468 respondents filling out information about a supplementary life
insurance benefit, 143 respondents filling out information about a supplementary long-term
disability insurance benefit, and 84 respondents filling out information about a short-term
disability insurance benefit. Approximately 80 percent of the respondents possess a job title of
“Manager, Generalist,” “Director or Assistant/Associate Director,” “Administrator,” or
“Specialist.”
Generalizability. This sample raises concerns about the generalizability of our findings
in three ways. First, SHRM’s members may not be representative of firms in the United States.
Second, employees within SHRM member firms may not be representative of employees as a
whole. Third, the low response rate could introduce selection bias, making the final sample non-
4
representative of SHRM members. However, testing for selection bias at the response stage is
difficult without information on the non-respondents. To examine the representativeness of our
final sample, we compare the aggregate employee characteristics to the sample of employed
individuals from the August 2014 Current Population Survey (Table 2). Organizations in our
SHRM sample have a slightly greater percentage of married employees and female employees,
but the differences are not substantively large. The difference in the percentage of parents is
higher, as are the average wages paid to their employees; to the extent that higher-income
workers and parents are more likely to take up insurance benefits anyway, the influence of
factors like enrollment timing and cross-advertising on take-up may be somewhat overstated.
Table 2. Sample Employee Characteristics Compared to Employed Sample in the CPS
SHRM sample CPS employed
Percent female 51 % 47 % Percent married 59 % 54 % Percent parents 42 % 32 % Mean age among benefit-eligible employees 42 42 ** Median annual income $56,000 $41,444 Notes: CPS data are August 2014; ** = Median. Source: Authors’ calculations.
Data Reliability. We conduct several data quality tests, including tests for non-
responsiveness and response consistency. As is typical in voluntary online surveys with no
reward for participation or completion, item non-response is a concern. Fifty-five percent of
respondents skip three or more mandatory questions, of which data on benefit premiums is the
most commonly skipped item. Only 29 percent of respondents offering life insurance provide
premium data and 4 percent of respondents offering long- or short-term disability insurance
provide premium data. Supplementary short- and long-term disability coverage levels are also
frequently skipped: only 36 percent of respondents provide this information. Outside of data on
premiums and disability insurance coverage levels, the remaining data show an acceptable non-
response rate and response consistency; while we examine both coverage rates and levels for life
insurance, we limit our analysis to coverage rates – ignoring levels due to small sample size – for
long- and short-term disability.
5
Item non-response is also fairly common among the independent variables. We conduct
the analysis on the full sample, including variables that capture missing characteristics, rather
than imputing missing answers or limiting the analysis to the subset who answered every
question. This methodology provides us the largest sample size and the most flexibility in the
event that non-response is not random.
The Empirical Strategy. For each benefit type (life, short-term disability, and long-term
disability insurance), the following linear regression model is used to estimate the association
between employer and benefit characteristics and benefit take-up (and, in the case of life
insurance, coverage level):
𝑇𝑏𝑏 =∝𝑏+ 𝛽1𝑋𝑏𝑏 + 𝛽2𝑋~𝑏𝑏 + 𝛽3𝑊𝑏 + 𝜀𝑏𝑏 (2)
where Tbj is the take-up rate of benefit b at employer j. This rate is a function of the
characteristics of benefit b at employer j (Xbj), which includes the price, offer mechanism,
enrollment window, default option, and other employer practices.2 It could also be a function of
the same characteristics for the other benefits offered by that employer (X~bj). We also control
for the underlying demand for the benefit by controlling for aggregate workforce characteristics
(Wj). 𝜀𝑏𝑏 is a normally distributed idiosyncratic error term. The life insurance analysis also
includes an estimate using the level of coverage as the dependent variable (i.e., the ratio of
benefits to annual salary).3
The analysis outlined above will further our understanding of the association between
employer practices and benefit take-up at the employer level. However, it is important to note
some limitations with the approach taken. The study relies on survey rather than institutional or
administrative data, which introduces random variability or “noise” into the data. In
combination with a relatively small sample and missing responses, this noise contributes to
difficulty in establishing the statistical significance of results. In addition, the study does not
establish a causal relationship between employer practices and benefit take-up; if employers
2 Most variables have an accompanying dummy variable that equals one if the variable is missing. The exceptions are coverage levels and coverage amounts; we exclude observations with missing values for these variables. 3 There were insufficient data to conduct this analysis for disability insurance.
6
offer particular benefits in reaction to feedback from their employees (i.e., reverse causality),
then the results may not be generalizable to firms that do not yet offer these benefits.
Descriptive statistics
General Employer Practices. Supplemental life insurance, which is offered by over 90
percent of employers, is the most commonly offered benefit in the study. In contrast,
supplemental long-term disability insurance is offered by only 34 percent of employers, and
supplemental short-term disability insurance is offered by 25 percent of employers. Table 3
summarizes the rate at which various benefits are offered by employers in the sample.
Table 3. Benefit Offer Rate
Source: Authors’ calculations.
Benefit administration arrangements and enrollment practices vary across employers
(Table 4). Almost half of the responding employers administer at least some benefits through a
traditional broker-carrier or third-party administrator, while about 40 percent of employers self-
administer one or more benefits, and approximately a quarter of employers administer benefits
Basic accidental death and dismemberment insurance
91 3 6
Supplemental accidental death and dismemberment insurance
85 8 7
Accident insurance 59 32 9 Critical illness insurance 49 41 10 Defined benefit pension plan open to
current employees 91 4 5
Defined contribution retirement savings plan (401k, 403b, etc.)
75 7 18
Source: Authors’ calculations.
Differences in enrollment timing and benefit communication bundling lead to a range of
opportunities for cross-advertising across employers. While almost two-thirds of employers
enroll employees via a single annual enrollment event, one-third of employers either allow
enrollment at any time or offer multiple enrollment events each year. Furthermore, one-half of
employers communicate all benefits simultaneously, while 38 percent communicate group
benefits with medical benefits and 8 percent communicate each benefit individually.
8
Table 5. Opportunity for Cross-benefit Communication Benefits
communicated together
Only health and group benefits communicated
together
Each benefits communicated
separately
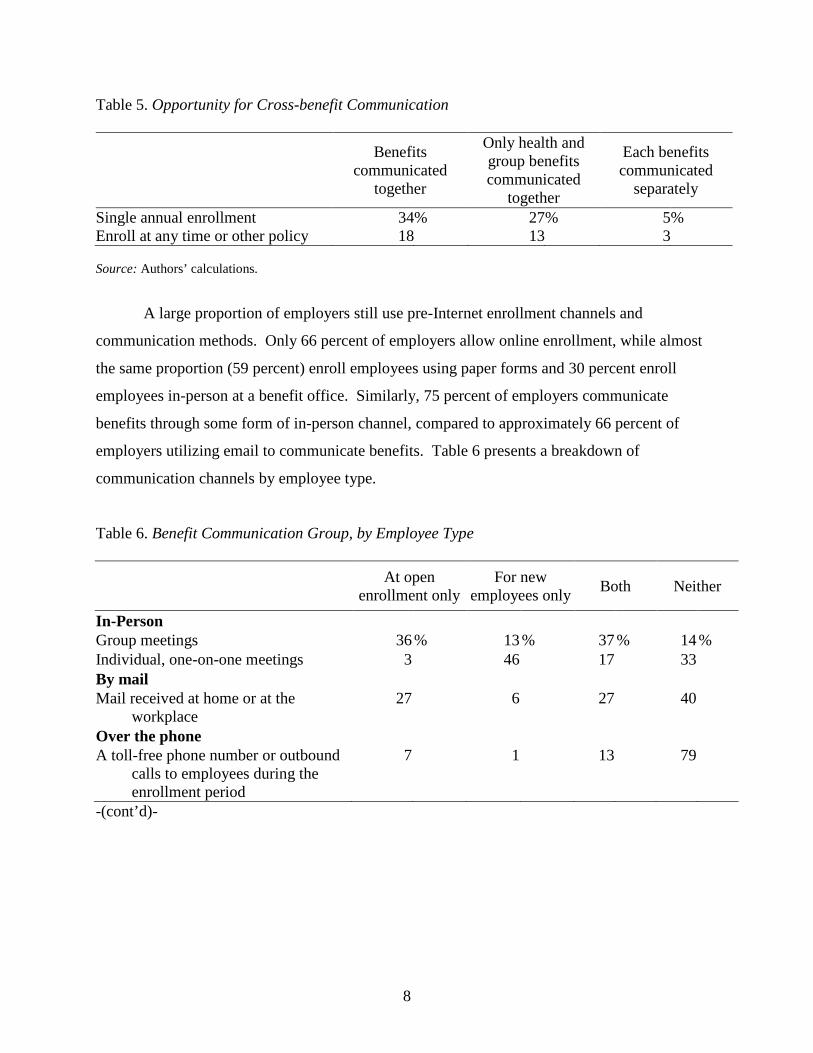
Single annual enrollment 34 % 27 % 5 % Enroll at any time or other policy 18 13 3 Source: Authors’ calculations.
A large proportion of employers still use pre-Internet enrollment channels and
communication methods. Only 66 percent of employers allow online enrollment, while almost
the same proportion (59 percent) enroll employees using paper forms and 30 percent enroll
employees in-person at a benefit office. Similarly, 75 percent of employers communicate
benefits through some form of in-person channel, compared to approximately 66 percent of
employers utilizing email to communicate benefits. Table 6 presents a breakdown of
communication channels by employee type.
Table 6. Benefit Communication Group, by Employee Type
At open enrollment only
For new employees only Both Neither
In-Person Group meetings 36 % 13 % 37 % 14 % Individual, one-on-one meetings 3 46 17 33 By mail Mail received at home or at the
workplace 27 6 27 40
Over the phone A toll-free phone number or outbound
calls to employees during the enrollment period
7 1 13 79
-(cont’d)-
9
Table 6. Benefit Communication Group, by Employee Type (cont’d)
At open enrollment only
For new employees only Both Neither
Electronically Email 33 1 38 28 An online presentation without the use
of interactive tools 15 4 15 66
An online presentation with the use of interactive tools such as insurance estimator
9 1 13 77
Mobile devices (e.g., BlackBerry, iPhone)
3 0 4 93
Other 4 1 4 92 Source: Authors’ calculations.
Life Insurance. This section summarizes responses to questions on supplementary life-
insurance plan benefit utilization and employer practices. On average, 40 percent of employees
enroll in supplementary life, but with a high degree of variability in the take-up rate (Figure 1).
Less variability is seen in average coverage levels, with most employers reporting average
coverage levels of one to three times pay (if coverage is presented as a pay-multiple) or between
$50,000 and $200,000 (if coverage is presented as a lump sum).
10
Figure 1. Distribution of Supplemental Life Insurance Take-up
Source: Authors’ calculations.
A number of life-insurance product characteristics (or “supply side” variables) also vary
across employers. The guaranteed issue amount (the amount below which a medical check-up is
not necessary) is less than six times annual salary, or less than $500,000, for most employers, but
considerable heterogeneity exists within this range (Figure 2). Similarly, the standard deviation
for the average monthly life insurance premium is $77.73 for a 45 year old male, compared to a
mean of $42.53. The maximum issue amount (MIA) for supplementary life insurance also varies
among employers, but over half of all employers report an amount of five times annual salary, or
$500,000 a year in coverage, as the MIA.
0
20
40
60
0% 20% 40% 60% 80% 100%
Freq
uenc
y
Percent who enroll
11
Figure 2. Distribution of Guaranteed Issue Amount
Source: Authors’ calculations.
The survey also sheds light on the prevalence of less well-known life-insurance practices,
such as defaulting employees into a particular level of coverage, the presentation format of
benefit options, and the guidance available:
• Almost 15 percent of employers report defaulting employees into some form of life
insurance coverage, with either a flat level of $10,000 or a multiple of salary (most often,
one to two times) being popular default options.
• Roughly half of employers present life insurance as a multiple of pay vs. a lump-sum.
• Most employers offer $10,000 increments for lump-sum coverage options.
• Seventy percent of employers do not provide guidance on life insurance coverage, and
only 19 percent of employers provide guidance on the enrollment screen or form.4
Long-Term Disability Practices. This section summarizes survey responses related to
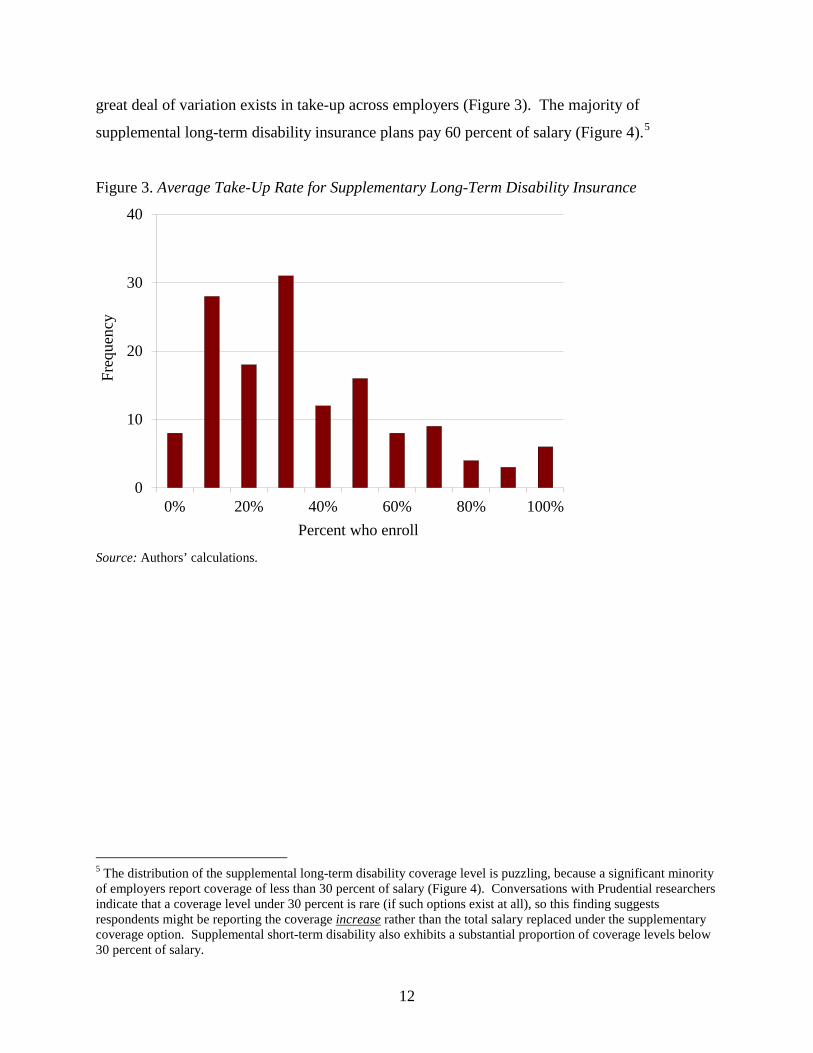
supplementary long-term disability. On average, 32 percent of employees enroll in this benefit
compared to 40 percent in the case of supplementary life insurance. Similar to life insurance, a
4 Coe, Belbase, and Wu (2012) find evidence that information present in the enrollment screen is more likely to affect behavior than information outside of the enrollment screen.
0
20
40
60
80
100
0 2 4 6 8 10
Freq
uenc
y
Times annual salary
12
great deal of variation exists in take-up across employers (Figure 3). The majority of
Figure 3. Average Take-Up Rate for Supplementary Long-Term Disability Insurance
Source: Authors’ calculations.
5 The distribution of the supplemental long-term disability coverage level is puzzling, because a significant minority of employers report coverage of less than 30 percent of salary (Figure 4). Conversations with Prudential researchers indicate that a coverage level under 30 percent is rare (if such options exist at all), so this finding suggests respondents might be reporting the coverage increase rather than the total salary replaced under the supplementary coverage option. Supplemental short-term disability also exhibits a substantial proportion of coverage levels below 30 percent of salary.
0
10
20
30
40
0% 20% 40% 60% 80% 100%
Freq
uenc
y
Percent who enroll
13
Figure 4. Most Popular Supplementary Long-Term Disability Coverage Option
Source: Authors’ calculations.
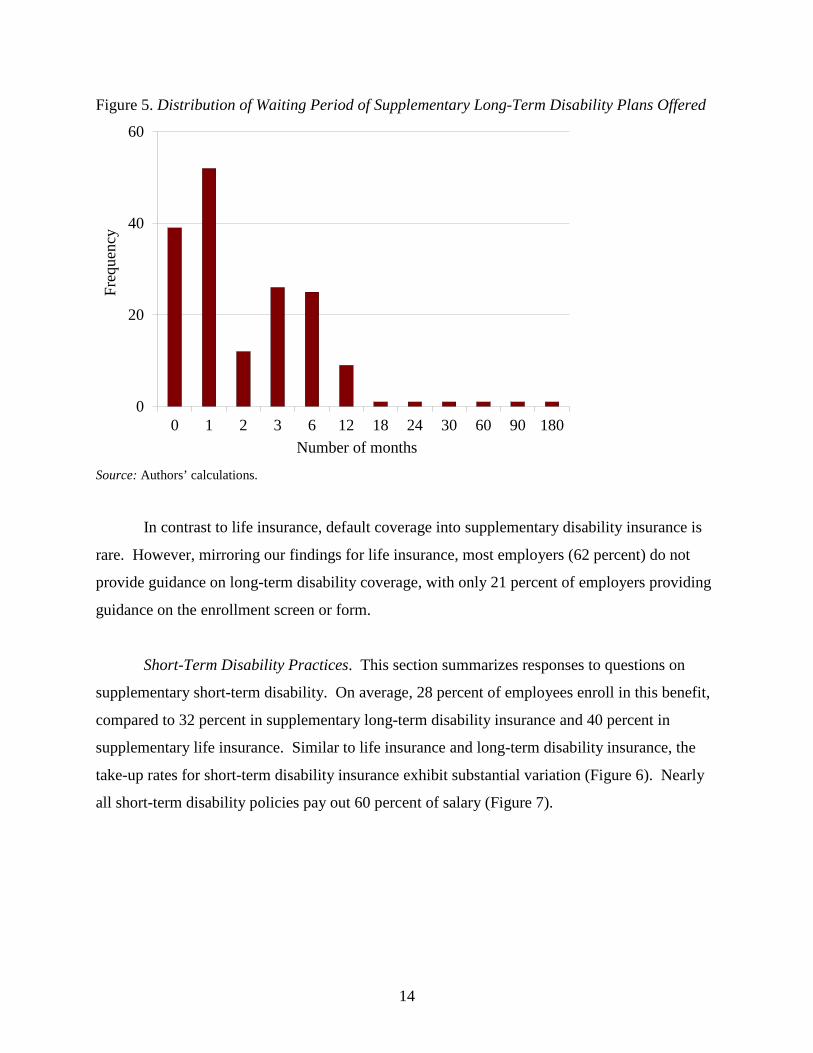
The survey also reveals information on the characteristics of other supplementary long-
term disability insurance products offered by employers, including the average monthly
employee premium, waiting periods for benefit payout, and exhaustion period (i.e. the maximum
duration of benefits). Most employers report a waiting period of 12 months or less before
benefits are paid out, with a high degree of variability within this range (Figure 5). Premiums
similarly vary widely across employers, with a reported average monthly premium of $10.71 to
cover 60 percent of pay with a standard deviation of $24.43. Unlike waiting periods and
premiums, which vary considerably, almost all employers offer disability benefits that last until
retirement.
0
10
20
30
40
50
0% 20% 40% 60% 80% 100%
Freq
uenc
y
Percent of salary
14
Figure 5. Distribution of Waiting Period of Supplementary Long-Term Disability Plans Offered
Source: Authors’ calculations.
In contrast to life insurance, default coverage into supplementary disability insurance is
rare. However, mirroring our findings for life insurance, most employers (62 percent) do not
provide guidance on long-term disability coverage, with only 21 percent of employers providing
guidance on the enrollment screen or form.
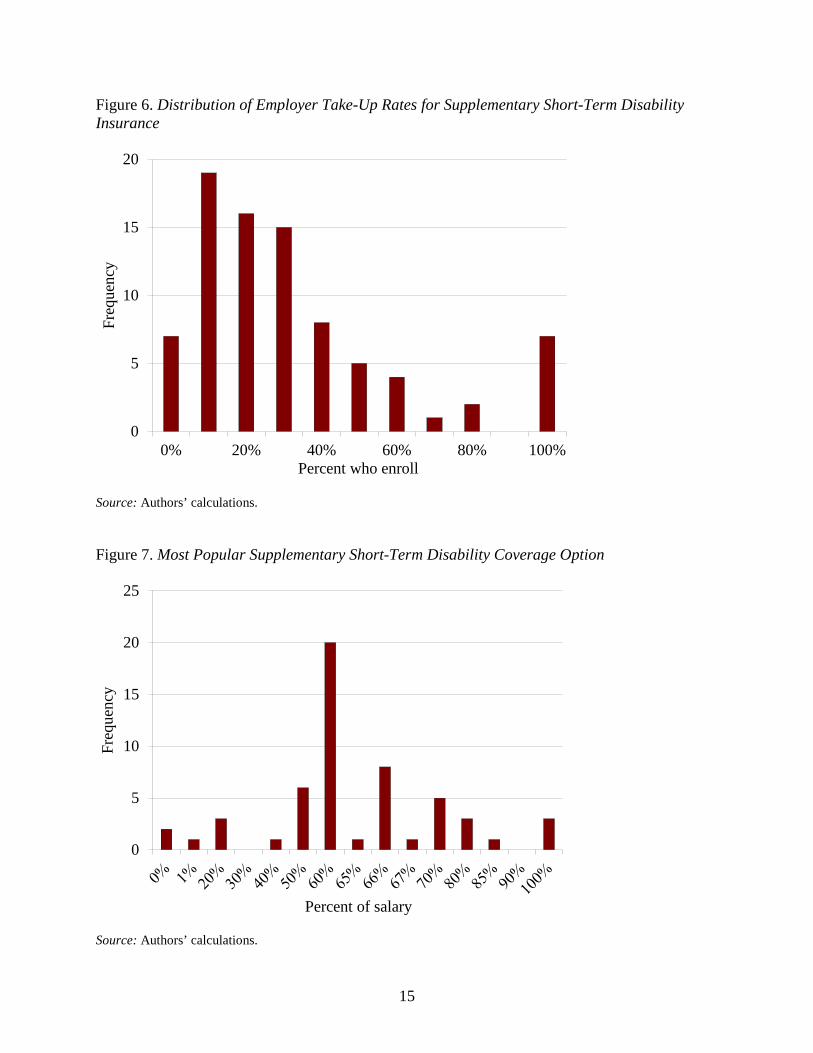
Short-Term Disability Practices. This section summarizes responses to questions on
supplementary short-term disability. On average, 28 percent of employees enroll in this benefit,
compared to 32 percent in supplementary long-term disability insurance and 40 percent in
supplementary life insurance. Similar to life insurance and long-term disability insurance, the
all short-term disability policies pay out 60 percent of salary (Figure 7).
0
20
40
60
0 1 2 3 6 12 18 24 30 60 90 180
Freq
uenc
y
Number of months
15
Figure 6. Distribution of Employer Take-Up Rates for Supplementary Short-Term Disability Insurance
Source: Authors’ calculations.
Figure 7. Most Popular Supplementary Short-Term Disability Coverage Option
Source: Authors’ calculations.
0
5
10
15
20
0% 20% 40% 60% 80% 100%
Freq
uenc
y
Percent who enroll
0
5
10
15
20
25
Freq
uenc
y
Percent of salary
16
As is the case for long-term disability insurance, the survey provides information on the
prevalence of the characteristics of the supplementary short-term disability insurance products
offered by employers, including the average monthly employee premium, waiting period, and
exhaustion period. Most employers report waiting periods of between 0 and 90 days before
benefits are paid out, with a high degree of variability within this range (Figure 8). Premiums
similarly vary widely across employers, with a reported average monthly premium of $16.61 to
cover 56 percent of pay with a standard deviation of 36.58. In contrast to the wide variation in
waiting periods and premiums, almost all employers offer disability benefits that last either three
or six months (about half for each duration).
Figure 8. Average Waiting Period of Supplementary Short-Term Disability Plans Offered
Source: Authors’ calculations.
Similar to life insurance and long-term disability insurance, most employers (69%) do not
provide guidance on appropriate short-term disability coverage, with only 20 percent of
employers providing such guidance on the enrollment screen or form.
0
5
10
15
20
25
30
0 1 3 5 7 8 10 14 15 28 30 60 90 180 365
Freq
uenc
y
Number of days
17
Regression Results
Using regression analysis, the study finds that cross-advertising, the enrollment window,
and the enrollment channel are correlated with benefit take-up for supplementary life insurance,
supplementary long-term disability insurance, and supplementary short-term disability insurance.
Benefit characteristics and the use of defaults are also related to the take-up of specific benefits.
Detailed regression results can be found in Appendix B.
Life Insurance. This study examines the relationship between employer practices and
two measures of supplementary life-insurance coverage: the take-up rate and coverage level.
The existence of a high default (over two times pay) is associated with a 15 percentage point
decrease in take-up, the largest change in take-up associated with any practice. Practices that
lower the probability of cross-advertising – communicating benefits separately and allowing
employees to enroll at any time instead of during a single annual enrollment event – are also
associated with lower take-up of supplementary life insurance. Notable factors positively
correlated with take-up include the maximum issue amount and the practice of enrolling all
employees online or over the phone using interactive tools (as opposed to enrolling new hires in
person using paper forms). Table 7 summarizes these results; detailed results for all regressions
in Tables 7-10 are available in Appendix B.
18
Table 7. Factors Related to Supplementary Life Insurance Take-Up
Baseline condition Test condition Change in take-up (percentage points)
Default of no coverage Default coverage of more than 2 times pay -15
All benefits communicated together Each benefit communicated separately -6
Enrollment is open once a year Enrollment is open all year -4
All benefits communicated together Only health and group benefits communicated together -4
Benefits administered by employer or directly through a work-site carrier
Benefits administered through a third party -3
Average age of employees is 42 Average age of employees is 45 -1 Maximum issue amount is 5.4 times
pay Maximum issue amount is 6.4 times
pay +1
New hires enroll in person using paper forms and lack access to online tools
All employees enroll online or over the phone and have access to interactive tools
+6
Notes: Percent change from a baseline of 39 percent. Statistically significant at an 85 percent confidence level. Source: Authors’ calculations.
Several factors related to take-up are also related to coverage level, but with an inverse
relationship. While high default coverage levels correlate with lower take-up, they are
associated with higher coverage levels. Similarly, allowing all employees to enroll online or
over the phone with interactive tools (a practice associated with higher take-up) is related to
lower coverage levels. Third-party administration of benefits is associated with both lower take-
up and lower-coverage levels and this consistency is unique. Surprisingly, requiring new hires to
sign up for life insurance in person (using paper forms) is associated with higher coverage levels.
Finally, as economic theory predicts, the guaranteed issue amount (the coverage threshold over
which medical examinations become necessary) is positively related to coverage level. Table 8
summarizes these results.
19
Table 8. Factors Related to Supplementary Life Insurance Coverage Level
Baseline condition Test condition Change in
coverage level (pay multiple)
New hires enroll in-person using paper forms and lack access to online tools
All employees enroll online or over the phone and have access to interactive tools
-0.75
Benefits administered by employer or directly through a work-site carrier
Benefits administered through a third-party -0.25
Guaranteed Issue Amount is 2.8 times pay Guaranteed Issue is 3.8 times pay +0.21
Default of no coverage Default coverage of more than 2 times pay +0.56
All employees enroll online or over the phone and have access to online tools
New employees enroll in person using paper forms +0.91
Notes: Relative to a baseline of 2.2 times annual pay. Statistically significant at an 85 percent confidence level. Source: Authors’ calculations.
Long-Term Disability Insurance. Only two aspects of employer practice are correlated
with the take-up of supplementary long-term disability benefits in a statistically significant way:
the enrollment window and the enrollment channel. Similar to life insurance, having a single
enrollment event for long-term disability insurance (rather than allowing employees to enroll at
any time) is associated with a higher take-up rate. Unlike life insurance, however, allowing
existing employees to enroll online or over the phone (without access to online tools) decreases
take-up compared to enrolling in-person using paper-forms. In addition to these employer
practices, a younger employee base and a higher proportion of parents in an employee base are
associated with higher take-up of supplementary long-term disability insurance. Table 9
summarizes these results.
20
Table 9. Factors Related to Supplementary Long-Term Disability Insurance Take-Up
Baseline condition Test condition Change in take-up (percentage points)
All employees enroll in-person using paper forms
Existing employees enroll online or over the phone without access to online tools
-13
Enrollment is open once a year Enrollment is open all year -10 Average age of employees is 42 Average age of employees is 45 -3 42 percent of employees are parents 52 percent of employees are parents +10 Notes: Percent change from a baseline of 32 percent. Statistically significant at an 85 percent confidence level. Source: Authors’ calculations.
Short-Term Disability Insurance. The enrollment window and cross-advertising are also
related to the take-up of short-term disability insurance. Similar to life insurance and long-term
disability insurance, having a single annual enrollment event (rather than allowing employees to
enroll at any time) is associated with a higher take-up rate. Unlike the other benefits examined,
communicating short-term disability insurance simultaneously with only health benefits is
associated with higher take-up than communicating the benefit with health and retirement
benefits. In addition to these employer practices, higher proportions of parents and/or women in
an employee-base are associated with higher take-up of supplementary short-term disability
insurance. Table 10 summarizes these results.
Table 10. Factors Related to Supplementary Short-Term Disability Insurance Take-Up
Baseline condition Test condition Change in take-up (percentage points)
Enrollment is open once a year Enrollment is open all year -19 51 percent of employees are female 61 percent of employees are female +2 42 percent of employees are parents 52 percent of employees are parents +3
All benefits communicated together Only health and group benefits communicated together +13
Notes: Percent change from a baseline of 32 percent. Statistically significant at an 85 percent confidence level. Source: Authors’ calculations.
21
Conclusion
The current study examines group benefits from the employer’s perspective. The
variation in benefit characteristics and employee practices is substantial, with each having the
potential to affect employees’ coverage decisions. Using regression analysis, the study finds that
cross-advertising, the frequency of the enrollment window, and the enrollment channel – phone,
online, or in person – are related to benefit take-up for all three benefits examined: life insurance
and short-term and long-term disability. Benefit characteristics and the use of defaults are also
related to the take-up of specific benefits.
One theme that emerges from this study is that communication strategies that increase the
salience of insurance products correlate with higher take-up rates. Specifically, the study
identifies two important strategies: timing and bundling. Across all three benefits, timing
enrollment to focus attention on benefits in one annual event is associated with higher take-up
than when employees are allowed to enroll at any time during the year. Similarly, bundling less-
salient benefits (in this case, life and disability insurance) with more-salient ones (health
insurance and retirement benefits) is linked with higher take-up across all three benefits
examined. In the case of short-term disability, communicating disability insurance together with
health insurance has a dramatic effect on take-up, but this effect disappears/weakens when
retirement benefits are also included. This result is consistent with findings from earlier studies
in the current research program which show that simply bringing attention to the potential for
debilitating illnesses can raise disability insurance take-up rates (Coe and Belbase 2013, Coe,
Belbase, and Wu 2012).6
Other results from this study also echo results from our previous work. Both Coe and
Belbase (2012) and Coe, Belbase and Wu (2012) showed that individuals have an aversion to
any steps that increase the hassle of enrollment.7 Several findings from this study support this
theme. Life insurance coverage level is strongly positively correlated with the guaranteed issue
6 During a qualitative study of the life and disability insurance decision-making process, several participants reported that they consider short-term disability insurance as an extension of medical insurance. Unlike long-term disability insurance, it was easy to imagine needing short-term disability insurance in the context of medical issues. 7 For example, during interviews conducted as part of a qualitative study, participants report not attending in-person information sessions on benefits and relying on inertia (past coverage decisions or the default coverage option) to decide how much life insurance coverage to get. A second study using an online enrollment experiment showed that communication strategies requiring effort, such as clicking on a link to a calculator, are less effective in changing behavior compared to strategies that minimize participant effort (or hassle), such as having the calculator on the same page as the relevant box from the enrollment form.
22
amount – the amount above which obtaining coverage becomes a “hassle”. Similarly, allowing
enrollment online or over the phone – which is generally easier for employees than filling out
paper forms – is associated with higher take-up of life insurance. An exception to this pattern
can be found in the take-up of long-term disability insurance, where requiring individuals to
enroll in-person using paper forms (a high-effort process) is associated with higher take up. One
reason may be that in-person enrollment provides employees with an opportunity to seek
guidance from a human resources professional, offsetting the extra effort required. Since the
study does not control for blue- versus white-collar work, it’s possible that companies with in-
person enrollment are also more likely to employ workers who engage in more hazardous blue-
collar work. An alternative explanation in line with the prior studies is that low long-term
disability take-up is driven primarily by a lack of salience, and anything that makes disability
more salient (such as a conversation about coverage options) has the potential to raise take-up.
These results are subject to several caveats. First, the findings are correlational. Even
though important factors (such as benefit generosity) are controlled for, other variables that
affect benefit utilization, such as employee-specific disability rates, are omitted due to a lack of
data. Second, the sample is not designed to be nationally representative. Third, the study uses a
survey rather than administrative data to analyze benefit practices and take-up rates. Despite
these limitations, the study sheds much-needed light on the prevalence of employer practices that
might affect life and disability insurance take-up, and it takes a step toward identifying practices
that may influence employee behavior. Future studies with access to administrative data
spanning periods in which benefit practices have changed could further improve our
understanding of this topic.
23
References Chandra, A., & Samwick, A. A. (2009). Disability Risk and the Value of Disability Insurance. In
Health at Older Ages: The Causes and Consequences of Declining Disability among the Elderly (pp. 295-336). University of Chicago Press.
Choi, James, J. Laibson, David, I., Madrian, Bridgitte, & Metrick, Andrew. 2001. “Defined
Contribution Pensions: Plan Rules, Participant Decisions, and the Path of Least Resistance.” Working Paper 8655. Cambridge, MA: National Bureau of Economics Research.
Coe, Norma B. and Anek Belbase. 2012. “How do People Decide on Life Insurance and Long-
Term Disability Insurance Coverage?” Working Paper. Chestnut Hill, MA: Center for Retirement Research at Boston College.
Coe, Norma B., Anek Belbase, and April Yanyuan Wu. 2013. “Overcoming Barriers to Life
Insurance Coverage: A Behavioral Approach.” Working Paper. Chestnut Hill, MA: Center for Retirement Research at Boston College.
Coe, Norma B., Anek Belbase, and April Yanyuan Wu. 2013. “Overcoming Barriers to Long-
Term Disability Insurance Coverage: A Behavioral Approach.” Working Paper. Chestnut Hill, MA: Center for Retirement Research at Boston College.
Hurd, Michael, D. Lilliard, Lee, A. Panis, Constantijn. 1998. “An Analysis of the Choice to Cash
out Pension Rights at Job Change or Retirement.” Discussion Paper DRU-1979-DOL. Santa Monica, CA: RAND.
Kahneman, Daniel, and Tversky, Amos. 1979. “Prospect Theory: An Analysis of Decision
Under Risk.” Econometrica 47(2): 263-291. Kahneman, Daniel, Slovic, Paul, and Tversky, Amos. 1982. Judgment Under Uncertainy:
Heuristics and Biases. Cambridge, U.K., and New York: Cambridge University Press. Lewis, Frank D. 1989. “Dependents and the Demand for Life Insurance.” American Economic
Review 79(3): 452-67 Madrian, Brigitte, C., & Shea, Dennis, F. 2001. “The Power of Suggestion: Inertia in 401(k)
Participation and Savings Behavior.” The Quarterly Journal of Economics 116(4): 1149-1187.
Mullainathan, Sendhil, and Thaler, H. Richard. 2000. “Behavioral Economics.” Working Paper
7948. Cambridge, MA: National Bureau of Economics Research. Mussweiler, T., Englich, B., & Strack, F. 2004. Anchoring Effect. In R. Pohl, Cognitive
Illusions: A Handbook on Fallacies and Biases in Thinking, Judgment and Memory pp. 183-200. New York City: Psychology Press.
24
Prudential Insurance Company. 2011. “Sixth Annual Study of Employee Benefits: Today & Beyond.” Newark, NJ.
Richard, S. F. 1975. “Optimal Consumption, Portfolio and Life Insurance Rules for an Uncertain
Lived Individual in a Continuous Time Model. Journal of Financial Economics 2(2): 187-203.
Tversky, A., & Kahneman, D. 1986. Rational Choice and the Framing of Decisions. The Journal
of Business: The Behavioral Foundations of Economic Theory 59(4, part 2): S251-S278. Yaari, Menahem E. 1965. “Uncertain Lifetime, Life Insurance, and the Theory of the
Consumer.” Review of Economic Studies 32(2): 137-50. Zietz, Emily Norman. 2003. “An Examination of the Demand for Life Insurance.” Risk
Management and Insurance Review 6: 159–191.
25
Appendix A. The Full Survey
Consent Form
The Society for Human Resource Management (SHRM) is conducting a
CONFIDENTIAL survey of HR professionals about employee benefit practices. Please
participate in this survey by answering the following questions and hitting the submit button at
the end no later than {3 weeks from date survey is fielded}.
You are being asked to participate in a research study titled "Improving Employees'
Benefit Decisions" by the Society for Human Resource Management (SHRM). You were
selected to participate in this project because our records indicate that you are familiar with
decisions regarding the employee benefits your organization offers.
The purpose of this study is to understand the prevalence and effectiveness of HR
practices related to life and disability insurance.
This study will be conducted through this online survey. The survey should take you
approximately 15-20 minutes to complete.
Your participation is voluntary. You are free to withdraw or skip questions for any
reason. There are no penalties for withdrawing or skipping questions.
If you have questions or concerns concerning this research you may contact Tanya
Mulvey, SHRM, at 703-535-6355, or [email protected]. If you have questions about your
rights as a research participant, you may contact the Office for Research Protections, Boston
About you: 1. What is your role at your organization?
o President, CEO, Chairman o Partner, Principal o CHRO, CHCO o Vice President or Assistant/Associate Vice President o Director or Assistant/Associate Director o Manager, Generalist o Administrator o Coordinator o Representative, Associate o Specialist o Other __________________________________________
2. Are you familiar with:
1) the goals of your organization’s employee benefits program, 2) the process by which the benefits program is communicated and administered, and 3) the manner and extent to which employees participate in the benefits program? [IF QUESTION NOT ANSWERED, CONTINUE TO Q3]
o Yes, I am familiar with all three topics o No, I am not familiar with one or more topics [DISQUALIFY] o Not applicable; our organization does not offer any benefits [DISQUALIFY]
About Your Organization’s Benefit-Eligible Employees: 37. What percent of your organization’s benefit-eligible employees:
Is female _____ % Is married _____ % Is the parent or guardian of any children under the age of 18 _____ %
38. What is the average age of benefit-eligible employees in your organization?
_____ years of age. 39. What is the average or median annual salary of benefit-eligible employees in your
organization? Average dollars per year $____. Median dollars per year $_________
27
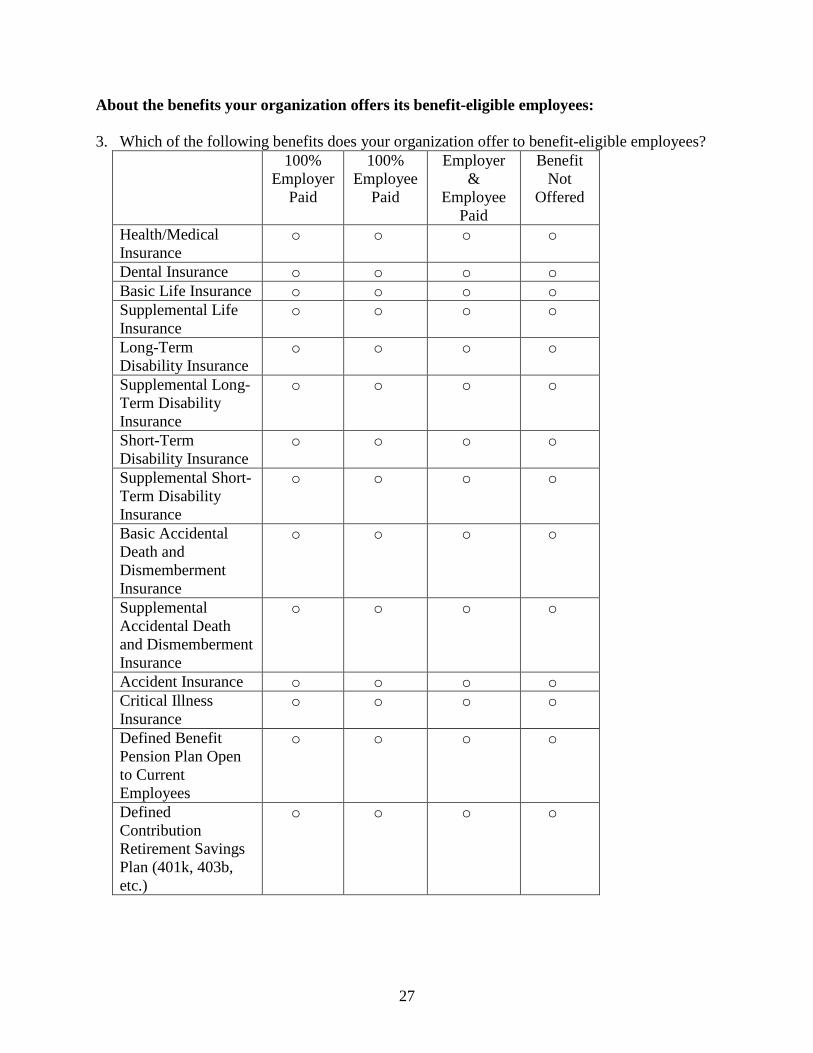
About the benefits your organization offers its benefit-eligible employees: 3. Which of the following benefits does your organization offer to benefit-eligible employees?
100% Employer
Paid
100% Employee
Paid
Employer &
Employee Paid
Benefit Not
Offered
Health/Medical Insurance
o o o o
Dental Insurance o o o o Basic Life Insurance o o o o Supplemental Life Insurance
o o o o
Long-Term Disability Insurance
o o o o
Supplemental Long-Term Disability Insurance
o o o o
Short-Term Disability Insurance
o o o o
Supplemental Short-Term Disability Insurance
o o o o
Basic Accidental Death and Dismemberment Insurance
o o o o
Supplemental Accidental Death and Dismemberment Insurance
o o o o
Accident Insurance o o o o Critical Illness Insurance
o o o o
Defined Benefit Pension Plan Open to Current Employees
o o o o
Defined Contribution Retirement Savings Plan (401k, 403b, etc.)
o o o o
28
4. How are your benefits administered? Please check all that apply. Self-administered. Directly from a work-site carrier (self-insured). Through a traditional broker-carrier. Through a third-party administrator.
5. When are all employees able to enroll in the supplemental life and disability insurance
programs offered by your organization? [SHOW IF Q3 Supplemental Life, LTD or STD DOES NOT= "Benefit Not Offered"]
o Once a year during open enrollment. o At any time during the year. o Other______________________________________
6. How are benefits options, prices, etc. communicated to employees at each open enrollment
and to new employees? Please check all that apply.
At Open
Enrollment For New
Employees In-person
Group meetings Individual, one-on-one meetings
By mail Mail received at home or at the workplace
Over the phone A toll-free phone number or outbound calls to employees during the enrollment period
Electronically Through email An online presentation without the use of interactive tools
An online presentation with the use of interactive tools like an insurance estimator
Mobile devices (e.g., BlackBerry, iPhone) Other
If you selected "other" above, please describe the other ways that benefits options are communicated to employees: ______________________________________
7. Who communicates benefits to new employees? Please check all that apply. [only show
benefits offered based on question 3]
The Employer The Broker-Carrier Health/Medical Insurance Dental Insurance Basic Life Insurance
29
Supplemental Life Insurance Long-Term Disability Insurance Supplemental Long-Term Disability Insurance
Basic Accidental Death and Dismemberment Insurance
Supplemental Accidental Death and Dismemberment Insurance
Accident Insurance Critical Illness Insurance Defined Benefit Pension Plan Open to Current Employees
Defined Contribution Retirement Savings Plan (401k, 403b, etc.)
8. How are employees able to enroll in benefits?
Please check all that apply. Online via Internet or intranet Over the phone In-person (e.g., at a benefits office) Paper forms Automatically enrolled in certain benefits Other ______________________________________
9. Does your organization communicate information on all of the benefits offered together – i.e., retirement savings, health, and other group benefits as one package – or separately? o Information on benefits is communicated together as part of a package. o Each benefit is communicated separately as a standalone benefit. o Health/medical and other group benefits are communicated separately from retirement
benefits. 10. What more could broker-carriers be doing to support your organization’s benefit programs?
Supplemental life insurance: [SHOW SECTION IF Q3 Supplemental Life Insurance = 100% employer, 100% employee, or employer & employee paid] 11. How many of your employees are eligible for and elect to buy supplemental life-insurance
coverage?
Number of eligible employees: _____ Number of employees who enroll: _____
12. What is the supplemental life insurance guaranteed issue amount?
_____ times annual salary; OR $________ in face value.
13. What is the maximum supplemental life insurance issue amount? _____ times annual salary; OR $________ in face value
14. What is the monthly employee premium by age for $100,000 in supplemental life insurance coverage?
Age
Monthly employee premium per $100,000 in coverage
Male Female Either sex
(if premium not known by sex)
25 $ $ $ 35 $ $ $ 45 $ $ $ 55 $ $ $ 65 $ $ $
15. What is the default coverage option for supplemental life insurance coverage?
o No coverage. o A coverage amount of $_______. o A coverage amount of ______ times annual salary. o Other, please specify:______________.
16. How are supplemental life insurance coverage options presented to employees? Please check
all that apply. □ As a multiple of pay. □ As a lump-sum amount. □ Other, please specify:______________.
31
17. [Show if Q16 = lump-sum amount] In what coverage increments are supplemental life insurance coverage options presented to employees (in $10,000 increments, $25,000 increments, etc.)? $__________.
18. Are employees provided with any guidance on an appropriate level of supplemental life
insurance coverage? Please check all that apply. □ No. [EXCLUSIVE] □ Yes, guidance is available on the enrollment screen or form. □ Yes, guidance is provided outside of the enrollment screen or form.
If yes, please describe the type of guidance:_____________________
19. What is the average supplemental life insurance coverage amount for employees who elect this benefit? _____ times annual salary; OR $________ in face value.
20. What percentage of salary does the employer provide for long-term disability coverage at no
cost to employees? % of salary_____; OR dollars in face value $____.
Supplemental Long-term disability insurance: [SHOW SECTION IF Q3 Supplemental LTD = 100% Employer Paid, 100% Employee Paid, or Employer and Employee Paid] 21. How many of your employees are eligible for and elect to buy supplemental long-term
disability coverage? Number of eligible employees: _____ Number of employees who enroll: _____
22. What are the two most popular coverage options that your organization offers for supplemental long-term disability coverage? Coverage option 1: __% of salary Coverage option 2: __% of salary
23. What is the monthly employee premium by age for supplemental long-term disability coverage, for the following coverage option(s)?
32
Monthly Employee Premiums, By Coverage Option and Age Age [Answer 1 Q22]% of Salary [Answer 2 Q22]% of Salary 25 $ $ 35 $ $ 45 $ $ 55 $ $ 65 $ $
24. What is the waiting period for supplemental long-term disability coverage? If coverage
began on the date of hire, enter 0; if coverage began on the first of the month following the date of hire, enter 1; otherwise enter the number of months until coverage began. _____ months.
25. What is the exhaustion period for supplemental long-term disability coverage?
o Limited number of years. Please enter the number of years:____. o Retirement. o Other, please specify: ___________.
26. What is the default coverage option for supplemental long-term disability coverage?
o No coverage. o Coverage from prior year. o A percent of salary equal to _____%. o Other, please specify:______________.
27. Are employees provided with any guidance on the appropriate level of supplemental long-term disability coverage? Please check all that apply. □ No. [EXCLUSIVE] □ Yes, guidance is available on the enrollment screen or form. □ Yes, guidance is provided outside of the enrollment screen or form.
If yes, please describe the type of guidance:________________. 100% Employer-Paid Short-term disability insurance: [SHOW SECTION IF Q3 Short-term Disability Insurance = 100% Employer Paid]
28. What percentage of salary does the employer provide for short-term disability coverage at no
cost to employees? _____% of salary; OR $________ in face value
33
Supplemental Short-term disability insurance: [SHOW SECTION IF Q3 Supplemental STD = 100% Employer Paid, 100% Employee Paid, or Employer and Employee Paid]
29. How many of your employees are eligible for and elect to buy supplemental short-term
disability coverage? Number of eligible employees:_______ Number of employees who enroll:_____
30. What is the average supplemental short-term disability coverage level for employees who elect this benefit? _____ % of salary; OR $________ in face value.
31. What are the two most popular coverage options that your organization offers for
supplemental short-term disability coverage? Coverage option 1: ___% of salary Coverage option 2: ___% of salary
32. What is the monthly employee premium by age for supplemental short-term disability coverage, for the following coverage option(s)?
Monthly Employee Premiums, By Coverage Option and Age Age [Answer 1 Q31]% of Salary [Answer 2 Q31]% of Salary 25 $ $ 35 $ $ 45 $ $ 55 $ $ 65 $ $
33. What is the waiting period for supplemental short-term disability coverage?
_____ days.
34. What is the exhaustion period for supplemental short-term disability coverage?
_____ months. 35. What is the default coverage option for supplemental short-term disability coverage?
o No coverage. o Coverage from prior year. o A percent of salary equal to _____%. o Other, please specify:______________.
34
36. Are employees provided with any guidance on the appropriate level of supplemental short-term disability coverage? Please check all that apply.
□ No. [EXCLUSIVE] □ Yes, guidance is available on the enrollment screen or form. □ Yes, guidance is provided outside of the enrollment screen or form.
If yes, please describe the type of guidance:__________________
Thank You for Participating in SHRM Surveys!
Your responses to the Improving Employees' Benefit Decisions Survey have been successfully submitted.
View recently released research from SHRM
Are you PHR, SPHR, GPHR, PHR-CA, SPHR-CA, HRMP or HRBP Certified? Please print this page with the name of the survey you have participated in along with the date. You will also be sent an email indicating that you have participated in this survey. Please use this information as documentation for your HRCI recertification credits. You will receive 1 HRCI general recertification credit for taking this survey by following the instructions below. Remember, a maximum of 1 credit per year will be awarded for survey participation. Instructions for Receiving HRCI Recertification Credits: If you are a SHRM member with a current PHR, SPHR, GPHR, PHR-CA, SPHR-CA, HRMP or HRBP credential from the HR Certification Institute, you will receive 1 general recertification credit per year for completing a SHRM Research survey. This means that over the three year recertification period, you can earn 3 general recertification credits by completing 3 surveys (1 survey per year). To log your recertification credit for taking this survey: 1. Go to the HR Certification Institute's website – www.hrci.org and login with your HRCI login information. The "Login" button is located on right side of the page. 2. Under the Action Items section, click on the "Report or Add New Activity to Online Recertification Application" to record your participation. When the new page loads, scroll down to Leadership and click on Add/Review. 3. Under the Type of Activity dropdown box, select “Participation in SHRM Survey,” then under Activity Details enter the title of the survey in which you participated. Remember, a maximum of 1 credit per year will be awarded for survey participation.
QUESTIONS? Please contact the SHRM Survey Research Center at +1.703.535.6301 or by e-mail at [email protected]. For general inquiries, contact SHRM at 800.283.7476 or by e-mail at [email protected].
Appendix B. Summary Statistics and Detailed Regression Results Table A1. Summary Statistics for Supplemental Life Insurance, Take-up Regression
Variables Number of observations Mean Standard
deviation Minimum Maximum
Life insurance paid 100% by employer 468 0.91 0.29 0 1 Benefits offered 468 9.75 2.45 0 13 Benefits administered, through broker carrier 468 0.52 0.50 0 1 Benefits administered, through third party 468 0.45 0.50 0 1 Enrollment, allowed at anytime 468 0.21 0.41 0 1 Enrollment, other than at anytime 468 0.12 0.33 0 1 Coverage offered by Broker Carrier only 468 0.06 0.25 0 1 Coverage offered by Broker Carrier and Employer 468 0.06 0.23 0 1 Coverage offered from by other than the Broker Carrier or Employer 468 0.42 0.49 0 1 Enrollment channel, online/phone with interactive tools for just new
employees 468 0.20 0.40 0 1 Enrollment channel, online/phone with interactive tools for new and
existing employees 468 0.11 0.32 0 1 Enrollment channel, online/phone with no interactive tools for just
new employees 468 0.26 0.44 0 1 Enrollment channel, online/phone with no interactive tools for new
Table A2. Regression Results for Life Insurance Take-up Rate Variables Coefficient Life insurance paid 100% by employer -3.65
(3.62) Benefits offered -0.08
(0.68)
Benefits administered, through broker carrier -3.59 *
(2.08)
Benefits administered, through third party -2.83
(2.08)
Enrollment, allowed at anytime -4.19 *
(2.59)
Enrollment, other than at anytime 1.33
(3.21)
Coverage offered by Broker Carrier only -2.66
(4.82)
Coverage offered by Broker Carrier and Employer -2.55
(4.93)
Coverage offered from by other than the Broker Carrier or Employer 0.95
(2.36)
Enrollment channel, online/phone with interactive tools for new employees -2.30
(3.69)
Enrollment channel, online/phone with interactive tools for new and existing employees 6.34
(4.70) Enrollment channel, online/phone with no interactive tools for just new
employees 2.12
(3.26)
Enrollment channel, online/phone with no interactive tools for new and existing employees 0.11
(4.08) Benefit communication method, all separately -6.09 *
(4.18)
Benefit communication method, health and medical separate from retirement -3.86 *
(2.15)
Percent female -0.01
(0.05)
Percent married 0.10
(0.08)
Percent parents 0.04
(0.06)
Average age -0.36 *
(0.20)
-(cont’d)-
39
Table A2. Regression Results for Life Insurance Take-up Rate (cont’d) Variables Coefficient Average wage -0.24
(0.49) Monthly premium -4.68
(5.35)
Default coverage, $10,000 in coverage 7.67
(6.52)
Default coverage, 1 times salary -1.16
(9.74)
Default coverage, 2 times salary Omitted
Default coverage, other -15.21 *
(7.91)
Guidance provided, in enrollment screen -2.80
(2.64)
Guidance provided, outside of enrollment screen 1.40
(3.52)
Guaranteed issue amount 0.22
(0.65)
Maximum issue amount 1.06 **
(0.48)
Benefits offered, missing -0.74
(9.08)
Benefits administered, through broker carrier, missing Omitted
Enrollment, allowed at anytime, missing 5.54
(6.85)
Coverage offered by Broker Carrier only, missing Omitted
Coverage offered by Broker Carrier and Employer, missing Omitted
Coverage offered from other than the Broker Carrier or Employer, missing -9.57
(10.39)
Enrollment channel, online/phone with interactive tools for just new employees, missing Omitted
Enrollment channel, online/phone with no interactive tools, missing Omitted
Benefit communication method, all separately, missing -3.06
(21.78) Percent female, missing 8.23 *
(5.47)
Percent married, missing -5.12
(5.74)
-(cont’d)-
40
Table A2. Regression Results for Life Insurance Take-up Rate (cont’d) Variables Coefficient Percent parents, missing 9.18 **
(4.05)
Average age, missing -18.59 **
(9.31)
Average wage, missing 0.61
(4.31)
Monthly premium, missing -3.26
(2.60)
Default coverage, $10,000 in coverage, missing -8.61
(16.32)
Default coverage, other, missing 7.00
(16.72)
Guidance provided, in enrollment screen, missing 1.94
(7.14)
Guaranteed issue amount, missing -2.70
(3.74)
Maximum issue amount, missing 1.28
(3.96)
Adjusted R2 0.05 Number of observations 468
Note: Robust standard errors are in parentheses. The coefficients are significant at the 15-percent level (*), or the 5-percent level (**). Source: Authors’ calculations.
41
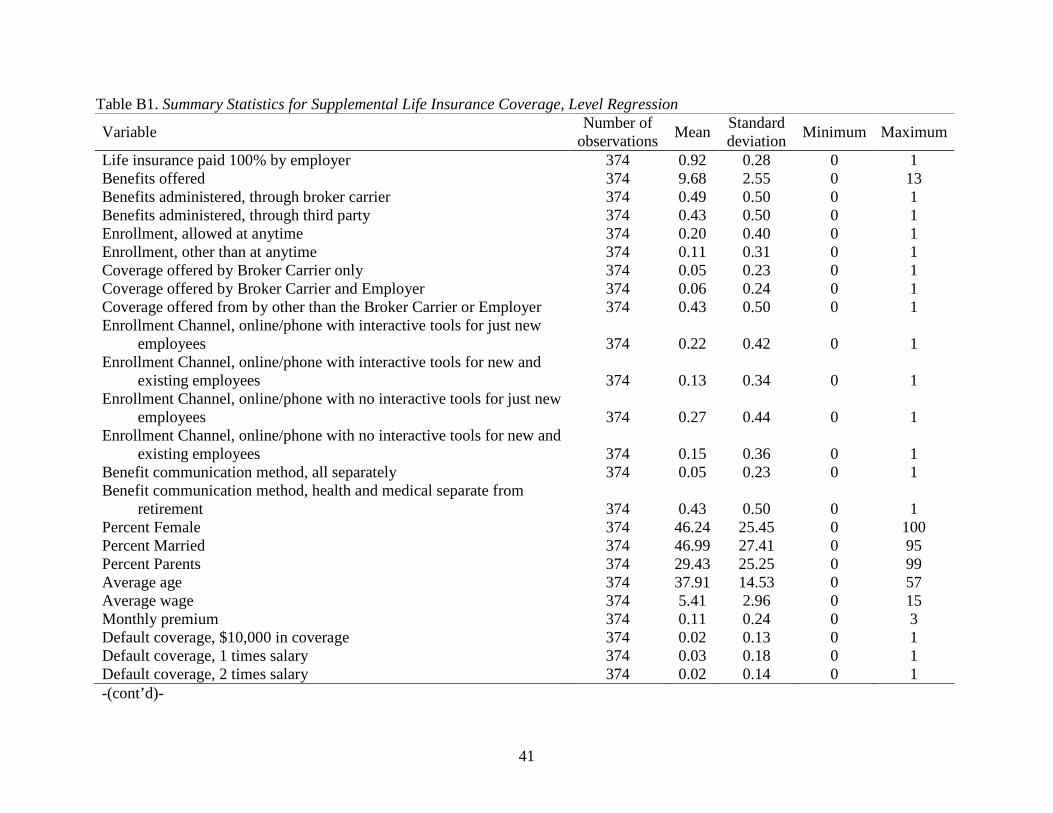
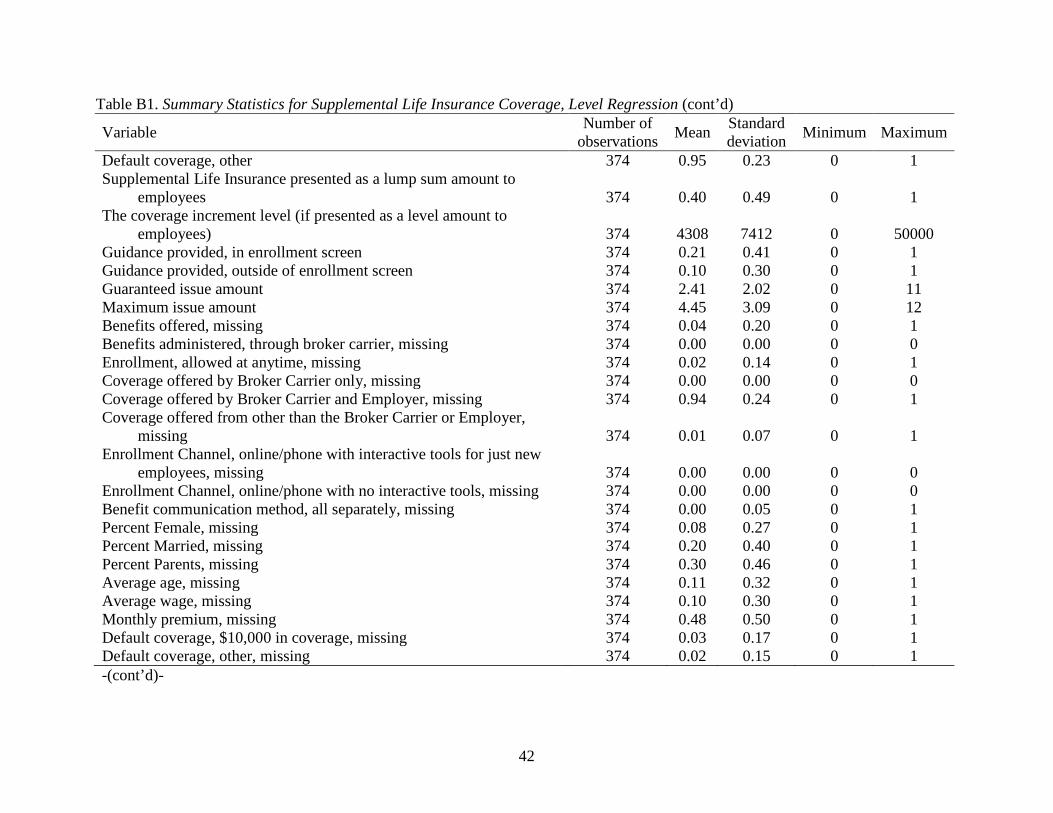
Table B1. Summary Statistics for Supplemental Life Insurance Coverage, Level Regression
Variable Number of observations Mean Standard
deviation Minimum Maximum
Life insurance paid 100% by employer 374 0.92 0.28 0 1 Benefits offered 374 9.68 2.55 0 13 Benefits administered, through broker carrier 374 0.49 0.50 0 1 Benefits administered, through third party 374 0.43 0.50 0 1 Enrollment, allowed at anytime 374 0.20 0.40 0 1 Enrollment, other than at anytime 374 0.11 0.31 0 1 Coverage offered by Broker Carrier only 374 0.05 0.23 0 1 Coverage offered by Broker Carrier and Employer 374 0.06 0.24 0 1 Coverage offered from by other than the Broker Carrier or Employer 374 0.43 0.50 0 1 Enrollment Channel, online/phone with interactive tools for just new
employees 374 0.22 0.42 0 1 Enrollment Channel, online/phone with interactive tools for new and
existing employees 374 0.13 0.34 0 1 Enrollment Channel, online/phone with no interactive tools for just new
employees 374 0.27 0.44 0 1 Enrollment Channel, online/phone with no interactive tools for new and
existing employees 374 0.15 0.36 0 1 Benefit communication method, all separately 374 0.05 0.23 0 1 Benefit communication method, health and medical separate from
Table B2. Regression Results for Life Insurance Coverage Level Variables Coefficient Life insurance paid 100% by employer -0.09
(0.25)
Benefits offered 0.01
(0.05)
Benefits administered, through broker carrier -0.18
(0.14)
Benefits administered, through third party -0.25 *
(0.14)
Enrollment, allowed at anytime 0.20
(0.17)
Enrollment, other than at anytime -0.18
(0.23)
Coverage offered by Broker Carrier only -0.32
(0.34)
Coverage offered by Broker Carrier and Employer 0.09
(0.33)
Coverage offered from by other than the Broker Carrier or Employer -0.05
(0.15)
Enrollment Channel, online/phone with interactive tools for just new employees 0.91 **
(0.24)
Enrollment Channel, online/phone with interactive tools for new and existing employees -0.75 **
(0.30)
Enrollment Channel, online/phone with no interactive tools for just new employees -0.07
(0.22)
Enrollment Channel, online/phone with no interactive tools for new and existing employees 0.09
(0.27)
Benefit communication method, all separately 0.09
(0.33)
Benefit communication method, health and medical separate from retirement -0.07
(0.14)
Percent Female -0.01 *
(0.00)
Percent Married -0.01 **
(0.01)
Percent Parents 0.00
(0.00)
Average age 0.03 *
(0.01)
-(cont’d)-
45
Table B2. Regression Results for Life Insurance Coverage Level (cont’d) Variables Coefficient Average wage -0.05 *
(0.03)
Monthly premium -0.28
(0.33)
Default coverage, $10,000 in coverage -0.66
(0.55)
Default coverage, 1 times salary Omitted
Default coverage, 2 times salary 0.38
(0.61)
Default coverage, other 0.56 *
(0.39)
Supplemental Life Insurance presented as a lump sum amount to employees -0.24
(0.49)
The coverage increment level if presented as a level amount to employees 0.00
(0.00)
Guidance provided, in enrollment screen 0.28 *
(0.17)
Guidance provided, outside of enrollment screen 0.10
(0.24)
Guaranteed issue amount 0.21 **
(0.04)
Maximum issue amount 0.04
(0.03)
Benefits offered, missing 0.30
(0.60)
Benefits administered, through broker carrier, missing Omitted
Enrollment, allowed at anytime, missing -0.61
(0.49)
Coverage offered by Broker Carrier only, missing Omitted
Coverage offered by Broker Carrier and Employer, missing Omitted
Coverage offered from other than the Broker Carrier or Employer, missing -0.26
(0.96)
Enrollment Channel, online/phone with interactive tools for just new employees, missing Omitted
Enrollment Channel, online/phone with no interactive tools, missing Omitted
Benefit communication method, all separately, missing 0.19
(1.30)
-(cont’d)-
46
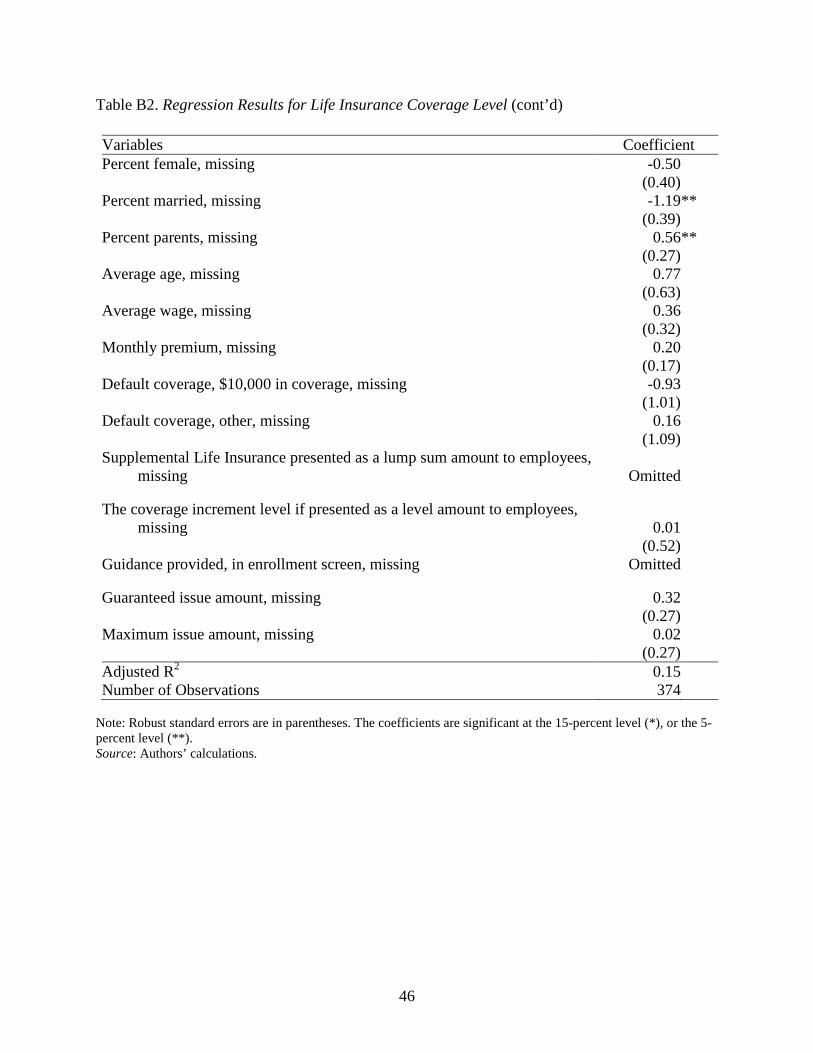
Table B2. Regression Results for Life Insurance Coverage Level (cont’d) Variables Coefficient Percent female, missing -0.50
(0.40)
Percent married, missing -1.19 **
(0.39)
Percent parents, missing 0.56 **
(0.27)
Average age, missing 0.77
(0.63)
Average wage, missing 0.36
(0.32)
Monthly premium, missing 0.20
(0.17)
Default coverage, $10,000 in coverage, missing -0.93
(1.01)
Default coverage, other, missing 0.16
(1.09)
Supplemental Life Insurance presented as a lump sum amount to employees, missing Omitted
The coverage increment level if presented as a level amount to employees,
missing 0.01
(0.52)
Guidance provided, in enrollment screen, missing Omitted
Guaranteed issue amount, missing 0.32
(0.27)
Maximum issue amount, missing 0.02
(0.27)
Adjusted R2 0.15 Number of Observations 374
Note: Robust standard errors are in parentheses. The coefficients are significant at the 15-percent level (*), or the 5-percent level (**). Source: Authors’ calculations.
47
Table C1. Summary Statistics for Supplemental Long Term Disability Take-up Rate Regression
Variable Number of observations Mean Standard
deviation Minimum Maximum
Enrollment, allowed at anytime 143 0.23 0.42 0 1 Enrollment, other than at anytime 143 0.07 0.26 0 1 Enrollment Channel, online/phone with interactive tools for just new
employees 143 0.20 0.40 0 1 Enrollment Channel, online/phone with interactive tools for new and
existing employees 143 0.11 0.32 0 1 Enrollment Channel, online/phone with no interactive tools for just new
employees 143 0.29 0.45 0 1 Enrollment Channel, online/phone with no interactive tools for new and
existing employees 143 0.13 0.34 0 1 Benefit communication method, all separately 143 0.06 0.24 0 1 Benefit communication method, health and medical separate from
retirement 143 0.43 0.50 0 1 Percent Female 143 47.45 26.79 0 100 Percent Married 143 49.43 26.42 0 100 Percent Parents 143 29.38 25.60 0 100 Average age 143 36.43 16.21 0 57 Average wage 143 5.03 3.22 0 15 Coverage option #1, as a percent of salary 143 40.90 28.55 0 100 Waiting period, days 143 101.54 255.05 0 2700 Default coverage option, as a percent of salary 143 10.85 23.72 0 100 Guidance provided, in enrollment screen 143 0.22 0.42 0 1 Guidance provided, outside of enrollment screen 143 0.16 0.37 0 1 Percent of salary covered by employer 143 40.44 29.54 0 100 Benefits administered, missing 143 0.00 0.00 0 0 Enrollment, allowed at anytime, missing 143 0.05 0.22 0 1 Enrollment Channel, online/phone with interactive tools for just new
employees, missing 143 0.00 0.00 0 0 -(cont’d)-
48
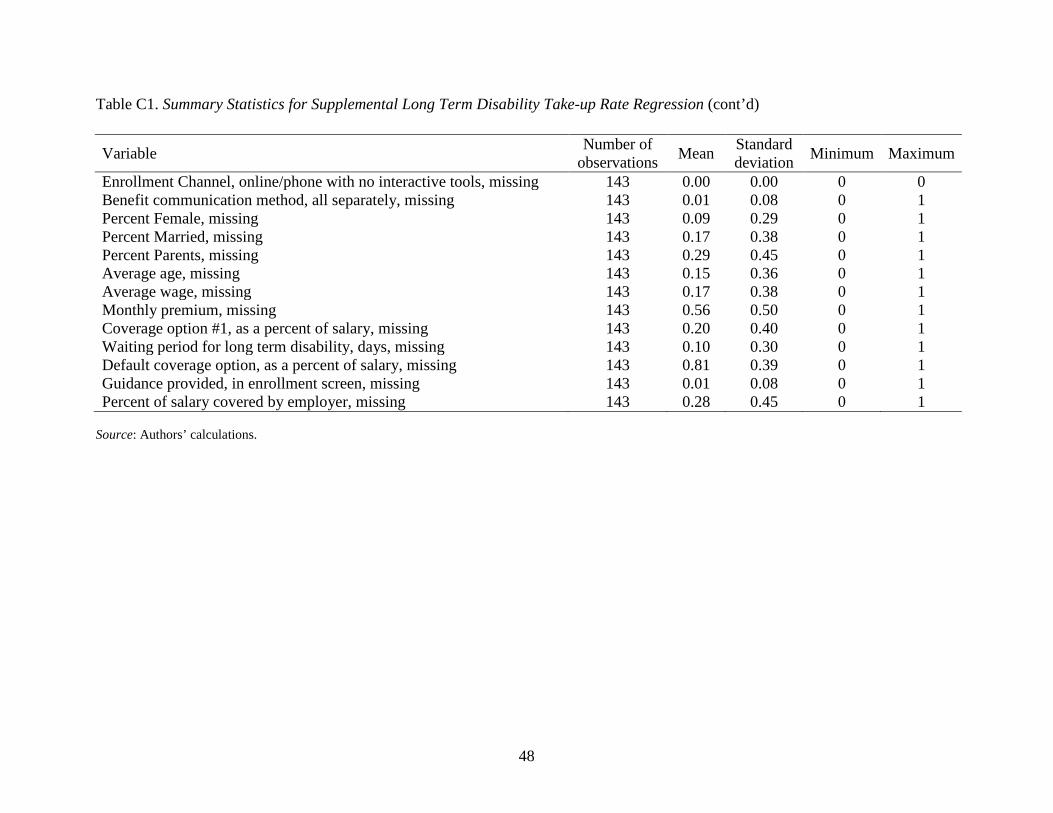
Table C1. Summary Statistics for Supplemental Long Term Disability Take-up Rate Regression (cont’d)
Variable Number of observations Mean Standard
deviation Minimum Maximum
Enrollment Channel, online/phone with no interactive tools, missing 143 0.00 0.00 0 0 Benefit communication method, all separately, missing 143 0.01 0.08 0 1 Percent Female, missing 143 0.09 0.29 0 1 Percent Married, missing 143 0.17 0.38 0 1 Percent Parents, missing 143 0.29 0.45 0 1 Average age, missing 143 0.15 0.36 0 1 Average wage, missing 143 0.17 0.38 0 1 Monthly premium, missing 143 0.56 0.50 0 1 Coverage option #1, as a percent of salary, missing 143 0.20 0.40 0 1 Waiting period for long term disability, days, missing 143 0.10 0.30 0 1 Default coverage option, as a percent of salary, missing 143 0.81 0.39 0 1 Guidance provided, in enrollment screen, missing 143 0.01 0.08 0 1 Percent of salary covered by employer, missing 143 0.28 0.45 0 1
Source: Authors’ calculations.
49
Table C2. Regression Results for Supplemental Long Term Disability Take-up Rate Variable Coefficient Enrollment, allowed at anytime -9.99 *
(5.84)
Enrollment, other than at anytime 1.38
(9.70)
Enrollment Channel, online/phone with interactive tools for just new employees -5.97
(9.55) Enrollment Channel, online/phone with interactive tools for new and existing
employees -1.77
(11.47)
Enrollment Channel, online/phone with no interactive tools for just new employees -13.47 *
(7.03)
Enrollment Channel, online/phone with no interactive tools for new and existing employees 6.71
(9.20) Benefit communication method, all separately -0.66
(10.38)
Benefit communication method, health and medical separate from retirement 4.67
(4.87)
Percent Female 0.09
(0.12)
Percent Married 0.10
(0.20)
Percent Parents -0.46 **
(0.14)
Average age -0.89 **
(0.45)
Average wage 0.31
(1.16)
Coverage option #1, as a percent of salary 0.04
(0.13)
Waiting period for long term disability, days 0.00
(0.01)
Default coverage option, as a percent of salary 0.18
(0.34)
Guidance provided, in enrollment screen 0.92
(6.18)
Guidance provided, outside of enrollment screen -2.86
(6.84)
Percent of salary covered by employer -0.09
(0.15)
-(cont’d)-
50
Table C2. Regression Results for Supplemental Long Term Disability Take-up Rate (cont’d) Variable Coefficient Benefits administered, missing Omitted
Enrollment, allowed at anytime, missing 4.95
(11.02) Enrollment Channel, online/phone with interactive tools for just new
employees, missing Omitted
Enrollment Channel, online/phone with no interactive tools, missing Omitted
Benefit communication method, all separately, missing 28.76
(28.85)
Percent Female, missing -9.94
(15.11)
Percent Married, missing -2.99
(14.57)
Percent Parents, missing -6.16
(8.93)
Average age, missing -30.14 *
(20.48)
Average wage, missing 0.07
(10.82)
Monthly premium, missing -10.72 *
(5.43)
Coverage option #1, as a percent of salary, missing -15.86 *
(9.28)
Waiting period for long term disability, days, missing -0.08
(8.93)
Default coverage option, as a percent of salary, missing 7.56
(20.01)
Guidance provided, in enrollment screen, missing 16.62
(30.64)
Percent of salary covered by employer, missing 3.56
(10.46)
Adjusted R2 0.05 Number of Observations 143
Note: Robust standard errors are in parentheses. The coefficients are significant at the 15-percent level (*), or the 5-percent level (**). Source: Authors’ calculations.
51
Table D1. Summary Statistics for Supplemental Short Term Disability Take-up Rate Regression
Variable Number of
observations Mean Standard deviation Minimum Maximum
Enrollment, allowed at anytime 84 0.17 0.37 0 1 Enrollment, other than at anytime 84 0.05 0.21 0 1 Enrollment Channel, online/phone with interactive tools for just new
employees 84 0.19 0.40 0 1 Enrollment Channel, online/phone with interactive tools for new and
existing employees 84 0.08 0.28 0 1 Enrollment Channel, online/phone with no interactive tools for just new
employees 84 0.31 0.47 0 1 Enrollment Channel, online/phone with no interactive tools for new and
existing employees 84 0.14 0.35 0 1 Benefit communication method, all separately 84 0.06 0.24 0 1 Benefit communication method, health and medical separate from
retirement 84 0.44 0.50 0 1 Percent female 84 50.48 26.49 0 100 Percent married 84 51.99 26.64 0 92 Percent parents 84 33.75 25.04 0 85 Average age 84 37.05 15.74 0 57 Average wage 84 4.53 3.12 0 15 Percent of salary covered by employer 84 31.94 36.65 0 100 Coverage option #1, as a percent of salary 84 31.61 32.28 0 100 Waiting period, days 84 24.19 48.28 0 365 Exhaustion period, days 84 10.62 27.97 0 180 Default coverage, as a percent of salary 84 5.33 17.00 0 67 Guidance provided, in enrollment screen 84 0.25 0.44 0 1 Guidance provided, outside of enrollment screen 84 0.23 0.42 0 1 Enrollment, allowed at anytime, missing 84 0.05 0.21 0 1 Coverage offered by Broker Carrier only, missing 84 0.00 0.00 0 0 -(cont’d)-
52
Table D1. Summary Statistics for Supplemental Short Term Disability Take-up Rate Regression (cont’d)
Variable Number of observations Mean Standard
deviation Minimum Maximum
Coverage offered from other than the Broker Carrier or Employer, missing 84 0.01 0.11 0 1
Enrollment Channel, online/phone with interactive tools for just new employees, missing 84 0.00 0.00 0 0
Enrollment Channel, online/phone with no interactive tools, missing 84 0.00 0.00 0 0 Benefit communication method, all separately, missing 84 0.01 0.11 0 1 Percent Female, missing 84 0.06 0.24 0 1 Percent Married, missing 84 0.15 0.36 0 1 Percent Parents, missing 84 0.20 0.40 0 1 Average age, missing 84 0.13 0.34 0 1 Monthly premium, missing 84 0.63 0.49 0 1 Coverage option #1, as a percent of salary, missing 84 0.44 0.50 0 1 Exhaustion period, days, missing 84 0.27 0.45 0 1 Default coverage, as a percent of salary, missing 84 0.12 0.33 0 1 Guidance provided, in enrollment screen, missing 84 0.01 0.11 0 1 Percent of salary covered by employer, missing 84 0.52 0.50 0 1
Source: Authors’ calculations.
53
Table D2. Regression Results for Supplemental Short Term Disability Take-up Rate Variable Coefficient Enrollment, allowed at anytime -18.74 *
(10.43)
Enrollment, other than at anytime -1.58
(17.45)
Enrollment Channel, online/phone with interactive tools for just new employees -10.61
(15.48)
Enrollment Channel, online/phone with interactive tools for new and existing employees 17.64
(18.81) Enrollment Channel, online/phone with no interactive tools for just new
employees -6.15
(10.08)
Enrollment Channel, online/phone with no interactive tools for new and existing employees -3.30
(14.27) Benefit communication method, all separately 5.39
(22.13)
Benefit communication method, health and medical separate from retirement 13.24 *
(7.75)
Percent Female 0.24 *
(0.16)
Percent Married -0.08
(0.26)
Percent Parents 0.29
(0.21)
Average age -0.39
(0.71)
Average wage -0.58
(1.40)
Percent of salary covered by employer -0.06
(0.25)
Coverage option #1, as a percent of salary 0.29
(0.27)
Waiting period, days -0.04
(0.08)
Exhaustion period, days -0.17
(0.15)
Default coverage, as a percent of salary 0.34
(0.28)
Guidance provided, in enrollment screen 4.30
(10.76)
-(cont’d)-
54
Table D2. Regression Results for Supplemental Short Term Disability Take-up Rate (cont’d) Variable Coefficient Guidance provided, outside of enrollment screen -1.60
(9.37) Enrollment, allowed at anytime, missing 2.96
(17.06)
Coverage offered by Broker Carrier only, missing Omitted
Coverage offered from other than the Broker Carrier or Employer, missing -1.70
(43.33)
Enrollment Channel, online/phone with interactive tools for just new employees, missing Omitted
Enrollment Channel, online/phone with no interactive tools, missing Omitted
Benefit communication method, all separately, missing 42.55
(31.56) Percent Female, missing -1.16
(22.33)
Percent Married, missing -10.81
(23.96)
Percent Parents, missing 20.95
(18.59)
Average age, missing -26.10
(31.96)
Monthly premium, missing 8.32
(8.50)
Coverage option #1, as a percent of salary, missing -11.88
(18.97)
Exhaustion period, days, missing -4.22
(11.75)
Default coverage, as a percent of salary, missing 18.88
(14.16)
Guidance provided, in enrollment screen, missing -9.83
(33.98)
Percent of salary covered by employer, missing -15.86
(19.85)
Adjusted R2 0.04 Number of Observations 84
Note: Robust standard errors are in parentheses. The coefficients are significant at the 15-percent level (*), or the 5-percent level (**). Source: Authors’ calculations.
55
RECENT WORKING PAPERS FROM THE CENTER FOR RETIREMENT RESEARCH AT BOSTON COLLEGE
Overcoming Barriers to Life Insurance Coverage: A Behavioral Approach Anek Belbase, Norma B. Coe, and April Yanyuan Wu, June 2015 How Do People Decide on Life Insurance and Long-Term Disability Insurance Coverage? Norma B. Coe and Anek Belbase, June 2015 What Do Subjective Assessments of Financial Well-Being Reflect? Steven A. Sass, Anek Belbase, Thomas Cooperrider, and Jorge D. Ramos-Mercado, March 2015 The Impact of Leakages from 401(k)s and IRAs Alicia H. Munnell and Anthony Webb, February 2015 Recruiting and Retaining High-Quality State and Local Workers: Do Pensions Matter? Alicia H. Munnell, Jean-Pierre Aubry, and Geoffrey T. Sanzenbacher, January 2015 Do Tax Incentives Increase 401(k) Retirement Saving? Evidence from the Adoption of Catch-Up Contributions Matthew S. Rutledge, April Yanyuan Wu, and Francis M. Vitagliano, November 2014 Are Retirees Falling Short? Reconciling the Conflicting Evidence Alicia H. Munnell, Matthew S. Rutledge, and Anthony Webb, November 2014 Lifetime Job Demands, Work Capacity at Older Ages, and Social Security Benefit Claiming Decisions Lauren Hersch Nicholas, November 2014 Who Is Internationally Diversified? Evidence from 296 401(k) Plans Geert Bekaert, Kenton Hoyem, Wei-Yin Hu, and Enrichetta Ravina, November 2014
The Causes and Consequences of Financial Fraud Among Older Americans Keith Jacks Gamble, Patricia Boyle, Lei Yu, and David Bennett, November 2014
New Evidence on the Risk of Requiring Long-Term Care Leora Friedberg, Wenliang Hou, Wei Sun, Anthony Webb, and Zhenyu Li, November 2014
SSI at 62: Protecting the Vulnerable When Increasing Social Security’s Early Entitlement Age Norma B. Coe and April Yanyuan Wu, June 2014
All working papers are available on the Center for Retirement Research website (http://crr.bc.edu) and can be requested by e-mail ([email protected]) or phone (617-552-1762).