25
IMPROVING ENERGY PRODUCTIVITY THROUGH PV Muriel Watt Chair APVI IT Power (Australia) & UNSW Energy Productivity Forum 3-4 April, 2014
IMPROVING ENERGY PRODUCTIVITY THROUGH PV
Muriel WattChair APVI
IT Power (Australia) & UNSW
Energy Productivity Forum 3-4 April, 2014

THE APVI – WHO WE ARE
Businesses, researchers, government agencies, individuals with an interest in PV research, technology, manufacturing, systems, policies, programs and projects.
Our work is independent, apolitical and widely used by the PV sector, governments and stakeholders
Our objective is:
To support the increased development and use of PV via research, analysis and information.

OUTLINE
Global PV Markets
The Australian PV market
Implications for the Electricity Market
Productivity Opportunities via Distributed PV

GLOBAL PV MARKETS
IPENZ 2009 Pickering Lecture Series
Michelin Factory, Germany

MARKET DEVELOPMENT
� 8 GW installed in 2009
� 37 GW in 2013
� 100GW projected for 2018 and valued at US$50 Billion pa (Solar Buzz, March 2014)
� Installed capacity expected to be ~500 GW by 2018
� C-Si module production costs ~US$0.50/Wp� PPAs now as low as US$0.05/kWh for 5-50MW systems
� In Australia residential grid parity reached from 2011

PAST AND PROJECTED ANNUAL PV INSTALLATIONS WORLDWIDE
0
20
40
60
80
100
120
2009 2010 2011 2012 2013 2014 2015 2016 2017 2018
Current production capacity

PV PENETRATION LEVELS> 40% of demand on summer weekends in Germany
(Burger, 2011, Gifford, 2012)

THE AUSTRALIAN PV MARKET
IPENZ 2009 Pickering Lecture Series
1.22 MWp PV system, Queensland University

PV UPTAKE OVER THE PAST DECADE (APVA 2004-2013)
0
500
1000
1500
2000
2500
3000
3500
2004 2005 2006 2007 2008 2009 2010 2011 2012 2013 Est
Cu
mu
lati
ve M
W
off-grid domestic off-grid non-domestic
grid-connected distributed grid-connected power stations

AUSTRALIAN SYSTEM PRICE TRENDS (APVA 2008-2013)
0
2
4
6
8
10
12
14
2008 2009 2010 2011 2012 2013
Aud
/Wp
Typical module price Typical small grid system price BOS price
Balance of System costs now greater than module costs

0
1000
2000
3000
4000
5000
6000
7000
8000
9000
10000
2005 2006 2007 2008 2009 2010 2011 2012 2013Est
2014 2015 2016 2017 2018 2019 2020
Cum
mul
ativ
e M
W
POSSIBLE CUMULATIVE INSTALLATIONS OF ~8-9GW BY 2020
@15% growth = 36 GW by 2030@ steady growth of 650MW/an = 14 GW by 2030AEMO: 12-18GW from residential rooftops by 2031
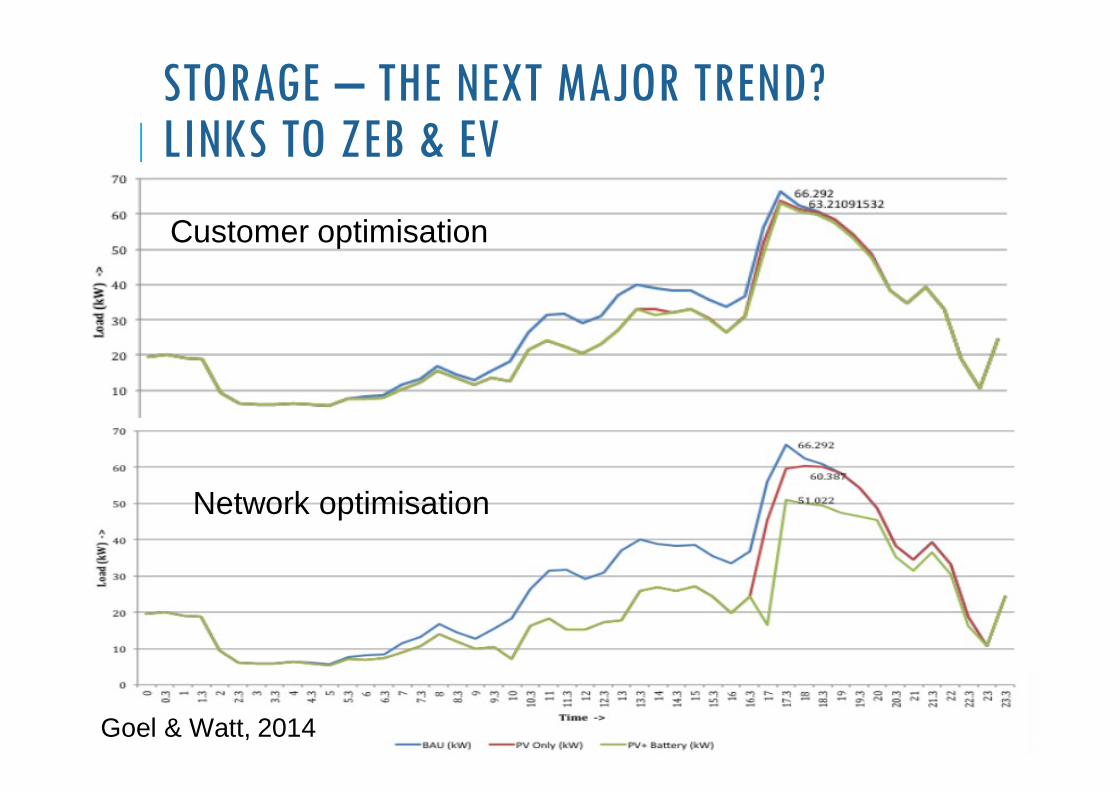
STORAGE – THE NEXT MAJOR TREND?LINKS TO ZEB & EV
Customer optimisation
Network optimisation
Goel & Watt, 2014
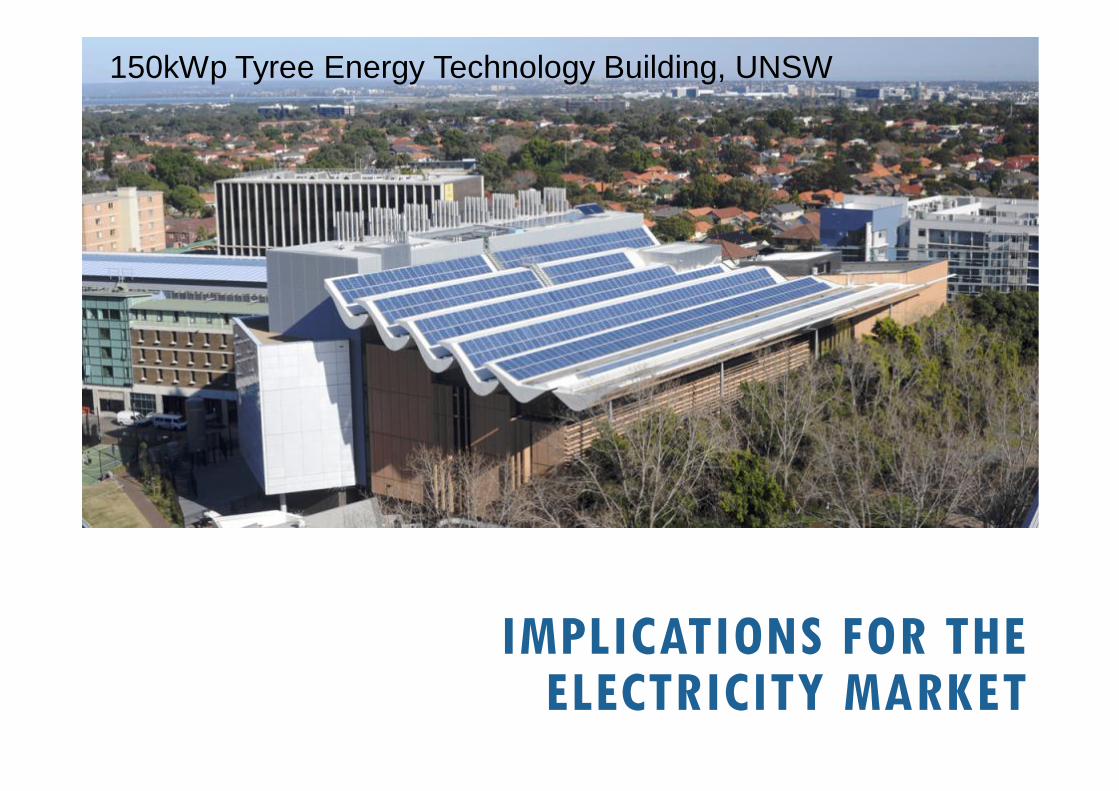
IMPLICATIONS FOR THEELECTRICITY MARKET
150kWp Tyree Energy Technology Building, UNSW

AUSTRALIAN ELECTRICITY AND GAS PRICES• Electricity increased 40% between 2008/09 and
2011/12
• Main driver - networks – half capital replacement, half augmentation to meet increasing peak
• 2009 – 2011 - EU-27 residential (12.2%), US (2.7%)
14Source: DRET, 2012

ELECTRICITY PRICE PROJECTIONS (AEMC, 2013)

ELECTRICITY PRICE COMPONENTS (CPD, 2013)
12% without C price*
*RE displacing high cost gas -wholesale price may not fall as much without RET & C price

AUSTRALIAN ELECTRICITY USE AND PROJECTIONS (AEMO, 2013)
• Decreased on average 1.1% per year every year since 2008/09
17

CONTRIBUTIONS TO THE DECLINE (IES, 2013)
• Range of factors, some ongoing, some not
• If more EE and DG, then will likely decline further
18

PV PENETRATION LEVELS (NOONE, 2014)

CAN THE “DEATH SPIRAL” LEAD TO HIGHER ENERGY PRODUCTIVITY?
(Kind, 2013)

PRODUCTIVITY IMPACTSUse of local renewables� Releases gas especially for more strategic uses
Lower and less volatile wholesale electricity prices
Self reliant houses / buildings� Fewer cross subsidies� More resilient to weather extremes
Reduced infrastructure costs� Money available for other investments
Improved energy services� More efficient provision of heat, coolth, light, power� More comfortable / healthier buildings� Lower expenditure on energy
Higher private investment in energy services� Reduced government expenditure� Reduced cross subsidies
However – current market structures are limiting these benefits

CURRENT RESPONSESLow / zero PV buy-back rates� No export from storage or commercial PV� Charges to export proposed (no other generator pays for networks)
Gross metering only proposed
Higher fixed charges / PV customer charge� Conflicts with COAG restrictions on discrimination between customer types
Restrictions on new connections
Restrictions on operation� New rules allowing DNSP control
Political and regulatory structure favour the incumbents� Mobilising anti-renewables lobby groups� Dividing ‘haves’ and ‘have nots’
Likely to result in perverse outcomes as the future can’t be stopped!

SUGGESTED RESPONSES (PASSEY, WATT & MORRIS, 2013)
New regulatory frameworks� Distributed energy (DE) competes fairly in generation, distribution and retail
Move to integrated resource planning for networks� Transparency
� 3rd party access and competition
� DE considered on equal footing
� For network upgrade as well as refurbishment
� Even for smaller levels of expenditure
Revenue Caps� To reduce opposition by networks (and State governments) to DE
Allow Networks to provide DE options� Ring fencing to overcome market power issues
New tariff structures with a demand component

MINI & MICRO-GRID OPTIONS?
Especially in low density / high grid cost areas�Cheaper than maintaining past grids�More efficient use of infrastructure�More flexibility in energy service provision�More market competition�Higher reliability, especially during extreme weather� Reduced bush fire risk
Noone et al, 2014

REFERENCESAEMC, 2013, Electricity price trends, possible future retail electricity price movements: 1 July 2012 to 30 June 2015, 22 March 2013, EPR0029.
AEMO, 2013, National Electricity Forecasting Report for the National Electricity Market 2013.
APVA, 2004-2013, National Survey Report of PV Power Applications in Australia - 2011, Prepared for the Australian PV Association, June 2013.
Burger, B., 2011, Fraunhofer ISE, EEX Transparency Platform, www.transparency.eex.com
CPD, 2013, Going Solar – renewing Australia’s electricity options, Eadie, L. and Elliot, C., April 2013
Department of Resources, Energy and Tourism, 2012, Fact Sheet: Electricity Prices, Australian Government, European
Gifford, J, 2012, Germany: Record 40% solar weekend, PV Magazine, 29 May
Goel, S. and Watt, M., 2014, Grid connected rooftop PV systems with battery storage – an economic feasibility study. In press.
Intelligent Energy Systems, , 2013, ‘Update: What is driving the decline in electricity demand?’, Insider Issue 14, April, 2013
Kind, 2013, Disruptive Challenges, Report for the Edison Electric Institute
Noone, B., 2013, PV Integration on Australian distribution networks: Literature review, Australian PV Association
Noone, B., MacGill, I., Bruce, A. and Watt, M., 2014, PV Integration on Australian distribution networks: Final Report, Australian PV Institute.
Passey, R., Watt, M. and Morris, N., 2013, ‘The Distributed Energy Market: Consumer & Utility Interest, and the Regulatory Requirements’, Australian PV Association


