Improving Health Care by Improving Your Microsystem
Version 2.1
The Clinical Microsystem Action Guide is a collection of helpful tools, information, and ideas designed to assist clinical microsystems to increase self-awareness and engage in continuous improvement in health care delivery within their clinical microsystem and in partnership with other clinical microsystems and macro-organizations.
Preface and acknowledgements Welcome - Clinical Microsystem Background 5 • Institute of Medicine 6 • Self-Awareness Journey 7 • The Lenses of a Microsystem 8 • Science-Based Improvement 9 I. Assessing Your Practice Workbook “The Green Book” 10 II. Assess Your Clinical Microsystem 16 III. Start to Build Your Own Clinical Microsystem Diagram 20 IV. The Core Processes of Clinical Microsystems 24
A. Patient Entry/Access/Assignment B. Orientation C. Initial Work up/Assessment D. Plan of Care E. C.A.R.E. Vital Signs
V. Patient Subpopulations: Planning Patient-centered Care 40 A. Acute/Emergent B. Chronic C. Preventive D. Palliative
VI. Customer Knowledge 59 A. Gaining Customer Knowledge Worksheet, Interview Survey
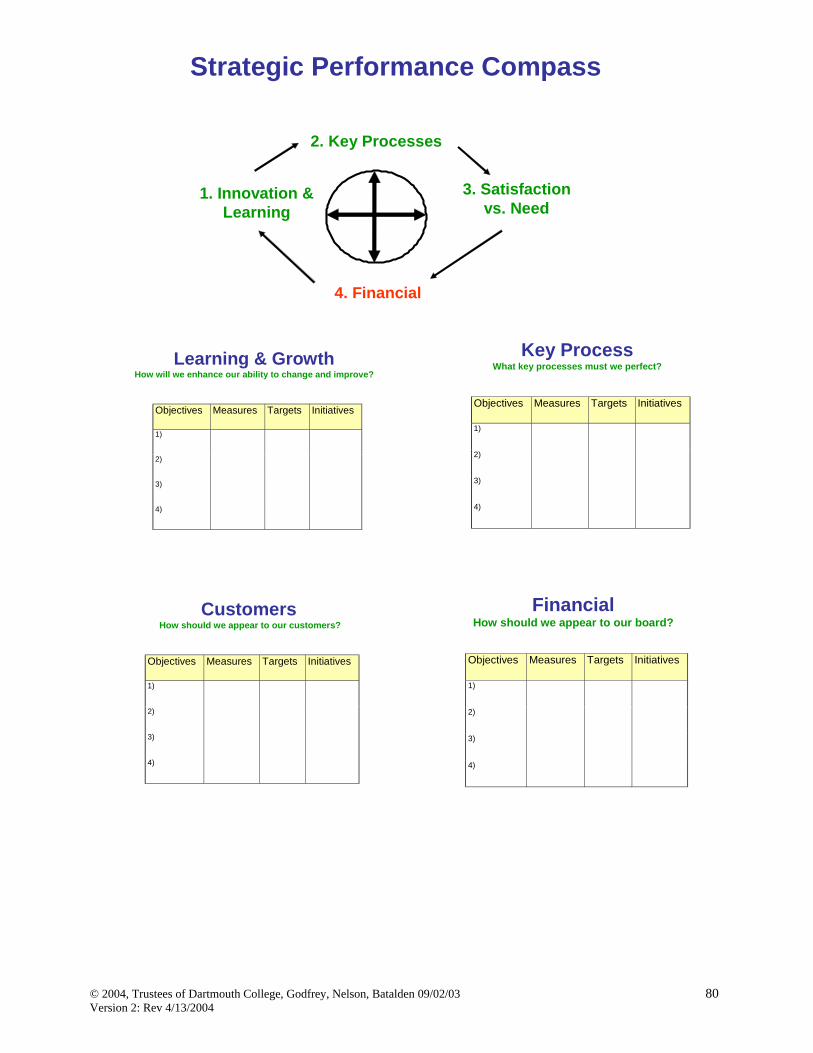
VII. Measurement and Monitoring 70 A. Feed forward and Feedback B. Balanced Scorecard/Instrument Panels C. Clinical Value Compass
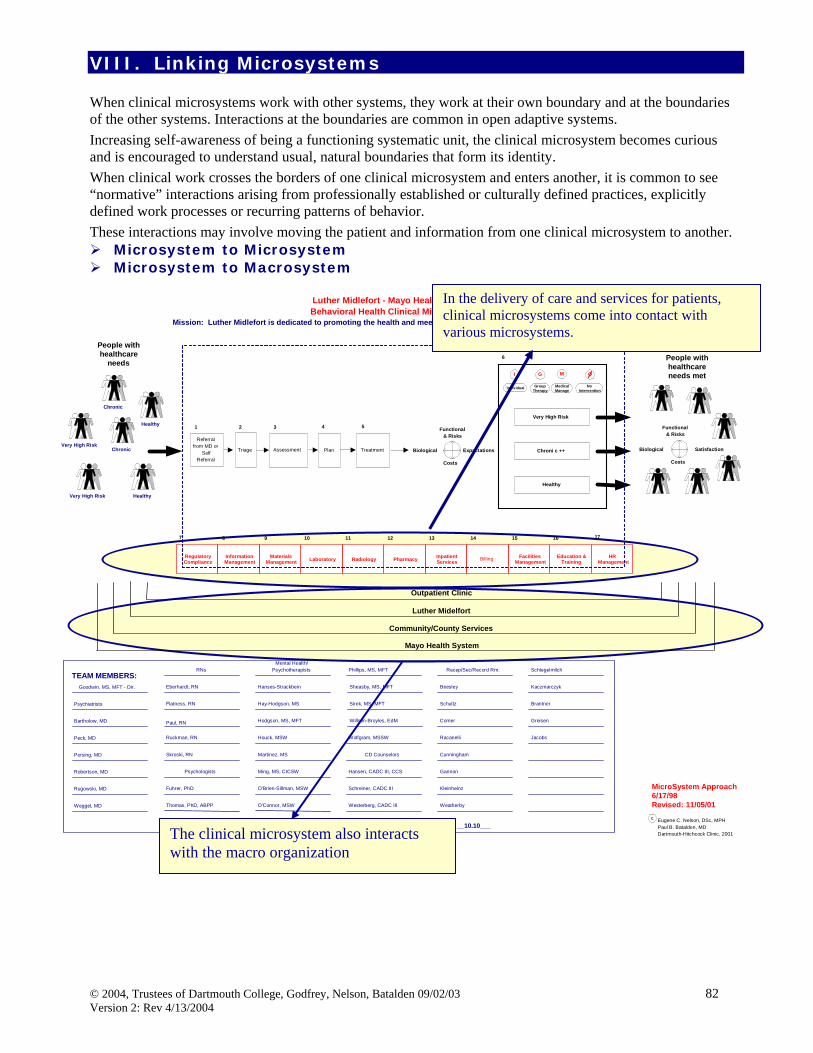
VIII. Linking Microsystems 82 IX. Special Themes: A. Safety 89
B. External Environment 101 C. Health Professional Education 102
X. Improving Your Clinical Microsystem 103 A. The basics B. Continuous improvement tools/forms/knowledge C. Storyboards
XI. Want to Learn More? 150 XII. References and articles 153 XIII. Appendix 155 Table of Tools and Forms
Our years of experience in exploring, inquiring, and testing improvement ideas through the Center for the Evaluative Clinical Sciences at Dartmouth Medical School, the Dartmouth-Hitchcock system, Institute for Healthcare Improvement, and health care systems throughout the United States, England, Sweden, and Norway have provided the background of this Clinical Microsystem Action Guide. The people in the clinical microsystem who usually work together with technology support have been generous in their interest and energies to learn with us the tools and helpful information that will increase self-awareness to lead to action plans to improve their clinical microsystem. New knowledge and insights have been added based on this focused research.
We are appreciative of the clinical microsystems throughout the US and around the world including England, France, Kosovo, Norway, and Sweden that have tested and given us feedback on the materials presented in Version 1.0 of the Clinical Microsystem Action Guide. Based on our field testing and continued development of microsystem knowledge, we offer Version 2.1. This work will continue to evolve over time as the knowledge of clinical microsystems grows, and as more and more health care systems engage in the discovery of clinical microsystems, success characteristics, and test tools and actions that can be taken to improve the health care delivery system, the workforce environment, and patient care outcomes.
We are grateful for the support provided by the Robert Wood Johnson Foundation for RWJF Grant Number: 036103 that have furthered our experience and knowledge. We would also wish to express our gratitude and appreciation for the support of the high performing clinical microsystem sites in this study that hosted our visits and shared their stories: Bon Secours Wound Care Team Center for Orthopedic Oncology and Musculoskeletal Research (Washington Cancer Institute) Dartmouth-Hitchcock Spine Center Gentiva Rehab Without Walls Grace Hill Community Health Center Henry Ford Neonatal Intensive Care Unit Hospice of North Iowa Interim Pediatrics Intermountain Orthopedic Specialty Practice Intermountain Shock/Trauma/Respiratory Intensive Care Unit Iowa Veterans’ Home, M4C Team
Luther Midelfort Behavioral Health Massachusetts General Hospital Downtown Associates Primary Care Norumbega Evergreen Woods Office On Lok Senior Health Rose Team Overlook Emergency Department Sharp Diabetes Self Management Training Center Shouldice Hospital ThedaCare Kimberly Office Family Medicine Visiting Nursing Service Congregate Care Queens Team 11S Whittier Institute for Diabetes
Special Thanks We would like to express our sincere appreciation to:
James Brian Quinn, PhD, MBA William and Josephine Buchanan Professor of Management, Emeritus, Tuck School of Business at Dartmouth College for his advice, counsel and continued encouragement of our work.
Donald W. Berwick, MD, MPP President and CEO, Institute for Healthcare Improvement for his vision, tireless leadership, and collaboration to improve health care around the world.
Thomas Nolan, PhD Statistician, Associates in Process Improvement and Co-Director of Pursuing Perfection and Senior Fellow at the Institute for Healthcare Improvement for his leadership and energy in the pursuit of excellence in health care.
We also would like to acknowledge and express gratitude to our colleagues and friends at:
Institute for Healthcare Improvement, 375 Longwood Avenue, 4th Floor, Boston, MA 02215
Hundreds of national and international sites and organizations we have collaborated and learned with over the years as we’ve furthered our knowledge of microsystems in health care improvement. It is their willingness to test and adapt ideas and tools and share their experiences that has advanced our knowledge.
Special Acknowledgement: We would like to express our sincere thanks and appreciation for the tireless efforts, and past and current work experiences of the numerous leaders and clinical teams of the Dartmouth-Hitchcock System, hundreds of graduate/PhD students at the Center for the Evaluative Clinical Sciences at Dartmouth, Evaluative Clinical Sciences 124 course participants at Dartmouth Medical School and the practices they worked with, University of California, Davis Health System, Geisinger Health System, Goran Henriks, Jonkoping County Council, Sweden, and Sir John Oldham, GP, Head of the National Primary Care Development Team, United Kingdom.
Clinical Microsystem Action Guide Team Editor: Marjorie M. Godfrey, MS, RN, Director of Clinical Practice Improvement for Dartmouth-
Hitchcock Medical Center, Instructor for Community and Family Medicine at Dartmouth Medical School and Technical Advisor to Idealized Design of Clinical Office Practices at the Institute for Healthcare Improvement.
Team: Marjorie M. Godfrey, MS, RN
Eugene C. Nelson, DSc, MPH, Professor of Community and Family Medicine at Dartmouth Medical School, Director of Quality Education Measurement and Research at Dartmouth-Hitchcock Medical Center, and Senior Advisor for the Idealized Design of Clinical Office Practices and Pursuing Perfection Program and past Board member at the Institute for Healthcare Improvement.
Paul B. Batalden, MD, Director of Health Care Improvement Leadership, Center for Evaluative Clinical Sciences, and Professor of Pediatrics and of Community and Family Medicine at the Dartmouth Medical School and Senior Vice President for Health Professional Development, founding Chair and current member of the Board of Directors at the Institute for Healthcare Improvement.
John H. Wasson, MD, Hermon O. West Professor of Geriatrics at Dartmouth Medical School and Medical Director of Idealized Design of Clinical Office Practices at the Institute for Healthcare Improvement.
Julie J. Mohr, MSPH, PhD, Assistant Professor in the Department of Medicine at the University of Chicago
Thomas Huber, MS, Project Manager for The Robert Wood Johnson Foundation Grant for Health Care Improvement Leadership Development at Dartmouth Medical School 2000-2002
Linda Headrick, MD, MS, Senior Associate Dean for Education & Faculty Development for the School of Medicine, University of Missouri-Columbia
Graphic Coua L. Early, Administrative Coordinator, Dartmouth-Hitchcock Medical Design/ Center, 1998-2003 Layout Melissa D. DeHaai, Administrative Coordinator, Dartmouth-Hitchcock Medical Center, 2003-Current
J. Brian Quinn, Professor Emeritus at the Amos Tuck School of Business Administration at Dartmouth College, spent several years studying successful service enterprises. He observed that successful enterprises progressively learned to focus on the smallest replicable unit (SRU). Quinn’s theory suggests that all organizations are comprised of small units that function to connect the core “competence” of the enterprise to the beneficiaries of that enterprise. We have adapted this idea for use in health care. His book Intelligent Enterprise describes his findings of
highly successful service organizations. He reports that the leading service organizations organized around and continually engineered the frontline interface relationship that connected the organizations core competency with the needs of the individual customers. This frontline interface is referred to as the “smallest replicable unit.”1
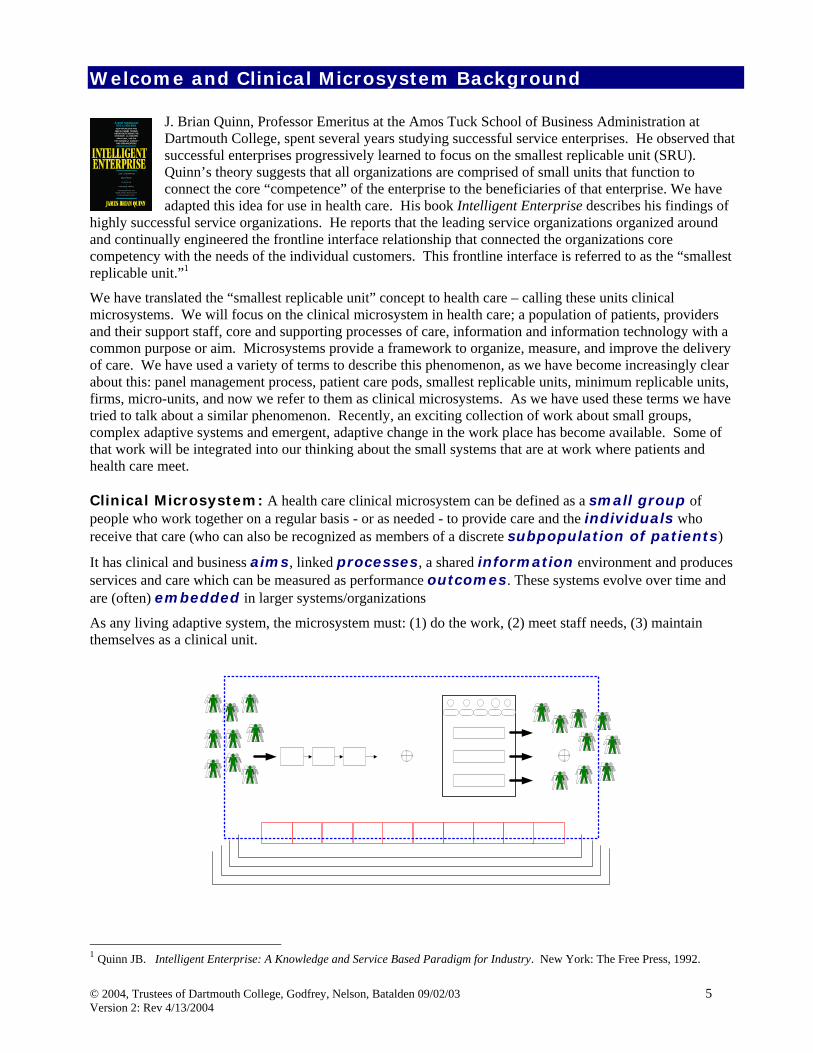
We have translated the “smallest replicable unit” concept to health care – calling these units clinical microsystems. We will focus on the clinical microsystem in health care; a population of patients, providers and their support staff, core and supporting processes of care, information and information technology with a common purpose or aim. Microsystems provide a framework to organize, measure, and improve the delivery of care. We have used a variety of terms to describe this phenomenon, as we have become increasingly clear about this: panel management process, patient care pods, smallest replicable units, minimum replicable units, firms, micro-units, and now we refer to them as clinical microsystems. As we have used these terms we have tried to talk about a similar phenomenon. Recently, an exciting collection of work about small groups, complex adaptive systems and emergent, adaptive change in the work place has become available. Some of that work will be integrated into our thinking about the small systems that are at work where patients and health care meet. Clinical Microsystem: A health care clinical microsystem can be defined as a small group of people who work together on a regular basis - or as needed - to provide care and the individuals who receive that care (who can also be recognized as members of a discrete subpopulation of patients)
It has clinical and business aims, linked processes, a shared information environment and produces services and care which can be measured as performance outcomes. These systems evolve over time and are (often) embedded in larger systems/organizations
As any living adaptive system, the microsystem must: (1) do the work, (2) meet staff needs, (3) maintain themselves as a clinical unit.
1 Quinn JB. Intelligent Enterprise: A Knowledge and Service Based Paradigm for Industry. New York: The Free Press, 1992.
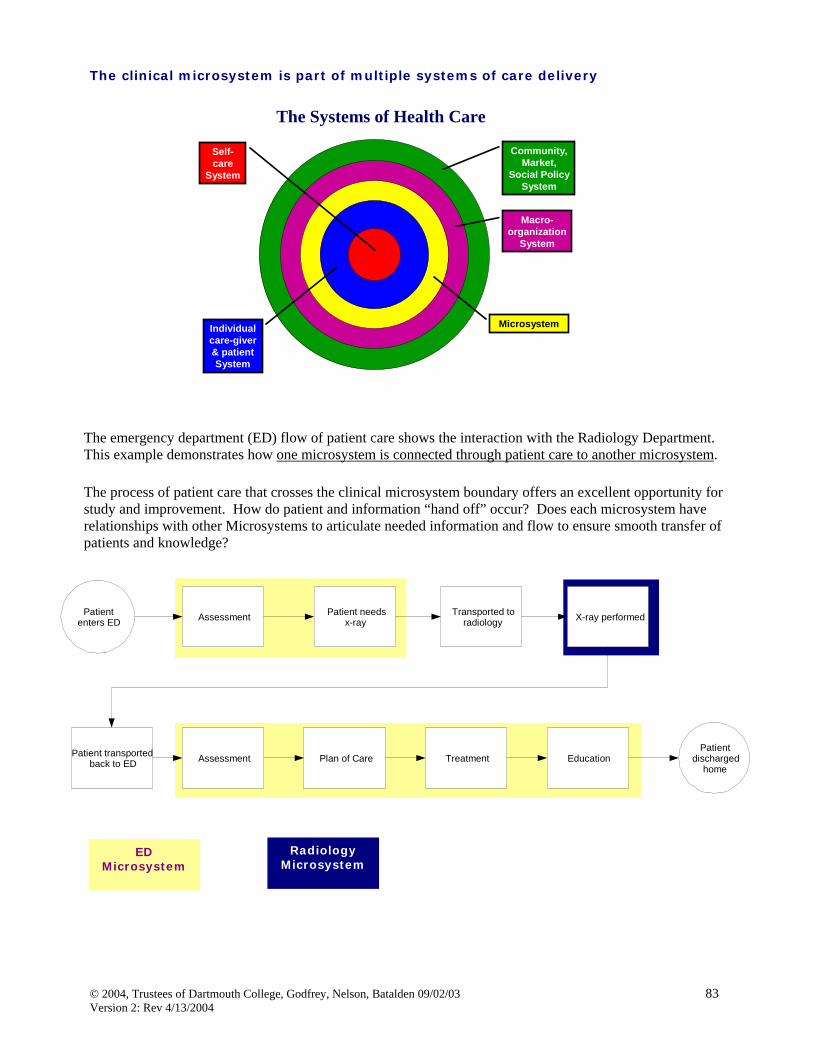
The Systems of Health CareLet’s put the systems of health care in perspective. In the center is the patient. The next layering includes the individual care giver and the patient. Our focus is the microsystem that includes the front line staff who interface with the patients. Microsystems are part of larger organizations we call macro-organizations. Finally, the community, market, and social policy system impact healthcare and provide systems of care.
Institute Of Medicine (IOM)
The Institute of Medicine (IOM) has published many reports to address the need to improve health care in the United States. In the third publication, “Priority Areas For National Action: Transforming Health Care Quality”2, priorities for improvement are stated and outlined. Consider the systems of health care above when reviewing the IOM recommendations. We find levels of the health care systems need to improve their systems, processes, and outcomes of care to meet the needs of these subpopulations. We illustrate this thinking in this diagram showing subpopulation needs, cross all levels of health care systems. Therefore requiring evaluation and improvements at all levels. The IOM new rules for health care are the 21st century provide guidelines for the improvement of health care.
Institute of Medicine New Rules 1. Care based on continuous healing relationships 1. Care customized based on patient need and values 2. Patient is source of control. 3. Knowledge is shared and information flows freely 4. Decision-making is evidence based 5. Safety is a system property 6. Transparency is necessary 7. Needs are anticipated 8. Waste is continuously decreased. 9. Cooperation among clinicians is a priority.
2 Institute of Medicine. Priority Areas For National Action: Transforming Health Care Quality. Quality Chasm Series. Adams K, Corrigan JM editors. Washington, DC: National Academy Press, 2003.
Through observing clinical microsystems over time and their journey of self-awareness, we have formulated this model that describes the sequence of issues and steps as they develop a sense of awareness.
A microsystem begins to have a sense of awareness of functioning within the clinical microsystem when someone asks the question “Could you draw me a picture of how your microsystem works from the perspective of the patient or your staff?” A new awareness of how people work together (or not) starts to unfold. People begin to recognize the “foolishness” of their processes and action is taken to eliminate or reduce the foolishness.
The microsystem then realizes with this new sense of awareness that change is possible within the clinical microsystem and does not require permission from anyone else. It is possible to change one’s own environment.
The questions arise of “Why are we doing what we do?” and “why are we in business?” Frequently the answer is to serve patients but with further inquiry with all staff, the inquiry and answers become “messy.” Further attempts to identify WHO benefits and what the beneficiaries define as a benefit causes the clinical microsystem to define its own purpose. Making the purpose explicit is an important step in recognizing the microsystem system. The purpose grounds or gives basis for the work of the clinical microsystem.
When there is a strategic invitation to change, such as improving access or decreasing delays, people can begin to process this invitation based on the prior awareness efforts.
Caution: In those cases where prior work has not been done to understand work as a system the invitation is viewed as a “recipe.” Steps are followed according to the recipe and when the recipe is over, people have trouble maintaining the changes. The problem of holding change is a common issue for microsystems who do not have a sense of themselves as a functioning clinical microsystem.
Those clinical microsystems who have made the early investment in understanding themselves as a system, find strategic invitations to change filled with more questions to answer and increase their curiosity to understand the buried measures of improvement.
A microsystem's self-awareness journey
Create an awareness
of work as a microsystem
(description or picture)
Work onsome
foolishnessto understandthat change is
possible.
Connect work to those who do or could benefit from it, building a sense of the related purpose of the work.
Try somestrategicchange &
improvement.
Build measuresof performance
for those who do or could
benefit, of the functioning of the microsystem & for
The process of change feeds the daily work of improvement and leads to deeper work and insight into the clinical microsystem, work with other; peer microsystems, populations of people, inputs and outputs, and unlike microsystems. The self aware microsystem works more consciously on their relationship with the macro-organization.
A self-aware clinical microsystem can lead to activities, knowledge and learning never capable of before this journey.
The reality of the journey of a clinical microsystem is not necessarily an orderly sequence as this model may depict. For example, a microsystem may begin the journey with an invitation to change such as implementing open access. During the organizing of the microsystem to implement open access, the members realize a new sense of awareness of “foolishness” in their microsystem and may continue on a journey of deeper awareness and additional improvement activities.
Another example, am microsystem may be found with measure of performance which can be confusing to the members of the microsystem. It may happen at this point the question is raised “how does our microsystem work to get these results?” Again with deeper knowledge, the journey may begin to increase self awareness of process and outcomes.
Some Microsystems may decide to focus on a specific population within the patients they care for, and again awareness is heightened when attempts are made to answer questions on “how many patients are in the population?” or “what unique needs does this population have?”
The journey can begin anywhere within this model.
The lenses of a Microsystem
One might consider evaluating and increasing microsystem awareness by applying different “lenses” or perspectives to the clinical microsystem. This diagram is an example of using different lenses to allow us to see, ask more questions and begin to understand different elements in a microsystem.
To lead to changing daily patient care using the best evidence and science we offer this equation:
“Generalizable Scientific evidence” + “Particular
Context”
“Measured Performance
Improvement”
• control for context• generalize across contexts• sample design
I
• understand system “particularities”• learn structures, processes, patterns
II
• balanced outcome measures
III
• certainty of cause & effect• shared importance• loose-tight coupling• simple-complicated-complex
IV• strategy• operations• people V
In this equation resulting in measured performance improvement, there are several different knowledge systems at work. 1. Generalizable Scientific Evidence
We gain this knowledge usually in basic health education. This scientific evidence is achieved in an environment that controls for the context and sampling such as a randomized controlled trial. This knowledge is generalized across context.
This knowledge needs to be connected to the context….
2. Particular Context
In order to apply the generalizable scientific evidence, we need to dig deeply into the context particulars. We need to understand the system structure, processes, pattern, and habits.
3. Measured Performance Improvement
To assess if the efforts are successful in improvement, balanced outcome measures are needed. Sometimes measures are readily available and other times new measures are needed to assess microsystem process and improvements over time. The measurement here is different than comparing two points in time as in randomized controlled trials pre and post measures. Improvement measures occur over time.
4. To connect generalizable scientific evidence to the context
The plan and connection needs to be well thought out and informed. There needs to be discussion about the understanding and agreement of the cause and effect of the scientific evidence. A shared importance and value of the prospective change needs to be evaluated. A simple or complicated situation might mean protocols are needed to be implemented.
Loose or tight coupling of the particular context should be identified. Loose coupling means the parts of the system are ad-hoc or at convenience. Tight coupling suggests very predictable connections.
5. The arrow symbolizes execution
The strategy, operations and people needed to execute the plan leading to measured performance improvement needs clarity and definition. Good ideas that lead to action need proposals and strategies.
The content of the Clinical Microsystem Action Guide can assist in discovering and learning about
the particular content (#2) for Microsystems and macro-organizations.
I. Assessing Your Practice Workbook “The Green Book”
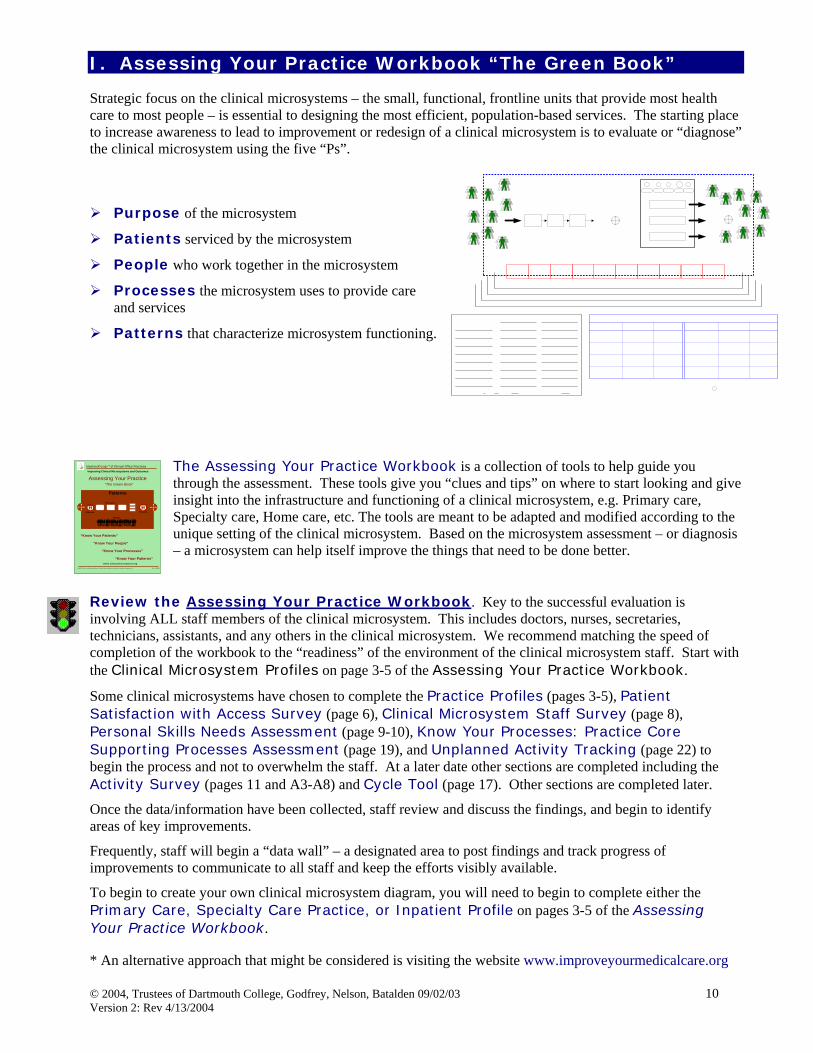
Strategic focus on the clinical microsystems – the small, functional, frontline units that provide most health care to most people – is essential to designing the most efficient, population-based services. The starting place to increase awareness to lead to improvement or redesign of a clinical microsystem is to evaluate or “diagnose” the clinical microsystem using the five “Ps”.
Purpose of the microsystem
Patients serviced by the microsystem
People who work together in the microsystem
Processes the microsystem uses to provide care and services
Patterns that characterize microsystem functioning.
The Assessing Your Practice Workbook is a collection of tools to help guide you through the assessment. These tools give you “clues and tips” on where to start looking and give insight into the infrastructure and functioning of a clinical microsystem, e.g. Primary care, Specialty care, Home care, etc. The tools are meant to be adapted and modified according to the unique setting of the clinical microsystem. Based on the microsystem assessment – or diagnosis – a microsystem can help itself improve the things that need to be done better.
Review the Assessing Your Practice Workbook. Key to the successful evaluation is involving ALL staff members of the clinical microsystem. This includes doctors, nurses, secretaries, technicians, assistants, and any others in the clinical microsystem. We recommend matching the speed of completion of the workbook to the “readiness” of the environment of the clinical microsystem staff. Start with the Clinical Microsystem Profiles on page 3-5 of the Assessing Your Practice Workbook.
Some clinical microsystems have chosen to complete the Practice Profiles (pages 3-5), Patient Satisfaction with Access Survey (page 6), Clinical Microsystem Staff Survey (page 8), Personal Skills Needs Assessment (page 9-10), Know Your Processes: Practice Core Supporting Processes Assessment (page 19), and Unplanned Activity Tracking (page 22) to begin the process and not to overwhelm the staff. At a later date other sections are completed including the Activity Survey (pages 11 and A3-A8) and Cycle Tool (page 17). Other sections are completed later.
Once the data/information have been collected, staff review and discuss the findings, and begin to identify areas of key improvements.
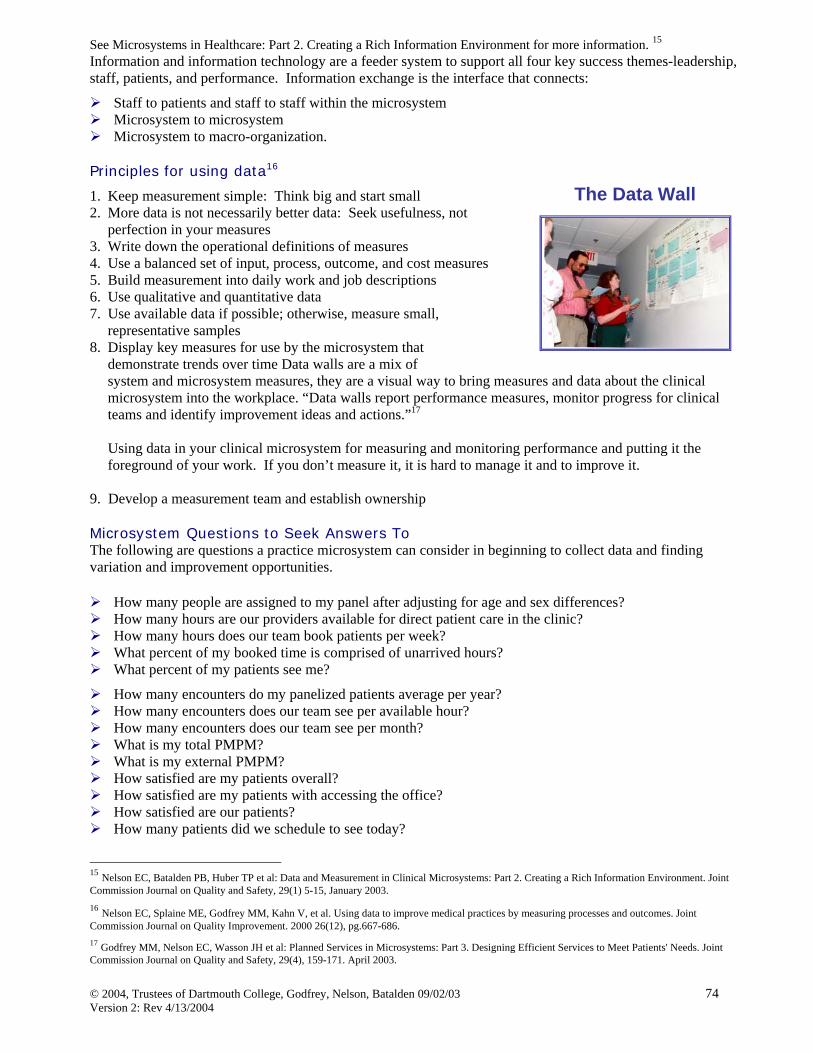
Frequently, staff will begin a “data wall” – a designated area to post findings and track progress of improvements to communicate to all staff and keep the efforts visibly available.
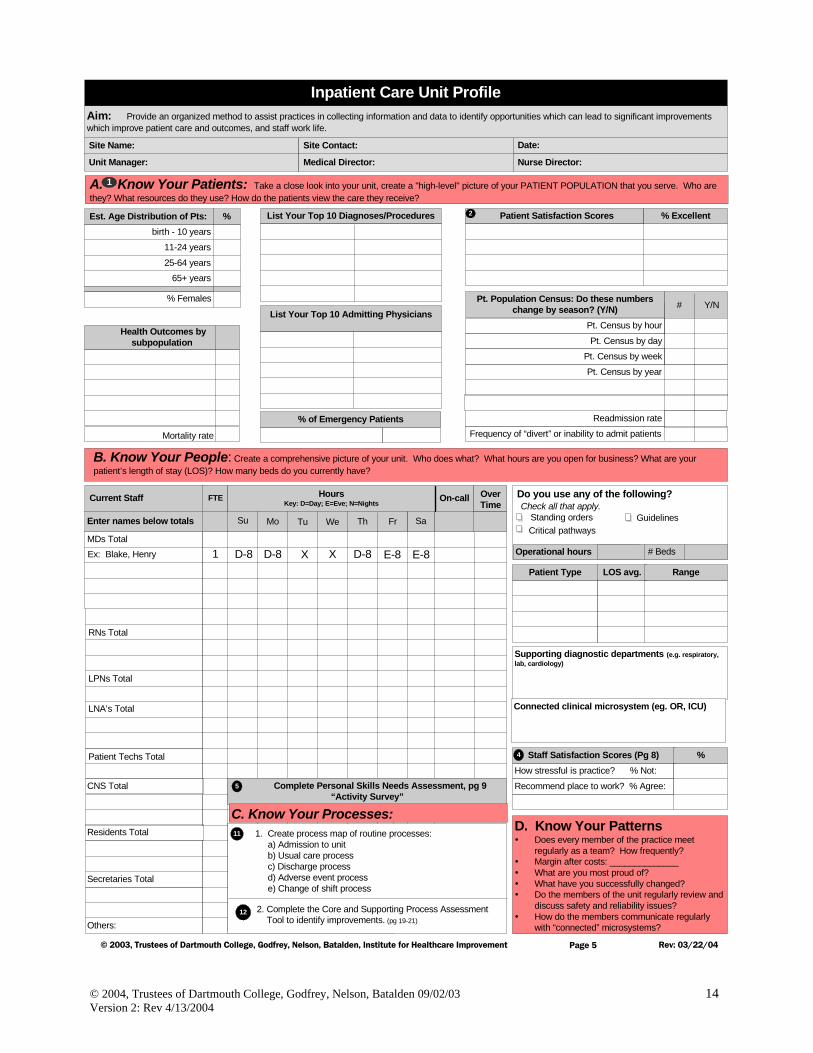
To begin to create your own clinical microsystem diagram, you will need to begin to complete either the Primary Care, Specialty Care Practice, or Inpatient Profile on pages 3-5 of the Assessing Your Practice Workbook. * An alternative approach that might be considered is visiting the website www.improveyourmedicalcare.org
Primary Care, Specialty Care Practice, & Inpatient Profiles
We continue to collect adaptations of the practice profile as clinical microsystems in different settings utilize this framework. You will find a growing collection of these adaptations at www.clinicalmicrosystem.org, for example, braintrauma, pharmacy, eyecare, and visiting nurse services. Once you have begun to reflect and learn about the 5 “Ps” of your clinical microsystem, you can create your own microsystem diagram.
A. Know Your Patients: Take a close look into your practice, create a "high-level" picture of your PATIENT POPULATION that you serve.Who are they? What resources do they use? How do the patients view the care they receive?
Pt. Population: Do these numberschange by season? (Y/N)
# Patients seen in a day
# Patients seen in last week
# New patients in last month
# Disenrolling patients in last month
# Encounters per provider per year
# Y/N
Out of Practice VisitsCondition Sensitive Hospital Rate
Emergency Room Visit Rate
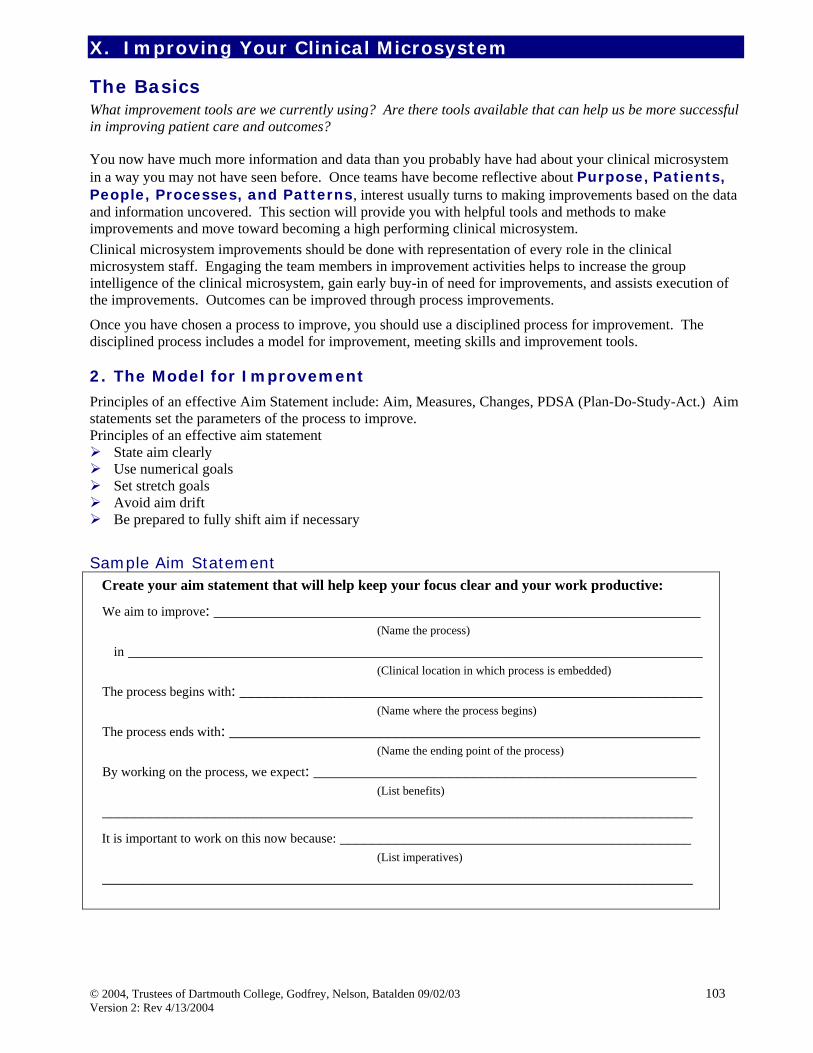
Aim of Our Clinical Microsystem:
Site Name: Date:Site Contact:
Practice Manager: MD Lead: Nurse Lead:
Access/Pt. Satis. Scores (pg 6 or 7)
Experience via Phone
Length of time to get your appointment
Saw who I wanted to see
Time spent with person saw today
% Excellent
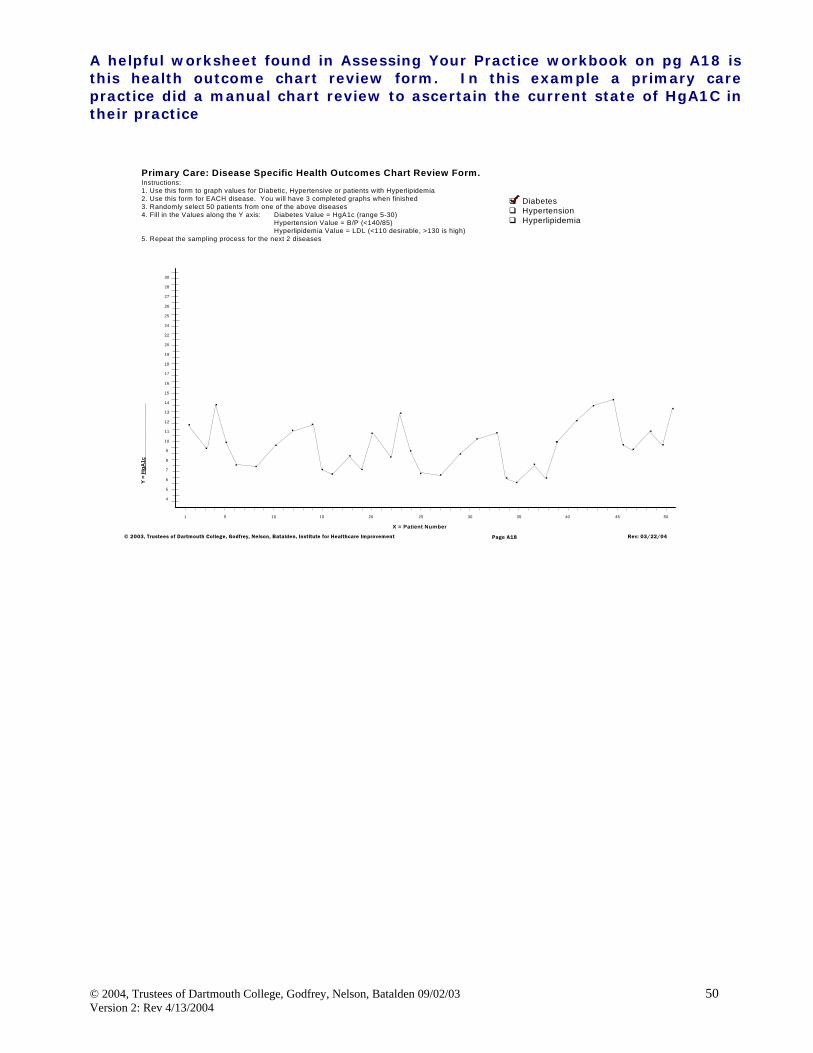
LDL <100 =
Diabetes HgA1c =
Disease Specific Health Outcomes (pg A21)
Hypertension B/P =
10 Most Frequent Conditions/Diagnoses Top Referrals (e.g. GI, Cardiology)
Other Clinical Microsystems weinteract with regularly, as we providecare for our patients. (eg. OR, VNA)
Patients who are Frequent Users of YourPractice Services and Their Reasons forSeeking Frequent Interactions and Visits
11 - 18 years
% FemalesEst. # (unique) pts. in Practice
Est. Age Dist. of Pts: %birth - 10 years
19 - 45 years
65 - 79 years46 - 64 years
80+ years
2
Days of Operation Hours Open
Monday
Thursday
Friday
Saturday
Sunday
Wednesday
Tuesday
# Exam Rooms
D. Know Your Patterns:Does every member of the practice meet regularly?How frequently?
Margin after costs: ____________
What are you most proud of?
What have you changed successfully?
Do the members of the practice regularly review and discusssafety and reliability issues?
group visitE-mailWeb siteRN clinicsphone follow-upphone care managementdisease registriesprotocols/guidelines_______________________________________
Do you offer any of thefollowing? Check all that apply.
Duration Comment:Appointment Type
Staff Satisfaction Scores (pg. 8)
How stressful is practice? % Not:
Recommend place to work? % Agree:
Percentage
5
4
B. Know Your People: Create a comprehensive picture of your practice. Who does what? What hours are you open for business?How many and what is the duration of your appointment types? How many exam rooms do you currently have? What is the morale of your staff?
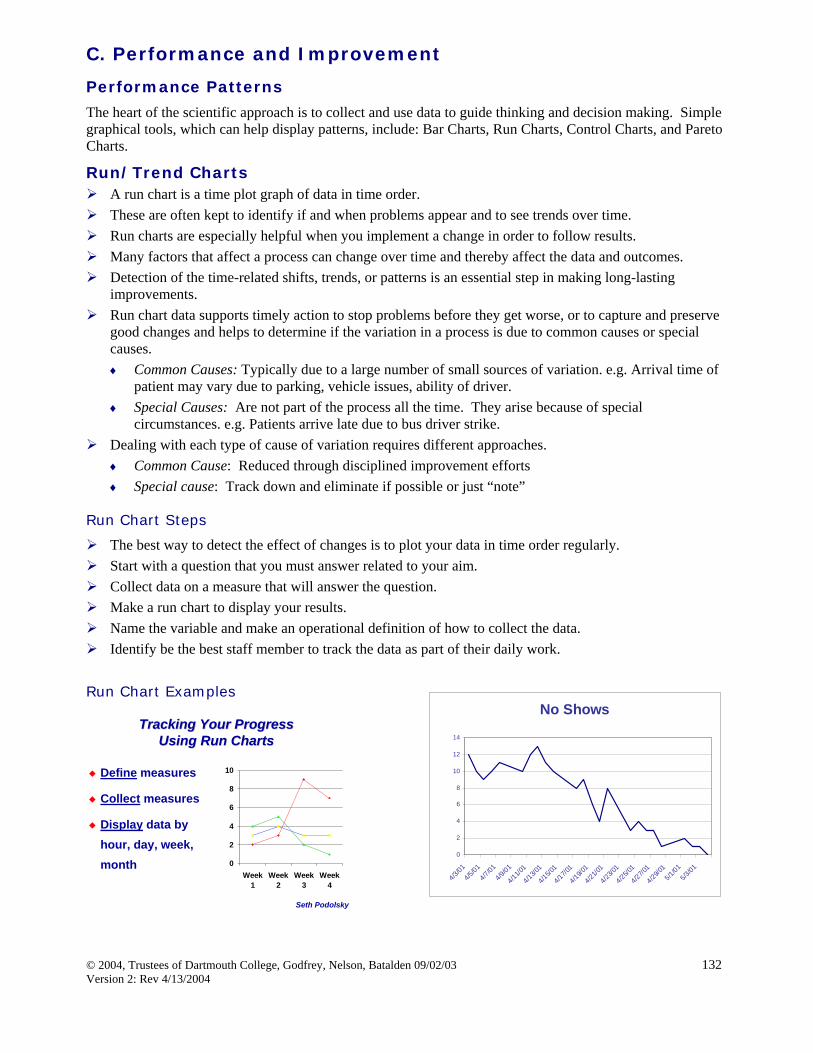
Current Staff FTE
MDs Total
NP/PAs Total
RNs Total
LPNs Total
LNA/MAs Total
Others:
Secretaries Total
Comment/Function
3rd NextAvail.
PE Non-Urgent
Enter names below totalsUse separate sheet, if needed
Range
CycleTime
11
Complete Personal Skills Needs Assessment, pg 8
C. Know Your Processes:
1. Track cycle time for patients from the time they check in until they leave the office using the Patient Cycle Tool. List ranges of time per provider on this table. (pg. 17,18)
2. Complete the Core and Supporting Process Assessment Tool to identify improvements.
(pg. 19-21)
11
12
1
D. Know Your PatternsDoes every member of the practice meetregularly as a team? How frequently?Margin after costs: ______________What are you most proud of?What have you successfully changed?Do the members of the practice regularly reviewand discuss safety and reliability issues?
Aim: Provide an organized method to assist practices in collecting information and data to identify opportunities which can lead to significant improvementswhich improve patient care and outcomes, and staff work life.
Site Name: Site Contact:
Page 4
Specialty Care Practice Profile
Access/Pt. Satisfaction Scores* (pg 6 or 7)
Experience via PhoneLength of time to get appointment
Saw who I wanted to seeTime spent with person you saw
B. Know Your People: Create a comprehensive picture of your practice. Who does what? What hours are you open for business? How many andwhat is the duration of your appointment types? How many exam rooms do you currently have?
Est. Age Distribution of Pts: %birth - 10 years
25-64 years65+ years
11-24 years
% Females
List Your Top 10 Diagnoses/Procedures
List Your Top 5 ReferrersReferrer What are they referring?
A. Know Your Patients: Take a close look into your practice, create a "high-level" picture of your PATIENT POPULATION that you serve. Whoare they? What resources do they use? How do the patients view the care they receive?
Practice Manager: MD Lead:
Pt. Population: Do these numbers changeby season? (Y/N)
# Pts. seen in a day
#
# Pts. seen in last week# New pts. in last month
# Encounters per provider per year# Same Day Procedures
# In -Clinic Procedures# Inpatient Procedures
Specialty Yield Rate
Staff Satisfaction Scores (Pg 8)How stressful is practice? % Not:
1. Track cycle time for patients office visits from the time they check in until they leave the office. Use the Patient Cycle Tool on page 17,18. List the ranges of time per provider on this table.
2. Complete the Core and Supporting Process Assessment Tool to identify improvements. (pg 19-21)
Check all that apply.Do you offer any of the following?
# Exam Rooms
phone follow-upphone care managementdisease registriesprotocols/guidelinesgroup visitE-mail
D. Know Your PatternsDoes every member of the practice meetregularly as a team? How frequently?Margin after costs: ______________What are you most proud of?What have you successfully changed?Do the members of the unit regularly review anddiscuss safety and reliability issues?How do the members communicate regularlywith “connected” microsystems?
Aim: Provide an organized method to assist practices in collecting information and data to identify opportunities which can lead to significant improvementswhich improve patient care and outcomes, and staff work life.
B. Know Your People: Create a comprehensive picture of your unit. Who does what? What hours are you open for business? What are yourpatient’s length of stay (LOS)? How many beds do you currently have?
Est. Age Distribution of Pts: %birth - 10 years
25-64 years65+ years
11-24 years
% Females
List Your Top 10 Diagnoses/Procedures
List Your Top 10 Admitting Physicians
A. Know Your Patients: Take a close look into your unit, create a "high-level" picture of your PATIENT POPULATION that you serve. Who arethey? What resources do they use? How do the patients view the care they receive?
Unit Manager: Medical Director:
Pt. Census by hour
Pt. Census by dayPt. Census by week
Pt. Census by year
Readmission rate
Frequency of “divert” or inability to admit patients
Staff Satisfaction Scores (Pg 8)How stressful is practice? % Not:
Complete Personal Skills Needs Assessment, pg 9“Activity Survey”
1. Create process map of routine processes: a) Admission to unit b) Usual care process c) Discharge process d) Adverse event process e) Change of shift process
Check all that apply.Do you use any of the following?
Operational hours
Standing orders GuidelinesCritical pathways
Date:
Nurse Director:
C. Know Your Processes:
5
11
12
On-call OverTime
RNs Total
Residents Total
2. Complete the Core and Supporting Process Assessment Tool to identify improvements. (pg 19-21)
Pt. Population Census: Do these numberschange by season? (Y/N)
A. Know Your Patients: Take a close look into your practice, create a "high-level" picture of your PATIENT POPULATION that you serve.Who are they? What resources do they use? How do the patients view the care they receive?
Pt. Population: Do these numberschange by season? (Y/N)
# Patients seen in a day
# Patients seen in last week
# New patients in last month
# Disenrolling patients in last month
# Encounters per provider per year
# Y/N
Out of Practice VisitsCondition Sensitive Hospital Rate
Emergency Room Visit Rate
Purpose/Aim of Our Clinical Microsystem:
Site Name: Date:Site Contact:
Practice Manager: MD Lead: Nurse Lead:
Access/Pt. Satis. Scores (pg 6 or 7)
Experience via Phone
Length of time to get your appointment
Saw who I wanted to see
Time spent with person saw today
% Excellent
LDL <100 =
Diabetes HgA1c =
Disease Specific Health Outcomes (pg A21)
Hypertension B/P =
10 Most Frequent Conditions/Diagnoses Top Referrals (e.g. GI, Cardiology)
Other Clinical Microsystems weinteract with regularly, as we providecare for our patients. (eg. OR, VNA)
Patients who are Frequent Users of YourPractice Services and Their Reasons forSeeking Frequent Interactions and Visits
11 - 18 years
% FemalesEst. # (unique) pts. in Practice
Est. Age Dist. of Pts: %birth - 10 years
19 - 45 years
65 - 79 years46 - 64 years
80+ years
2
Days of Operation Hours Open
Monday
Thursday
Friday
Saturday
Sunday
Wednesday
Tuesday
# Exam Rooms
D. Know Your Patterns:Does every member of the practice meet regularly?How frequently?
Margin after costs: ____________
What are you most proud of?
What have you changed successfully?
Do the members of the practice regularly review and discusssafety and reliability issues?
group visitE-mailWeb siteRN clinicsphone follow-upphone care managementdisease registriesprotocols/guidelines_______________________________________
Do you offer any of thefollowing? Check all that apply.
Duration Comment:Appointment Type
Staff Satisfaction Scores (pg. 8)
How stressful is practice? % Not:
Recommend place to work? % Agree:
Percentage
5
4
B. Know Your People: Create a comprehensive picture of your practice. Who does what? What hours are you open for business?How many and what is the duration of your appointment types? How many exam rooms do you currently have? What is the morale of your staff?
Current Staff FTE
MDs Total
NP/PAs Total
RNs Total
LPNs Total
LNA/MAs Total
Others:
Secretaries Total
Comment/Function
3rd NextAvail.
PE Non-Urgent
Enter names below totalsUse separate sheet, if needed
Range
CycleTime
11
Complete Personal Skills Needs Assessment, pg 8
C. Know Your Processes:
1. Track cycle time for patients from the time they check in until they leave the office using the Patient Cycle Tool. List ranges of time per provider on this table. (pg. 17,18)
2. Complete the Core and Supporting Process Assessment Tool to identify improvements.
D. Know Your PatternsDoes every member of the practice meetregularly as a team? How frequently?Margin after costs: ______________What are you most proud of?What have you successfully changed?Do the members of the practice regularly reviewand discuss safety and reliability issues?
Purpose/Aim: Provide an organized method to assist practices in collecting information and data to identify opportunities which can lead to significantimprovements which improve patient care and outcomes, and staff work life.
B. Know Your People: Create a comprehensive picture of your practice. Who does what? What hours are you open for business? How many andwhat is the duration of your appointment types? How many exam rooms do you currently have?
Est. Age Distribution of Pts: %birth - 10 years
25-64 years
65+ years
11-24 years
% Females
List Your Top 10 Diagnoses/Procedures
List Your Top 5 ReferrersReferrer What are they referring?
A. Know Your Patients: Take a close look into your practice, create a "high-level" picture of your PATIENT POPULATION that you serve. Whoare they? What resources do they use? How do the patients view the care they receive?
Practice Manager: MD Lead:
Pt. Population: Do these numbers changeby season? (Y/N)
# Pts. seen in a day
#
# Pts. seen in last week
# New pts. in last month
# Encounters per provider per year
# Same Day Procedures
# In -Clinic Procedures# Inpatient Procedures
Specialty Yield Rate
Staff Satisfaction Scores (Pg 8)How stressful is practice? % Not:
1. Track cycle time for patients office visits from the time they check in until they leave the office. Use the Patient Cycle Tool on page 17,18. List the ranges of time per provider on this table.
2. Complete the Core and Supporting Process Assessment Tool to identify improvements. (pg 19-21)
Check all that apply.Do you offer any of the following?
# Exam Rooms
phone follow-upphone care managementdisease registriesprotocols/guidelinesgroup visitE-mail
D. Know Your PatternsDoes every member of the practice meetregularly as a team? How frequently?Margin after costs: ______________What are you most proud of?What have you successfully changed?Do the members of the unit regularly review anddiscuss safety and reliability issues?How do the members communicate regularlywith “connected” microsystems?
Aim: Provide an organized method to assist practices in collecting information and data to identify opportunities which can lead to significant improvementswhich improve patient care and outcomes, and staff work life.
B. Know Your People: Create a comprehensive picture of your unit. Who does what? What hours are you open for business? What are yourpatient’s length of stay (LOS)? How many beds do you currently have?
Est. Age Distribution of Pts: %birth - 10 years
25-64 years65+ years
11-24 years
% Females
List Your Top 10 Diagnoses/Procedures
List Your Top 10 Admitting Physicians
A. Know Your Patients: Take a close look into your unit, create a "high-level" picture of your PATIENT POPULATION that you serve. Who arethey? What resources do they use? How do the patients view the care they receive?
Unit Manager: Medical Director:
Pt. Census by hour
Pt. Census by day
Pt. Census by week
Pt. Census by year
Readmission rate
Frequency of “divert” or inability to admit patients
Staff Satisfaction Scores (Pg 8)How stressful is practice? % Not:
Complete Personal Skills Needs Assessment, pg 9“Activity Survey”
1. Create process map of routine processes: a) Admission to unit b) Usual care process c) Discharge process d) Adverse event process e) Change of shift process
Check all that apply.Do you use any of the following?
Operational hours
Standing orders GuidelinesCritical pathways
Date:
Nurse Director:
C. Know Your Processes:
5
11
12
On-call OverTime
RNs Total
Residents Total
2. Complete the Core and Supporting Process Assessment Tool to identify improvements. (pg 19-21)
Pt. Population Census: Do these numberschange by season? (Y/N)
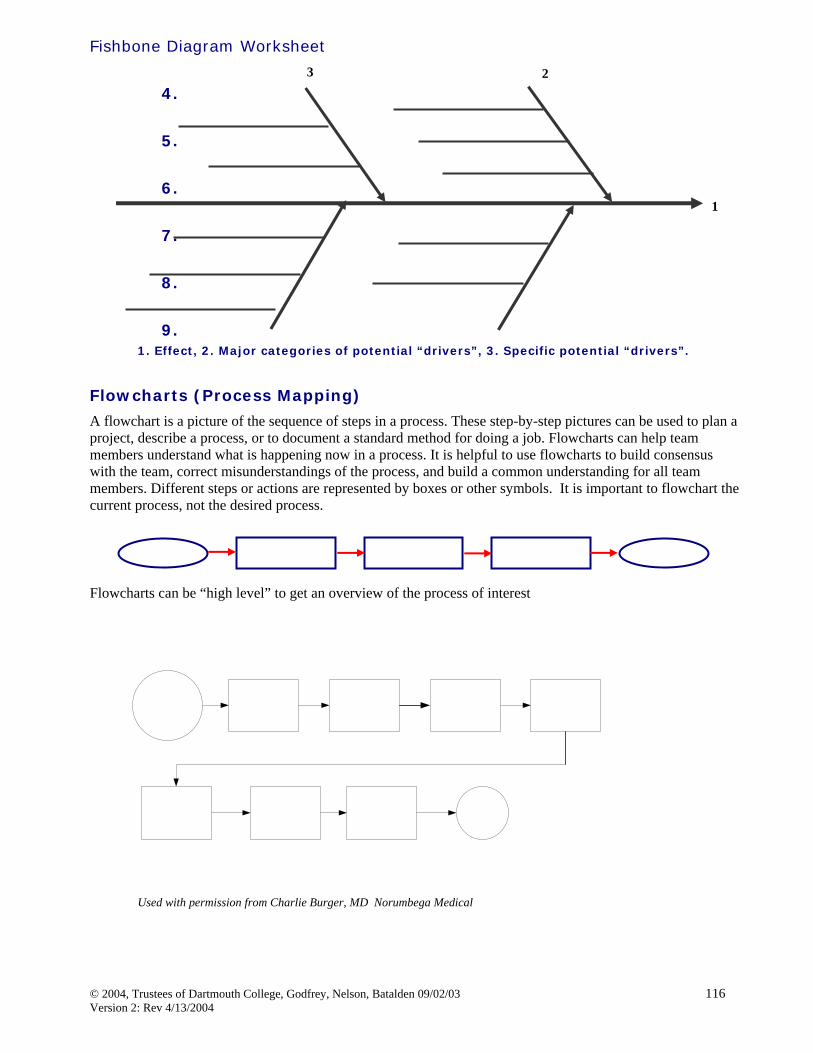
Create a High Level Flowchart. The next step is to create a high level flowchart of the core services you provide your population of patients. What are your core processes? What services do you provide to patients to meet their needs? How often are each of the services needed? Are there patterns in the demand? See the example below.
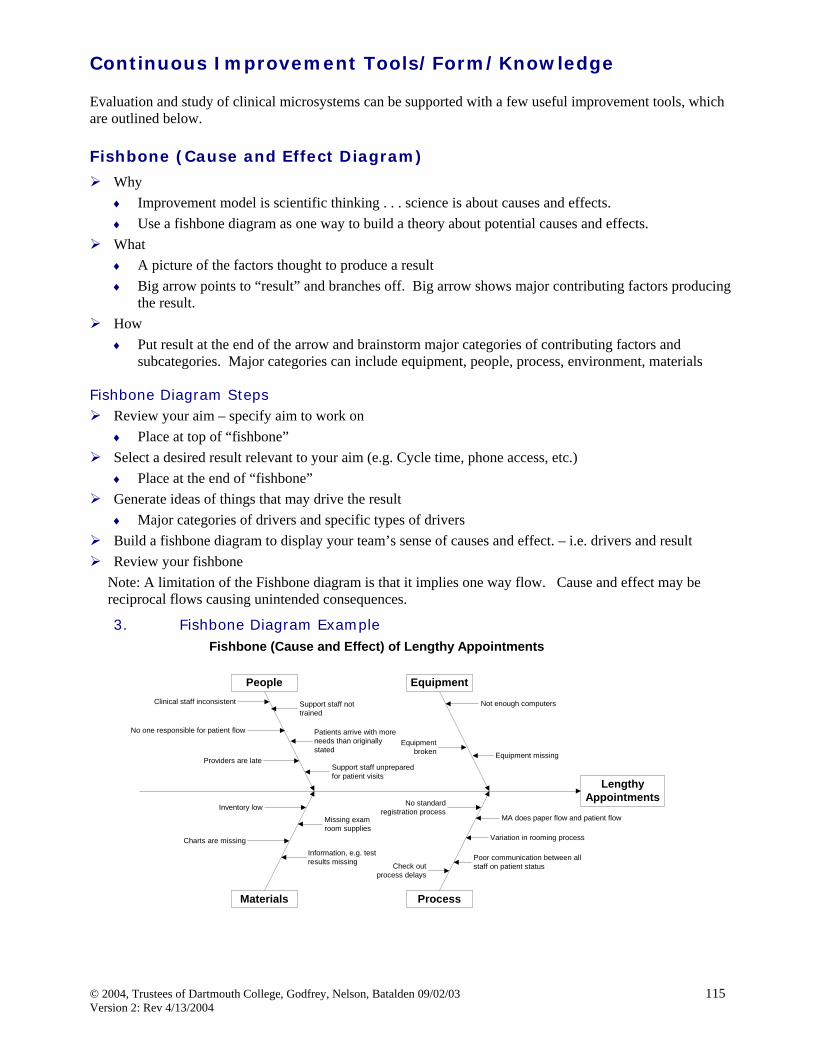
Research on 20 high-performing clinical microsystems sampled across the care continuum revealed strategic and practical importance of focusing improvement on the design and redesign of small functional clinical units.
Analysis of the results suggests that each clinical unit is a complex dynamic adaptive system with interacting elements that come together to produce superior results.
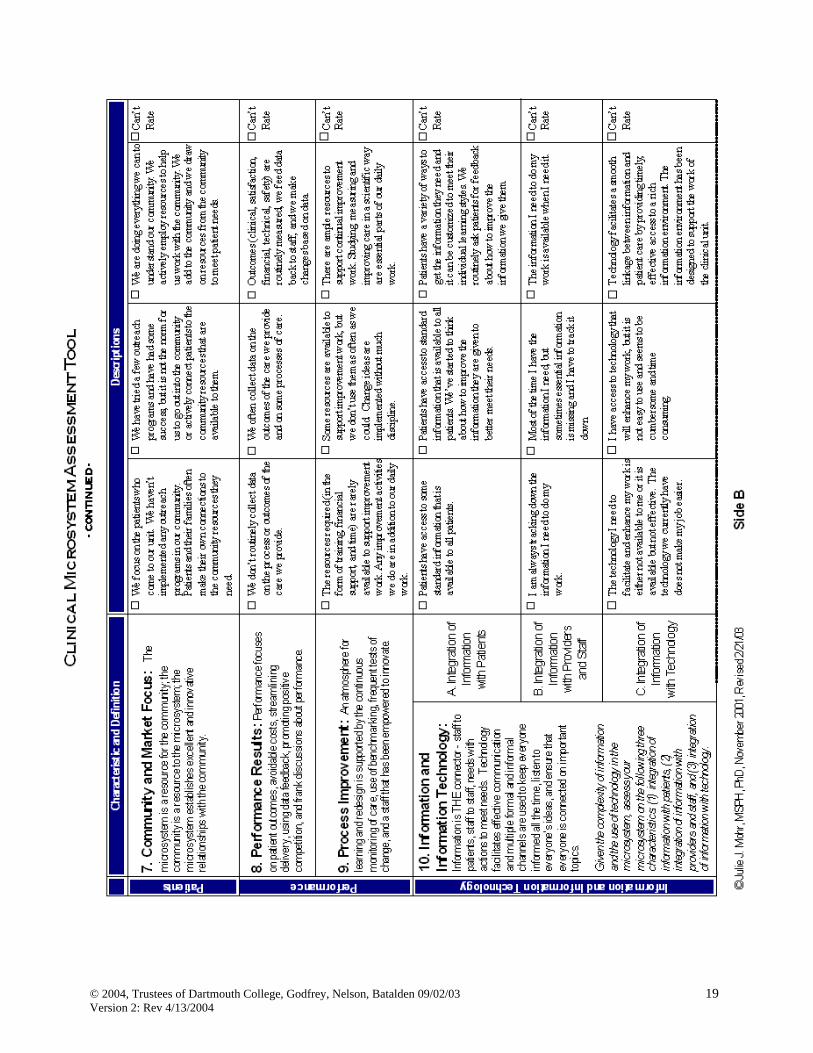
The Success Characteristics fall into 4 main groups and interact dynamically with one another. In addition to these 10 Characteristics, three additional themes emerge from the analysis, but not as frequently as the 10:
Patient Safety (pg. 89) External Environment (pg. 101) Health Professional Education (pg. 102)
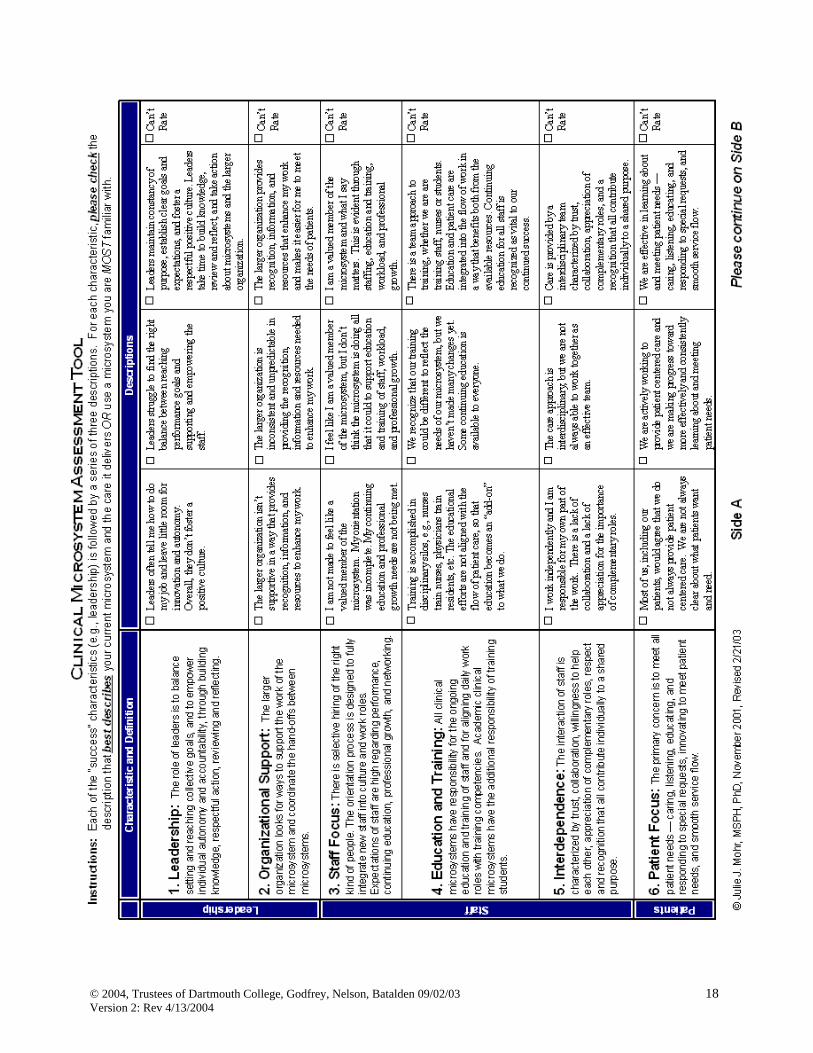
Success Characteristics of High Performing Clinical Microsystems
A helpful tool to assess how your clinical microsystem compares to the success characteristics of high performing clinical microsystems is the Microsystem Assessment Tool. This tool provides a definition of each success characteristic and three descriptions with a range of low functioning to high performing behaviors. Recommended use of the tool includes explaining to the staff/people of the clinical microsystem the background of clinical microsystems and to then ask each member of the staff to rate each characteristic, thinking of the clinical microsystem they work in everyday.
It is useful after completion to have a discussion with the entire staff to explore findings consistent or varied results and to discuss possible action. Identify the microsystem’s areas of strength and developmental opportunities.
Use the findings to guide selection of aspects of the clinical microsystem that appear to be top priorities for recognition and those that appear to be critical for improvement. Develop a plan for change based on these results. As always, these recommendations are provided as a general guide and should be modified to fit local conditions.
It must be remembered that “fixing” one aspect of the success characteristics is not the ultimate goal. The characteristics are all interconnected as depicted by the dotted lines and arrows. Often, improving one aspect of the microsystem will result in improvement in other areas.
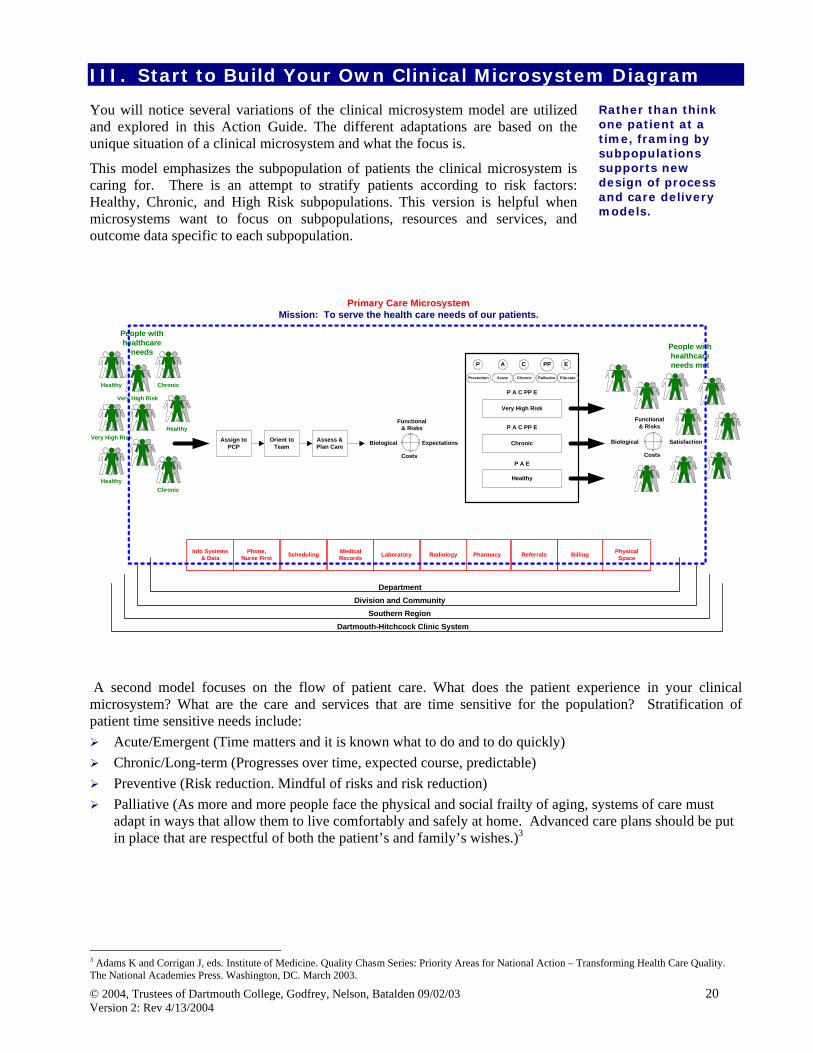
Rather than think one patient at a time, framing by subpopulations supports new design of process and care delivery models.
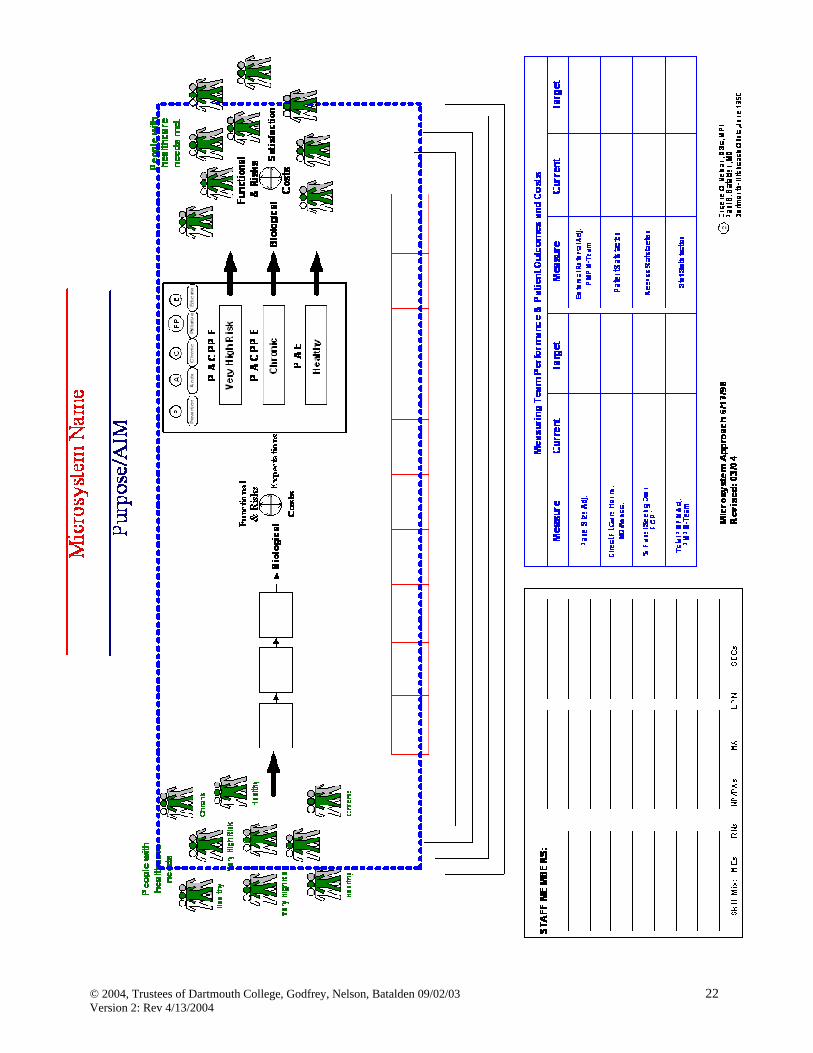
III. Start to Build Your Own Clinical Microsystem Diagram You will notice several variations of the clinical microsystem model are utilized and explored in this Action Guide. The different adaptations are based on the unique situation of a clinical microsystem and what the focus is.
This model emphasizes the subpopulation of patients the clinical microsystem is caring for. There is an attempt to stratify patients according to risk factors: Healthy, Chronic, and High Risk subpopulations. This version is helpful when microsystems want to focus on subpopulations, resources and services, and outcome data specific to each subpopulation.
Primary Care Microsystem
Mission: To serve the health care needs of our patients.
Very High Risk
Chronic
Very High Risk
Healthy
Healthy
Healthy
Chronic
Assign toPCP
Orient toTeam
Assess &Plan Care
Functional& Risks
Biological
Costs
Expectations Chronic
Very High Risk
Healthy
P A C PP E
P A C PP E
P A E
Functional& Risks
Biological
Costs
Satisfaction
People withhealthcare
needsPeople withhealthcareneeds met
Phone,Nurse First
PhysicalSpace
Info Systems& Data BillingReferralsPharmacyRadiologyLaboratoryMedical
RecordsScheduling
DepartmentDivision and Community
Southern RegionDartmouth-Hitchcock Clinic System
Prevention
P
Acute
A
Chronic
C
Educate
E
Palliative
PP
A second model focuses on the flow of patient care. What does the patient experience in your clinical microsystem? What are the care and services that are time sensitive for the population? Stratification of patient time sensitive needs include:
Acute/Emergent (Time matters and it is known what to do and to do quickly) Chronic/Long-term (Progresses over time, expected course, predictable) Preventive (Risk reduction. Mindful of risks and risk reduction) Palliative (As more and more people face the physical and social frailty of aging, systems of care must
adapt in ways that allow them to live comfortably and safely at home. Advanced care plans should be put in place that are respectful of both the patient’s and family’s wishes.)3
3 Adams K and Corrigan J, eds. Institute of Medicine. Quality Chasm Series: Priority Areas for National Action – Transforming Health Care Quality. The National Academies Press. Washington, DC. March 2003.
This model has been useful when microsystems really want to focus on planning care based on patient needs.
This supports the microsystem to focus on frequency of these conditions and resource utilization to meet the needs of the patients. There probably are other adaptations of the clinical microsystem that are very useful in the unique settings they exist. Box reminds us “all models are flawed, some are useful.” 4 We have tried to keep the model simple to encourage adaptation to the local setting. “Things should be made as simple as possible, but not any simpler.” 5
In the final analysis, no model is right. The advantage of a model is to gain perspective and “look in them” to learn from the patient and staff perspective.
Create your Clinical Microsystem Diagram. You can begin to create your clinical microsystem diagram to post for all staff to review and begin to increase self-awareness about whom the patients are, who the people providing care are, what the processes are to provide care and services, and what the patterns are within the clinical microsystem. A blank version for you to customize based on your knowledge of your clinical microsystem follows.
4 George E.P. Box, Professor Emeritus, Ronald Aylmer Fisher chair of statistics at the University of Wisconsin. 5 Albert Einstein
Micro-System Approach6/17/98Revised: 11/05/01c Eugene C. Nelson, DSc, MPH
Paul B. Batalden, MDDartmouth-Hitchcock Clinic, 2001
Sheasby, MS, MFT
Sirek, MS, MFT
Willson-Broyles, EdM
Wolfgram, MSSW
CD Counselors
Hansen, CADC III, CCS
Schreiner, CADC III
Westerberg, CADC III
Phillips, MS, MFT
Beesley
Schultz
Comer
Racanelli
Cunningham
Gannon
Kleinheinz
Weatherby
Recep/Sec/Record Rm.
Kaczmarczyk
Brantner
Greisen
Jacobs
Schlegelmilch
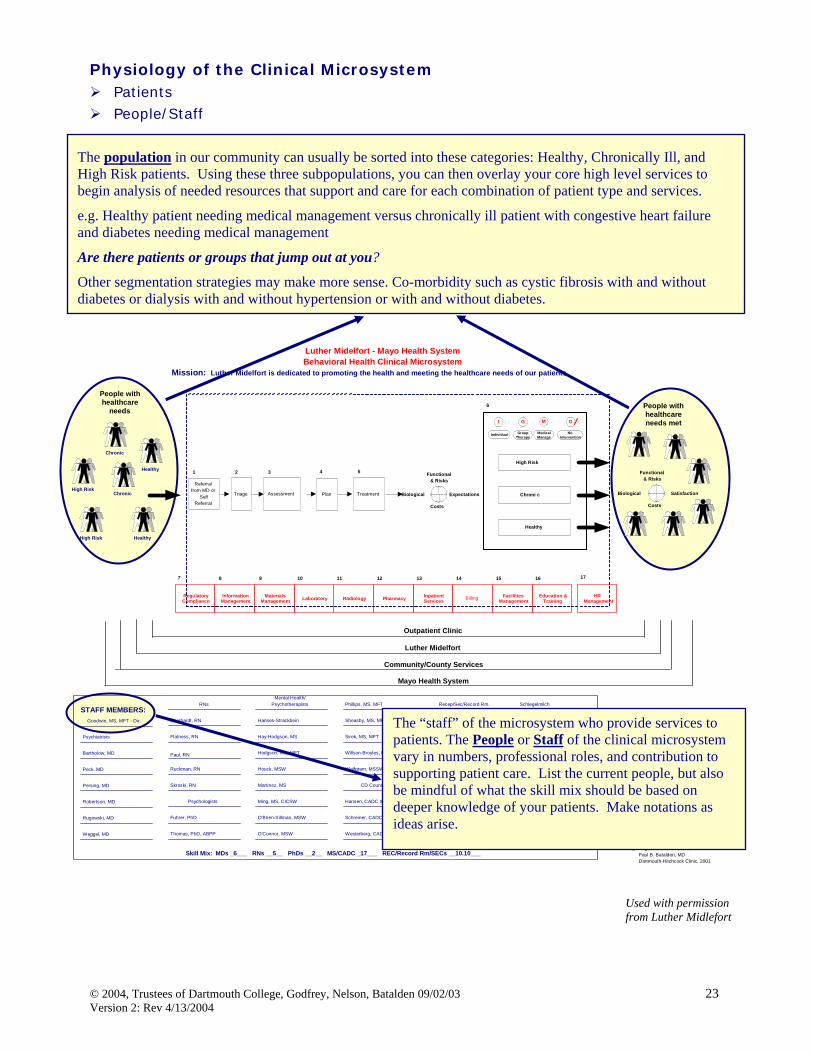
Physiology of the Clinical Microsystem
Patients People/Staff
1.
2.
3.
The population in our community can usually be sorted into these categories: Healthy, Chronically Ill, and High Risk patients. Using these three subpopulations, you can then overlay your core high level services to begin analysis of needed resources that support and care for each combination of patient type and services.
e.g. Healthy patient needing medical management versus chronically ill patient with congestive heart failure and diabetes needing medical management
Are there patients or groups that jump out at you?
Other segmentation strategies may make more sense. Co-morbidity such as cystic fibrosis with and without diabetes or dialysis with and without hypertension or with and without diabetes.
Used with permission from Luther Midlefort
The “staff” of the microsystem who provide services to patients. The People or Staff of the clinical microsystem vary in numbers, professional roles, and contribution to supporting patient care. List the current people, but also be mindful of what the skill mix should be based on deeper knowledge of your patients. Make notations as ideas arise.
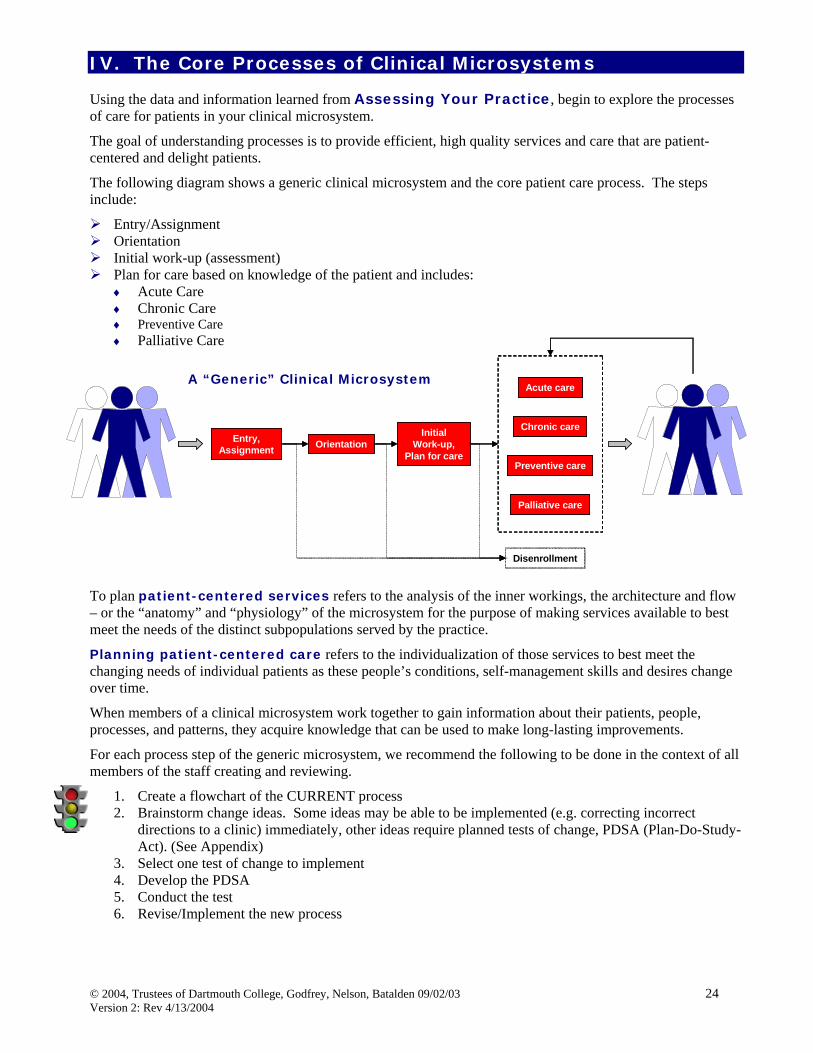
Using the data and information learned from Assessing Your Practice, begin to explore the processes of care for patients in your clinical microsystem.
The goal of understanding processes is to provide efficient, high quality services and care that are patient-centered and delight patients.
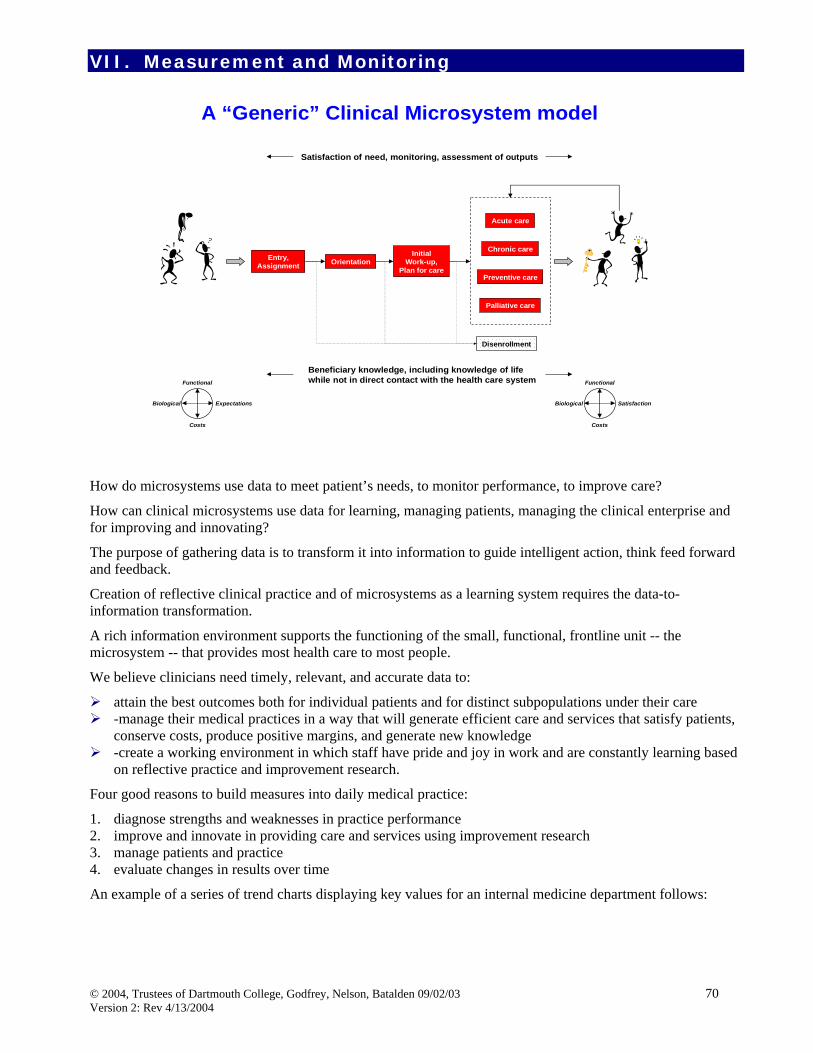
The following diagram shows a generic clinical microsystem and the core patient care process. The steps include:
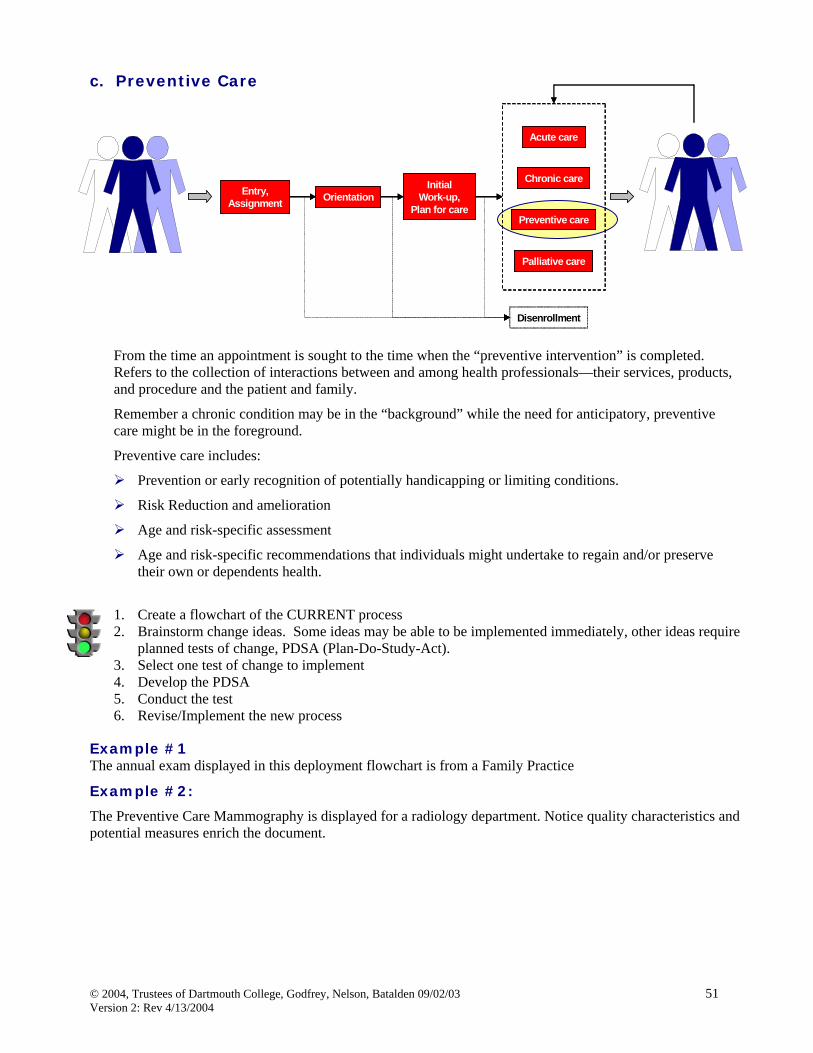
Entry/Assignment Orientation Initial work-up (assessment) Plan for care based on knowledge of the patient and includes: ♦ Acute Care ♦ Chronic Care ♦ Preventive Care ♦ Palliative Care
To plan patient-centered services refers to the analysis of the inner workings, the architecture and flow – or the “anatomy” and “physiology” of the microsystem for the purpose of making services available to best meet the needs of the distinct subpopulations served by the practice.
Planning patient-centered care refers to the individualization of those services to best meet the changing needs of individual patients as these people’s conditions, self-management skills and desires change over time.
When members of a clinical microsystem work together to gain information about their patients, people, processes, and patterns, they acquire knowledge that can be used to make long-lasting improvements.
For each process step of the generic microsystem, we recommend the following to be done in the context of all members of the staff creating and reviewing.
1. Create a flowchart of the CURRENT process 2. Brainstorm change ideas. Some ideas may be able to be implemented (e.g. correcting incorrect
directions to a clinic) immediately, other ideas require planned tests of change, PDSA (Plan-Do-Study-Act). (See Appendix)
3. Select one test of change to implement 4. Develop the PDSA 5. Conduct the test 6. Revise/Implement the new process
This step starts from the time a person decides to enroll in some health care system, plan, clinic, inpatient unit, home health services to the time that person is explicitly related to a specific health care provider or provider team.
How does the patient “access” the clinical microsystem? Access includes the telephone, email/web, appointments. How easy and convenient are the entry ports to your clinical microsystem?
Entry and access can be considered in multiple microsystems. How do patients enter the Post Anesthesia Care Unit of a hospital? How do patients enter the Visiting Nurse Services? How do patients access information and care in a primary care practice?
B. C. 1. Create a flowchart of the CURRENT process 2. Brainstorm change ideas. Some ideas may be able to be implemented immediately; other ideas require
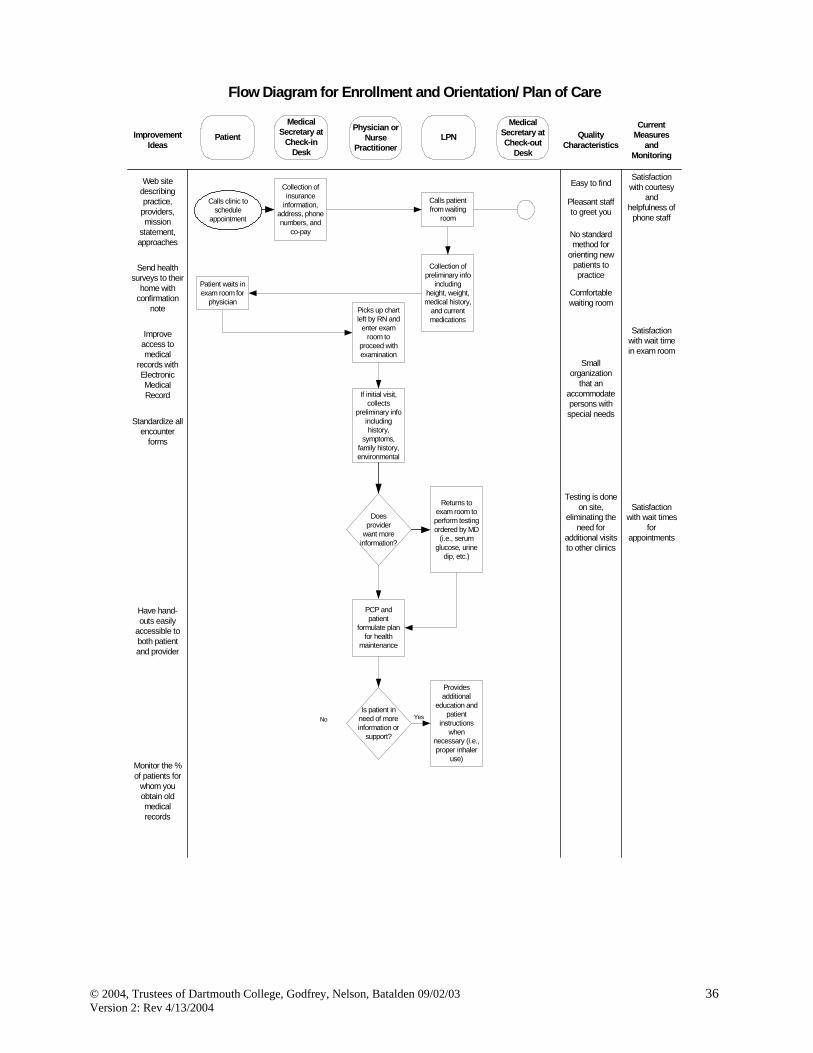
planned tests of change, PDSA (Plan-Do-Study-Act). 3. Select one test of change to implement 4. Develop the PDSA 5. Conduct the test 6. Revise/Implement the new process Example: The following example shows the process of Entry/Enrollment and Assignment in a primary care practice. This is a deployment flowchart that shows the detail of the steps of the process by functions of each role in the microsystem. This type of flowchart often provides “clues” for redesign, waste reduction, and enhanced flow.
Aim: To enroll a new patient in the practice and assign a PCP.Boundaries: From the time an individual patient begins to seek a PCP to when they are assignedto Dr. Burger.
Enrollment and Assignment
Patient
Asks friends andfamily members
forrecommendations
Yes
No
Choose Dr. Burger
Explanation ofpractice
Patient selectsanother PCP
Does Dr. Burger'spractice still meet thepatient's needs and
is a good fit?
Family/Friends PatientRepresentative
Patient calls Dr.Burger's office
Receives patient'sdemographicinformation
No
Yes
Suggests patientundergo a physical
Does thepatient want a
physical?
Schedules anappointment
Explains theprocess of the
physical
Patient endsphone call andcalls back at alater date with
acute care need
Ends phone callwith patient
No Yes
Dr. Burger's name is atthe beginning of the list
because it is inalphabetical order.
The patient knows thebasic system of the
practice before joining.
Patients can selectanother provider if theydo not like the system.
Basic information iscollected to create a
patient chart/file.Since Dr. Burger's
physical is different, thepatient representative
encourages all patientsto have another
physical, even if thepatient had a physical
recently.
Orients patient to theprocess of the physical.
Patients can schedulean appointment right
away and do not needto call back later.
The patient cancomplete the
questionnaire at hometo save time during the
visit. The stampedenvelope allows thepatient able to returnthe questionnaire in a
timely fashion.
The number of timesthe patient is
recommended from afriend or family
member.
The number of timesthe patient chooses
Burger arbitrarily off ofan insurance list.
The percentage ofpatients that decide Dr.Burger's office is not agood fit from the first
conversation.
The number of patientsthat schedule a physical
during enrollment.
The amount of timebetween the enrollmentand the scheduling of
the first physicalappointment.
The proportion ofpatients that return thequestionnaire through
the mail.
Overall patientsatisfaction with theenrollment process.
Create a specificwebsite for Dr.
Burger's practiceand send it to the
insurancecompanies.
Send demographicinformation
electronicallythrough email orweb-based site.
Create a web-based
questionnaire oremail information.
Encouragepatients to email
enrollmentrequest.
Encouragepatients to becomeinsured if they can
afford it.
Patient needsPCP
Does the patienthave insurance?
Evaluate whichPCPs are covered
Choose a PCP offof coveredprovider listarbitrarily
InsuranceCompany
Dr. Burger sees manypatients and is well
known in thecommunity.
Dr. Burger is a providerfor all insurance
companies in the area.
Mails a copy of themedical history
questionnaire with astamped envelope forthe patient to return
Appendix 3aStone - Watson - Weiner
Used with permission of Charlie Burger MD, Norumbega Medical
Entry or access to a clinical microsystem can be impacted by many variables. Access can be easy or access can be delayed and frustrating. Key ideas to understanding access include:
1. Know your demand: What and how much is the true demand of your clinical microsystem? Do not depend on only historical data, since the historical data shows that was actually provided. Look deeper into the demand of your clinical microsystem. Explore variation of demand by hours, sessions, days, weeks, months, and seasons. When do the peaks happen?
2. Know your capacity: Capacity refers to the people in your microsystem, along with hours/days of operation. Evaluate the Full Time Equivalent (FTE) status of each member to realize what the capacity to provide care and services is. Review hours of operation and compare to the demand information to identify gaps.
3. Once you have clear information/data on demand and supply you can begin to “shape” either. Reconsidering follow-up office appointments, considering group visits and follow up calls are a few ways to “shape” demand. There may be instances when increasing capacity includes adding hours or sessions. In some situations, actual staff may need to be added.
4. If you have a waitlist or backlog of patients waiting for services, eliminate this list.
5. Variation in demand and supply happen. Instead of reacting to a sick call, have a contingency plan in place to implement. Contingency planning helps the microsystem become more proactive.
To understand the key changes/ideas and principles more deeply, please refer to the Improving Access to Care Workbook and Measuring Access Improvement book at www.clinicalmicrosystem.org.
Example: The following example shows the process of Entry/Enrollment and Assignment in an outpatient Clinic and Infusion Room . These are deployment flowcharts that shows the detail of the steps of the process by functions of each role in the microsystem.
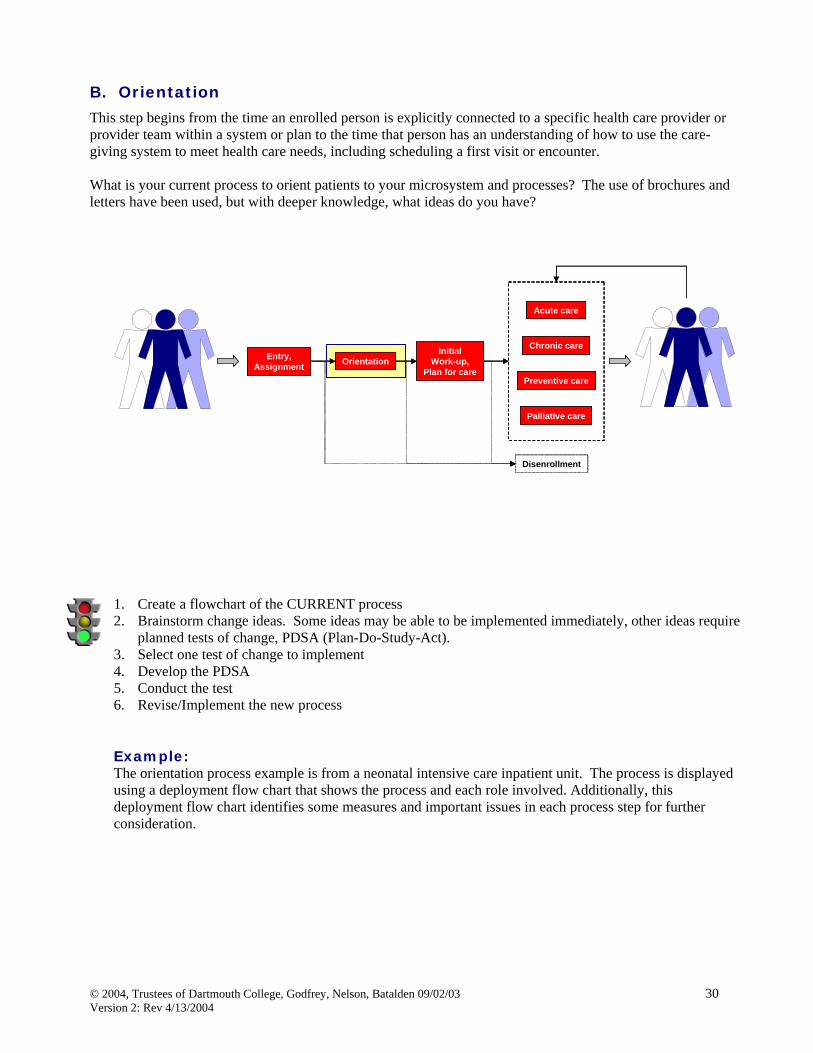
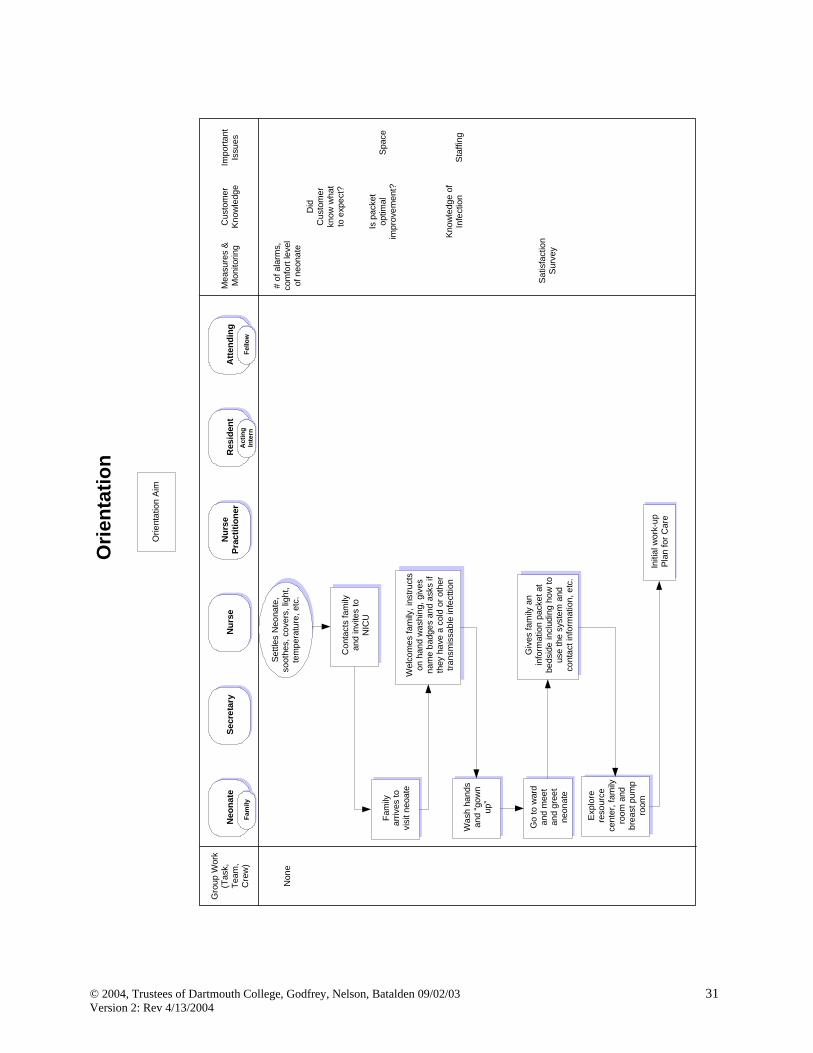
This step begins from the time an enrolled person is explicitly connected to a specific health care provider or provider team within a system or plan to the time that person has an understanding of how to use the care-giving system to meet health care needs, including scheduling a first visit or encounter. What is your current process to orient patients to your microsystem and processes? The use of brochures and letters have been used, but with deeper knowledge, what ideas do you have?
1. Create a flowchart of the CURRENT process 2. Brainstorm change ideas. Some ideas may be able to be implemented immediately, other ideas require
planned tests of change, PDSA (Plan-Do-Study-Act). 3. Select one test of change to implement 4. Develop the PDSA 5. Conduct the test 6. Revise/Implement the new process Example: The orientation process example is from a neonatal intensive care inpatient unit. The process is displayed using a deployment flow chart that shows the process and each role involved. Additionally, this deployment flow chart identifies some measures and important issues in each process step for further consideration.
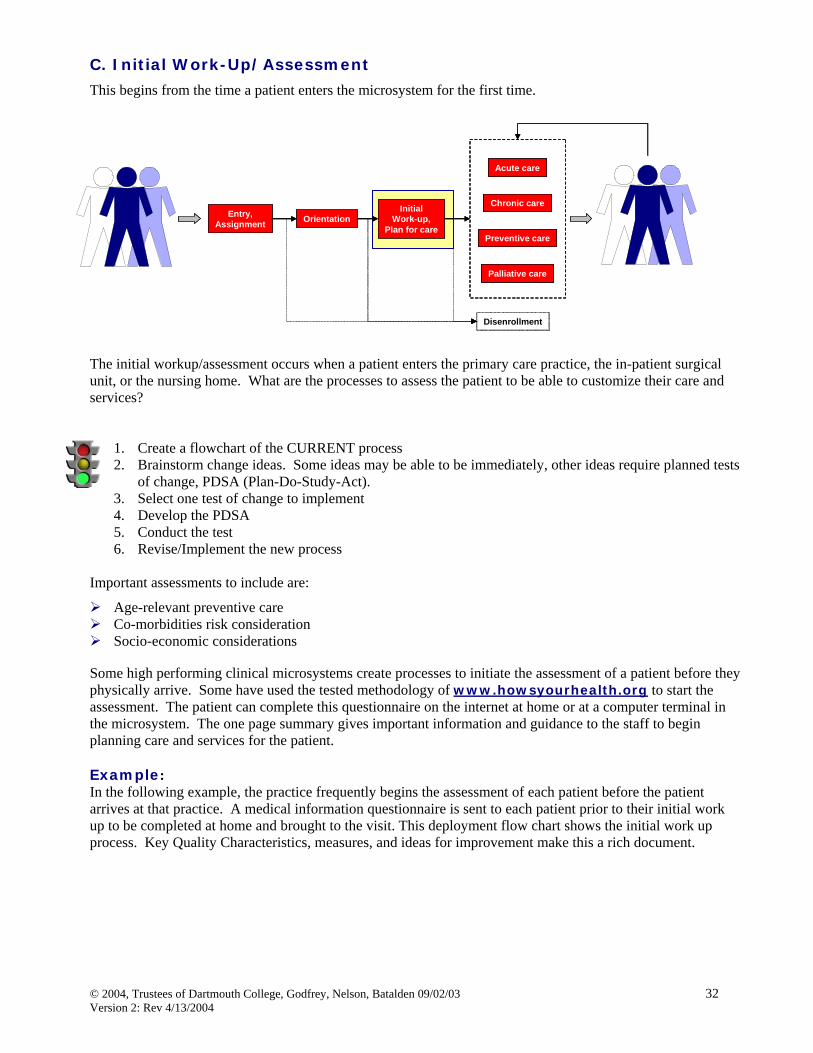
This begins from the time a patient enters the microsystem for the first time. The initial workup/assessment occurs when a patient enters the primary care practice, the in-patient surgical unit, or the nursing home. What are the processes to assess the patient to be able to customize their care and services?
1. Create a flowchart of the CURRENT process 2. Brainstorm change ideas. Some ideas may be able to be immediately, other ideas require planned tests
of change, PDSA (Plan-Do-Study-Act). 3. Select one test of change to implement 4. Develop the PDSA 5. Conduct the test 6. Revise/Implement the new process
Important assessments to include are:
Age-relevant preventive care Co-morbidities risk consideration Socio-economic considerations
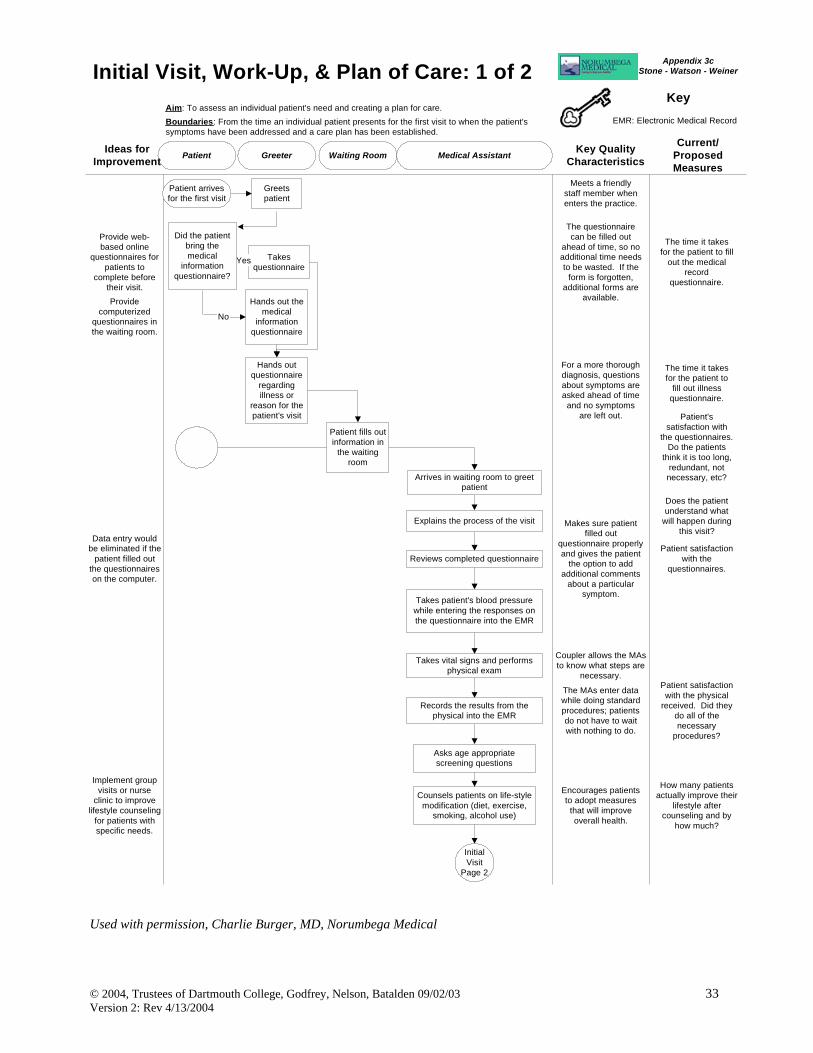
Some high performing clinical microsystems create processes to initiate the assessment of a patient before they physically arrive. Some have used the tested methodology of www.howsyourhealth.org to start the assessment. The patient can complete this questionnaire on the internet at home or at a computer terminal in the microsystem. The one page summary gives important information and guidance to the staff to begin planning care and services for the patient. Example: In the following example, the practice frequently begins the assessment of each patient before the patient arrives at that practice. A medical information questionnaire is sent to each patient prior to their initial work up to be completed at home and brought to the visit. This deployment flow chart shows the initial work up process. Key Quality Characteristics, measures, and ideas for improvement make this a rich document.
Used with permission, Charlie Burger, MD, Norumbega Medical
Waiting Room Medical AssistantPatient Greeter Key QualityCharacteristics
Current/ProposedMeasures
Ideas forImprovement
KeyEMR: Electronic Medical Record
Aim: To assess an individual patient's need and creating a plan for care.Boundaries: From the time an individual patient presents for the first visit to when the patient'ssymptoms have been addressed and a care plan has been established.
Initial Visit, Work-Up, & Plan of Care: 1 of 2
Hands out themedical
informationquestionnaire
Greetspatient
Hands outquestionnaire
regardingillness or
reason for thepatient's visit
Meets a friendlystaff member whenenters the practice.
Takesquestionnaire
Yes
No
The questionnairecan be filled out
ahead of time, so noadditional time needsto be wasted. If the
form is forgotten,additional forms are
available.
The time it takesfor the patient to fill
out the medicalrecord
questionnaire.
The time it takesfor the patient to
fill out illnessquestionnaire.
Patient'ssatisfaction with
the questionnaires.Do the patients
think it is too long,redundant, notnecessary, etc?
Patient arrivesfor the first visit
InitialVisit
Page 2
Explains the process of the visit
For a more thoroughdiagnosis, questionsabout symptoms areasked ahead of time
KeyEMR: Electronic Medical RecordPKC: Problem-KnowledgeCoupling
Aim: To assess an individual patient's need and creating a plan for care.Boundaries: From the time an individual patient presents for the first visit to when the patient'ssymptoms have been addressed and a care plan has been established.
Initial Visit, Work-Up, & Plan of Care: 2 of 2
Collect co-payments at thebeginning of the
visit.
Prints out medical recordand results, treatmentoptions, and any other
requested information fromthe session.
Collects co-payment.
Print out resultsbefore going over
the options, sothere is morefocus on the
patient than thecomputer.
Allows patients to havea copy of their medicalrecords. Patients canreview the results withothers and do not need
to remember detailsfrom the office visit.
The number of patientsthat review, use, orsave the printed out
records. Theimportance patients puton receiving a copy of
the records. How oftenthe patients requestother information.
InitialVisit
Page 1
Does patientneed a follow
up visit?
Yes
No
Schedules a follow up visitin 1-2 weeks
Patient goeshome until theyneed additional
care
Electronically faxes thelab orders
Does thepatient need
lab tests?
Comes to thesecond
appointmentNo
Yes
Goes to lab fortests
Goes over results and anyconcerns of the patient (up to
1 hour)
Discusses possible lifestylechanges or additional
treatments
Prints out results andpatient records
Collects co-payment
Electronic faxes makethe orders easier andfaster, so the patientcan be seen sooner.
The MA spends up toone hour discussingconcerns about the
patient's health.
The patient receives aprinted out copy of thetreatments, the medical
records, etc. Thepatient can review theirhealth concerns laterand with other people.
The MAs ensure thatthey thoroughly addressthe patient's concerns.
The percentage ofpeople that need a
follow up visit.
The number of patientswho do not want a
follow up visit or do notneed one.
The common lab resultsand the demographics
or symptoms of patientswho need specific lab
results done.
The time it takes toschedule a lab test
appointment.
The length of time ittakes for the results to
be received.
The averageinformation patientsseek and request.
Patients satisfactionwith the overall processof the physical and the
care received.
Patients satisfactionwith the printed out
copies. Do patients usethe information after the
visit?
Try to eliminateunnecessary visits.
Recommend homehealth care.
Print outinformation before
visit.
Collect co-payment at thebeginning of the
visit.
Give informationon group visits,websites, andother support
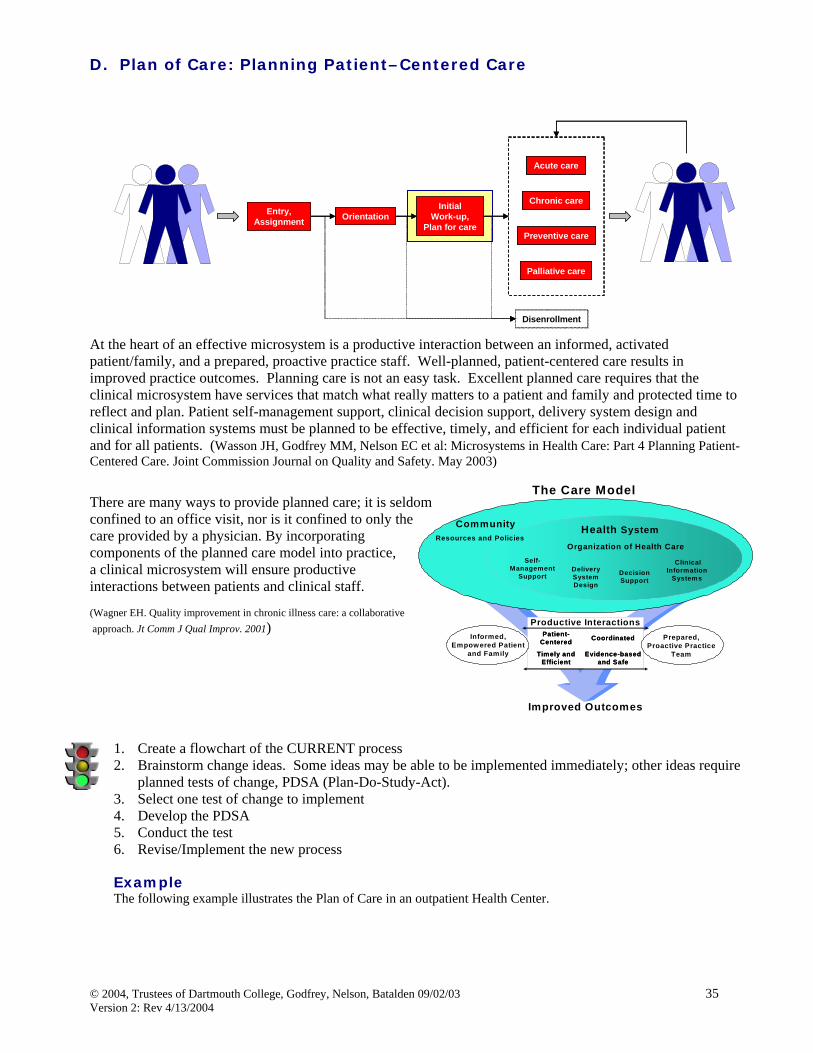
At the heart of an effective microsystem is a productive interaction between an informed, activated patient/family, and a prepared, proactive practice staff. Well-planned, patient-centered care results in improved practice outcomes. Planning care is not an easy task. Excellent planned care requires that the clinical microsystem have services that match what really matters to a patient and family and protected time to reflect and plan. Patient self-management support, clinical decision support, delivery system design and clinical information systems must be planned to be effective, timely, and efficient for each individual patient and for all patients. (Wasson JH, Godfrey MM, Nelson EC et al: Microsystems in Health Care: Part 4 Planning Patient-Centered Care. Joint Commission Journal on Quality and Safety. May 2003)
There are many ways to provide planned care; it is seldom confined to an office visit, nor is it confined to only the care provided by a physician. By incorporating components of the planned care model into practice, a clinical microsystem will ensure productive interactions between patients and clinical staff. (Wagner EH. Quality improvement in chronic illness care: a collaborative approach. Jt Comm J Qual Improv. 2001)
1. Create a flowchart of the CURRENT process 2. Brainstorm change ideas. Some ideas may be able to be implemented immediately; other ideas require
planned tests of change, PDSA (Plan-Do-Study-Act). 3. Select one test of change to implement 4. Develop the PDSA 5. Conduct the test 6. Revise/Implement the new process Example The following example illustrates the Plan of Care in an outpatient Health Center.
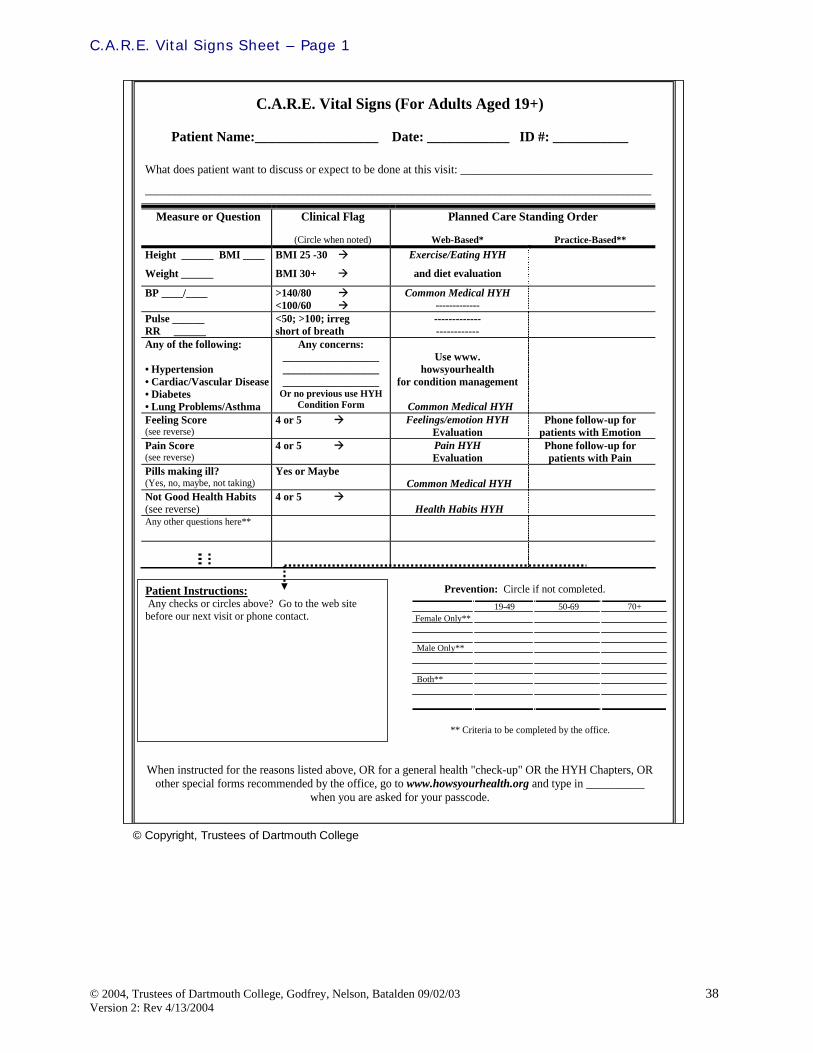
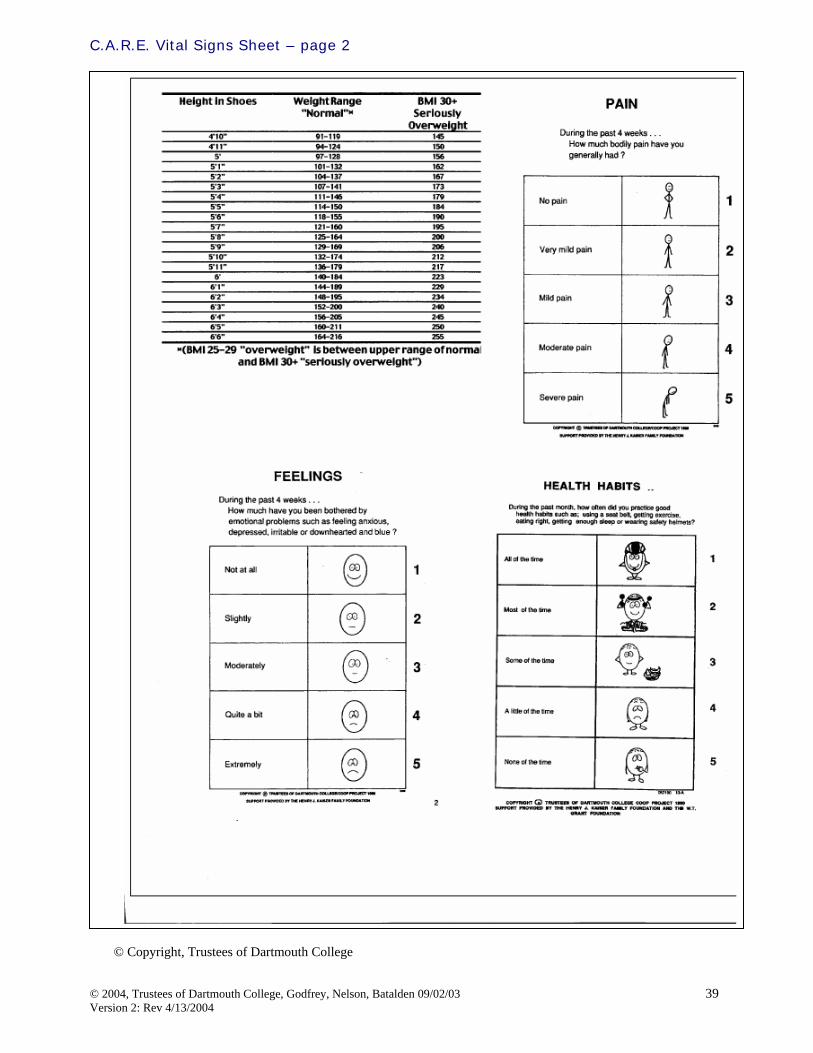
A helpful tool to optimize roles in the microsystem is the C.A.R.E. Vital Sign worksheet. Each member of the microsystem can function at their highest level based on education, training, licensure, and patient need. Using the CARE vital sign sheet in practice embeds the process of Checking patient needs, Activating pre-determined processes to engage the patient, Reinforcement proved by the MD, and utilizing Engineered models and processes to provide, track and follow up on the patient. The back of the CARE vital sign sheet has scale to rate the patient BMI, Pain, Feeling, and Health Habits. The CARE vital sign sheet has a carbon copy so the patient can take a copy home to be reminded of the visit findings, plan, and next steps.
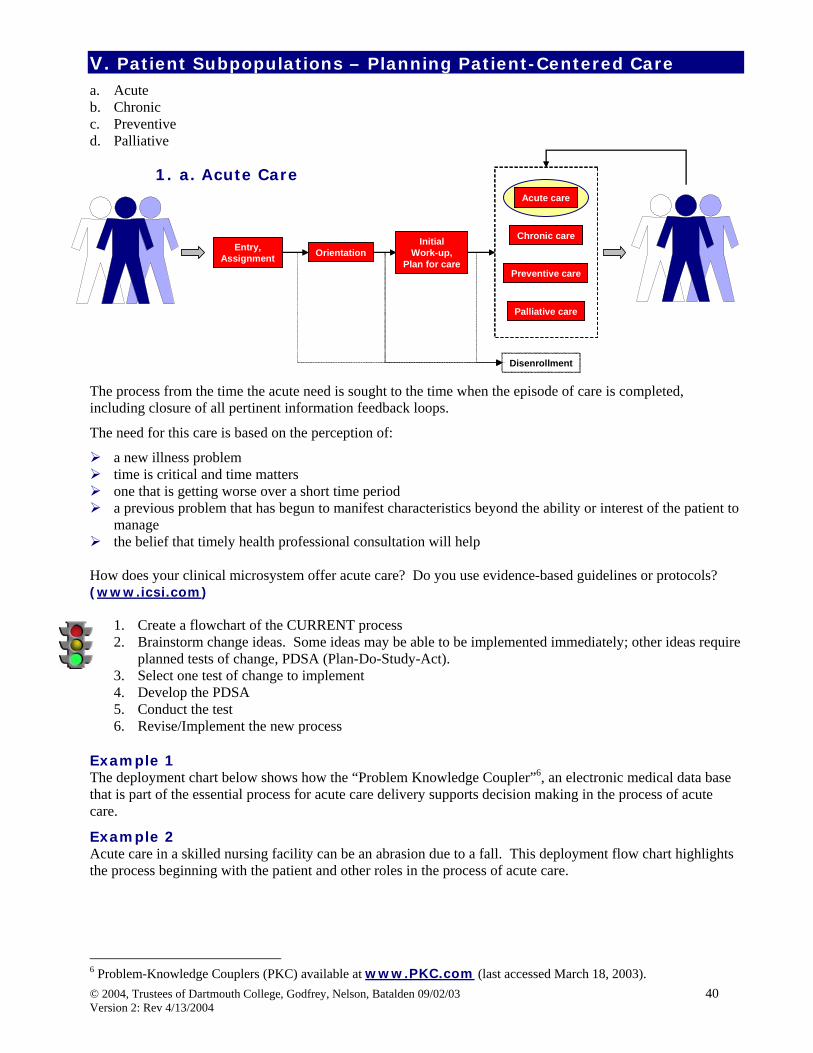
V. Patient Subpopulations – Planning Patient-Centered Care a. Acute b. Chronic c. Preventive d. Palliative
1. a. Acute Care
The process from the time the acute need is sought to the time when the episode of care is completed, including closure of all pertinent information feedback loops.
The need for this care is based on the perception of:
a new illness problem time is critical and time matters one that is getting worse over a short time period a previous problem that has begun to manifest characteristics beyond the ability or interest of the patient to
manage the belief that timely health professional consultation will help
How does your clinical microsystem offer acute care? Do you use evidence-based guidelines or protocols? (www.icsi.com)
1. Create a flowchart of the CURRENT process 2. Brainstorm change ideas. Some ideas may be able to be implemented immediately; other ideas require
planned tests of change, PDSA (Plan-Do-Study-Act). 3. Select one test of change to implement 4. Develop the PDSA 5. Conduct the test 6. Revise/Implement the new process
Example 1 The deployment chart below shows how the “Problem Knowledge Coupler”6, an electronic medical data base that is part of the essential process for acute care delivery supports decision making in the process of acute care.
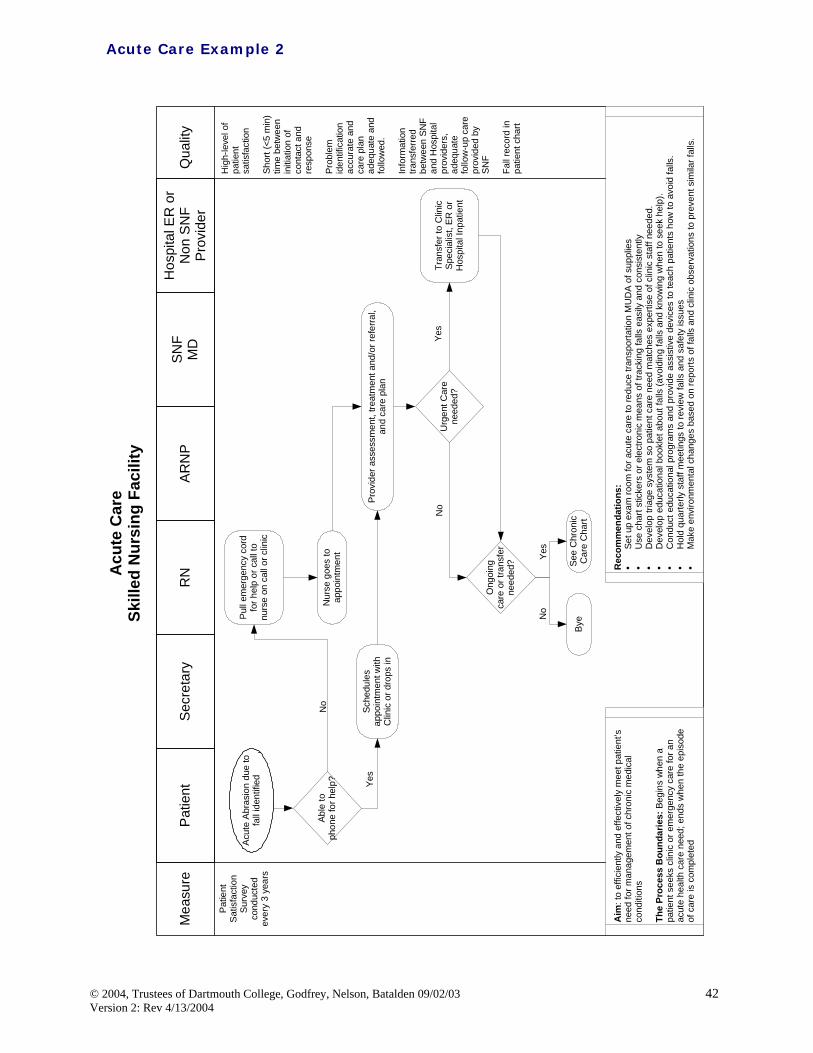
Example 2 Acute care in a skilled nursing facility can be an abrasion due to a fall. This deployment flow chart highlights the process beginning with the patient and other roles in the process of acute care.
6 Problem-Knowledge Couplers (PKC) available at www.PKC.com (last accessed March 18, 2003).
Used with Permission, Charlie Burger, MD Norumbega Medical
Acute Care Example 1
Waiting Room Medical Assistant ProviderPatient Greeter Key QualityCharacteristics
Current/ProposedMeasures
Ideas forImprovement
KeyEMR: Electronic Medical RecordPKC: Problem-KnowledgeCoupling
Aim: To establish a plan of care to manage an acute illness: hypothyroidism.Boundaries: From the time an individual patient contacts the clinic to when the patient'ssymptoms are resolved.
Acute Visit
Greets patient
Hands out aquestionnaire
regarding fatigueand depression
Meets a friendly staffmember when entering the
practice.
Eliminate greeter positionby doing records andquestionnaires online.
The questionnaire can befilled out ahead of time, sono additional time needs tobe wasted. If the form is
forgotten, additional formsare available.
The time it takes for thepatient to fill out the
fatigue questionnaire.
Prepares EMR forprovider
Provide web-basedonline questionnaires for
patients to completebefore their visit.
Patient arriveswith fatigue
Collect co-payments atthe beginning of the visit.
The wait between theMA and the provider.
Reviews options fortreatment: prescribes
medication
Asks questions usingPKC
Providers collect copays-no opportunity for missed
payment.
Patient fills outinformation in the
waiting room
MA comes out towaiting room to
greet patientProvide computerizedquestionnaires in the
waiting room.
Patients are informed of eventsplanned for their visit.
Explains the process ofthe office visit and that
the patient will be seeingDr. Burger
Orient the patientbefore he/she meets
the MA.
Does the patientunderstand what will
happen during this visit?
Reviews completedquestionnaire
Patient's satisfaction withthe questionnaires. Do
the patients think it is toolong, redundant, not
necessary, etc?
For a more thoroughdiagnosis, questions aboutsymptoms are asked aheadof time and no symptoms
are left out.
Takes temperature ofpatient while entering the
symptoms patientindicated indicative of
hypothyroidism
Data entry would beeliminated if the patient
filled out thequestionnaires on the
computer.
Makes sure patient filled outquestionnaire properly and
gives the patient the option toadd additional comments
about a particular symptom.
Takes vital signs andperforms perfunctory
physical exam accordingto fatigue/depression
coupler
The MAs enter data whiledoing standard proceduresto check their vital signs.
Patients do not have to waitwith nothing to do.
Patient satisfaction with thephysical received. Did they
do all of the necessaryprocedures?
Records the resultsfrom the physical into
the EMR
Coupler allows the MAs to knowwhat steps are necessary. No
steps are disregarded/forgotten.
Orient the patient to thePKC system before
meeting with theprovider. Checks the MAs work.
Allows the provider to askadditional questions and the
patient to give furtherexplanation.
The difference in time ittakes to record information
in the computer compared toregular paper charts.
Reviews what the MAhas entered into PKC
and EMR
Examine differentpossibilities for
diagnosis: rules outunlikely possibilities
Helps the provider to providethorough and complete
exam; no possibilities aremissed.
How many patients aremisdiagnosed?
Are steps redundantbetween the MA and the
physician?
Decides on diagnosisof hyperthyroidismbecause of bestpossible fit forsymptoms to
diagnosis
Print out resultsbefore going over theoptions, so there ismore focus on thepatient than the
computer.
Allows patients to have a copyof their medical records.
Patients can review the resultswith others and do not need to
remember details from theoffice visit.
The number of patients thatreview, use, or save the printedout records. The importance
patients put on receiving a copyof the records. How often the
patients request otherinformation. Does patient know
what other information isavailable using the PKC
system?
Prints out medicalrecord, results,
treatment options,and any other
requested informationfrom PKC
Collects co-payment
Eliminate "Depression"as the title for the PKC
questionnaire: substitutea more patient sensitive
header.
Ensure that all staff arefamiliar with the variety of
b. Chronic Care From the time care is sought to the time after the intervention when this cycle of care begins again. The steps include “closure” activities and all pertinent information feedback loops.
“Intervention” refers to the collection of interactions between and among health professionals, their services, and procedures and the patient and family.
In long term conditions we assume that the patient’s need is for:
Understanding and insight Periodic assessment Current and prospective management including identification of helpful resources Predictions where possible and desired Support for the patient and family for self-management strategy. The chronic care model predicts that
improvement in its 6 interrelated components – self-management support, clinical information systems, delivery system redesign, decision support, health care organization, and community resources can produce system reform in which informed, activated patients interact with prepared, proactive team. 7, 8
1. Create a flowchart of the CURRENT process 2. Brainstorm change ideas. Some ideas may be able to be immediately, other ideas require planned tests
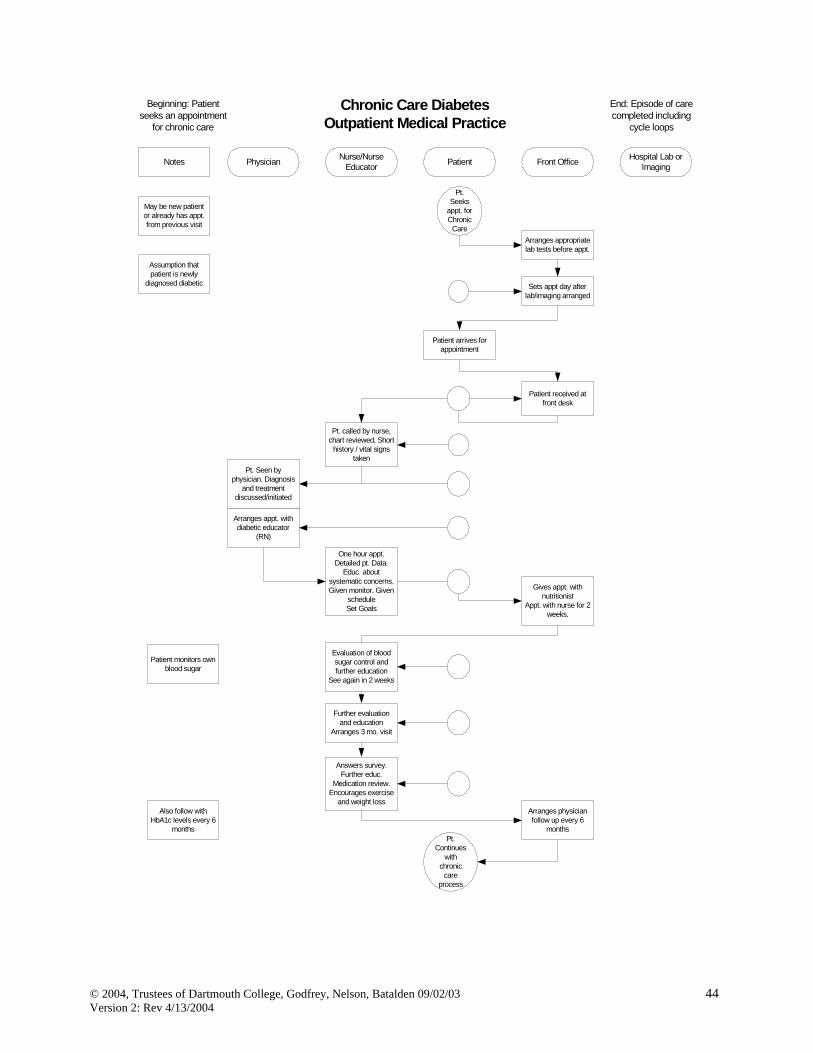
of change, PDSA (Plan-Do-Study-Act). 3. Select one test of change to implement 4. Develop the PDSA 5. Conduct the test 6. Revise/Implement the new process Example: This chronic care process for diabetes care is shown in this deployment style flowchart.
7 Bodenheimer T, Wagner E, Grumbach K. Improving Primary Care for Patients with Chronic Illness. JAMA, 288(14) 1775-1779, October 9, 2002. 8 See www.improvingchroniccare.org
Wagner EH. Quality improvement in chronic illness care: a collaborative approach. Jt Comm J Qual Improv. 2001. External Context Think about connections with other clinical microsystems when reviewing available resources to support long-term conditions. Chronic care resources exist beyond the four walls of a practice. Patient and family care and services can be supported with resources within the larger organization and community. The following example from the United Kingdom (UK) illustrates resources within the community, region and national programs that support patient care in a general practice.
General GP PracticeResources
Staff: GP, Nurse Practitioner, Practice Nurse, Phlebotomist, HCAServices: GMS/PMS, Minor Surgery, Alternative Therapies
Smoking Cessation Groups (PCT service)
Outreach Clinics (PCT contract with Acute sector)
Translators (PCT Service)
Community Staff:-District Nursing-Health Visitors-Midwives-Chiropody-Dietician-Health Care Assistants-Medical Equipment(PCT Service)
Health Promotion Service –Information & Training available (PCT Service)
Community Services:-Occupational Therapy-Physiotherapy(PCT contract with Acute Sector)
Phlebotomy Service(PCT Service)
Voluntary Groups:-Community Transport-Patient Advocacy(Practice own service)
Social Worker(Joint PCT and Social Services Initiative)
Counselling(Could be PCT service or practice own)
Community Mental Health (PCT contract with Acute sector)
Citizen’s Advice Bureau (CAB) (Could) either be a joint PCT and CAB initiative, or practice own)
Walk in Centre & Dental Access Centre (PCT Service)
Public Health profile of practice population (PCT Service)
NHS Direct (phone advice)
Out of hours service (PCT, Commercial or practice own)
These are examples of some of the resources that may be available to practices. Some are arranged by practices themselves, others are set up as PCT services to practice populations.
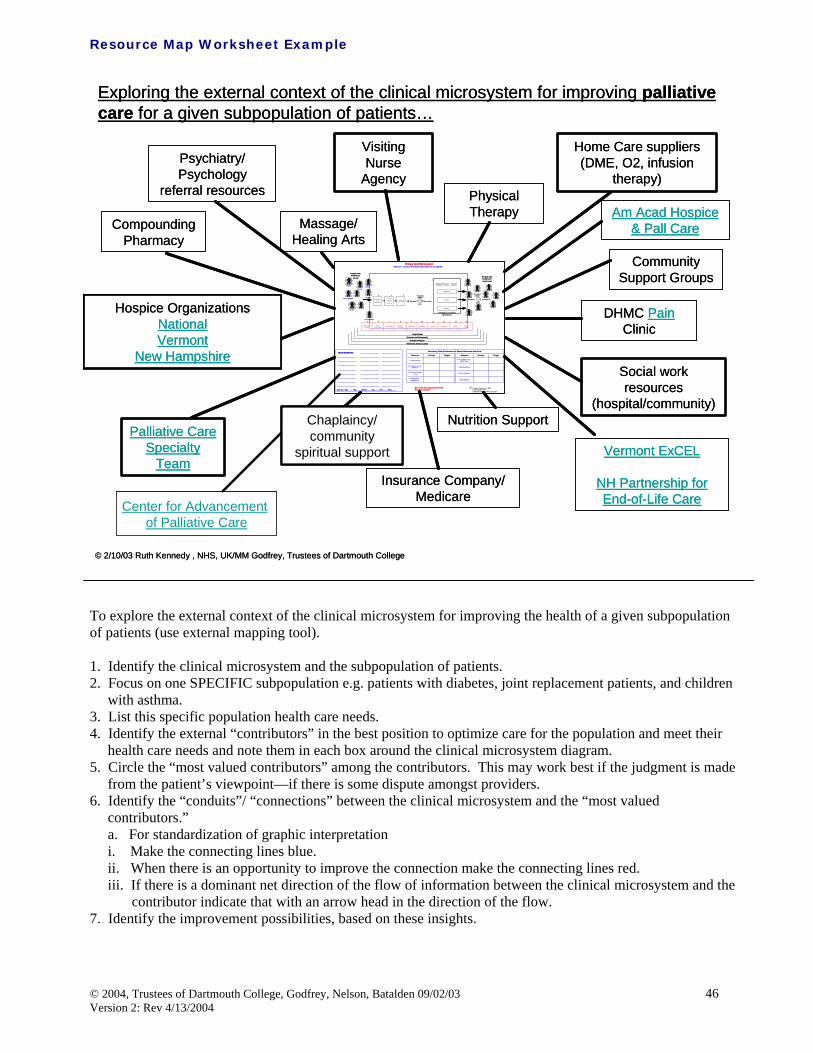
Resource Map Worksheet Example To explore the external context of the clinical microsystem for improving the health of a given subpopulation of patients (use external mapping tool). 1. Identify the clinical microsystem and the subpopulation of patients. 2. Focus on one SPECIFIC subpopulation e.g. patients with diabetes, joint replacement patients, and children
with asthma. 3. List this specific population health care needs. 4. Identify the external “contributors” in the best position to optimize care for the population and meet their
health care needs and note them in each box around the clinical microsystem diagram. 5. Circle the “most valued contributors” among the contributors. This may work best if the judgment is made
from the patient’s viewpoint—if there is some dispute amongst providers. 6. Identify the “conduits”/ “connections” between the clinical microsystem and the “most valued
contributors.” a. For standardization of graphic interpretation i. Make the connecting lines blue. ii. When there is an opportunity to improve the connection make the connecting lines red. iii. If there is a dominant net direction of the flow of information between the clinical microsystem and the
contributor indicate that with an arrow head in the direction of the flow. 7. Identify the improvement possibilities, based on these insights.
Exploring the external context of the clinical microsystem for improving palliative care for a given subpopulation of patients…
Physical Therapy
Visiting Nurse
Agency
Massage/ Healing Arts
Palliative Care Specialty
Team
Psychiatry/ Psychology
referral resources
Hospice OrganizationsNationalVermont
New Hampshire
Compounding Pharmacy
Nutrition Support
Insurance Company/ Medicare
Vermont ExCEL
NH Partnership for End-of-Life Care
Social work resources
(hospital/community)
DHMC PainClinic
Community Support Groups
Am Acad Hospice & Pall Care
Home Care suppliers (DME, O2, infusion
therapy)
Primary Care MicrosystemMission: To serve the health care needs of our pateints
V ery H igh Risk
Chronic
V ery H igh Risk
Healthy
Healthy
Healthy
Chronic
E nrollmentand
A ss ignment
Or ient toP ractice
andS ervices
A ssess &P lan C are
Functional& R isks
Biological
Costs
E xpectat ionsChronic
High Risk
Healthy
Preventive Acute Chronic
Functional& Risks
Biological
Cost s
S atisfact ion
People withhealthcare
needs People withhealthcareneeds met
P hone,Nurse First
P hysicalS pace
Info S ystem s& Data BillingReferralsP harmacyR adiologyLaboratoryMedical
When exploring the internal context of a clinical microsystem, consider the following areas: (draw a graphic) 1. “Way things work?” Consider the process, structures, patterns, habits. 2. Leadership? Consider what people point to as an example of “leadership.” 3. Champion? Consider who is really interested in this change. 4. Technical resources? Consider who might be the technical resources available to help with design and
measurement of change. 5. History of successful change? Consider examples that people point to with pride.
a. Cooperation? What helped get cooperation? b. Measurement/accountability/learning? What measures helped? How were they developed? How
were they displayed? Any unintended effects? 6. Commitments to “steadfastness?” What are people concerned about “holding fast?” 7. Stakeholders’ views of success? Of those various others who could put “change” out of business in this
situation, what are their views of success? (See blank worksheet on page 48)
Aim: Develop chronic care program rather than disease-specific series of programs through operationalizing the Chronic Care Model to activate patients, family and the practice team.
Objectives: 1. Characterize actual chronic disease patients by diagnoses, age, and sex. 2. Identify desired outcomes using the Clinical Value Compass Model 3. Identify basic current care process using process flow map 4. Design a prototype new chronic care process based on the Chronic Care Model 1. Based on the Assessing Your Practice Profile, focus on “Know Your Patients”
♦ Identify TOP chronic diseases, e.g. diabetes, coronary artery disease, COPD, asthma, arthritis, venous thrombosis
2. Prepare 50 medical records9 for typical patients with chronic disease who are under current treatment.
9 Nelson EC, Splaine M, Plume S, Batalden P, Good Measurement for Good Improvement Work, Quality Management in Health Care, 13(1), Jan-Mar 2004
Identify desired outcomes using the
Clinical Value Compass Model
Evaluate 50 medical records to track outcome
performance. E.g. for diabetes: HgA1c, eye exams,
Identify basic current care process using Process Flow
Map
Review Chronic Care Model and
care options
Design a prototype new chronic care process based on new knowledge
A helpful worksheet found in Assessing Your Practice workbook on pg A18 is this health outcome chart review form. In this example a primary care practice did a manual chart review to ascertain the current state of HgA1C in their practice
X = Patient Number
Primary Care: Disease Specific Health Outcomes Chart Review Form.Instructions:1. Use this form to graph values for Diabetic, Hypertensive or patients with Hyperlipidemia2. Use this form for EACH disease. You will have 3 completed graphs when finished3. Randomly select 50 patients from one of the above diseases4. Fill in the Values along the Y axis: Diabetes Value = HgA1c (range 5-30)
Hypertension Value = B/P (<140/85)Hyperlipidemia Value = LDL (<110 desirable, >130 is high)
5. Repeat the sampling process for the next 2 diseases
From the time an appointment is sought to the time when the “preventive intervention” is completed. Refers to the collection of interactions between and among health professionals—their services, products, and procedure and the patient and family.
Remember a chronic condition may be in the “background” while the need for anticipatory, preventive care might be in the foreground.
Preventive care includes:
Prevention or early recognition of potentially handicapping or limiting conditions.
Risk Reduction and amelioration
Age and risk-specific assessment
Age and risk-specific recommendations that individuals might undertake to regain and/or preserve their own or dependents health.
1. Create a flowchart of the CURRENT process 2. Brainstorm change ideas. Some ideas may be able to be implemented immediately, other ideas require
planned tests of change, PDSA (Plan-Do-Study-Act). 3. Select one test of change to implement 4. Develop the PDSA 5. Conduct the test 6. Revise/Implement the new process
Example #1 The annual exam displayed in this deployment flowchart is from a Family Practice
Example #2:
The Preventive Care Mammography is displayed for a radiology department. Notice quality characteristics and potential measures enrich the document.
(Special contribution Francis C. Brokaw, MD, Dartmouth-Hitchcock Medical Center) The World Health Organization defines palliative care as, “an approach which improves the quality of life of patients and their families facing life-threatening illness, through the prevention, assessment and treatment of pain and other physical, psychosocial and spiritual problems.”10
Palliative care
Provides relief from pain and other distressing symptoms;
Affirms life and regards dying as a normal process;
Intends neither to hasten nor postpone death;
Integrates the psychological and spiritual aspects of patient care;
Offers a support system to help patients live as actively as possible until death;
Offers a support system to help the family cope during the patient’s illness and in their own bereavement;
Uses a team approach to address the needs of patients and their families, including bereavement counseling, if indicated;
Will enhance quality of life, and may also positively influence the course of illness
Is applicable early in the course of illness, in conjunction with other therapies that are intended to prolong life, such as chemotherapy or radiation therapy, and includes those investigations needed to better understand and manage distressing clinical complications.
The palliative care approach is appropriate for any patient with advanced chronic disease or newly diagnosed potentially life-threatening illness. Palliative care can and should occur in concert with ongoing efforts at cure. The approach involves broad assessment, addressing relief of suffering as the primary goal, and centers care on the family and patient.
1. Create a flowchart of the CURRENT process 2. Brainstorm change ideas. Some ideas may be able to be immediately, other ideas require planned tests
of change, PDSA (Plan-Do-Study-Act). 3. Select one test of change to implement 4. Develop the PDSA 5. Conduct the test 6. Revise/Implement the new process Example: The following examples demonstrate process flow and a deployment flowchart for the Palliative Care Model.
10 World Health Organization definition of palliative care. http://www.who.int/hiv/topics/palliative/care/en/
Innovations in End-of-Life Care: an international journal of leaders in end-of-life care. http://www2.edc.org/lastacts/
EPERC: End of Life Palliative Education Resource Center. On-line collection of peer-reviewed resources. http://www.eperc.mcw.edu/
Edmonton Regional Palliative Care Program. Includes validated symptom assessment tools, palliative care guidelines, and latest journal information.
http://www.palliative.org/
Charting Your Course: a whole-person approach to living with cancer. Workshop series developed by DHMC-NCCC with a grant from Robert Wood Johnson Foundation to empower patients with advanced cancer and their families. Educational materials available on-line and may be adapted to a variety of settings (including non-cancer illnesses.)
http://www.growthhouse.org/dartmouth/
Inter-Institutional Collaborating Network On End Of Life Care (IICN): free registry for individuals allows access to over 70 email discussion lists, and searchable database of authoritative information from
“Patients as customers” refers to the individuals who are served (clinically) by the microsystem, from the time a patient “hooks up” with the microsystem to the time that the patient “exits” the microsystem.
Meeting the needs of patients (as customers) requires knowing the wants and needs - sentiments and beliefs and practices - of our patients better than they know them themselves. For specific sub-populations in the microsystem:
Study knowledge of patients as customers in the microsystem - expectations, needs, delights, disappoints
Explore the design and improvement of care-related processes in the microsystem for a specific subpopulation and ways to create a patient-centered culture
The patient’s need is for care and services and information based on knowledge of the individual patient as a customer. Tailored care, services, and information is based on a deep understanding of each patient’s expectations and needs, knowledge, attitudes, and practices.
Why explore knowledge of patients as customers? To achieve the core mission … “We exist to meet patient’s needs” Patients as customers: 6 Essential Principles 1) Provider organizations exist to meet (individual) patient’s needs 2) Know that you do not know (enough) about what patients need 3) Know that you need to know patients better they know themselves 4) Patients are constantly judging our performance 5) Our patients are the ultimate judges of our performance 6) Use “segmentation” of patients into smaller subpopulations to design services to better match needs
The Kano model which first appeared in Professor Noriaki Kano’s article “Must-be Quality and Attractive Quality” articulates the complexities of customer needs and satisfaction relationships.
The lower curve in Kano’s diagram are essentially basic functions in features that customers normally expect. They are usually unvoiced and invisible. However, they become visible when they are unfulfilled. The upper curve are the delight or “wow” functions in features. They are invisible to customers since customers do not even know to ask for them. They do not leave customers dissatisfied when left unfulfilled. Kano’s Take Home Message
3 different types of satisfaction – Delight – Expected – Must Have
Satisfaction is dynamic – Today’s exciting service – Tomorrow’s expected service – Next month’s must be service
Methods to gain customer information
Ways to build Customer Knowledge using staff eyes and ears
Listen/observe: “Anything bother you today?” Staff end-of-shift “session” to score care given and identify improvement opportunities Staff “tick mark” sheets: Number of people waiting more than ten minutes, number of people who want to
be seen sooner than scheduled Staff and leader visits to customers, families, and patients
Capture Compliments and Complaints
Comment cards for good and bad surprises Hot line phone or video booth Ombudsman or patient advocate Unsolicited letters from patients and families
Framework: Gaining & Using Customer Knowledge in Front Line Microsystems
Identify a subpopulation and a key service to meet needs Map service delivery process from patients’ view Gather qualitative data on patients’ view of quality (goodness & badness) for overall process and for each
step in the process Plan and test changes (PDSAs) Make this into a list of key quality characteristics (KQC’s) Attach patients’ KQC’s to each step in process Draft a patient viewpoint survey for this delivery process Divide survey into series of “mini surveys” (4-6 items) Work with practice staff (microsystem team) to fit survey into daily work flows Build instrument panel for this process and this subpopulation Plan & test changes (PDSAs) to see if instrument panel gages register desired changes
The first step to gain customer knowledge is to experience or see the patient health care journey as they they do. The Assessing Your Practice workbook13 has a one page guide “Through the Patient Eyes” (pg 23) that can help you begin to “see” from the patient perspective. Another observation tool is the Clinical Microsystem Observation worksheet (pg 64-65) . After you have created the flow from the OBSERVED patient experience, you can create an INTERVIEW process using the Clinical Microsystem Interview worksheet (pg 66-67). Tips for the interview process are embedded in the worksheet. Once you have completed the observation of what the patient experiences and have conducted interviews with patients, you can gain enough knowledge and insight to develop a survey to sample a larger number of patients. Interviews and Surveys
Group interview of patients or staff Individual interview of patients (or staff) Critical incidents reports by patients (or staff) Survey new patients, old patients, ex-patients Survey your competitor’s patients
Patient Viewpoint Survey
Use patient-based surveys to measure and improve the process and outcomes of care Written surveys Similar to personal interviews Aim in to gain knowledge, attitudes, practices, perceptions, ratings, or reports Common healthcare surveys • Satisfaction…perceptions of goodness of care experienced • Health status…ratings of reports on health condition • Preferences…questions to determine desires of patients or what they prefer or want
13 Assessing Your Practice, 2003, Trustees of Dartmouth College, Godfrey, Nelson, Batalden, Institute for Healthcare Improvement
Use simple English • Short sentences (< 20 words) • Simple sentence structure • Short words
Avoid double-barreled questions Avoid leading questions Clean layout of survey Use logical response choices that match question stem Always do small pretest to see how questions work with real people
Different Types of Survey Items
Ratings • Evaluative judgments of goodness or badness of the “thing” of interest • “Thinking about your own health care, how would you rate the following?” • Length of time spent waiting at the office to see the doctor?
Poor, Fair, Good, Very Good, Excellent • Thoroughness of treatment?
Poor, Fair, Good, Very Good, Excellent • Attention given to what you have to say?
Poor, Fair, Good, Very Good, Excellent • Overall quality of care and services?
Poor, Fair, Good, Very Good, Excellent Opinions • Statement of an opinion that respondent is asked to agree or disagree with • Likert-type items with 4 or 5 response choices • Strongly agree, agree, not sure, disagree, strongly disagree • The doctors truly cared about me as a person. • When I needed a nurse one was there for me. • My family or those close to me were not just visitors; the staff involved them in my care. • The different staff who provided my care in the hospital were well coordinated – • they knew what each other were doing and worked as a team. • The doctors and nurses included me as a full partner in discussing my condition and making decisions
about my treatment.
Reports • Declarative statements representing a person’s understanding of what happened • How long did you have to wait between the time you made the appointment for care and the day you
Same day, 2 days or 3 days, 4 to 7 days, 1 to 2 weeks, 3 to 4 weeks, 5 to 6 weeks, 7 to 8 weeks, more than 8 weeks
• When you go for medical care, how often do you see the same provider? Always, Most of the time, Sometimes, Rarely or Never
• Verbatims Open ended questions that ask the patient to comment on the “thing”
Set up to invite a candid response that reflects the patient’s experiences or viewpoint on topic of interest
What, if anything, could be done to improve care and services? Did anything happen during your visit that delighted you or gave you a good surprise? Why would you choose to return/not return to this doctor for care in the future?
Steps for Doing a Written Survey
1. Aim. What is aim and what is the key question(s) to answer? 2. Who. Determine who will be surveyed and how they will be invited to participate. Will IRB approval
be needed? Will survey be anonymous, confidential? Who will sponsor survey? 3. Data Collection. How will the survey be distributed and returned? Handout/hand back? Mail
out/mail back? Internet-based? 4. Layout. How will the survey be designed to be clean, attractive, inviting of participation, and easy to
analyze? 5. Analysis. How will you analyze the results to provide answers to your key question(s)? Always make
dummy data displays as part of your planning process! 6. Summarize. What does your analysis show? Reflect on your analysis and summarize the results.
Consider doing this by stating “major results” as “headlines” that are linked to graphical data displays or data tables.
Structure of a Written Survey
Introduction • Purpose of survey, uses, sponsor, confidential/anonymous
Opening question(s) Main body of question(s) Closing question(s) Thank you and how to return
Questionnaire: An Example
Surgery and First 24 hours after surgery Strongly
Agree Agree Neutral
No Opinion
Disagree StronglyAgree
DoesNot
Apply31. The Intensive Care Unit staff were sensitive to my needs and feelings.
1
2
3
4
5
N/A
32. I received satisfactory pain relief while in the Intensive Care Unit
1
2
3
4
5
N/A
33. I received adequate attention and comfort from the Intensive Care Unit staff when I felt disoriented after my surgery
1
2
3
4
5
N/A
34. I had no problems communicating with the Intensive Care Unit staff immediately after my surgery.
Ways to blend customer mindedness into the culture of clinical Microsystems
Mission, Vision, Principles (MVPs): Create patient-centered mission, vision, principles (say it, do it, live it)
Stories: Tell stories about extraordinary patient service include above and beyond stories Governance: Form customer council or put consumers in governance structure Education: Build patient-mindedness education and training into staff development and performance
evaluation processes Feedback: Build data walls and direct to staff feedback Reports: Provide patient feedback data and comments to staff and display in public place Ideal: Work with staff to “map” the ideal visit, attach patients KQCs (key quality characteristics) to steps
in the process flow Just-in-Time Reviews: Hold regular huddles/mini-meetings (daily, weekly, monthly) to do patient-
centered evaluation of performance and to identify improvements Rounds: Hold patient needs “rounds” she needed and we did provide and we would have provided in ideal
system Lunches: Hold “lunch and learn” facilitated discussions (e.g. use the Institute of Medicine new rules, use
Inside the Magic Kingdom leader’s tool kit) Put a customer on your team: Add a patient or consumer to every improvement team.
Beneficiary knowledge, including knowledge of life while not in direct contact with the health care system
Satisfaction of need, monitoring, assessment of outputs
A “Generic” Clinical Microsystem model
Acute care
Chronic care
Preventive care
Palliative care
How do microsystems use data to meet patient’s needs, to monitor performance, to improve care?
How can clinical microsystems use data for learning, managing patients, managing the clinical enterprise and for improving and innovating?
The purpose of gathering data is to transform it into information to guide intelligent action, think feed forward and feedback.
Creation of reflective clinical practice and of microsystems as a learning system requires the data-to-information transformation.
A rich information environment supports the functioning of the small, functional, frontline unit -- the microsystem -- that provides most health care to most people.
We believe clinicians need timely, relevant, and accurate data to:
attain the best outcomes both for individual patients and for distinct subpopulations under their care -manage their medical practices in a way that will generate efficient care and services that satisfy patients,
conserve costs, produce positive margins, and generate new knowledge -create a working environment in which staff have pride and joy in work and are constantly learning based
on reflective practice and improvement research.
Four good reasons to build measures into daily medical practice:
1. diagnose strengths and weaknesses in practice performance 2. improve and innovate in providing care and services using improvement research 3. manage patients and practice 4. evaluate changes in results over time
An example of a series of trend charts displaying key values for an internal medicine department follows:
14 Nelson EC, Splaine ME, Godfrey MM, Kahn V, et al. Using data to improve medical practices by measuring processes and outcomes. Joint Commission Journal on Quality Improvement. 2000 26(12), pg.667-686.
This does not just happen, but it can be designed and improved over time. It can be engineered in order to support the organization's ability to deliver high-quality services to patients at the level of activity within microsystems.
The path to the creation of a rich information environment can be made smoother and easier (though still not easy) by applying some useful frameworks:
Feed forward and feedback Patient Value Compass Balanced Scorecard
Feed forward and feedback - use data to do the right thing right the first time every time.
Spine Center Process
Feed Forward
SharedDecisionMaking
InterdisciplinaryPatient
Assessment
Sub AcuteCare
Management
FunctionalRestoration
Program
PreventativeCare
Management
Disenrollment
OrientationEnrollmentAssignment
People withhealth care
needs
People withhealthcareneeds met
Feed Back
FunctionalHealth Status
BiologicalStatus
Costs
Expectations
NationalSpine
NetworkSurvey
NationalSpine
NetworkSurvey
FunctionalHealth Status
Biolog icalStatus
Satisfactionagainst
Need
Costs
D:/MyDo cs/Ge n e Ne lso n /Pa p e r s/Sp in e Ce n t e r P ro ce ss080202
PalliativeCare
This diagram portrays the idea of building an information environment that uses both feed forward and feed back data to manage and improve care. The general idea behind feed forward is to collect data at an earlier step in the process of delivering care and to save it and use it again at a later step in the process.
The general idea behind feed back is to gather data about what happened to a patient, or a set of patients, and to use this information to improve care so that future patients will get the right thing, in the right way.
Developed by Kaplan and Norton, the Balance Scorecard uses data to measure and improve the performance of the microsystem. It can be used to answer the question: IS the microsystem making progress in areas that contribute to operating excellence and strategic progress? The unit of analysis is the organization or a smaller unit within the organization. The balanced scorecard can work at the level of the clinical microsystem or the macro-organization. The balanced scorecard was designed to provide a well-rounded view for specifying and assessing an organization's strategic growth, core processes, customer viewpoint, and financial results. Balanced scorecards offer a simple yet elegant way to link strategy and vision with
objectives for strategic progress measures of objective target values for measures initiatives to improve and innovate
Other positive features of the balanced scorecard framework are the capacity to
align different parts of a system toward common goals deploy high-level themes to ground-level operating units that directly serve the customer establish a succinct method to communicate results and provide a system for holding operating units
accountable for generating essential results.
Innovation & LearningAim: To create a stimulating and enriching research
setting and education of staff.
Measure:
Action plan: Grant writing in progress.
FinancialAim: To be a fiscally solvent specialty clinic.
Measure:
Action plan: No current plan.
Spine Center’s ScorecardKey Processes
Aim: To do the right things at the right time for the patients.Measure: Shared decision making (SDM): Diagnosis
specific patients checked out either theHerniated Disc or Spinal Stenosis video.
Access: Preferred appointment met forpatients seeing a surgeon for the first time.
Action plan: SDM: No current plan to improve the process.Access: Scheduling/Access workgroup formed in January 2002.
Satisfaction versus NeedAim: To meet the expectations of our patients.
Measure:
Action plan: No current plan.
0246
8
1012
14
2000 2001 target
Grants (awardedand in progress)Publications
0%
20%
40%
60%
80%
100%
2000 2001 target
SDMAccess
0
20
40
60
80
100
2000 2001 2000 2001
Health Benefit
OverallSatisfac tion
DHMC Spine Center
NA
$0
$1,000
$2,000
$3,000
$4,000
$5,000
$6,000
2000 2001
Back and NeckProceduresSpinal Fusion
Median Margin Surgical Procedures DHMC Utilization of Clinic Time
See Microsystems in Healthcare: Part 2. Creating a Rich Information Environment for more information. 15 Information and information technology are a feeder system to support all four key success themes-leadership, staff, patients, and performance. Information exchange is the interface that connects:
Staff to patients and staff to staff within the microsystem Microsystem to microsystem Microsystem to macro-organization.
Principles for using data16
1. Keep measurement simple: Think big and start small 2. More data is not necessarily better data: Seek usefulness, not
perfection in your measures 3. Write down the operational definitions of measures 4. Use a balanced set of input, process, outcome, and cost measures 5. Build measurement into daily work and job descriptions 6. Use qualitative and quantitative data 7. Use available data if possible; otherwise, measure small,
representative samples 8. Display key measures for use by the microsystem that
demonstrate trends over time Data walls are a mix of system and microsystem measures, they are a visual way to bring measures and data about the clinical microsystem into the workplace. “Data walls report performance measures, monitor progress for clinical teams and identify improvement ideas and actions.”17
Using data in your clinical microsystem for measuring and monitoring performance and putting it the foreground of your work. If you don’t measure it, it is hard to manage it and to improve it.
9. Develop a measurement team and establish ownership Microsystem Questions to Seek Answers To The following are questions a practice microsystem can consider in beginning to collect data and finding variation and improvement opportunities.
How many people are assigned to my panel after adjusting for age and sex differences? How many hours are our providers available for direct patient care in the clinic? How many hours does our team book patients per week? What percent of my booked time is comprised of unarrived hours? What percent of my patients see me?
How many encounters do my panelized patients average per year? How many encounters does our team see per available hour? How many encounters does our team see per month? What is my total PMPM? What is my external PMPM? How satisfied are my patients overall? How satisfied are my patients with accessing the office? How satisfied are our patients? How many patients did we schedule to see today?
15 Nelson EC, Batalden PB, Huber TP et al: Data and Measurement in Clinical Microsystems: Part 2. Creating a Rich Information Environment. Joint Commission Journal on Quality and Safety, 29(1) 5-15, January 2003. 16 Nelson EC, Splaine ME, Godfrey MM, Kahn V, et al. Using data to improve medical practices by measuring processes and outcomes. Joint Commission Journal on Quality Improvement. 2000 26(12), pg.667-686. 17 Godfrey MM, Nelson EC, Wasson JH et al: Planned Services in Microsystems: Part 3. Designing Efficient Services to Meet Patients' Needs. Joint Commission Journal on Quality and Safety, 29(4), 159-171. April 2003.
Must Do 1. A clinical system must provide quality and value to individual patients and subpopulations of patients
How many patients did we actually see today? How many patients avoided coming in for an appointment because of the use of protocols? How many same-day appointments are available at the start of the day?
Is our team utilizing our CIS (electronic record) system? What percent of our patients’ ER visits were inappropriate? What percent of the inappropriate ER visits were seen during clinic hours? Satisfaction measures ♦ Hold time ♦ Courtesy/Helpfulness ♦ Wait for an appointment ♦ Ease and convenience ♦ Time spent with provider
How many requested physicals actually need to be done now? How can we redistribute appointment times and improve pre-work to reduce physical appointment time?
Instrument Panel and Compasses
Assumptions:
Health care system MUST
Do the job/meet needs of patients for quality and value
Sustain/grow the system/Positive boundary relationships, secure inputs, recognition of contribution to macro-organization
Clinical Value Compass/Patient Value Compass This can be used to determine whether the microsystem is providing care and services that meet patients' needs for high quality and high value. The Patient Value Compass was designed to provide a balanced view of outcomes-health status, patient satisfaction, and patient care costs- for an individual patient of for a defined population of patients. 18
Results of the interaction between patient, staff, clinical and support processes produce patterns of critical results – biological outcomes, functional status and risk outcomes, patient perceptions of goodness of care, and cost outcomes that combine to represent the value of care.
18 Nelson EC, Batalden PB, Huber TP et al: Data and Measurement in Clinical Microsystems: Part 2. Creating a Rich Information Environment. Joint Commission Journal on Quality and Safety, 29(1) 5-15, January 2003.
The clinical value compass presents a balanced approach to measure and display value in health care. It is a measurement design for identifying and monitoring those key indicators of care that enable one to assess the quality of health care. The compass provides a framework for measuring changes in four major categories of health care value.
1. Biological status - What are the biological outcomes?
2. Functional status - What are the functional and risk status outcomes?
3. Patient expectations and satisfaction- How do patients view the goodness of their care?
4. Costs - What resources and costs are used to provide care?
While defining the broad categories of measures, the clinical value compass leaves decisions within various practice environments as to what specific measures are to be used for each indicator and each population.
Use clinical value compass to see if the system is doing the job.
Is the system providing care and services that meets patients’ needs for high quality and value care? Clinical Value Compass thinking helps you to see what process and outcomes you are working on. Value compass can be adapted to any clinical setting Use the Clinical Improvement Worksheet to adapt to your setting.
Clinical Value Compass Example
Functional Health Status•Baseline Questionnaire
Satisfaction Against Need•Physician (Provider)•Nurse Visit•Process of Care
Balanced Scorecard Use balanced scorecard or strategic performance compass to see if system is meeting members’ needs.
19 Balanced scorecard or strategic performance compass is a way to link strategy and vision wit objectives for strategic progress, measures of objective, target values for measures, initiatives to improve and innovate.
4 Points of Success
1) Strategic learning and innovation To achieve our vision, how will we sustain our ability to change and improve as fast as times require?
2) Key processes To satisfy customers, what key processes must we perfect?
3) Customers’ view of goodness To achieve our vision, how should we appear to our customers?
4) Financial results To succeed financially, how should we appear to our shareholders/board?
Questions to ask
Are we learning and innovating in business critical areas?
How are key processes performing?
How do we look in the eyes of our customers?
How are we doing at managing costs and making margins?
19 Kaplan R and Norton D. Translating Strategy into Action: The Balanced Scorecard. Boston, MA: Harvard Business School Press, 1996.
Instrument Panel for: ________________________________ Last Update: ________________Section: __________________________
Start downstream and swim upstream with your measures
Goal is to embed measurement in daily work. Real time measurement for good care.
When improving a “bad” outcome, work upstream to clarify process and identify an upstream measure that can in theory be used to control or tune process
Build into job description of relevant staff person
Teach staff person how to gather data easily
Teach staff person how to display visually
Teach staff what to do to manage process
Test cause and effect linkages
Principles for good measurement for good health care
Use a balanced set of measures
Keep measurement simple. Think big, start small
More data is not better data. Seek USEFULNESS, not perfection, in your measures
Design instrument panels to guide intelligent action
Use quantitative and qualitative data
Use AVAILABLE data if possible-otherwise measure small, representative samples
Use upstream and downstream indicators (process and outcome)
Collect data at smallest replicable unit level and aggregate up
Build measurement into flow of daily work and job descriptions
Display key measures showing trends over time
Develop a measurement team and establish ownership
When clinical microsystems work with other systems, they work at their own boundary and at the boundaries of the other systems. Interactions at the boundaries are common in open adaptive systems. Increasing self-awareness of being a functioning systematic unit, the clinical microsystem becomes curious and is encouraged to understand usual, natural boundaries that form its identity. When clinical work crosses the borders of one clinical microsystem and enters another, it is common to see “normative” interactions arising from professionally established or culturally defined practices, explicitly defined work processes or recurring patterns of behavior. These interactions may involve moving the patient and information from one clinical microsystem to another.
Microsystem to Microsystem Microsystem to Macrosystem
Luther Midlefort - Mayo Health SystemBehavioral Health Clinical Microsystem
Mission: Luther Midlefort is dedicated to promoting the health and meeting the healthcare needs of our patients.
The clinical microsystem is part of multiple systems of care delivery
The Systems of Health Care
Community, Market,
Social Policy System
Macro-organization
System
MicrosystemIndividual care-giver & patient System
Self-care
System
The emergency department (ED) flow of patient care shows the interaction with the Radiology Department. This example demonstrates how one microsystem is connected through patient care to another microsystem. The process of patient care that crosses the clinical microsystem boundary offers an excellent opportunity for study and improvement. How do patient and information “hand off” occur? Does each microsystem have relationships with other Microsystems to articulate needed information and flow to ensure smooth transfer of patients and knowledge?
ED Microsystem
Radiology Microsystem
Patient
enters ED Assessment Patient needsx-ray
Transported toradiology X-ray performed
Patient transported back to ED Assessment Plan of Care Treatment Education
Identify a patient care process that crosses into other clinical microsystem boundaries. Flowchart the process with members of the other clinical microsystem to identify possible areas of study and improvement.
Example
Facilitators and Enhancements of Clinical Microsystem Interactions
Standardizing the content of the information that moves across the boundaries of the clinical microsystem. Example: Care Path Flow Sheets
High level of self-awareness which then leverages interactions with other clinical microsystems through knowledge of aim of the clinical microsystem, processes, beneficiaries and outcomes.
Inhibitors of Clinical Microsystem Interactions
Human Resource policy which chooses to remain “blind” to the reality that individual members of the microsystem must work effectively with each other. Efforts to single out a subset of the system usually backfires.
1 sister (Mary)of 4 siblings
match
7/4: Ken callsPCP to report
findings
PCP sees Kenand Paigesame day
PCP Refers toDHMC
HematologyDepartment
MD on-call seesKen, orders
labs
Ken: Startsown Medical
Record
Admit to DHMCfor aplastic
anemia cx byautoimmune
disease
Inpatient Care:Daily labs +
transfusion +Dr. Pam Ely
(hematologist)
Discharged tohome
Outpatient dailylabs and
transfusionsprn
Re-admittedto DHMC prn
Siblings testedfor bone marrow:
Hartford,San Francisco,
DHMC
Ken: Search for"best place,
best outcomesin world"
Ken: Select FredHutchinson
Cancer ResearchCenter
Ken and Paigefly to Seattle
8/24: Admit toFred
HutchinsonCancer
ResearchCenter
9/3:Chemotherapy atFred HutchinsonCancer Research
Center
9/10: Procedurein Bone MarrowTransplant Unit
9/12: Ken's40th Birthday
Follow up care inPaul Gross
Housing unit for100 days
Discharged10 days earlyto Home and
DHMC
A useful method to evaluate and take action to improve microsystem relationships is the Star Generative Relationship process.20
20 Zimmerman B and Hayday B. “Generative Relationships,” in Voices in the Field. In process. Please see http://www.change-ability.ca/Exploring_Generative_Relationships.html for further readings.
Star Generative Relationships21 Generative relationships “occur when interactions among parts of a complex system produce valuable, new and unpredictable capabilities that are not inherent in any of the parts acting alone”22. Two key components to this definition:
The relationship produces something which one of the members of the relationship could not have produced alone.
The source of value (new product or service) was created by the interaction between the parties. Key Point: Generative Relationships in complex systems hold the greatest potential for creativity and innovation
In zone of complexity - no clear path Need to generate ideas and actions where no precedents exist Generative relationships are not just productive What makes a relationship “generative?”
Using this model we can explore relationships between Microsystems based on STAR.
S - Separateness or Differences to allow for “facts” to be seen as “interpretations” T - Tuning - talking and listening opportunities to challenge status quo and implicit assumptions - +ve
affect and precision A - Action opportunities - Permission or potential to act or create something new R - Reason to work together - Mutual Benefits
21 Zimmerman B and Hayday B. “Generative Relationships,” in Voices in the Field. In process. Please see http://www.change-ability.ca/Exploring_Generative_Relationships.html for further readings. 22 Lane, David and Robert Maxfield, “Strategy Under Complexity: Fostering Generative Relationships”, Long Range Planning, Vol. 29, No. 2, pp. 215-231, 1996
The STAR mapping worksheet is a useful tool to begin exploring relationships across boundaries. It often is useful for a microsystem to consider another microsystem in the patient care journey and then complete the worksheet. Often many opportunities are identified to improve working relationships at the boundaries based on improved tuning and intentional action together to improve patient care.
IX. Safety: Mindfulness for increased reliability and safety
(Special Contribution Julie Mohr, MPH, PhD and Paul Barach, MD) Designing Patient Safety into the Microsystem Safety is a property of the microsystem. It can only be achieved through thoughtful and systematic application of a broad array of process, equipment, organization, supervision, training, simulation, and teamwork changes. Characteristics of high performing microsystems – leadership, organizational support, staff focus, education and training, interdependence, patient focus, community and market focus, performance results, process improvement, and information and information technology – can be linked to specific design concepts and actions to enhance patient safety in microsystems. Background The IOM report “To err is human: building a safer health system”23 estimated that 44,000–98,000 people die each year die from medical errors.1 Even the lower estimate is higher than the annual mortality from motor vehicle accidents (43,458), breast cancer (42,297), or AIDS (16,516), thus making medical errors the eighth leading cause of death in the United States. Evidence suggests that medical errors may result more frequently from the organization of healthcare delivery. For example, Leape and colleagues discovered that failures at the system level were the real culprits in over 75% of adverse drug events. James Reason suggested that some systems are more vulnerable and therefore more likely to experience adverse events. There are certain organizational pathologies that can contribute to what Reason refers to as “vulnerable system syndrome”—blaming front line individuals, denying the existence of systemic weaknesses, and the blind pursuit of the wrong type of performance measures (for example, pursuing financial and production indicators instead of the balanced set of measures espoused by the clinical value compass). The recommendations contained in the IOM report emerged from a four-tiered strategy:
1. Establish a national focus on patient safety by creating a center for patient safety within the Agency for Healthcare Research and Quality (AHRQ).
2. Identify and learn from errors by establishing nationwide mandatory and voluntary reporting systems.
3. Raise standards and expectations for improvement in safety through the actions of oversight organizations, group purchasers, and professional groups.
4. Create safety systems inside healthcare organizations through the implementation of safe practices at the delivery level.
Research in managing safety has focused on the culture and structure of the organization. Perrow advanced the theory that accidents are inevitable in complex, tightly coupled systems such as chemical plants and nuclear power plants. These accidents occur irrespective of the skill of the designers and operators; hence they are “normal” and are difficult to prevent. He further argues that, as systems get more complex, the system becomes opaque to its users and therefore people forget to be afraid of potential adverse occurrences. Organizational models view human error more as a consequence than a cause, and stress the need for proactive measures of “safety and health” with constant reform of the systems processes. Finally, organizational flexibility means possessing a culture capable of adapting to changing demands. High reliability organizations (HROs) are an example of highly complex technology sensitive organizations that must operate to a failure free standard. Examples include naval aircraft carriers and air traffic control. These organizations carry out demanding activities with a very low error rate and an almost complete absence of catastrophic failure over many years.
23 Institute of Medicine. To err is human - building a safer health system. Washington: National Academy Press; 1999.
The Link Between Safety and the Microsystem Initiating the improvement of the safety of care for patients and populations in clinical microsystems involves increasing the work unit’s “awareness” of its functioning as a microsystem and a “mindfulness” of its reliability. We usually think of awareness and mindfulness as things to which individuals aspire. These reflective states are an invitation to consider the clinical microsystem to be composed of individuals who function together as systems, capable of reflecting on their work. Awareness of one’s own work unit as a system is a matter of identity and is connected to purpose. Learning to increase the safety and reliability of organizations can be addressed in many ways. Weick and Sutcliffe offer the idea that HROs have become so by their “mindfulness.” By mindfulness they mean that these organizations are: • Preoccupied with failure: they “treat any lapse as a symptom that something is wrong with the system, something that could have severe consequences if separate small errors happen to coincide at one awful moment.” • Reluctant to simplify interpretations: they “take deliberate steps to create more complete and nuanced pictures. They simplify less and see more. Knowing that the world they face is complex, unstable, unknowable, and unpredictable, they position themselves to see as much as possible.” • Sensitive to operations: they recognize that “unexpected events usually originate in what James Reason called “latent failures”. These “loopholes in the system’s defenses, barriers and safeguards . . . consist of imperfections in . . . supervision, reporting of defects, engineered safety procedures, safety training, briefings, certification, and hazard identification. Normal operations may reveal these lessons, but [they] are visible only if they are attentive to the front line, where the real work gets done.” • Committed to resilience: they “develop capabilities to detect, contain, and bounce back from those inevitable errors that are part of an indeterminate world . . .. [they are not error free, but errors don’t disable them] . . . it is a combination of keeping errors small and of improvising workarounds that keep the system functioning.” • Deferent to expertise: they encourage decisions to be made at the front line and migrate authority to the people with the most expertise, regardless of rank. According to Weick and Sutcliffe, becoming more mindful means practicing more of these behaviors. Mindfulness implies “a radical presentness” and a connection to the actual requirements of the current situation along with a chronic sense of unease that something catastrophic might occur at any moment. This sense is inculcated to all members of the unit, from the leaders to the most junior people on the team. The relationship between mindfulness and the microsystem requires further clarification. The focus on microsystems invokes consideration of team performance and the relationship of individuals within teams. The idea of high reliability organizations suggests that team and individual performance depends on the development of certain organizational norms. Such cultural attributes are commonly seen as properties of larger systems than teams. Is it possible for mindful microsystems to exist in dysfunctional organizations? In considering this possible relationship between a “mindful” microsystem and a dysfunctional organization, it is important to recognize the importance of the larger system to the success or failure of the microsystem, as reported by an interviewee at a geriatric unit when asked about how the larger system has supported the efforts of the microsystem: “The administration has continued to support the geriatric unit by providing both staffing and general resources. Getting a ‘yes’ for a request from the administration depends on how they feel about you and your department. On the converse, rarely do units exist in a vacuum. So, where there is a larger structure, there are always potential negatives.”
Furthermore, a focus at the microsystem level changes the role of senior leadership—indeed, this is not a minor detail. The Health Care Advisory Board reported that a common ingredient in successful organizations is a “tight, loose, tight” deployment strategy. What might this mean for creating a microsystem striving to provide safer care? It would mean that senior leaders would mandate that each microsystem should have a “tight” alignment of its mission, vision, and strategies with the organization’s mission, vision, and strategies. But it would also mean that senior leadership gives each microsystem the flexibility needed to achieve its mission. Finally, it would mean that senior leaders hold the microsystems accountable to achieve its strategic mission to provide safer care. (See pg. 93-94 for Mindfulness Surveys) Microsystem Patient Safety Scenario (pg. 95) Figure 1 illustrates a hypothetical scenario that we have used (JM and PB) to connect patient safety principles with clinical microsystem thinking. In this scenario the patient is Allison, a 5-year-old pre-schooler, with a history of “wheezy bronchitis”. As we follow the scenario, it is clear that Allison and her mother interact with several microsystems as they navigate the health care system in an attempt to address Allison’s illness. There is the hypothetical community-based pediatric clinic (Mercy Acute Care Clinic) and the University Hospital which includes several overlapping microsystems. While working through the scenario, the reader will find illustrated many obvious points where the system “failed”. How can we think about these system failures? Many tools are available for analyzing medical errors, such as crew resource management, morbidity and mortality conferences, root cause analysis, and failure mode effects analysis. While it is tempting to rely on one or two tools in an attempt to simplify the complexity involved in understanding errors and patient harm, the challenge for most of us -- before we start the search for the root cause -- is to start with a broader look that will help us place the error in context. One method that we have found to be useful builds on William Haddon’s overarching framework on injury epidemiology. As the first Director of the National Highway Safety Bureau (1966-1969), Haddon was interested in the broad issues of injury that result from the transfer of energy in such ways that inanimate or animate objects are damaged. According to Haddon, there are several strategies for reducing losses. First, prevent the marshalling of the energy; second, reduce the amount of energy marshaled; third, prevent the release of the energy; fourth, modify the rate or spatial distribution of release of the energy, fifth; separate in time and space the energy being released and the susceptible structure; sixth, use a physical barrier to separate the energy and the susceptible structure; seventh, modify the contact surface or structure which people can come in contact; eighth, strengthen the structure that might be damaged by the energy transfer; ninth, when injury does occur, rapidly detect it and counter its continuation and extension; tenth, when injury does occur, take all necessary reparative and rehabilitative steps. All these strategies have a logical sequence that is related to pre-injury, injury, and post injury. The Haddon Matrix is a 3 x 3 matrix with factors related to an auto injury (human, vehicle, and environment) heading the columns and phases of the event (pre-injury, injury, and post-injury) heading the rows. Figure 2 (pg. 96) shows the Haddon Matrix that has been completed to analyze an auto accident.24 The use of the matrix focuses the analysis on the interrelationship between the factors (in this matrix version the human, vehicle, and environment) and the three phases (pre-event, event, and post-event). A mix of countermeasures derived from Haddon’s strategies outlined above, are necessary to minimize loss. Furthermore, the countermeasures can be designed for each phase – pre-event, event, and post-event. This approach confirms what we know about adverse events in complex environments – it takes a variety of strategies to prevent and/or mitigate harm. Understanding injury in its larger context helps us recognize the basic “unsafety” of systems and the important work of humans to mitigate the inherent hazards.
24 Haddon WJ. A Logical Framework for Categorizing Highway Safety Phenomena and Activity. J. Trauma. 1972;12(197).
Building on injury epidemiology, we can also use the Haddon matrix to think about analyzing patient safety scenarios. To translate this tool from injury epidemiology to patient safety, we have revised the matrix to include phases labeled “pre-event, event, and post-event” instead of “pre-injury, injury, and post-injury”. We have revised the factors to include “patient/family, healthcare professional, system and environment” instead of “human, vehicle, and environment”. Note that we have added “system” to refer to the processes and systems that are in place for the microsystem. “Environment” refers to the context that the microsystem exists within. The addition of system recognizes the significant contribution that systems make toward harm and error in the microsystem. Figure 3 shows a completed matrix using Allison’s scenario. The next step in learning from errors and adverse events is to develop countermeasures to address the issues in each cell of the matrix.
Survey: Beginning to Understand Your Microsystem’s Mindfulness
How well does each of the following statements characterize your microsystem?
Next to each item below, enter the number that corresponds to your conclusion: 1 = Not at all 2 = To some extent 3 = A great deal.
1. There is a microsystem-wide sense of susceptibility to the unexpected.
2. Everyone feels accountable for reliability. 3. Leaders pay as much attention to managing the unexpected events
as they do to achieving formal microsystem goals. 4. People at all levels of our microsystem value quality. 5. We spend time identifying how our activities could potentially
harm our microsystem, employees, our customers, other interested parties, and the environment at large.
6. We pay attention to when and why our employees, our customers,
or other interested parties might feel peeved or disenfranchised from our microsystem.
7. There is widespread agreement among the microsystem’s
members on what we don’t want to go wrong. 8. There is widespread agreement among the microsystem’s
members about how things could go wrong. Scoring: Add the numbers. If you score higher than sixteen, the mindful infrastructure in your microsystem is exemplary. If you score between ten and sixteen, your microsystem is on its way to building a mindful infrastructure. Scores lower than ten suggest that you should be actively considering how you can immediately improve your microsystem’s capacity for mindfulness.
Survey: Assessing Your Microsystem’s Vulnerability to Mindlessness
How well does each of the following statements characterize your microsystem?
Next to each item below, enter the number that corresponds to your conclusion: 1 = Not at all 2 = To some extent 3 = A great deal. 1. During a normal week, exceptions rarely arise in our work. 2. The situations, problems, or issues we encounter are similar from day to day. 3. People in this microsystem have trouble getting all the information they need to
do their work. 4. People are expected to perform their jobs in a particular way without deviations. 5. People often work under severe production pressures (i.e. time, costs, growth, or
profits). 6. Pressures often lead people to cut corners. 7. There are incentives in the work environment to hide mistakes. 8. People have little discretion to take actions to resolve unexpected problems as
they arise. 9. Many people lack the skills and expertise they need to act on the unexpected
problems that arise. 10. People rarely speak up to test assumptions about issues under discussion. 11. If you make a mistake, it is often held against you. 12. .It is difficult to ask others for help.
Scoring: Add the numbers. If you score higher than twenty-four, the current potential for mindlessness is high and you should be actively considering how you can immediately improve the capability for mindfulness. If you score between fourteen and twenty-four, the potential for mindlessness is moderate. Scores lower than fourteen suggest a strong capacity for mindfulness.
Based on the authors experience with multiple microsystems across diverse settings and with the authors understanding and interpretation of the safety literature, we offer several safety principles that can be used as a framework for embedding patient safety concepts within clinical microsystems. Principle 1 – Errors are human nature and will happen because humans are not infallible. Errors are not synonymous with negligence. Medicine’s ethos of infallibility leads wrongly to a culture that sees mistakes as an individual problem or weakness and remedies them with blame and punishment instead of looking for the multiple contributing factors which can only be solved by improving systems. Principle 2 – The microsystem is the unit of analysis and training. We can train microsystem staff to include safety principles in their daily work through rehearsing scenarios, simulation, and role playing. The goal is for the microsystem to behave like a robust high reliability organization (HRO), which is defined as an organization that is preoccupied with the possibility for failure or chronic unease about safety breaches.25
Principle 3 – Design systems to identify, prevent, absorb, and mitigate errors. Identify errors by establishing effective sustainable reporting systems that encourage and support transparency, freedom from punitive actions, and empower workers to feel comfortable to speak up, even if speaking up means that they will challenge the authority gradient. Design work, technology and work practices to uncover, mitigate or attenuate the consequence of error. There are many ways to reduce the impact of errors by simplifying the systems and processes people use. For example, tools such as checklists, flow sheets, and ticklers to reduce reliance on memory all address deficiencies in vigilance and memory. Improve access to information and information technology. Systems must be designed to absorb a certain amount of error without harm to patients. Key buffers might include time lapses (built in delays to verify information before proceeding), redundancy, force functions, etc. Principle 4 – Create a culture of safety. A safety culture is one that recognizes that the cornerstone to making healthcare safer is a transparent climate that supports reporting errors, near misses, and adverse events and to recognize these events as opportunities for learning and improving. Embrace and celebrate storytelling by patients and clinicians—that is where safety is made and breached and much learning occurs. Principle 5 – Talk to and listen to patients. Patients have much to say about safety. When a patient is harmed by healthcare, all details of the event pertaining to the patient should be disclosed to the patient and/or their family. Elements of disclosure include: A prompt and compassionate explanation of what is understood about what happened and the probable effects Assurance that a full analysis will take place to reduce the likelihood of a similar event happening to another patient Follow-up based on the analysis An apology Principle 6 – Integrate practices from human factors engineering into microsystem functioning. Design patient-centered healthcare environments that are based on human factors principles—design for human cognitive failings and the impact of performance shaping factors such as fatigue, poor lighting, noisy settings etc.
25 Dekker S. The Field Guide to Human Error Investigations. Aldershot: Ashgate Publishing Limited; 2002.
Conclusion Our discussion of patient safety within clinical microsystems would not be complete without acknowledging how characteristics of high performing microsystems could be used to help shape a microsystem’s response to the challenge to embed safety into the daily work of caring for patients. Page 101 lists several characteristics of high performing microsytems – leadership, organizational support, staff focus, education and training, interdependence, patient focus, community and market focus, performance results, process improvement, and information and information technology – and provides some specific actions that can be further explored in your microsystem. The list of actions is not intended to be exhaustive, but a place to start and an organizing framework for applying patient safety concepts to the microsystem. As the Pain Free Program illustrates, safety is a dynamic property of the microsystem. It can only be achieved through thoughtful and systematic application of a broad array of process, equipment, organization, supervision, training, simulation, and teamwork changes.
Build safety concepts into information flow (e.g., checklists, reminder systems, etc.)
Biography
Julie J. Mohr, MSPH, PhD is an Assistant Professor in the Department of Medicine at the University of Chicago. Dr. Mohr's research uses qualitative methodologies to study how to form, operate, and improve clinical microsystems. She also uses qualitative methodologies including observations, focus groups, and interviews to study how teams function. Prior to accepting her current position at the University of Chicago, Dr. Mohr was an Assistant Professor at the University of North Carolina Schools of Pharmacy and Public Health and an investigator with the UNC Children's Primary Care Research Group. As an investigator in the UNC Center for Education and Research on Therapeutics, Dr. Mohr was awarded a grant from Agency for Healthcare Research and Quality to study patient safety in pediatric ambulatory settings, which began in October 2001. Dr. Mohr has a master's degree in public health from the University of North Carolina School of Public Health and a PhD in Evaluative Clinical Sciences from Dartmouth College in Hanover, NH. Dr. Mohr's PhD research use qualitative methodologies to study how to form, operate, and improve clinical microsystems. While completing her degree, she served as a consultant to the Institute of Medicine's Quality of Health Care in America Committee to conduct a study to explore the characteristics of clinical microsystems. The results of this Robert Wood Johnson Foundation funded study were used to inform the work of the committee in making recommendations for the design of the delivery system of the 21st century. Since the conclusion of that research, she also participated in a Dartmouth study of microsystems, also funded by RWJ Foundation. As part of that project she developed the microsystem assessment tool for use in clinical microsystems. Dr. Mohr is a member of the Board of Examiners for the Malcolm Baldrige National Quality Award and is an Associate Editor of Quality and Safety in Health Care.
Paul Barach, B.Sc., MD, MPH, Maj. (ret.), is a board-certified Anesthesiologist, with fellowship training in Cardiac Anesthesia, and Critical Care medicine, at the Massachusetts General Hospital and Harvard Medical School where he trained, and was junior faculty. He later co-directed the Center for Patient Safety and Simulation at the University of Chicago. Presently, he is Medical Director of Safety and Quality for Jackson Memorial Hospital, Associate Professor Department of Anesthesiology, Director of the Miami Center for Patient Safety, and Associate Dean for Patient Safety and Quality Improvement. He was recently chosen to lead a $950,000 state-wide university coalition on the recent Medical Liability bill in Florida.
He spent 5 years in the Army and Special Forces focusing on trauma care, safety science, injury control, team training, and medical simulation. He later completed a Masters in Public Health, with emphasis on injury epidemiology and safety science. He is board certified in Anesthesiology and Critical Care, and has authored over 50 articles, book chapters and other reports. He created and chaired the Massachusetts Medical Society (MMS) Patient Safety taskforce which designed the first statewide patient safety curriculum. He was a member of the Harvard Kennedy School for Error Prevention Executive Session, and a member of the Malcolm Baldrige National Quality Examiners Program, and has chaired and co-chaired several national and international meetings on patient safety. He will co-chair the first international congress on Patient Safety in London in 2004. He was a member of the American Medical Association taskforce on Privacy and Confidentiality, and has dealt extensively with medical liability reform. He is editor of an 8 part series in the Annals of Internal Medicine on Patient Safety, and is past editor of the journal Quality and Safety in Healthcare. He was recently invited to write the background paper Patient Safety: Data Standards Institute of Medicine report on designing national adverse event reporting systems.
The external environment of the clinical microsystem and health care system includes regulatory, cultural-socio-political, business and market imperatives which must be understood and taken into consideration in the delivery of healthcare. Some examples of clinical microsystems engaging and advocating for health care delivery include:
Clinical microsystem culture cuts against the business and market realities and often results in understanding ways to align internal culture with external harsh realities. A mission may be revised due to external realities such as discontinuing psychiatric services and long term care to focus on short term episodic treatment due to market pressures.
In some instances, the clinical microsystem can engage in payor negotiation to advocate for core care processes in caring for populations of patients. The clinical microsystem can “shape” the payment environment through these discussions and by presenting evidence-based algorithms and outcome data. The payor system becomes more informed and supportive of this predictable pattern and outcomes of care.
There is much more experience and lessons to be learned in this area.
Health Professional Education/Professional Formation
The recognition for change in health care is clearly articulated in the Institute of Medicine's (IOM) report-Crossing the Quality Chasm: A New Health System for the 21st Century-which is a culmination of the work of the Committee on the Quality of Health Care in America that was formed in 1998.
The committee acknowledges that most health professionals have had limited training and development in the ways they can learn directly from their own practice experience and translate that knowledge into the redesign of their everyday care systems. "Knowledge-building" as health professionals have been taught, is often considered "external" to their daily work, except for those few in full-time academic practice. Not surprisingly, physicians seeking to be responsive to the pressures they feel for change and improvement grow frustrated when their efforts to improve outcomes, remove cost, and improve service are not successful.
The committee recommends that strategies be developed for "(1) restructuring clinical education to be consistent with the principles of the 21st century health system throughout the continuum of undergraduate, graduate and continuing education for medical, nursing, and other professional training programs and (2) assessing the implications of these changes for provider credentialing programs, funding, and sponsorship of education programs for health professionals." 26
Graduate medical educational settings and the related professional accrediting organizations and standard-setting boards have recently recognized the need to address this situation. For instance, the Accreditation Council for Graduate Medical Education (ACGME) in increasing its focus on educational outcome assessment in residency programs. The ACGME has identified and endorsed six general competencies -- patient care, medical knowledge, practice-based learning and improvement, professionalism, interpersonal skills and communication, and systems-based practice--that residents must demonstrate.
Clinical education for all health professionals will be evolving and changing in the coming years. Dartmouth-Hitchcock has developed a residency program that would begin to model the restructuring of clinical education that the IOM has envisioned and that the ACGME has begun. Others will follow and more will be learned about educating and preparing our health professionals to be leaders, collaborators in care, and reflective practitioners in the care that is delivered to best meet patient needs.
26 Institute of Medicine. Crossing the Quality Chasm: A New Health System for the 21st Century. Committee on Quality in Health Care in America. Rona Briere, Ed. Washington, D.C.: National Academy Press, 2001.
The Basics What improvement tools are we currently using? Are there tools available that can help us be more successful in improving patient care and outcomes?
You now have much more information and data than you probably have had about your clinical microsystem in a way you may not have seen before. Once teams have become reflective about Purpose, Patients, People, Processes, and Patterns, interest usually turns to making improvements based on the data and information uncovered. This section will provide you with helpful tools and methods to make improvements and move toward becoming a high performing clinical microsystem. Clinical microsystem improvements should be done with representation of every role in the clinical microsystem staff. Engaging the team members in improvement activities helps to increase the group intelligence of the clinical microsystem, gain early buy-in of need for improvements, and assists execution of the improvements. Outcomes can be improved through process improvements.
Once you have chosen a process to improve, you should use a disciplined process for improvement. The disciplined process includes a model for improvement, meeting skills and improvement tools.
2. The Model for Improvement
Principles of an effective Aim Statement include: Aim, Measures, Changes, PDSA (Plan-Do-Study-Act.) Aim statements set the parameters of the process to improve. Principles of an effective aim statement
State aim clearly Use numerical goals Set stretch goals Avoid aim drift Be prepared to fully shift aim if necessary
Sample Aim Statement Create your aim statement that will help keep your focus clear and your work productive:
We aim to improve: _____________________________________________________________ (Name the process) in ________________________________________________________________________ (Clinical location in which process is embedded) The process begins with: __________________________________________________________ (Name where the process begins)
The process ends with: ___________________________________________________________ (Name the ending point of the process)
By working on the process, we expect: ________________________________________________ (List benefits)
Create your aim statement that will help keep your focus clear and your work productive:
We aim to improve: prescription refill process in Family Practice Clinic (Name the process) (Clinical location in which process is embedded) The process begins with: request for prescription refill (Name where the process begins)
The process ends with: completed refill (Name the ending point of the process)
By working on the process, we expect: streamline the process for patients, reduce turn (List benefits)
around time, and optimize roles
It is important to work on this now because: patients are unhappy with current turn around (List imperatives)
time, providers are spending a lot of time doing refills
Meeting Skills
The logistics of how the team will meet and begin process improvements begins with setting a regularly scheduled meeting time for the core improvement team from the clinical microsystem. This meeting time should occur every week for one hour. Success of the meetings will depend on use of meeting agendas and roles to assist the team to be productive and efficient.
Meeting Roles are the following:27
Leader: Prepares agenda, moves agenda along and elicits participation The leader of a team is generally the person who is recognized as the owner of the work process under study. The leader coordinates and directs the work of the team as it studies the process and implements improvements. The leader often meets individually with the facilitator to plan for the work of the team.
The leader is also a member and contributes ideas, interprets data, and participates with other members in making team decisions.
Recorder: Provides a visual record for the group and a next actions list
Recorder is a rotated meeting role assigned to help the team maintain a record of its work. The recorder logs significant content on a flipchart in the front of the team. When the meeting is moving rapidly, two recorders may be used.
Timekeeper: Verbally announces amount of time remaining and when time is up
Timekeeper is a rotated meeting role assigned to help the team manage time. The timekeeper calls out the time remaining on each agenda item at intervals determined by the team. It is the team’s responsibility to manage time, and the timekeeper simply assists the team in this process. The timekeeper also helps the team negotiate more time for agenda items or to change the agenda to reflect needed time.
27 Descriptions adapted from: Continual Improvement Handbook: A Quick Reference Guide for Tools and Concepts, Healthcare Version. 1993. Executive Learning, Brentwood, Tennessee.
Facilitator: Helps to manage group process, to balance participation, to keep group focused on objectives The facilitator directs the process of the meetings, not the content. Everyone is responsible for keeping the meeting on time, on topic and in a good mood, but the facilitator has some powers and duties that other people don't have. This includes disciplining disruptive, rambling, rude and bullying people, making a speaker's list, encouraging everyone at the meeting to participate, summarizing issues and keeping the discussion on topic. Facilitators need to concentrate on the process, and can't get too involved in the topic being discussed. Who facilitates? Rotating facilitators at your meeting will give everyone a chance to improve their skills at this. In large, long or difficult meetings, people have to share facilitation.
The facilitator role is to oversee the meeting and help the team grow and learn. The facilitator can remind members of process improvement tools to consider, meeting process, data use, and point out when the "ground rules" are not being honored. The facilitator should observe the group process and point out to the group when the meeting progress is "off track" from the set agenda, encourage participation of ALL members of the meeting, control digressive, difficult, or dominating participants and resolve conflict among participants. Providing feedback to the group on their meeting skills and improvement/data utilization is important to promote growth.
Facilitator Role 28, 29, 30 Coordinating issues
make sure there is an agenda (check the minutes of earlier meetings to look for tabled issues) make sure the issues are in a logical order (i.e. financial report is given before money-related decisions are
made) introduce each item and ask if everyone is familiar with the background define what needs to be accomplished (decision, announcement, approving a proposal, choosing between
two proposals, planning or taking an action) if the discussion is repetitive, sum up the points and move the discussion forward sum up a proposed decision and check for visible signs of agreement (nods, hand signals etc.)
Coordinating people:
introduce any new members of the group check to see if anyone has to leave early, this may affect the agenda make sure everyone has a chance to speak, try and encourage quiet people to speak more and talkative
people to listen more. prevent conflicts between two people from taking over the meeting (ask other people what they have to
say, tell the feuding members that they need to speak less and listen to other people in the meeting).
28 The Perfect Meeting by David Sharman, Random House, London, 1993. An excellent, and brief, guide to holding meetings. Include formal and business-type meetings, as well as consensus and innovative techniques.
29 Effective Meetings by P. Hodgeson, Century Business, London, 1992. Another great guide to holding meetings, blending practical tips and general theory. 30 Chairing a Meeting with Confidence: An easy guide to rules and procedures by Kevin Paul, Self-Counsel Press, Vancouver, 1992. Very useful for official meetings - Annual General Meetings, Elections of a Board, deputations etc. Includes a simplified set of rules and loads of information on preparing for a meeting.
You can interrupt people to ask them to summarize their points, remind them to not go off topic, tell them to not interrupt others, stop them from being rude to another person.
You can cut off discussion if people are off topic or repeating themselves. Ask if anyone has something new to say or a new proposal to make. You can also propose that the issue be tabled until the next meeting, when you'll hopefully have more information.
Facilitating meetings
What is facilitation? Facilitation is about clarifying the issues in a meeting, making sure that both the product and the process
are on track with the group's stated goals, policies and philosophies. Everyone has the responsibility to try and follow these guidelines in the organization. In a specific
meeting, someone is appointed facilitator to be aware of the process taking place at that time. Sometimes we may lose sight of the big picture, we may react personally to an issue that isn't really about us, we may not be as active is asking for clarification as we should be and other slips in conscientiousness.
How do I learn it? Facilitation involves a focus on process, not results. It involves encouraging people to act cooperatively
and work collectively. Our dominant culture and education do not give us much training in this. Unless we make a distinct effort to change our behaviors, we tend to follow what we've been taught. Your skills at facilitating will improve with experience, Being in meetings and watching skilled facilitators operate is the best way to learn.
How do I do it? Facilitators must listen carefully to what's going on. However, you can't get lost in the details of the
meeting; listen to the process and the larger patterns. In order to keep sight of this process, the facilitator must step away from involvement in producing the
product of the meeting - decisions. The facilitator cannot start debating actively in a meeting, you participate only to alter the process and guide the dialogue. You have certain powers during the meeting in order to make this happen, such as disciplining unruly members.
Tools for Facilitating As you listen, watch out for some common patterns that people fall into in meetings. Ask yourself these questions as the meeting goes on:
Who is talking? Does someone talk more or interrupt others? Process objective: You want to make sure everyone has a chance to speak
Did everyone signal yes? Process objective: Make sure that everyone's paying attention and if they have problems they have a chance to speak up.
Tools: ♦ Ask people who haven't said anything to speak. ♦ Go around the table and let each person say yes, no or whatever. ♦ Develop hand signals (e.g. thumbs up) where people can signal their approval so a quick visual scan
will let you know they're in agreement.
Who does this situation involve/affect? Process objective: You can't make decisions when key people aren't there. Also, you don't want to spend meeting time working out details between two people.
Tools: ♦ Try and clear the agenda, moving items to a committee, asking people to meet quickly after the
meeting to work out details etc. ♦ Make suggestions that the item be tabled until the next meeting, that someone call a missing member,
Are people starting to repeat themselves? Process objective: to get people to listen to each other or to give new suggestions to the problem.
Tools: ♦ Point this out. Ask people to speak ONLY if they have something new to say. ♦ Make a proposal and test for consensus. ♦ Postpone the decision until you have more information or new ideas.
Is someone telling others how they should be feeling/acting? Process objective: to keep people focused on themselves.
Tools: Ask people to use the format - 1.) I feel (sad, angry, afraid, appreciative, happy, safe)... 2.) Because I think..... 3.) And I want (a solution that would satisfy you)....
Ask everyone else to listen carefully. Feelings are always valid and real. Perceptions can be mistaken, however. Listen to what the person is asking for and find out if you can provide that.
Is someone complaining a lot? Process objective: to find solutions
Tools: ♦ Ask them to provide suggestions or solutions. ♦ Probe the problem until you have a clear understanding of the specifics and can break it down into
manageable parts.
Are some perspectives being left out of the meeting? Process objective: to balance the speaking opportunities.
Tools: Often groups have unequal representation. When speaking time is allocated per person, you can get imbalances on a larger scale. For example, if you have 1 disabled woman and 7 able-bodied people, you may get 7 x the speaking time allowed for able-bodied perspective. When dealing with issues that you think reasonably affect different people in your group differently (e.g. gender, race, disability, class, etc), break up the speaking time according to group - not per person. This is often called group and caucus. The meeting can be split up into the group (the socially dominant members) and caucus (traditionally marginalized members) to discuss an issue. The sub-groups can see what perspectives they share, work through issues in a safe space, and then appoint a spokesperson. The groups meet again and relay their points to each other. Speaking time continues to be divided according to group. If there is disagreement between members of either group, they may want to meet split off again to clarify their position. This can be done informally (without the separate meetings) by the facilitator asking for balancing opinions or making alternating spots on the speaker's list for a member of both groups to speak.
Is everyone paying attention? Do they know what's going on? Process objective: wake up and smell the coffee
Tools: ♦ Take a quick break. ♦ Tell everyone to stand up and stretch or play music. ♦ Have games and eating breaks in long meetings. ♦ Announce a question period before there's closure on the issue. ♦ Table some non-essential items to the next meeting.
Is someone being rude or offensive? Process objective: create a safe space, stop personal attacks
Tools: ♦ If you suspect the meeting will be difficult, have everyone agree on ground rules at the beginning
of the meeting. You can refer back to these rules and remind people of their agreements. ♦ Cut them off right away. Let them know their comments are out of line. If they persist send them out
of the room to cool off for 5 minutes. You can take further action if it continues; your primary responsibility is to make the meeting place safe. Destructive people need to be shut down.
Does someone drone on, talk a lot and wander off the point? Process objective: move the meeting along, keep on topic
Tools: ♦ Remind people what the purpose of the discussion is - to make a decision, to take action. Only talk
about issues that need to be discussed at this time. ♦ Interrupt them and remind them that in view of the limited time, could they briefly summarize their
point? ♦ Interrupt the meeting when it's off topic, remind everyone how time is pressing in. ♦ Speak to them after the meeting ♦ If everyone is like this, try and nail down your agenda items and time limits so you know how much
needs to be done and how tightly you need to keep on track.
Ground rules are important for people in Microsystems to discuss and agree upon. Frequently the ground rules will be discussed and used at meetings in the workplace environment. Ground Rules
Practice not interrupting each other Work to include other’s ideas Do unto others as you wish them to do to you Try not to repeat the same points – even for the emphasis you hoped for the first time you said it and didn’t
get. Practice not defending previously held viewpoints – if by suspending them for a while, you might learn
something new. Try not to be too nice at the expense of rigor – help the group progress in its thinking Practice forgiveness for new ideas and ways of learning that don’t seem to work as well as they might
eventually. Laugh a little. Nabil’s rules:31
Participate in the meeting and not in the hall. Speak to the agenda item being discussed. Plan your words to conserve time. Clearly state, opinion or fact. If it is a fact, give the references. For opinions use only “I” statements, unless you have permission to speak for the “we”. If you oppose you must propose. Participate in the meeting and not in the hall. Speak to the agenda item being discussed. Plan your words to conserve time.
31 University of California, Davis Medical Center 2001
Clearly state, opinion or fact. If it is a fact, give the references. For opinions us only “I” statements, unless you have permission to speak for the “we”. If you oppose you must propose.
The Meeting Phases
Pre-meeting plan to review the aim of the meeting, people who need to be present, materials or information needed along with ensuring a proper meeting place and equipment for the meeting.
In meeting: Focus on aims of the meeting, work through the aims, and set up next action steps and agenda Post meeting follow-through: Ensure action steps are carried out and the gathering of additional
information/data is identified as needed during the meeting.
7-Step Meeting Process and Agenda
Many teams find this disciplined style of conducting meetings restrictive and uncomfortable at first. Practice makes perfect! Teams who have been persistent in using the meeting format and roles could no longer imagine holding meetings the old way.
1. Clarify the objectives: what will we get done? 2. Review roles: leader, recorder, timekeeper, facilitator 3. Review and set times on agenda 4. Work through agenda items 5. Review meeting record: review flipchart record, make changes/additions, and decide what to keep for meeting record. 6. Plan next agenda and next actions: who will do what off line and aims for the next meeting. 7. Evaluate the meeting: what went well and what could be improved?
Processes During the Meeting Include:
Rotating roles and sharing leadership of the meetings Decision making Listening Giving feedback Learning Managing conflict Having fun
Some helpful tools and tips for productive meetings follow.
Brainstorming Generates a wide variety of ideas from all participants without criticism or judgment Successful Brainstorming: Encourages creativity Involves everyone Generates excitement and energy Separate people from the ideas they suggest
Brainstorming Steps Clarify what the aim is, as needed and review the topic Allow a minute or two of silent thinking Either go around the table, one-by-one, for each person to speak, or let be called out until all ideas are
exhausted. When ideas start to flow . . . let them come! No discussion during brainstorming No criticism of ideas . . . not even a groan or grimace! Write all ideas on flipchart for all to see
Multi-voting Once you have generated a lengthy list of ideas, the list needs to be provided to lead to action plans.
Multi-voting uses voting to select the most popular items on a list with limited discussion and difficulty
Is accomplished through a series of votes, each cutting the list in half
Often follows a brainstorming session
Multi-voting steps Generate the list of items and number each item Combine two or more similar items if the group agrees they are the same Renumber the items as needed Each member chooses 1/3 of the total number of items on the list Each member writes their choices on a piece of paper After all members have silently completed their selections, the votes are tallied. Voting is accomplished
by a show of hands as each number is called out. Reduce the list of items by eliminating the items with the fewest votes Repeat the voting process until only a few items are left
This is another method to generate change ideas to consider. A more structured method of generating a list and then narrowing it down. The first phase is silent brainstorming The second phase is voting to reduce the item list
Nominal Group Technique Steps Clarify the task or question Members ask questions as needed until everyone is clear Generate ideas silently. Do not allow any distractions, no joking, no whispering When everyone is done creating their list, go around the table and have each participant read one idea off
their list and write the idea on a flipchart Continue to round robin until everyone’s list is posted, or 30 minutes is up No discussion, not even questions or clarification are allowed during this step Display and talk through each idea for clarification and discussion of ideas The person who generated the idea should be the one who provides clarification At the end of this step, like ideas are combined Narrow the list of ideas through multi-voting
PDSA Worksheet – Plan, Do, Study, Act
The Plan, Do, Study, Act or PDSA cycle is the preferred means for turning ideas into action and then making the connection to learning. Using this four-part method for discovering and correcting assignable causes to improve the quality of a process requires some discipline and effort. While not all improvements require a PDSA cycle, it provides framework for efficient trial-and-error learning methodology. The PDSA Worksheet has proved useful in creating tests of change in a disciplined manner. An alternative PDSA worksheet titled Worksheet for Testing Change also follows. This is alternative worksheet for tracking PDSA cycles that has been developed by the Institute for Healthcare Improvement (IHI). Plan
Describe objective and specific change Specify where it fits into the process flow Who, does what, when, with what tools and training Data collection plan: who measures what and displays how and where
Do Carry out the change
Study Make sure that you leave time for reflection about your test. Use the data and the experience of those carrying out the test to
discuss what happened. Did you get the results you expected? If not, why not? Did anything unexpected happen during the test?
Act Given what you learned during the test, what will your next test be? Will you make refinements to the change? Abandon it? Keep the change and try it on a larger scale?
2. MEASURES How will we know that a change is an improvement?
3. POSSIBLE CHANGES What changes can we make that we predict will lead to improvement?
This worksheet can be used to plan and keep track of improvement efforts.
Note: Questions 1, 2 and 3 are bigger picture ("30,000 feet" type) questions; questions 4-8 are very specific, ground-level questions.The "PDSA Worksheet" is based on the work of Tom Nolan, PhD, Paul Batalden, MD and Eugene Nelson DSc . 8/93
Continuous Improvement Tools/Form/Knowledge Evaluation and study of clinical microsystems can be supported with a few useful improvement tools, which are outlined below.
Fishbone (Cause and Effect Diagram)
Why ♦ Improvement model is scientific thinking . . . science is about causes and effects. ♦ Use a fishbone diagram as one way to build a theory about potential causes and effects.
What ♦ A picture of the factors thought to produce a result ♦ Big arrow points to “result” and branches off. Big arrow shows major contributing factors producing
the result. How ♦ Put result at the end of the arrow and brainstorm major categories of contributing factors and
subcategories. Major categories can include equipment, people, process, environment, materials
Fishbone Diagram Steps Review your aim – specify aim to work on ♦ Place at top of “fishbone”
Select a desired result relevant to your aim (e.g. Cycle time, phone access, etc.) ♦ Place at the end of “fishbone”
Generate ideas of things that may drive the result ♦ Major categories of drivers and specific types of drivers
Build a fishbone diagram to display your team’s sense of causes and effect. – i.e. drivers and result Review your fishbone Note: A limitation of the Fishbone diagram is that it implies one way flow. Cause and effect may be reciprocal flows causing unintended consequences.
3. Fishbone Diagram Example
LengthyAppointments
People Equipment
Materials Process
Clinical staff inconsistent Support staff nottrained
No one responsible for patient flow Patients arrive with moreneeds than originallystated
Providers are lateSupport staff unpreparedfor patient visits
Equipmentbroken
Not enough computers
Equipment missing
Inventory lowMissing examroom supplies
Charts are missingInformation, e.g. testresults missing
No standardregistration process
MA does paper flow and patient flow
Variation in rooming process
Check outprocess delays
Poor communication between allstaff on patient status
Fishbone (Cause and Effect) of Lengthy Appointments
9. 1. Effect, 2. Major categories of potential “drivers”, 3. Specific potential “drivers”.
Flowcharts (Process Mapping)
A flowchart is a picture of the sequence of steps in a process. These step-by-step pictures can be used to plan a project, describe a process, or to document a standard method for doing a job. Flowcharts can help team members understand what is happening now in a process. It is helpful to use flowcharts to build consensus with the team, correct misunderstandings of the process, and build a common understanding for all team members. Different steps or actions are represented by boxes or other symbols. It is important to flowchart the current process, not the desired process.
Flowcharts can be “high level” to get an overview of the process of interest
Used with permission from Charlie Burger, MD Norumbega Medical
Flowcharts can also be very detailed and “drilled down” to show the details and roles.
Detailed flowcharts are especially helpful to standardize and improve processes. Deployment-type flowcharts show the process across roles and are very helpful when redesigning
processes or optimizing staff roles. See following example.
Flowcharting Steps
Before a team can begin to flowchart a process, be clear on the beginning and end of the process ♦ The process begins: ____________ ♦ The process ends: _____________
♦ In order to be able to show all the steps of the process, ask the following questions: ♦ What happens next? ♦ And then what?
Patient entersroom for
appointment
Providerenters room
Providerdiscusses
patient. needs
Providerexamines
patient
Provider identifiesneed for urine
specimen
Is specimencup in
cupboard?
MedicalAssistant looksfor specimen
cup
Medicalassistant
returns withspecimen cup
Patient givenspecimen cup
Providercompletespaperwork
Follow upinstructions
given topatient
Patient waits 10minutes from the timeMedical Assistant is
called
PatientLeavesYes
MedicalAssistant
calledNo
Check out atfront desk
SOAP noteBilling sheetFollow up appointmentLab forms
Flowcharting Helpful Hints Hints on building first time flowcharts ♦ Select process, start, and end points ♦ Make a list of steps – from start to finish – by asking what happens first, then what happens, then what
happens (keep it simple) ♦ Turn listing of actions from start to finish into a flowchart using basic symbols
Using the meeting skills previously discussed you can go around the table and have each staff member write on a Post-It TM note the steps of a defined process. The Post-It TM are placed on flip chart paper and can easily be moved as staff members clarify the steps
Another method is to write directly on a flip chart so the entire staff can see the process unfold as it is described. This allows discussion and clarification.
If all of the team cannot participate in building a flowchart, post the flipchart in a common area of the clinical microsystem and invite the team members to add “post-its” to modify and correct the flowchart from their perspective.
Deployment Flowcharts
Deployment flowcharts are detailed flowcharts that are helpful in standardizing a process. They show the process across roles and is very helpful when redesigning processes or optimizing staff roles
Add the Roles Deployment Flow Chart Once a basic flowchart of the process has been created, create a deployment flowchart by following the steps below.
Identify the names of the activities (actions) in the order that they occur. Identify the “departments” or “actors” in the list of steps Draw the flowchart across the roles
Value stream mapping outlines all of the activities you must do to deliver services and products to patients. There are three main parts:
Flow from suppliers to customers Flow of information and data Key Quality Characteristics
Benefits of process mapping 1. Highlight connections among activities, information and flow 2. Move from single function/role to the entire value stream Systems Thinking 3. Improve decision-making process 4. Create common language and understanding 5. Separate value-added activities from nonvalue-added activities 6. Focus on the patient/customer
Add data and information flow
What information flows along the process? By what method does this information flow? Is it electronic, verbal, written? Add a column, “Data Transfer Content” to capture the actual content of the data
Hungry PhilJaunty June
Cashier Darling DebWaitress
$ $$
NabilShort Order Cook
Try Out“Deb’s Diner”
Enters Diner
Cooks & plates meal
Plans timing
Writes order down
Puts on clothes line
Greets & Gives Menu
Greets & Seats
Tells order
Decides on food
Reads order
Yells “Foods upDarling”
Hears “Foods up”
KQCs(Quality, Service, Cost,
Delivery, etc)
CleanlinessSeating
Service StyleMenu Choices desireable
AccuracyEase of understanding
LegibleFillable
Hearable
V
V
V
W
V
Key: Information Flow in RedV = VerbalW = WrittenE = Electronic
Process MappingAdd Data and Information Flow: How does Information Flow along the Process?
Identify possible quality characteristics – what might you measure that would represent “goodness” of the process from the customer/patient perspective
Go back to each step and identify KQCs for each process step Specific quality characteristics: Quality, Service, Cost, Delivery, etc.
Process Mapping Add the Key Quality Characteristics
Advanced Value Stream Mapping Insert EXTERNAL connections along the process Separate each step of the process KQCs into
o Patient perspective o Supplier-customer perspective
10.
Value Stream Mapping1. WHO are the players? 2. What is the FLOW of ACTIVITY 3. What are the customer KQCs?4. What is the flow of INFORMATION & content? 5. Insert External Links 6. Separate KQCs into patient/supplier
Hungry PhilJaunty June
Cashier Darling DebWaitress
$ $$
NabilShort Order Cook
Try Out“Deb’s Diner”
Enters Diner
Cooks & plates meal
Plans timing
Writes order down
Puts on clothes line
Greets & Gives Menu
Greets & Seats
Tells order
Decides on food
Reads order
Yells “Foods upDarling”
Hears “Foods up”
KQCs(Quality, Service, Cost,
Delivery, etc)
Data TransferContent
CleanlinessSeating
Service StyleMenuChoicesdesireable
AccuracyEase ofunderstanding
LegibleFillable
Hearable
V
V
V
W
V
Greet CustomerOffer DrinkOffer Menu
Listing of what wantedto eat and drink
Notify food ready to beserved
Receives Message:“Food Ready”
Key: Information Flow in RedV = VerbalW = WrittenE = ElectronicExternal Environment Links
“A change concept is a general notion or approach to change that has been found to be useful in developing specific ideas for change that lead to improvement. Creatively combining these change concepts with knowledge about specific subjects can result in developing changes that lead to improvement.”32
Change concepts are not specific enough to use directly, but must be applied to specific situations and then turned into ideas for change. A table of the change concepts follows.
Change concepts can help clarify your thinking about where in the process you should begin your changes.
Change concepts are stimulants to develop and design detailed and specific tests of change
A change concept, combined with your knowledge, of the process will help lead to new thinking
Use change concepts to “jump start” your thinking.
For example, in the grouping of Change the Work Environment, the change concept we wish to apply to the clinical microsystem is: Give People Access to Information. We would like to consider and act on this change concept to improve our information environment through integration of information. We might create a strategic plan to:
Collaborate with information technology (IT) services to develop feedback systems, which inform the clinical microsystem about operational measures such as daily visits, number of no shows and number of cancellations. This information can support the clinical microsystem to consider real-time changes.
Create a feedback system that informs the clinical microsystem of biological outcomes of subpopulations of patients such as HgA1c for diabetes and blood pressure for hypertension
It is best to use the change concepts to open creative thinking in the improvement process to design a PDSA (plan-do-study-act) cycle. Caution: You cannot use change concepts as a substitute for thinking through your process and your problems with that process.
32 Langley G, Nolan K, Nolan T, Norman T, Provost L. The Improvement Guide : A Practical Approach to Enhancing Organizational Performance. 1st ed. The Jossey-Bass Business & Management Series. San Francisco, CA: Jossey-Bass Publishers; 1996: 293.
33 Langley G, Nolan K, Nolan T, Norman T, Provost L. The Improvement Guide : A Practical Approach to Enhancing Organizational Performance. 1st ed. The Jossey-Bass Business & Management Series. San Francisco, CA: Jossey-Bass Publishers; 1996: xxix, 370.
Eliminate Waste • Eliminate things that are not used • Eliminate multiple entry • Reduce or eliminate overkill • Reduce controls on the system • Recycle or reuse • Use substitution • Reduce classifications • Remove intermediaries • Match the amount to the need • Use sampling • Change targets or set points Improve Work Flow • Synchronize • Schedule into multiple processes • Minimize handoffs • Move steps in the process close together • Find and remove bottlenecks • Use automation • Smooth workflow • Do tasks in parallel • Consider people as in the same system • Use multiple processing units • Adjust to peak demand Optimize Inventory • Match inventory to predicted demand • Use pull systems • Reduce choice of features • Reduce multiple brands of same item Change the Work Environment • Give people access to information • Use proper measurements • Take care of basics • Reduce demotivating aspects of pay system • Conduct training • Implement cross-training • Invest more resources in improvement • Focus on core processes and purpose • Share risks • Emphasize natural and logical consequences • Develop alliance/cooperative relationships
Enhance the Producer/Customer Relationship • Listen to customers • Coach customers to use product/service • Focus on the outcome to a customer • Use a coordinator • Reach agreement on expectations • Outsource for “free” • Optimize level of inspection • Work with suppliers Manage Time • Reduce setup or startup time • Set up timing to use discounts • Optimize maintenance • Extend specialist’s time • Reduce wait time Manage Variation • Standardization (create a formal process) • Stop tampering • Develop operational definitions • Improve predictions • Develop contingency plans • Sort product into grades • Desensitize • Exploit variation Design Systems to Avoid Mistakes • Use reminders • Use differentiation • Use constraints • Use affordances Focus on the Product or Service • Mass customize • Offer product/service anytime • Offer product/service anyplace • Emphasize intangibles • Influence of take advantage of fashion trends • Reduce the number of components • Disguise defects of problems • Differentiate product using quality dimension
Mental models are images, assumptions and stories which we carry in our minds – of ourselves, other people, institutions, and every aspect of the world.
Human beings cannot navigate through the complex environments of our world without cognitive “mental maps”.
All of these mental maps, by definition, are flawed in some way. The difference between mental models explains why two people can observe the same event and
describe it differently – they are paying attention to different details. Mental models also shape how we act. For example, if we believe people are basically trustworthy, we
may talk to new acquaintances more frequently than if we believe most people can’t be trusted. Mental models are usually tacit, existing below the level of awareness. They are often untested and unexamined. They are generally invisible to us until we look for them.
The core task is to bring mental models to the surface, to explore and talk about them with minimal defensiveness:
To help us see the pane of glass See its impact on our lives Find ways to re-form the glass by creating new mental models that serve us better in the world
34 Adapted from Scholtes P, Joiner B, Streibel B. The TEAM® Handbook, Second Edition. Madison, WI: Oriel Inc.; 2000.
Mental Model Skills Reflection: Slow down our thinking processes to become more aware of how we form our mental
models. Inquiry: Holding conversations where we openly share views and develop knowledge about each other’s
assumptions.
Mental Model Techniques
From “action science” field, developed by theorists and educators: Chris Argyris and Donald Schon Are aimed at: ♦ Exploring the reasoning and attitudes which underlie human action ♦ Producing more effective learning in organizations and other social systems.
Ladder of Inference
The ladder of inference shows how rapidly we can leap to knee-jerk conclusions with no intermediate thought process, as if rapidly climbing up a ladder in our minds. Individuals who are undisciplined in reflective thinking have difficulty hearing what others actually say. They hear what they expect others to say, have little tolerance for multiple interpretations of events and often see only their own interpretation. It is a common mental pathway of increasing abstraction, often leading to misguided beliefs.
In teams and groups, people who have not mastered a threshold level of inquiry will spend hours arguing their ideas.
Observable“data” and experiences(as a video tape
recorder might capture it)
I select“Data”
from what I observe
I addMeanings
(cultural and personal)
I makeAssumptions
based on the meanings I added
I drawConclusions
I adoptBeliefs
about the world
I takeActions
based on my beliefs
TheReflexiveLoopOur beliefsaffect whatdata we selectnext time
Improve your communications through thinking and reasoning (reflection) Make your thinking and reasoning more visible to others (advocacy) Inquire into others’ thinking and reasoning (inquiry)
What is the observable data behind that statement? Does everyone agree on what the data is? Can you run me through your reasoning? How did we get from that data to these abstract assumptions? When you said (“your inference”), did you mean (“my interpretation of it”)?
Aim: To become aware of the tacit assumptions which govern our conversation and contribute to blocking our purpose in real-life situations, and to develop a way of talking about those tacit assumptions more effectively.
Step 1: Choose a problem Select a difficult problem you’ve been involved with during the last month or two, the king of tough, interpersonal difficulty that many of us try to ignore.
You can’t reach agreement with your close associate Someone else is not pulling his or her weight You believe you are being treated unfairly You believe your point of view is being ignored or discounted The rest of the organization is resisting – or you believe they will resist – a change you want to
implement You believe your team is not paying attention to the most crucial problem
Write a brief paragraph describing the situation. What are you trying to accomplish? Who or what is blocking you? What might happen?
Step 2 Recall a frustrating conversation you had over this situation – or imagine the conversation that you
would have if you brought up the problem.
Draw a line down the middle of a piece of paper
In the right hand column write out the dialogue that actually occurred (or what you are pretty sure would occur if you were to raise the issue).
Step 3 In the left-hand column, write out what you were thinking and feeling, but not saying.
Step 4: Reflection Using your left-hand column as a resource:
You can learn a great deal just from the act of writing out a case, putting it away for a week, and then looking at it again. The case becomes an artifact through which you can examine your own thinking, as if you were looking at the thinking of someone else.
As you reflect, ask yourself: What has really led me to think and feel this way? What was your intention? What were you trying to accomplish? Did you achieve the results you intended? How might your comments have contributed to the difficulties? Why didn’t you say what was in your left-hand column? What assumptions are you making about the other person or people? What were the costs of operating this way? What were the payoffs? What prevented you from acting differently? How can I use my left-hand column as a resource to improve our communication?
We’re two months late, and I didn’t think he knew. I was hoping we could catch up.
Todd: Jim, I’d like to come down there next week. We’re a few weeks behind, and I think we might all benefit from a meeting at your office.
I need to make it clear that I’m willing to take responsibility for this, but I don’t want to volunteer for more work.
Me: I’ve been very concerned about these deadlines. As you know, we’ve had some tough luck here, and we’re working around the clock. But of course, we’ll squeeze in a meeting at your convenience.
He never offers this help in the planning stages, when I could really use it. It’s too late now to bring that up.
Todd: Well, it’s occurred to me that we could use better coordination between us. There are probably some ways I could help.
The changes he keeps making are the real reason we’re late. He must have another one.
Me: Well, I’m happy to talk through any changes you have in mind.
Todd: I don’t have anything specific in mind.
It’s a shame I can’t tell him that he’s the cause of the delays. If I can hold him off two more weeks, I think we’ll be ready
Me: I’d like to have a prototype finished to show you before you come down. What if we set up something for the 27th?
The heart of the scientific approach is to collect and use data to guide thinking and decision making. Simple graphical tools, which can help display patterns, include: Bar Charts, Run Charts, Control Charts, and Pareto Charts.
Run/Trend Charts A run chart is a time plot graph of data in time order. These are often kept to identify if and when problems appear and to see trends over time. Run charts are especially helpful when you implement a change in order to follow results. Many factors that affect a process can change over time and thereby affect the data and outcomes. Detection of the time-related shifts, trends, or patterns is an essential step in making long-lasting
improvements. Run chart data supports timely action to stop problems before they get worse, or to capture and preserve
good changes and helps to determine if the variation in a process is due to common causes or special causes. ♦ Common Causes: Typically due to a large number of small sources of variation. e.g. Arrival time of
patient may vary due to parking, vehicle issues, ability of driver. ♦ Special Causes: Are not part of the process all the time. They arise because of special
circumstances. e.g. Patients arrive late due to bus driver strike. Dealing with each type of cause of variation requires different approaches. ♦ Common Cause: Reduced through disciplined improvement efforts ♦ Special cause: Track down and eliminate if possible or just “note”
Run Chart Steps
The best way to detect the effect of changes is to plot your data in time order regularly. Start with a question that you must answer related to your aim. Collect data on a measure that will answer the question. Make a run chart to display your results. Name the variable and make an operational definition of how to collect the data. Identify be the best staff member to track the data as part of their daily work.
Run Chart Examples
Tracking Your ProgressTracking Your ProgressUsing Run ChartsUsing Run Charts
A control chart is a data display method which helps one to understand within-process variation to determine what action, if any should be attempted to decrease variation, e.g. redesign. These charts increase knowledge because they help you to ask the right questions.
Variation over time is intrinsic to all health care and other work processes. Understanding variation can help monitor, adjust and improve processes. Time plots, run charts and control charts offer powerful, simple methods for studying variation while
preserving the information found when observing a process over time. Studying variation can help predict the future performance of a stable process. Studying variation with control charts can offer insights about possible cause of that variation and offer
clues to the design of change. “Variance” is a measured departure from some reference point and is not to be confused with
“variation”.
It is important to distinguish between special and common cause variation.
Special Cause Variation
Is likely from an “extraneous cause” superimposed on the common cause variation.
Variation source is most identifiable, if variation is promptly studied.
Improvement may be initiated by an individual owner of the process, if the source of the variation is recognized.
Common Cause Variation
Inherent in the process – always present. Produced by the interaction of variables in the process. Process improvement more likely when people from diverse aspects of the process study the process and
design tests of change.
Sources of variation include:
People – Physicians, nurses, patients, etc. Machines – Test equipment, IV pumps, etc. Materials – Supplies, input information, etc. Methods – Procedures, protocols, policies, etc. Measurements – Bias, inaccuracy in data, etc. Environment – Temperature, humidity, etc.
35 Wheeler D. Understanding Variation: The Key to Managing Chaos. 2nd Ed. Knoxville, TN: SPC Press; 2000.
“Signals” of control charts which should be explored further:
Any points outside the limits are signals 3 out of 4 consecutive values are closer to one of the limits than the control line 7 sequential points going one way (up or down) without going the other way 8 or more successive values on the same side of the central line is a signal
Relation between process variation and testing of change Special cause
♦ Actions to take? ♦ Actions to avoid?
Common cause ♦ Actions to take ♦ Actions to avoid
Is special cause every present alone?
Uses for control charts
Report card on process improvement Adjusting a process Testing a process change Extended monitoring of care, operations for prediction. Active interaction with the data for continual improvement, redesign.
Interpreting a control chart What does the chart tell us about the performance of the process? What can we predict about the future? What might be done to improve the performance
Helpful Tips for using control charts
When you are using run charts, when should you decide to compute the Upper and Lower process limits? ♦ Answer: When you have 12 points of data – is a good rule of thumb to outline the upper and lower limits.
After 24 points, extend the limits forward and assume these are the natural limits of the process. When do you recalculate the upper and lower process limits?
♦ Answer: Consider new upper and lower control limits when you see a signal of 8 consecutive data points, in a row, or 7 consecutive data points going up or down. Make a break in the data display and insert the new limits.
Pareto Charts Pareto charts display the priority of factors or characteristics of a process. The tool is designed to identify a few significant factors. Pareto charts help to see patterns in the data to identify and understand problems and choose better solutions. Pareto charts contain a series of bars whose heights reflect the frequency or impact of problems. Categories are represented by the highest bars are relatively more important than the shorter bars.
Pareto Principle “80% of the trouble comes from 20% of the problems”36 The percentages will never be that exact, most teams usually find that most trouble comes from only a
few problems. Pareto charts are useful in problem solving for early identification of problems which should be studied
first. Teams should focus their attention first on the biggest problem . . . those with the highest bars.
Steps to Create a Pareto Chart (See the Pareto Worksheet in the Assessing Your Practice Green Book, Page A15)
Determine the categories and the units for comparison of the data, such as frequency, time, and cost. Order the data categories from the largest to the smallest Calculate the percent of the total that each category represents Working from the largest category to the smallest category, calculate the cumulative percentage for each
category with all previous categories. Draw and label the left vertical axis with the unit of comparison. Scale this axis from 0 to the grand total
of all categories. Draw and label the horizontal axis with the categories, largest to smallest, left to right. Draw bars for each category. Each bar’s height should be the category sum as measured on the left
vertical axis ♦ Be sure each bar is of equal width, that the bars “touch” each other and that the largest bar also
touches the vertical axis Draw and label the right vertical axis from 0-100%, with the 100% value at the same height as the grand
total mark on the left vertical axis. Draw a line graph of the cumulative percentage, beginning with the lower left corner of the largest
category. Title the Pareto Chart and note source of data and date.
Pareto Example List from Practice Core and Supporting Processes (See Assessing Your Practice Green Book). Numbers represent totals of the small problem, somewhat of a problem and totally broken categories.
36 Pareto Principle. Vilfredo Pareto, 19th century Italian Economist
Change Management is a way to intelligently plan practice-wide involvement for redesigning your practice.
Some Assumptions About Change Intentional change benefits from subject and improvement knowledge. Getting good at designing and executing change involves a combination of knowing, doing and reflecting. A great deal is known about change that we can learn and apply.
Two Types of Change
Planned Change Emergent Change
Model of Successful Intentional Change (Gustafson, et al.37)
Tension for change – better elsewhere, “uncertain if we keep on keeping on,” push/pull strategies, “present way is not an option for the future.”
Actionable alternative – makes sense to me, here, now. Technical skills, knowledge, people skills – subject matter and improvement knowledge. Social support – present, “felt.”
Any Change Program Will Do (Weick38)
Providing that it: Animates people and gets them moving and generating experiments that uncover opportunities. Provides direction. Encourages updating through improved situational awareness and closer attention to what’s actually
happening. Facilitates respectful interaction in which trust, trustworthiness and self-respect all develop equally and allow
people to build a stable rendition of what they face.
37 Gustafson D, Cats-Baril W, Alemi F. Systems to Support Health Policy Analysis: Theory, Models, and Uses. Ann Arbor, MI: Health Administration Press, 1993. Chapter 2: Rationality and Policymaking. pp. 11-54. 38 Weick K. Emergent versus Planned Change. In: Beer M and Nohria N, ed. Breaking the Code of Change. Boston, MA: Harvard Business School Press; 2000:223-241.
Social,community need
Customer, beneficiary knowledge
Customers, beneficiaries
OutputsProcessesInputsSuppliers
VisionPlan to improve
Design,redesign
Batalden1988
System & Change, Innovation
“It is not the strongest of the species that survive, not the most intelligent,
1. Talk the walk. 2. Practice being an author – words are important. 3. Practice being an historian – starting with an event and retrospectively ordering
its development. 4. Use more meetings to explore ambiguity and fewer to address uncertainty and
ignorance. 5. Think more in verb-forms – and less in noun-forms. 6. Encourage shared experience – less on constructing a shared meaning. 7. Practice expecting – look for disconfirming as well as confirming data.
Emergent Change (Weick)
Emergent change is people experimenting with the everyday contingencies, breakdowns, exceptions, opportunities, and unintended consequences of work. They are improvising, producing ongoing responsive variations, and enacting micro-level changes.
Consists of ongoing accommodations, adaptations and alterations without a priori intentions to do so.
Occurs when people re-accomplish routines and when they deal with contingencies, breakdowns, and opportunities in everyday work.
Requires leaders/management to “certify” rather than “create” change.
Diffusion of Innovations (Rogers39) Innovators (2.5%) Early adapters (13.5%) Early majority (34%) Late majority (34%) Laggards (16%)
39 Rogers E. Lessons for Guidelines from Diffusion of Innovations. Joint Commission Journal on Quality Improvement. 21(7): July 1995. pp. 324-328
Adopter Categorization on the Basis of Innovativeness
The innovativeness dimension, as measured by the time at which an individual adopts aninnovation or innovations, is continuous. The innovativeness variable is partitioned into fiveadopter categories by laying off standard deviations from the average time of adoption (x)
Adapted from: Diffusion of Innovation, 4th Edition. by Everett Rogers. Free Press (May 1995). ISBN: 0029266718
2.5%
EarlyAdopters
13.5%
EarlyMarjority
34%
LateMajority
34%
Laggards16%
Innovators
x x + sdx - sdx - 2sd
“Change involves making sense of events that don’t fit together . . . linking symbols
and activity, allowing people to come to terms with
the ongoing struggle for existence.”
Karl Weick
“People experimenting with the everyday
contingencies, breakdowns, exceptions,
opportunities, and unintended consequences
of work. . . they are improvising, producing
ongoing responsive variations, and enacting micro-level changes. .”
Innovators (2.5%): Venturesome Interest in new ideas lead out of local peer networks and into cosmopolite networks. Control of substantial financial resources is helpful to cushion possible losses. Must be able to cope with a high degree of uncertainty about an innovation at the time of adoption. Desire for the rash, risky, and the daring. Willing to accept an occasional setback. May not be respected by other members of the local system. Key Role: Imports the innovation from outside the system’s boundaries.
Early Adopters (13.5%): Respect More integrated into the local system than innovators. Localities rather than cosmopolites. Enjoys the greatest degree of opinion leadership in most systems. The “individual to check with” before using a new idea. Local missionary. Role model for many other members of a social system. Key Role: Decreases uncertainty about a new idea by adopting it and conveying a subjective
evaluation of the innovation to near-peers via interpersonal networks.
Early Majority (34%): Deliberate Adopts new ideas just before average member. Interacts frequently with peers. Seldom holds positions of opinion leadership in a system. Provides interconnectedness in the system’s interpersonal networks. Key Role: “Be not the first by which the new is tried, nor the last to lay the old aside.”
Late Majority (34%): Skeptical Adopts ideas just after the average member of a system. Adoption may be both an economic necessity and response to increasing network pressures. Innovations approached with a skeptical and cautious air. System norms must definitely favor adoption. Key Role: Because their resources are scarce, most of the uncertainty about adoption must be
gone and now it is safe to adopt.
Laggards (16%): Traditional Almost no opinion leadership. Most localite of the stages. Many are near isolates in the social networks of the system. Point of reference is the past. Interact primarily with others who have traditional values. Suspicious of innovations. Innovation-decision process is relatively lengthy Key Role: Resistance to adoption is entirely rational from the laggard’s view. They must be
certain that failure will not follow adoption. The system nurtures the laggard’s reality.
First Order Change – Changing within the System Frame
Change within the system frame. Removing a special cause. Action on members within a class. Idea for change usually arises from within the system. Action at the “event management” level. Within the rules of the system. Often problem-solving. Work on the problem.
Second Order Change – Changing the System Frame
Change the system frame. Improving common cause variation. Action on the class or the relationship between the members and the class. Idea for change arises from outside the system.
♦ Action at the “structure” level. ♦ Outside the premises of the system’s rules. ♦ Often, system redesign. ♦ Work on the solution.
Reframing, Innovation and Creative Thinking Reframing teaches a different game, and makes the old one less worth playing. Reframing can add insight about the old frame. Reframing can call attention to a neglected dimension by re-contextualizing it.
What helps you re-frame (think differently) about something? Interview one another Start with a specific example and explore what helped Be prepared to share some of your thoughts, experiences
Reframing Tips
Look at what you are trying to accomplish: goal, aim, think up. Get another perspective, step back, ask an unexpected other. Ask your questions in a relaxed, informal context. Work on your categories. Use “blank stares”/ body language as a flag to reframe. Involve others in naming the problem, getting assumptions. Willingly suspend own assumptions to radically listen. Acknowledge the “assumption” status of your own “truths.” Unintended second-degree change becomes a better alternative. Ask “what” not “why?”
40 Watzlawic P (Beer and Nohria 2000), Weakland J, Fisch R. Change: Principles of Problem Formation and Problem Resolution. New York, NY: Norton, 1984. Chapter 7:Second-Order Change. Pp.77-91.
“The real voyage of discovery consists not in seeking new lands, but in
Take “present” away. Play your own devil’s advocate. Take time. Create a “safe” space for out-of-box thinking. Realize that an emotional block may be present. If so, address it. Don’t assume you know about fear.
Cultural Considerations (Schein41) Culture is the product of social learning. Ways of thinking and behavior that are shared and that work become elements of culture.
Levels of Organizational Culture
Artifacts – what do you see, hear, feel? Espoused values – why do they value what they do? Shared tacit assumptions – what has been learned that is shared, assumed?
Any culture is transformative because you have to unlearn something before you can learn something new. It is the unlearning that is painful and causes resistance to change.
Never start with the idea of changing culture. Always start with the issues the organization faces; only when those business issues are clear should you ask yourself whether the culture aids or hinders resolving the issues. Culture is deep, extensive and stable. It cannot be taken lightly. If you do not manage culture, it manages you.
41 Schein, E. The Corporate Culture Survival Guide: Sense and Nonsense about Culture Change. San Francisco, CA: Jossey-Bass Publishers, 1999.
Kotter’s 8 Steps to Transforming Your Organization Survey42, 43 Review the list of steps and identify if the step is present in your clinical setting. Once you have completed this, develop a “high bar” aim statement and complete the worksheet to plan your action. 1. Establishing a Sense of Urgency
• Examining market and competitive realities • Identifying and discussing crises, potential crises, or major opportunities
2. Creating The Guiding Coalition • Putting together a group with enough power to lead the change • Getting the group to work together like a team
3. Creating a Vision and Strategy • Creating a vision to help direct the change effort • Developing strategies for achieving that vision
4. Communicating the Change Vision • Using every vehicle possible to constantly communicate the new vision and strategies • Having the guiding coalition role model the behavior expected of employees
5. Empowering Broad-Based Action • Getting rid of obstacles • Changing systems or structures that undermine the change vision • Encouraging risk taking and nontraditional ideas, activities, and actions
6. Generating Short-Term Wins • Planning for visible improvements in performance, or “wins” • Creating those wins • Visibly recognizing and rewarding people who made the wins possible
7. Consolidating Gains and Producing More Change • Using increased credibility to change all systems, structures, and policies that don’t fit together and don’t
fit the transformation vision • Hiring, promoting, and developing people who can implement the change vision • Reinvigorating the process with new projects, themes, and change agents
8. Anchoring New Approaches in the Culture • Creating better performance through customer and productivity oriented behavior, more and better
leadership, and more effective management • Articulating the connections between new behaviors and organizational success • Developing means to ensure leadership development and succession
42 Kotter J. Leading Change. Boston, MA: Harvard Business School Press; 1996. 43 John Kotter and Dan Cohen. The Heart of Change: Real-Life Stories of How People Change Their Organizations. August, 2002. ISBN: 1578512549.
During 2002, we aim for 100% access to patient care, how and when they want it, in an enjoyable environment.
It is essential to work on this now due to patient dissatisfaction, staff turnover, and it’s got to be better than it is, and it’s got to be fun. The benefits will include: Better and timely care, increased satisfaction and increased information for the patients. Increase morale, improved lifestyle, decreased turnover and overtime for the staff. Improved community image, cost reductions in care delivery, fewer personnel expenses, increased network growth, and creation of a powerful marketing tool and “must have” rating for the health system. Kotter’s Eight-Stage Change Process To Reach The Top 1. How to Establish a Sense of Urgency -
a. Team meetings: Aim is always on agenda, brainstorming, silent voting b. Examine competitive realities: become the “cadillac” and “must have” c. Utilize visuals: newspaper stories, competitor’s ads d. Utilize benchmarking to: track progress, establish higher goals
2. How to Create a Guiding Coalition - a. Core leadership group - already established, other key positions to be represented b. How can we work as a team more? Delegate duties, responsibilities c. Link with senior leaders regularly
3. How to Develop a Vision and Strategy - a. High Bar Aim established b. Develop strategy to engage all team members for buy-in to Aim.
4. How to Communicate the Change Vision - a. Always on meeting agenda b. Post in staff break area c. Create Screen Saver d. Core leadership group to model change attitude and behavior, i.e. mental model
change about patients and customer service. 5. How to Empower Employees for Broad-Based Action -
a. Hold staff accountable to cause and effect and change ideas b. Abolish complacency, nurture problem-resolution c. Teach tools and methods for implementation of change ideas d. Develop the mindset of “inquiry” not “dictating” e. Make sure team meetings happen regularly f. “If you oppose, propose!!!!”
6. How to Generate Short-Term Wins - a. PDSA Cycle Tool b. Value Compass Tool c. Data wall presentation and update to illustrate accomplishments
7. How to Consolidate Gains and Produce More Change - a. Introduce the Kotter 8 Process to team b. Continues PDSA method of “change and check” for results c. Begin 2002 planning/establish timeline for changes
8. How to Anchor New Approaches In The Culture - a. Direct performance and services to meet patient population needs b. Utilize measurement feedback, give results visually c. Work with “Late Adopters” and “Laggards” d. Leadership development and mentoring
II. Storyboards Creating Storyboards Storyboards help to communicate the highlights of your work to others in a way that is easy to follow and are graphically interesting. The communication is more graphs than words. The format is easy to use, maintain and read, and helps you keep track of milestones passed. Someone completely unfamiliar with the project should be able to understand what was done and why, by following the logic of the graphical data analyses and conclusions Material Suggestions
Form board Colored poster board Pictures Graphics/Data/Flowcharts Spray Glue
Construction Starting on the upper left hand corner of your story board, assemble the following information and graphics to tell your
story. Your facility name and team
♦ Location of facility ♦ List team involved in improvement efforts ♦ Include dates of interaction and a timeline
Aim Statement ♦ Statement you have used to describe what you were trying to accomplish ♦ The statement should include:
The area you worked in (primary vs. specialty) The scope of your aim
♦ If applicable, also describe the extent of spread beyond your initial area and scope Diagnostics
♦ Know your patients information/findings ♦ Know your people information/findings ♦ Know your processes information/findings (flowcharts) ♦ Know your patterns information/findings (data)
Measures – List your measures Improvement Ideas/Changes Implemented
♦ Based on diagnostic findings ♦ Entry, Assignment and Orientation ♦ Initial visit, work-up, plan for care ♦ Customer knowledge ♦ Acute care ♦ Chronic care ♦ Preventive care
Results ♦ Insert your graphs ♦ Include as many of the six standard measures as you have been tracking ♦ Annotate your graphs to show at what point you started testing the major changes
Summary and Next Steps ♦ Describe overall summary and your next steps ♦
Accreditation Council for Graduate Medical Education
The Accreditation Council for Graduate Medical Education (ACGME) is a private professional organization responsible for the accreditation of nearly 7,800 residency education programs. Residency education is the period of clinical education in a medical specialty that follows graduation from medical school, and prepares physicians for the independent practice of medicine. The ACGME's volume of accredited programs makes it one of the largest private accrediting agencies in the country, if not the world. See: http://www.acgme.org
The Care Model – Improving Chronic Care - Ed Wagner
The Chronic Care Model is a framework that has helped us understand the elements of chronic illness care and how these elements fit into front line systems. Clinical microsystem thinking further advances this model through understanding the nature of the work and relationships that go on day in and day out within and between microsystems. For more information see: www.improvingchroniccare.org
(Wagner EH. Chronic Disease Management: What will it take to improve care for chronic illness? ECP, Aug 1998, 1:1; 22-24.)
Clinical Improvement Action Guide
The Clinical Improvement Action Guide is a guide to help clinicians and other stakeholders in the health care delivery system gain new insight that they can readily apply to benefit patients and populations they serve. This book is designed to be a tool to help get down to business and create improvement in your own clinical setting. See www.jcaho.org
Howsyourhealth.org
Howsyourhealth is one of several Dartmouth COOP Clinical Improvement Systems. The Dartmouth COOP is a voluntary (and cooperative) network of independent clinicians. For more than 25 years, the Dartmouth COOP has collaborated with academic researchers to improve health and medical care and develop products that work in busy practice settings. The Dartmouth COOP has published more than 50 articles describing this experience. See www.howsyourhealth.org The Dartmouth COOP Clinical Improvement Systems reaffirm the value of tailoring care based on comprehensive, patient-reported information. The systems generate health reports based on questionnaire responses, identify problems, provide health education, disease management and stimulate improvement. The summary data evaluates the process of care and compares the performance of physicians and medical care organizations. In this way the Dartmouth COOP Clinical Improvement Systems serve the needs of the patient, the "front line," and the "back office."
The Dartmouth COOP Clinical Improvement Systems reaffirm the value of tailoring care based on comprehensive, patient-reported information. The systems generate health reports based on questionnaire responses, identify problems, provide health education, disease management and stimulate improvement. The summary data evaluates the process of care and compares the performance of physicians and medical care organizations. In this way the Dartmouth COOP Clinical Improvement Systems serve the needs of the patient, the "front line," and the "back office."
A cleverly designed website to assist you to improve the way care is delivered to patients. See: www.improveyourmedicalcare.org
Institute for Clinical System Improvement
The Institute for Clinical Systems Improvement (ICSI), a collaboration of health care organizations, is an objective voice dedicated to championing health care quality and to helping its members accelerate the implementation of best clinical practices for their patients. The ICSI program has four elements: improvement commitment, scientific groundwork for health care, support for improvement, and advocacy for health care quality. See: www.icsi.org/
Institute of Medicine Report – Crossing the Quality Chasm
“This is the second and final report of the committee on the Quality of Health Care in America, which was appointed in 1998 to identify strategies for achieving a substantial improvement in the quality of health care delivered to Americans. The committee’s first report, To Err is Human: Building a Safer Health System, was released in 1999 and focused on a specific quality concern – patient safety. This second report focuses more broadly on how the health care delivery system can be designed to innovate and improve care. This report does not recommend specific organizational approaches to achieve the aims set forth. Rather than being an organizational construct, redesign refers to a new perspective on the purpose and aims of the health care system, how patients and their clinicians should relate, and how care processes can be designed to optimize responsiveness to patient needs. The principles and guidance for redesign that are offered in this report represent fundamental changes in the way the system meets the needs of the people it serves.”44 www4.nas.edu/onpi/webextra.nsf/web/chasm?OpenDocument
Idealized Design of Clinical Office Practices
IdealizedDesign™ was developed by the Institute for Healthcare Improvement to bring together organizations that are committed to comprehensive system redesign. The aim is to demonstrate that clinical office practice, with appropriate redesign, can achieve significant improvements in performance to meet today’s urgent social needs for higher-value health care. For more information, see: www.ihi.org/idealized/
44 Institute of Medicine. Crossing the Quality Chasm: A New Health System for the 21st Century. Committee on Quality in Health Care in America. Rona Briere, Ed. Washington, D.C.: National Academy Press, 2001.
Pursuing Perfection is a $20.9-million initiative of The Robert Wood Johnson Foundation intended to help physician organizations and hospitals dramatically improve patient outcomes by pursuing perfection in all of their major care processes. The purpose of the Pursuing Perfection initiative is to show that system-wide efforts are feasible and, through such efforts, set new benchmarks for health care quality and safety. The Institute for Healthcare Improvement is the National Program Office for this initiative. For further information see
www.ihi.org/pursuingperfection/
Additional Helpful Web Links Accreditation Council for Graduate Medical Education www.acgme.org American Academy of Family Physicians www.aafp.org
Assessment of chronic illness care (ACIC) www.improvingchroniccare.org/tools/acic.html.
Dartmouth-Hitchcock Medical Center www.hitchcock.org Directed Creativity – Paul Plsek www.directedcreativity.com Group Practice Improvement Network (GPIN) www.gpin.org Healthcare Improvement Leadership Development www.dartmouth.edu/%7Ececs/hcild/hcild.html Institute for Healthcare Improvement www.ihi.org Institute of Medicine www.iom.edu Quality Healthcare.org www.qualityhealthcare.org Veterans Administration Quality Scholars www.vaqs.dartmouth.edu
Adams K and Corrigan J, eds. Institute of Medicine. Quality Chasm Series: Priority Areas for National Action – Transforming Health Care Quality. The National Academies Press. Washington, DC. March 2003.
Batalden PB, Nelson EC, Edwards WH, Godfrey MM, Mohr JJ: Microsystems in Health Care: Part 9: Developing Small Clinical Units to Attain Peak Performance. Joint Commission Journal on Quality and Safety. 29 (11), November 2003
Batalden PB, Nelson EC, Mohr JJ et al. Microsystems in Health Care: Part 5: How Leaders are Leading. Joint Commission Journal on Quality and Safety. 29(6) 297-308, June 2003.
Bodenheimer T, Loring K, Holman H, Grumbach K. Patient Self-management of Chronic Disease in Primary Care. JAMA, 288(19) 2469-2475, November 20, 2002.
Bodenheimer T, Wagner E, Grumbach K. Improving Primary Care for Patients with Chronic Illness the Chronic Care Model, Part 2. JAMA, 288(15) 1909-1914, October 16, 2002.
Bodenheimer T, Wagner E, Grumbach K. Improving Primary Care for Patients with Chronic Illness. JAMA, 288(14) 1775-1779, October 9, 2002.
Bogner MS, ed. Human Error in Medicine. Hillsdale, NJ: L. Erlbaum Assoc., 1994.
Boulding K. General Systems Theory: The Skeleton of Science. Management Science 1956;2:197-208.
The Continual Improvement Handbook. Brentwood, TN: Executive Learning, 1993.
Deming, WE. Out of the Crisis. MIT Press. Cambridge, MA. August 2000.
Donaldson MS, Mohr JJ. Improvement and Innovation in Health Care Micro-Systems. A Technical Report for the Institute of Medicine Committee on the Quality of Health Care in America. Princeton: Robert Wood Johnson Foundation, 2000. http://books.nap.edu/catalog/10096.html
Gawande AA, Thomas EJ, Zinner MJ, et al. The Incidence and Nature of Surgical Adverse Events in Colorado and Utah in 1992. Surgery. 1999;126(1):66-75.
Godfrey MM, Nelson EC, Wasson JH et al: Planned Services in Microsystems: Part 3. Designing Efficient Services to Meet Patients' Needs. Joint Commission Journal on Quality and Safety, 29(4) 159-171, April 2003.
Grumbach K, Bodenheimer T, A Primary Care Home for Americans: Putting the House in Order. JAMA, 288(7) 889-893, August 21, 2002.
Gustafson D, Cats-Baril W, Alemi F. Systems to Support Health Policy Analysis: Theory, Models, and Uses. Ann Arbor, MI: Health Administration Press, 1993. Chapter 2: Rationality and Policymaking. pp.11-54.
Huber TP, Godfrey MM, Nelson EC et al: Microsystems in Health Care: Part 8: Developing People and Improving Work life: What Frontline Staff Told Us. Joint Commission Journal on Quality and Safety. In Press.
Institute of Medicine. Crossing the Quality Chasm: A New Health System for the 21st Century. Committee on Quality in Health Care in America. Rona Briere, Ed. Washington, D.C.: National Academy Press, 2001.
Institute of Medicine. To Err is Human: Building a Safer Health System. In: Kohn LT, Corrigan JM, Donaldson MS, editors. Washington, DC: National Academy Press, 1999.
Kosnik LK, Espinosa JA. Microsystems in Health Care: Part 7: The Microsystem as a Platform for Merging Strategic Planning and Operations Joint Commission Journal on Quality and Safety. 29(9), September 2003.
Kotter J. Leading Change. Boston, MA: Harvard Business School Press; 1996.
Lane, David and Robert Maxfield, “Strategy Under Complexity: Fostering Generative Relationships”, Long Range Planning, Vol. 29, No. 2, pp. 215-231, 1996
Langley G, Nolan K, Nolan T, Norman T, Provost L. The Improvement Guide: A Practical Approach to Enhancing Organizational Performance. 1st ed. The Jossey-Bass Business & Management Series. San Francisco, CA: Jossey-Bass Publishers; 1996: 293.
Leape LL, Bates DW, Cullen DJ, Cooper J, Demonaco HJ, Gallivan T, et al. Systems Analysis of Adverse Drug Events. Journal of the American Medical Association. 1995;274(1):35-43.
Leape LL, Brennan TA, Laird N, et al. The Nature of Adverse Events in Hospitalized Patients. Results of the Harvard Medical Practice Study –II. New England Journal of Medicine. 1991(324):377-84.
Mohr JJ, Barach P, Cravero JP et al. Microsystems in Health Care: Part 6: Designing Patient Safety into the Microsystem. Joint Commission Journal on Quality and Safety. 29(8), August 2003.
Mohr JJ, Batalden PB. Improving safety on the front lines: the role of clinical microsystems. Qual Saf Health Care 2002; 11:45-50.
Mohr JJ. Forming, Operating, and Improving Micro-systems of Health Care. Dartmouth College, 2000.
Nelson EC, Batalden PB, Huber TP et al: Data and Measurement in Clinical Microsystems: Part 2. Creating a Rich Information Environment. Joint Commission Journal on Quality and Safety, 29(1) 5-15, January 2003.
Nelson EC, Batalden PB, Huber TP et al: Microsystems in Health Care: Part 1. Learning from High-Performing Front-Line Clinical Units. Joint Commission Journal on Quality Improvement, 28(9) 472-493, September 2002.
Nelson, EC, Splaine ME, Godfrey MM et al: Using Data to Improve Medical Practice by Measuring Processes and Outcomes of Care. Joint Commission Journal on Quality Improvement. 26(12) 667-685, December 2000.
Nelson E, Batalden P, Ryer J. Clinical Improvement Action Guide. Oak Brook Terrace, Illinois: Joint Commission on Accreditation of Healthcare Organizations; 1998.
Nelson EC, Batalden PB, Mohr JJ, Plume SK. Building a Quality Future. Frontiers of Health Services Management. 1998;15(1):3-32.
Quinn JB. The Intelligent Enterprise. New York: Free Press, 1992.
Quinn JB, Baruch JJ, Zien KA. Innovation Explosion: Using Intellect and Software to Revolutionize Growth Strategies. New York: Free Press, 1997.
Reason, JT. Managing the Risks of Organizational Accidents. Aldershot, Hants, England: Ashgate, 1997.
Reason, JT. Human Error. New York: Cambridge University Press; 1990.
Rogers EM. Lessons for Guidelines from the Diffusion of Innovations. Joint Commission Journal on Quality Improvement. 21 (7): July 1995. pp. 324 - 328.
Schein, E. The Corporate Culture Survival Guide: Sense and Nonsense about Culture Change. San Francisco, CA., Jossey-Bass Publishers, 1999.
Scholtes P., Joiner B., Streibel B. The TEAM® Handbook, Second Edition. Madison, WI: Oriel Inc.; 2000.
Scott RW. Organizations: Rational, Natural, and Open Systems. Englewood Cliffs, NJ: Prentice Hall, 1981.
Von Bertalanffy L. General System Theory. In: Rapoport LvBaA, editory. General Systems: Yearbook of the Society for the Advancement of General Systems Theory, 1956.
Wasson JH, Godfrey MM, Nelson EC et al: Microsystems in Health Care: Part 4 Planning Patient-Centered Care. Joint Commission Journal on Quality and Safety. 29(5) 227-237, May 2003..
Watzlawick P (Beer and Nohria, ed. 2000), Weakland J, Fisch R. Change: Principles of Problem Formation and Problem Resolution. New York, NY: Norton, 1974. Chapter 7: Second-Order Change. pp. 77-91.
Weick K. Emergent versus Planned Change. In: Beer M and Nohria N, ed. Breaking the Code of Change. Boston, MA: Harvard Business School Press; 2000:223-241.
Weick, K.E. and K.M. Sutcliffe, Managing the Unexpected : Assuring High Performance in an Age of Complexity. 1st ed. University of Michigan Business School management series. San Francisco: Jossey-Bass. xvi, 2001.
Weiner E, Kanki B, Helmreich R. Cockpit Resource Management. 1993.
Wheeler D. Understanding Variation: The Key to Managing Chaos. 2nd ed. Knoxville, TN: SPC Press; 2000.
Zimmerman B and Hayday B. “Generative Relationships,” in Voices in the Field. In process. Please see http://www.change-ability.ca/Exploring_Generative_Relationships.html for further readings.
Table of Tools and Form (by section) I. Assessing Your Practice Workbook
Primary Care Practice Profile 12 Specialty Care Practice Profile 13 Inpatient Unit Practice Profile 14
II. Assess Your Clinical Microsystem
Clinical Microsystem Assessment Tool 16 III. Start to Build Your Own Clinical Microsystem Diagram Microsystem Diagram – blank form 22 IV. The Core Processes of Clinical Microsystems CARE Vital Sign Sheet 38 V. Patient Subpopulations: Planning Patient-centered Care
External Context Map 46 VI. Customer Knowledge
Gaining Customer Knowledge Worksheet 64 Observation and Interview Survey
VII. Measurement and Monitoring Clinical Value Compass Worksheet 77 Balanced Scorecard Worksheet 79 Strategic Performance Compass 80
VIII. Linking Microsystems
Star Generative Relationships 87 IX. Special Themes: Safety, External Environment, Health Professional