Impact Evaluation Report 30 Manoj Mohanan Grant Miller Gerard La Forgia Swapnil Shekhar Kultar Singh Health Improving maternal and child health in India Evaluating demand and supply strategies August 2016
Transcript
Impact Evaluation Report 30
Manoj Mohanan Grant Miller Gerard La Forgia Swapnil Shekhar Kultar Singh
Health
Improving maternal and child health in India Evaluating demand and supply strategies
August 2016
About 3ie The International Initiative for Impact Evaluation (3ie) is an international grant-making NGO promoting evidence-informed development policies and programmes. We are the global leader in funding, producing and synthesising high-quality evidence of what works, how, why and at what cost. We believe that better and policy-relevant evidence will make development more effective and improve people’s lives.
3ie impact evaluations 3ie-supported impact evaluations assess the difference a development intervention has made to social and economic outcomes. 3ie is committed to funding rigorous evaluations that include a theory-based design, use the most appropriate mix of methods to capture outcomes and are useful in complex development contexts.
About this report 3ie accepted the final version of this report, Improving maternal and child health in India: evaluating demand and supply strategies, as partial fulfilment of requirements under OW2.205 issued under Open Window 2. The content has been copy-edited and formatted for publication by 3ie. Due to unavoidable constraints at the time of publication, a few of the tables or figures may be less than optimal. Some appendixes are available online.
All the content is the sole responsibility of the authors and does not represent the opinions of 3ie, its donors or its board of commissioners. Any errors and omissions are also the sole responsibility of the authors. Any comments or queries should be directed to the corresponding author, Manoj Mohanan at [email protected]
Funding for this impact evaluation was provided by 3ie’s donors, which include UK aid, the Bill & Melinda Gates Foundation and the Hewlett Foundation. A complete listing of our donors is provided on the 3ie website.
Suggested citation: Mohanan, M, Miller, G, La Forgia, G, Shekhar, S and Singh, K, 2016. Improving maternal and child health in India: evaluating demand and supply strategies, 3ie Impact Evaluation Report 30. New Delhi: International Initiative for Impact Evaluation (3ie).
3ie Impact Evaluation Report Series executive editors: Jyotsna Puri and Beryl Leach Managing editor: Deepthy Menon Assistant managing editor: Shagun Sabharwal Production manager: Pradeep Singh Copy editor: Veena Baswani Proofreader: Mathew PJ Cover design: John F McGill and Akarsh Gupta Printer: Via Interactive Cover photo: UK Department for International Development
Improving maternal and child health in India: evaluating demand and supply strategies
Manoj Mohanan Duke University Grant Miller Stanford University National Bureau of Economic Research Gerard La Forgia The World Bank Swapnil Shekhar Sambodhi Research and Communications Kultar Singh Sambodhi Research and Communications
3ie Impact Evaluation Report 30
August 2016
i
Acknowledgements We are grateful to 3ie, the International Initiative for Impact Evaluation and the Department of International Development (DFID-India) for their financial support of this study. Our special thanks to Howard White and Jyotsna Puri for their valuable inputs throughout the project. We would also like to acknowledge the financial support we received from the World Bank for the provider incentives experiment that we conducted in rural Karnataka.
We are extremely grateful to the State Departments of Health & Family Welfare, Governments of Gujarat and Karnataka for making this research possible and for the timely support and feedback provided to us. We would like to give special acknowledgement to the Principal Secretary & Commissioner (Health & Family Welfare) and all the State Health officials and district officials that we met and interacted with during the course of the Gujarat evaluation, in particular, Dr Amarjeet Singh, Smt. V.L. Joshi and Dr N.B. Dholakia.
We are very thankful to the immense support we received from the Project Administrators, Deputy Directors and Joint Directors at the Karnataka Health System Development & Reforms Project (KHSDRP) during the study period. In particular, our special thanks goes out to Dr Vandita Sharma, Mr Selva Kumar, Dr Suresh Mohammed, Mr Raghavendra Jannu, Mr Atul Tiwari, Dr Nagaraj, Dr Sridhar, Dr Prakash Kumar and Dr Amruteshwari for their immense support to our data collection efforts in Karnataka. We gratefully acknowledge the Department of Women and Child Welfare, all the state and district officials, Aanganwadi workers and ASHA workers for supporting our field teams during the data collection phase.
At Duke, the study was led by Manoj Mohanan with invaluable research support from Katherine Donato and Yulya Truskinovsky in the core research team, and with the engagement of several colleagues who contributed to the research study: Ayaba Worjoloh, Divya Rajan, Valeska Araujo, Arielle Bensimon and Tulsi Patel. We would like to acknowledge Manveen Kohli for her outstanding project management; Margaret Pendzich for her invaluable contract and financial management; Ayaba Worjoloh for her significant technical contributions on the validation study; Harris Solomon for his insights and guidance on the qualitative research; Joshua Tootoo and the entire team at GIS Lab for their timeliness and efficiency in generating the cluster maps, and Bhartendu Trivedi for supporting the field-monitoring efforts in Karnataka.
At Stanford, the study was led by Grant Miller with the engagement of Kimberly Babiarz as a contributing author on the Gujarat evaluation. Our special thanks to Vinny Bhutani for his technical guidance and Nomita Divi for excellent administrative and logistics support.
A special recognition and thanks to Jerry La Forgia at the World Bank for his strategic leadership; Marcos Vera-Hernandez at the University of London for his continuous guidance and contributions through each stage of the project – from early discussions on the research design to later stages of data analysis and report writing,
ii
and to Sebastian Bauhoff at the Centre for Global Development for his collaboration on the Gujarat evaluation. We would also like to acknowledge Claudia Wolff for her technical assistance on the Karnataka evaluation.
At Sambodhi, the study was led by Kultar Singh with key contributions from Swapnil Shekhar on the Gujarat evaluation. We are thankful to the team at Sambodhi Research & Communications Pvt. Ltd. for their collaboration on the IMATCHINE project. We highly appreciate the proper adherence of the study protocols in the fieldwork conducted by the field associates, investigators and supervisors of the study. We especially value the excellent management of the field surveys by Razdam Rahman and Anil Lobo in Gujarat and Karnataka, respectively, and are also thankful to Pragya Pranjali, Manish Kumar, Varun Bangia and Anuradha R (Consultant) for the overall management and monitoring of the data collection efforts on the validation study. Our appreciation goes out to Cathy Mathews, Vivek Khanna, Shreya Sood and Manoj for their contributions to the preparatory phase in Karnataka.
We would also like to acknowledge Anirudh Krishna who carried out the first phase of the qualitative component along with Kripa Ananthpur. For the in-depth interviews and focus group discussions in the later phase, we would like to thank the team of the Foundation for Research in Health Systems (FRHS), with special thanks to Nirmala Murthy, Alka Barua, Kavita Pawar, Gayathri Raghuraman and Kaveri Gaurav.
We immensely value the guidance and inputs we received from various stakeholders at the research design stage and throughout the course of the project, and from the following contributors: Paolo Belli, Patrick Mullen, Vikram Rajan, Somil Nagpal, Shyama Nagarajan at the World Bank; Billy Stewart at DFID; Sujatha Rao, former Secretary of the Ministry of Health & Family Welfare of India; Vinod Paul at AIIMS; Dinesh Agarwal at UNFPA; Srinath Reddy at PHFI; Bhawani Tripathy at UNICEF; Veena Das and Ranen Das and the staff of ISERDD; Dr Sharad Iyengar and Dr Kirti Iyengar at ARTH; Dr Harshad Vaidya at Alka Hospital, Gujarat; Amarjit Singh, Suneeta Mittal, Lalit Baveja, Sunesh Kumar, Dr Dutta for a panel discussion in Delhi on provider practices relating to maternal/birthing and neonatal care; all the OB/GYN specialists organised by Asha Shekhar and Suresh Reddy for focus group discussions in Mysore; Jane Chen, Raghu Dharmaraju, Rahul Panicker, Rajan Patel at EMBRACE; Pooja Sharma and Sanjay Mittal at Medanta; Beena Varghese at KHPT; the OB/GYN specialists we met in Delhi, Bangalore and Haveri for piloting of our provider incentives contracts.
Most importantly, we are extremely grateful to all the private obstetric care providers who agreed to participate in the study and all the respondents and mothers who participated in our surveys.
iii
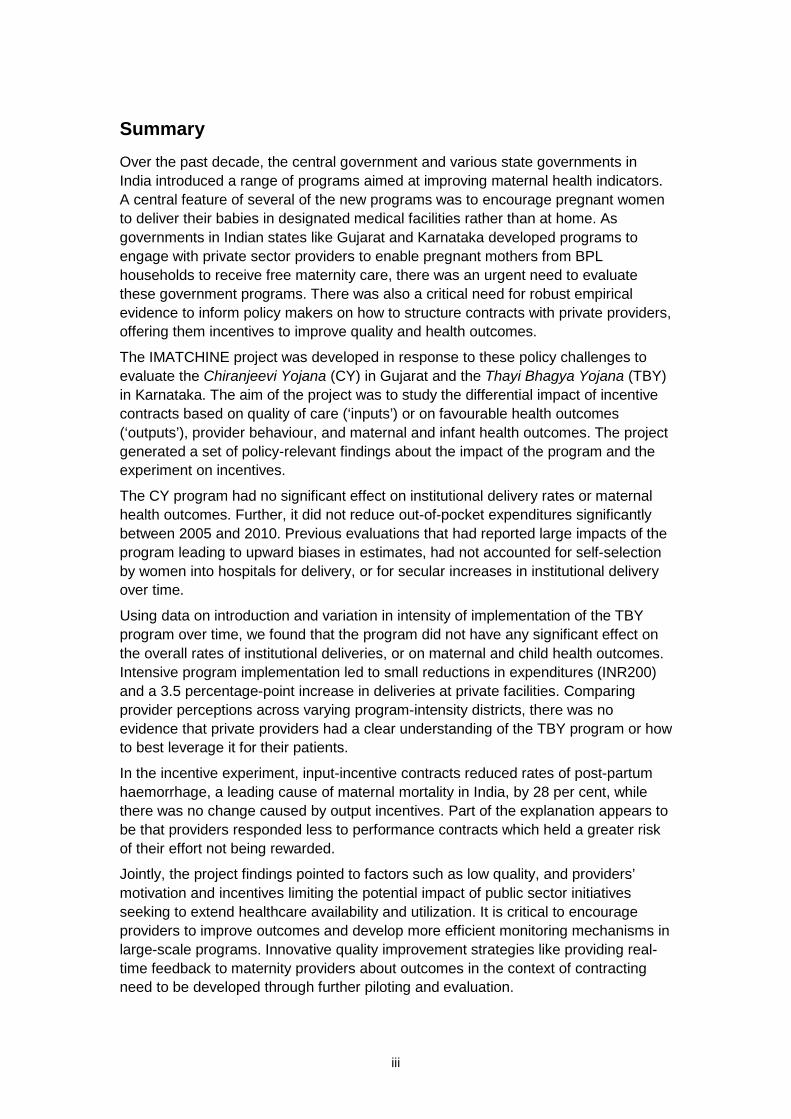
Summary Over the past decade, the central government and various state governments in India introduced a range of programs aimed at improving maternal health indicators. A central feature of several of the new programs was to encourage pregnant women to deliver their babies in designated medical facilities rather than at home. As governments in Indian states like Gujarat and Karnataka developed programs to engage with private sector providers to enable pregnant mothers from BPL households to receive free maternity care, there was an urgent need to evaluate these government programs. There was also a critical need for robust empirical evidence to inform policy makers on how to structure contracts with private providers, offering them incentives to improve quality and health outcomes.
The IMATCHINE project was developed in response to these policy challenges to evaluate the Chiranjeevi Yojana (CY) in Gujarat and the Thayi Bhagya Yojana (TBY) in Karnataka. The aim of the project was to study the differential impact of incentive contracts based on quality of care (‘inputs’) or on favourable health outcomes (‘outputs’), provider behaviour, and maternal and infant health outcomes. The project generated a set of policy-relevant findings about the impact of the program and the experiment on incentives.
The CY program had no significant effect on institutional delivery rates or maternal health outcomes. Further, it did not reduce out-of-pocket expenditures significantly between 2005 and 2010. Previous evaluations that had reported large impacts of the program leading to upward biases in estimates, had not accounted for self-selection by women into hospitals for delivery, or for secular increases in institutional delivery over time.
Using data on introduction and variation in intensity of implementation of the TBY program over time, we found that the program did not have any significant effect on the overall rates of institutional deliveries, or on maternal and child health outcomes. Intensive program implementation led to small reductions in expenditures (INR200) and a 3.5 percentage-point increase in deliveries at private facilities. Comparing provider perceptions across varying program-intensity districts, there was no evidence that private providers had a clear understanding of the TBY program or how to best leverage it for their patients.
In the incentive experiment, input-incentive contracts reduced rates of post-partum haemorrhage, a leading cause of maternal mortality in India, by 28 per cent, while there was no change caused by output incentives. Part of the explanation appears to be that providers responded less to performance contracts which held a greater risk of their effort not being rewarded.
Jointly, the project findings pointed to factors such as low quality, and providers’ motivation and incentives limiting the potential impact of public sector initiatives seeking to extend healthcare availability and utilization. It is critical to encourage providers to improve outcomes and develop more efficient monitoring mechanisms in large-scale programs. Innovative quality improvement strategies like providing real-time feedback to maternity providers about outcomes in the context of contracting need to be developed through further piloting and evaluation.
iv
Contents Acknowledgements ...................................................................................................I Summary .................................................................................................................. III List of figures and tables ........................................................................................ V Abbreviations and acronyms ................................................................................ VI 1. Introduction .........................................................................................................1 2. Evaluation of the Chiranjeevi Yojana ................................................................3
2.1 Objective of the Chiranjeevi Yojana evaluation ..........................................3 2.2 Evaluation method and analysis .................................................................4 2.3 Key findings ..................................................................................................5
3. Evaluation of the Thayi Bhagya Yojana.............................................................7 3.1 Overview of the Thayi Bhagya Yojana ........................................................7 3.2 Methodology ......................................................................................... 7 3.3 Key findings .......................................................................................... 8
4. Experimental evaluation of performance incentive contracts ....................... 14 4.1 Context ............................................................................................... 14 4.2 Methodology, theory of change and analysis ....................................... 15 4.3 Key findings ........................................................................................ 18
5. Challenges in implementation and lessons learned....................................... 26 5.1 Chiranjeevi Yojana in Gujarat .............................................................. 26 5.2 Thayi Bhagya Yojana in Karnataka ...................................................... 27 5.3 Experimental interventions .................................................................. 28
6. Policy implications and next steps .................................................................. 29 6.1 Chiranjeevi Yojana and Thayi Bhagya Yojana ...................................... 30 6.2 Performance-incentives experiment ..................................................... 31
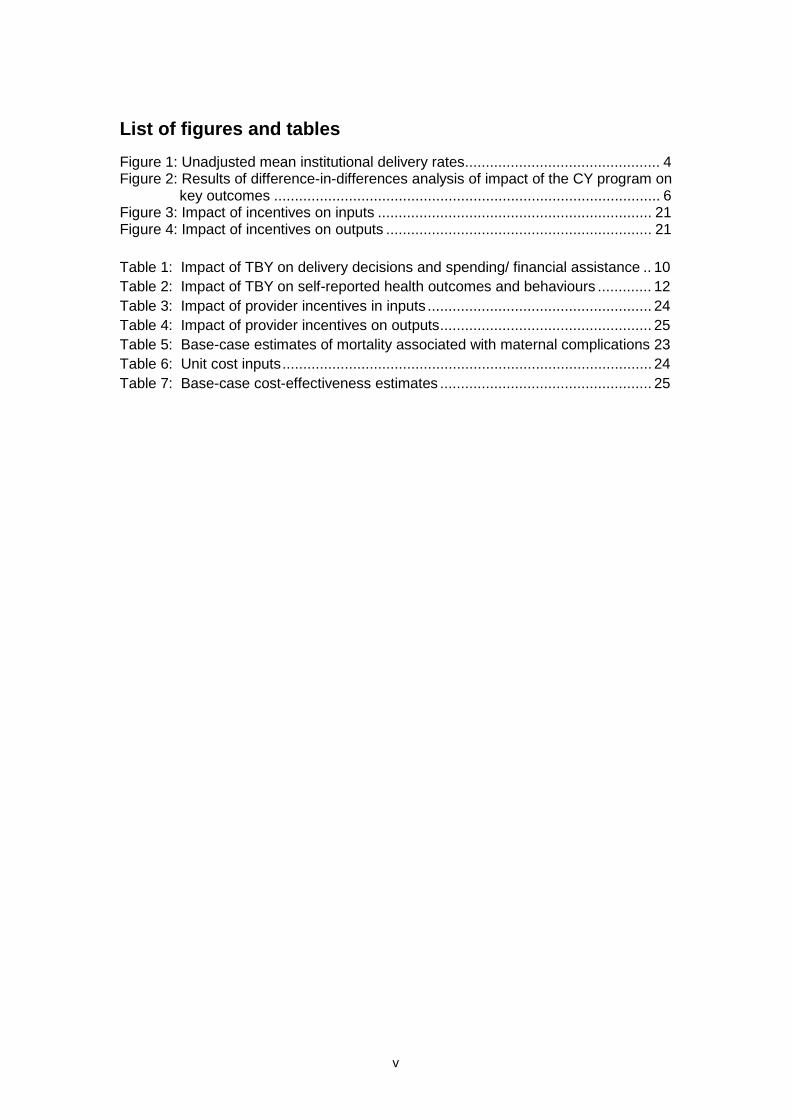
List of figures and tables Figure 1: Unadjusted mean institutional delivery rates ............................................... 4 Figure 2: Results of difference-in-differences analysis of impact of the CY program on
key outcomes ............................................................................................. 6 Figure 3: Impact of incentives on inputs .................................................................. 21 Figure 4: Impact of incentives on outputs ................................................................ 21 Table 1: Impact of TBY on delivery decisions and spending/ financial assistance .. 10 Table 2: Impact of TBY on self-reported health outcomes and behaviours ............. 12 Table 3: Impact of provider incentives in inputs ...................................................... 24 Table 4: Impact of provider incentives on outputs ................................................... 25 Table 5: Base-case estimates of mortality associated with maternal complications 23 Table 6: Unit cost inputs ......................................................................................... 24 Table 7: Base-case cost-effectiveness estimates ................................................... 25
vi
Abbreviations and acronyms ANC antenatal care
ASHA accredited social health activist
AWW Anganwadi Worker
BPL below poverty line
C-section caesarean section
CY Chiranjeevi Yojana
DD difference-in-differences
DLHS District Level Household & Facility Survey
FRHS Foundation for Research in Health Systems
GDP gross domestic product
HRITF Health Results Innovations Trust Fund
IAS Indian Administrative Service
IMATCHINE Improving Maternal and Child Health in India: Evaluating Demand and
Supply Side Strategies
ICER incremental cost-effectiveness ratio
JSY Janani Suraksha Yojana
MoU memorandum of understanding
MMR maternal mortality ratio
NRHM National Rural Health Mission
OB/GYN obstetrics and gynaecology
RDD regression discontinuity design
SC Scheduled Castes
ST Scheduled Tribes
TBY Thayi Bhagya Yojana
WHO World Health Organisation
1
1. Introduction The Special Census report published by the Registrar General of India in December 2013 reported estimates from the Census’ Sample Registration System. It indicated that the maternal mortality ratio (MMR) in India had fallen from 212 in 2007–2009 to 178 in 2010–2012. While the decline is certainly encouraging, the national average for India continues to be higher than that for the rest of South Asia. Over the past decade, the central government and various state governments in India introduced a range of programs aimed at improving maternal health indicators. A central feature of several of the new programs was to encourage pregnant women to deliver their babies in designated medical facilities rather than at home.
Gujarat and Karnataka are among the most economically progressive states in India, and have been known globally for several innovations in governance, technology and public administration. In spite of their economic prowess (Karnataka due to its globally renowned technology centres in Bangalore, and Gujarat due to its model of state-promoted economic development), health indicators in these two states were relatively poor. In 2007–2008, according to national estimates from DLHS-2 (District Level Household & Facility Survey), Gujarat’s indicators were just above the national averages, with 56 per cent of women delivering babies in healthcare facilities, and 54 per cent receiving at least 3 antenatal care (ANC) visits. National averages for institutional delivery rates and the share of women receiving 3 ANC visits in 2007–2008 were 47 per cent and 50 per cent, respectively, while indicators were 65 per cent and 81 per cent, respectively. By 2009, the state governments in both Gujarat and Karnataka had initiated programmes that contracted with private sector providers to enable pregnant women from BPL (Below Poverty Line) households to receive free maternity care.
Launched in 2005, Gujarat’s Chiranjeevi Yojana (CY) won international accolades within a year of its launch and was widely regarded as a successful model of public-private partnership even though the empirical evidence of the program’s impact was limited. Despite the absence of rigorous evidence on the effectiveness of these programs, many other Indian states (including Bihar, Madhya Pradesh, Orissa, Uttaranchal, Uttar Pradesh and West Bengal) started planning to implement or design their own versions of the CY program. Meanwhile, the state government of Gujarat was hearing growing concerns that a large share of eligible women were still choosing to deliver babies elsewhere instead of availing the free institutional delivery under CY. A policy dialogue between the project investigators (La Forgia, Miller and Mohanan) and the Government of Gujarat in 2009 created an opportunity to undertake a rigorous evaluation of the CY program. Simultaneously, the Government of Karnataka, which was implementing a similar public–private partnership initiative in the northern districts1 of the state under the Thayi Bhagya Yojana (TBY) program, was considering offering the program to the rest of the state. It was also interested in learning how simultaneous improvements in supply-side 1 The six ‘C’ category districts of Gulbarga, Bidar, Raichur, Koppal, Bijapur and Bagalkot and the backward district of Chamarajanagar.
2
incentives among OB/GYNs (Obstetrics and Gynaecology) might produce additional benefits (i.e., improvements in medical care quality and better health outcomes) beyond those achieved by programs like CY and TBY.
The IMATCHINE (Improving Maternal and Child Health in India: Evaluating Demand and Supply Side Strategies) project was developed in response to these policy challenges with two key objectives:
• To evaluate the impact of two such programs in the states of Gujarat (Chiranjeevi Yojana – CY) and Karnataka (Thayi Bhagya Yojana – TBY) on rates of institutional delivery and on maternal and child health outcomes;
• To provide robust empirical evidence to inform policy makers on how to structure contracts with private providers to incentivize them to improve quality of care and outcomes for maternal and neonatal health.
A major part of the IMATCHINE project was a large random evaluation in Karnataka, aimed at answering questions on how to structure incentive contracts for improving performance. The experiment was designed to study the differential impact of incentive contracts that rewarded providers based on quality of care (‘inputs’), and contracts that rewarded providers for favourable health outcomes (‘outputs’) on provider behaviour, quality of care, and maternal and infant health. The incentive contract payments in this experiment were funded by a grant from the World Bank’s Health Results Innovations Trust Fund – HRITF (Grant number TF099435).
Prior to the launch of the evaluation project the state government of Karnataka had also planned a conditional cash subsidy program (Thayi Bhagya Plus), where BPL women delivering in empanelled private sector hospitals would receive cash subsidy benefits. Although the government had initially planned to randomise the roll out of introduction of this conditional cash transfer in 24 districts, it announced the state-wide implementation of a reduced cash transfer program (Thayi Bhagya Plus) in March 2011 (See Appendix 1 for details). As a result, our evaluation of both the CY and the TBY programs relied on quasi-experimental designs where we implemented difference-in-differences analyses, using retrospective data collected in the project as well as publicly available data.
This project report summarizes the experience from undertaking these evaluations during the past five years, and the main findings from the research conducted so far.
The principal findings from our evaluations can be summarized as follows:
• Chiranjeevi Yojana
o The CY program had no significant effect on institutional delivery rates or maternal health outcomes;
o The program did not reduce out-of-pocket expenditures significantly between 2005 and 2010; and
3
o Previous evaluations that found large program impacts did not account for self-selection of women into hospitals for delivery, or for secular increases in institutional delivery over time, thus leading to upward biases in estimates.
• Thayi Bhagya Yojana
o Using data on introduction of the program, and variation in the intensity of implementation of the program over time, we found that the TBY program did not have any significant effect on rates of institutional deliveries, or on maternal and child health outcomes; and
o Comparing provider perceptions across varying program intensity districts, we found no evidence that private providers had a clear understanding of the TBY program or how to best leverage it for their patients.
• Experimental evaluation of performance contracts
o Providers in the input-based contracts arm appeared to have significantly reduced rates of postpartum haemorrhages by more than a quarter compared to the control group;
o Outcome contracts providers did not show similar improvements; and
o Part of the explanation appeared to be that provider behaviour responded less to incentive contracts with the greater risk of provider effort not being rewarded.
This report covers three related, but independent studies that were conducted as part of the IMATCHINE project: evaluations of the CY and TBY programs, and the experimental evaluation of incentive contracts. As a result, this report can only highlight key findings and lessons learned, while referring the reader to specific publications or draft manuscripts that are included in the appendix. Including details on each of the three studies would make this report unwieldy. The rest of the report is as follows: Sections 4, 5, and 6 summarize the three evaluations, including institutional contexts of the policies studied, research methods, analysis and key findings from each study.
2. Evaluation of the Chiranjeevi Yojana
2.1 Objective of the Chiranjeevi Yojana evaluation The objective of the CY program is to promote institutional deliveries among women in BPL households, especially in the rural areas of Gujarat. In 2006, the government introduced the CY program in response to the acute unavailability of trained obstetricians in public sector facilities in rural areas. The policy aimed at leveraging the presence of a large and vibrant private sector in healthcare across the state by contracting with a large number of private sector providers. The latter would agree to provide free maternity facilities to BPL women in exchange for INR 1,600 reimbursement per delivery. The program was launched in early 2006 in five northern
4
districts, and scaled out to the rest of the state by the end of 2007. By 2012, over 800 private sector hospitals became participants and the program helped pay for more than 800,000 deliveries. The objective of the evaluation was to assess the impact of the CYprogram on institutional delivery rates as well as health, costs of delivery and other socio-economic outcomes. Previous evaluations had estimated that this program had resulted in a 90 per cent reduction in maternal deaths and a 60 per cent reduction in neonatal deaths among beneficiaries in Gujarat. The CY programme received the Asian Innovations Award in 2006. The large positive impacts of the programme reported by previous studies had faced critical limitations, including self-selection of women into institutional delivery, reporting inaccuracies by hospitals, and secular improvements in outcomes related to rapid economic growth in the region.
2.2 Evaluation method and analysis
2.2.1 Methodology
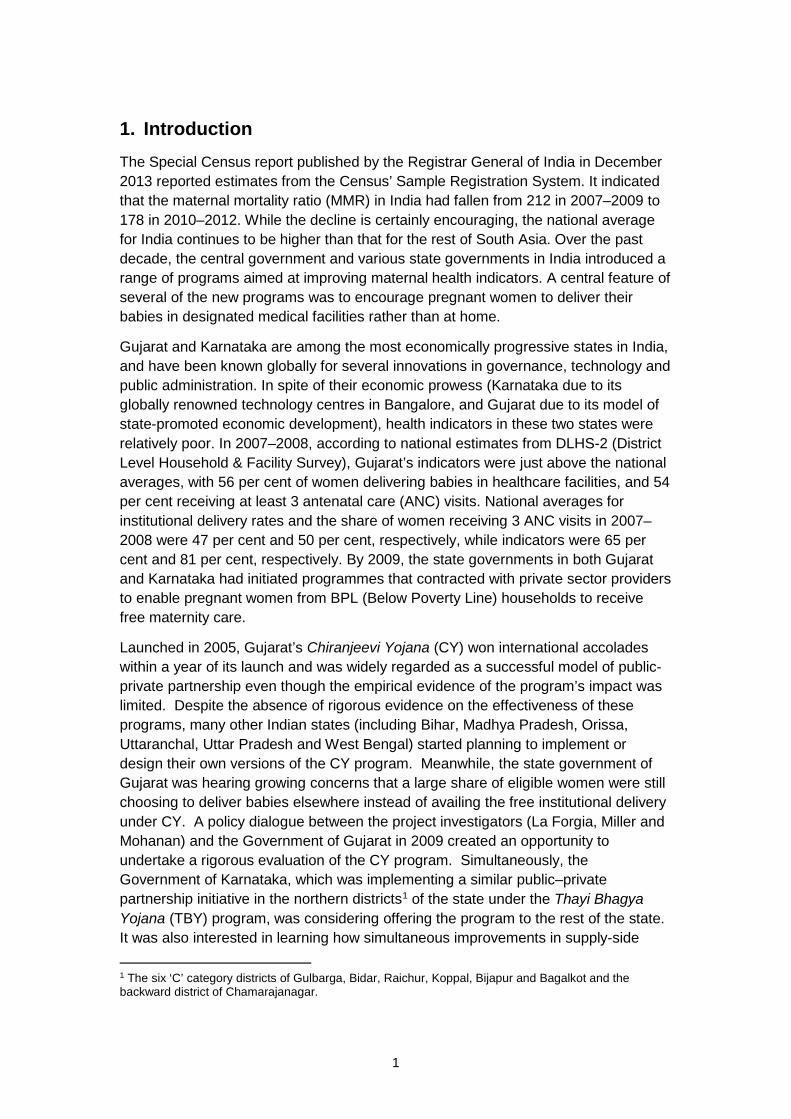
Our evaluation analysed the expansion of the CY program across Gujarat’s districts between 2005 and 2007. By 2013, approximately 800 private sector hospitals were participating in the program that had helped pay for more than 800,000 deliveries. We collected data on retrospective birth histories and outcomes from 5,597 households in all the districts in Gujarat as part of this study. The sample included households that had assets within 5 points of the eligibility cut-off to be considered BPL (this does not include the poorest or the richest sub-groups). We combined this data with the rollout dates of the CY program across districts to implement a difference-in-differences (DD) analysis.
Data from an additional 6,484 households from the DLHS-3 in Gujarat were used in parallel analyses. Figure 1 from our paper published in the March 2014 Bulletin of WHO shows unadjusted means of rates of institutional delivery across early and late implementing districts in Gujarat.
Figure 1: Unadjusted mean institutional delivery rates
Source: Bulletin of WHO, 2014
5
2.2.2 Theory of change
The analysis was aimed at estimating the impact of the program on maternal and child health outcomes. The underlying theory of change, although not specified ex-ante, was that the programme would lead to increases in rates of institutional delivery. These aggregate changes, in turn, would provide higher quality of obstetric care, thus leading to improvement of key maternal and child health indicators. Similarly, since the program provided access to free institutional delivery, households would experience declines in expenditures for deliveries.
2.2.3 Analysis
We conducted multivariate DD ordinary least-squares regression analyses to determine if changes in our primary outcomes were associated with the staggered introduction of the CP program across Gujarat’s districts. We relied on the timing of births – as reported by mothers in retrospective birth histories collected in both surveys – together with the mothers’ district of residence to determine if CY had been introduced in the district when a delivery occurred. The key assumption that the DD analysis requires is the parallel trends assumption: that the key outcomes would change at the same rate in the absence of the interventions. The DD method does not strictly require that the two regions have the same levels, but instead requires that they would experience similar trends in the absence of the program. We empirically tested this assumption using data from previous data waves of DLHS. (Please refer to our paper in the March 2014 Bulletin of WHO for further details on methods and data. Further details on the parallel trends assumptions are included on supplementary materials for the paper posted on our website: http://cohesiveindia.org/IMATCHINE/CY-BWHO2013Appendix.pdf)
2.3 Key findings
Our findings from the DD analysis indicate that the CP program was not associated with changes in the probability of institutional delivery (including delivery at private institutions), obstetric complications or reductions in households’ out-of-pocket expenditures for deliveries. Results from the analysis are shown in Figure 2 on the following page. The program was also not associated with changes in the incidence of birth-related maternal complications, the use of antenatal and postnatal services or the use of neonatal intensive care.
Figure 2: Results of difference-in-differences analysis of impact of the CY program on key outcomes
Source: World Health Organisation
7
3. Evaluation of theThayi Bhagya Yojana 3.1 Overview of the Thayi Bhagya Yojana
The TBY in Karnataka is a multi-component programme comprising four components: (1) Janani Suraksha Yojana (JSY); (2) Prasooti Araike; (3) Madilu kits, and (4) Thayi Bhagya Yojana (TBY).
The Janani Suraksha Yojana (JSY) is a NRHM-funded national safe motherhood program. It aims at encouraging institutional deliveries primarily in the public sector through financial incentives provided for the first two births for all BPL mothers in the state. Prasooti Araike is a program that provides cash assistance (INR 2,000) to enable pregnant mothers to consume a more nutritious diet and increase the number of ANC visits. The program provides INR 1,000 to mothers at their second and third trimester ANC visits. The Madilu kits provided to BPL mothers who deliver in public health centres aim to increase institutional delivery rates and include 19 items, including a mosquito net, blanket, sanitary pads and bed sheets.
The last component of the program, the Thayi Bhagya Yojana (TBY), which is the central focus of this evaluation, is similar to the CY in Gujarat. The state contracted with private sector providers in the six ‘C’ category districts of Gulbarga, Bidar, Raichur, Koppal, Bijapur and Bagalkot, and the district of Chamarajanagar to provide free obstetric care services to BPL mothers in these areas. One major difference relative to CY was that the TBY program paid INR 3,000 in reimbursement for each delivery, compared to INR 1,600 in CY. In addition, in March 2010, the state also announced that the TBY Plus program across all the districts in Karnataka would provide a cash incentive of INR 1,000 for women who were SC/ST and BPL, and above 19 years of age, for their first two live deliveries in private hospitals.
The TBY program (Gujarat CY type program) was rolled out in 2009, with most of the implementation focused in the two districts of Bijapur and Bagalkot. For example, in the first year in 2009, 37 of the 62 empanelled private providers were in Bagalkot (15 in Bijapur). By 2014, there were 88 private providers across all the 7districts, of which 51 were in Bijapur and 20 in Bagalkot.
3.2 Methodology
Similar to the CY evaluation, we relied on a DD method using data from a retrospective pregnancy history questionnaire that asked for details about each woman’s three most recent births since 2008. The data was collected in each of the study clusters as part of the incentives experiment conducted between December 2013 and August 2014. The study clusters were in rural areas (at the level of the sub-district) and were predominantly served by private obstetric care providers. While the provider-incentives study relied mainly on data from patients who were served by the providers in the experiment, we also collected data from an additional 9,143 mothers who lived in the study areas and had delivered a baby within two weeks of the survey. As a result, our sample is representative of mothers who were of child-bearing age in rural areas.
8
3.2.1 Theory of change
Similar to our analysis for the CY program, our underlying theory of change, although not specified ex-ante, was that the program would lead to increases in rates of institutional delivery, resulting in higher quality of obstetric care and improvement of key maternal and child health indicators.
3.2.2 Analysis
Our original proposal to 3ie had planned to rely on a phased randomised roll out of a conditional cash transfer component linked to TBY (called TBYPlus) across the rest of the state. However, the state’s decision to launch TBYPlus in March 2011 across the state simultaneously made the planned evaluation of TBYPlus impossible. The DD evaluation of TBY was developed in response to this change in state policy. Since the state had already been implementing TBY in the northern districts for several years and the TBYPlus program was rolled out in the rest of the state in 2011, it would have been difficult to compare trends in these two sets of areas that were implementing different policies. Hence we restricted our data to only the original TBY districts to implement a DD analysis within the districts implementing the TBY program, comparing districts with more intensive implementation to those with less intensive implementation. We defined high versus low intensity based on the number of provider MoUs signed and deliveries conducted under the program using data provided by the Karnataka government. Bagalkot and Bijapur accounted for 81 per cent of 451 MoUs signed in TBY areas, and also accounted for 74 per cent of 90,019 deliveries. Furthermore, this restriction also made more plausible assumptions of parallel trends since these districts were more homogenous in terms of economic and health indicators as well as government policy efforts.
3.3 Key findings
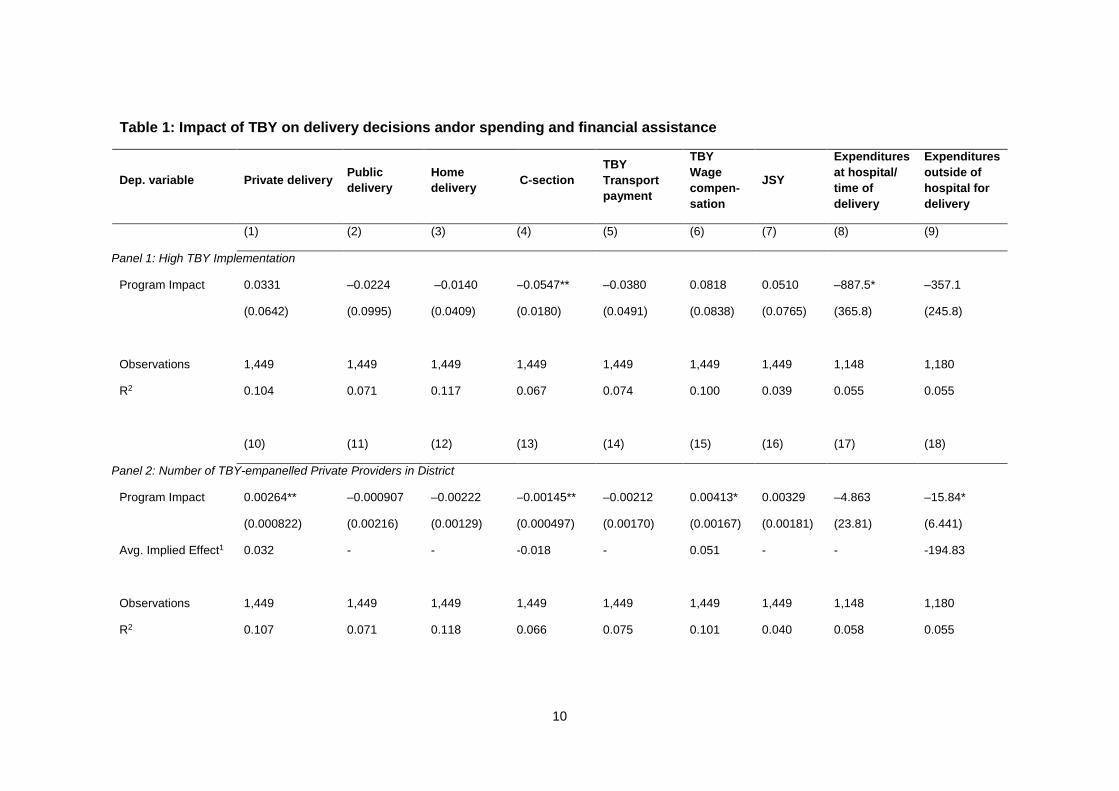
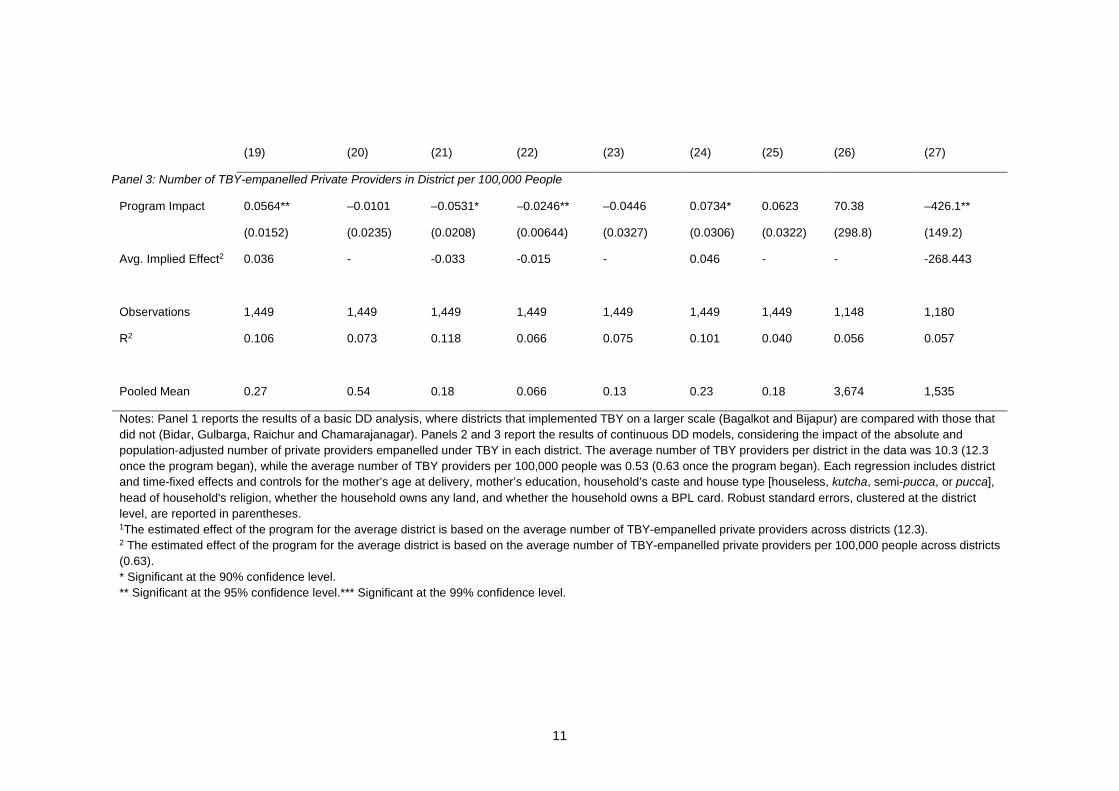
Tables 1 and 2 present the results of three DD analyses of the impact of TBY. In the first panel of each table, districts that implemented the TBY program more intensively (Bagalkot and Bijapur) are compared to those that implemented it less intensively (Bidar, Gulbarga, Raichur and Chamarajanaga). The second and third panels use continuous measures of the intensity of TBY implementation. In the second panel, TBY intensity is measured by the number of private doctors empanelled under TBY each year in the district.2 The third panel presents a similar analysis, with the difference that the TBY intensity is measured by the number of empanelled private providers per 100,000 people.3 In all three panels, controls for the mother’s age at delivery, the mother’s education, the household’s caste and house type (houseless, kutcha, semi-pucca, or pucca), head of the household’s religion, whether the household owns any land, and whether the household owns a BPL card were included, in addition to time and district fixed effects.
2 Data on the number of MoUs signed with TBY providers per district was provided by the Government of Karnataka. 3 Each district’s population estimates were obtained from 2011 Census data.
9
Table 1 shows the impact of the TBY program on household delivery decisions and/or spending and financial assistance. All three panels show significant reductions in C-section rates associated with the TBY program. Based on the average number of TBY-empanelled private providers per district, panels 2 and 3 show an average implied effect of about a 1.5 to 1.8 percentage point reduction. Panels 2 and 3 also show a significant increase in the rate of private deliveries (average implied effect of about 3.5 percentage points), an increased likelihood of receiving TBY wage compensation (average implied effect of about 5 percentage points), and reduced expenditures outside of direct hospital expenses (average implied effect of a reduction of more than INR 200) for households living in districts with greater program intensity.
10
Table 1: Impact of TBY on delivery decisions andor spending and financial assistance
Pooled Mean 0.27 0.54 0.18 0.066 0.13 0.23 0.18 3,674 1,535
Notes: Panel 1 reports the results of a basic DD analysis, where districts that implemented TBY on a larger scale (Bagalkot and Bijapur) are compared with those that did not (Bidar, Gulbarga, Raichur and Chamarajanagar). Panels 2 and 3 report the results of continuous DD models, considering the impact of the absolute and population-adjusted number of private providers empanelled under TBY in each district. The average number of TBY providers per district in the data was 10.3 (12.3 once the program began), while the average number of TBY providers per 100,000 people was 0.53 (0.63 once the program began). Each regression includes district and time-fixed effects and controls for the mother’s age at delivery, mother’s education, household’s caste and house type [houseless, kutcha, semi-pucca, or pucca], head of household's religion, whether the household owns any land, and whether the household owns a BPL card. Robust standard errors, clustered at the district level, are reported in parentheses. 1The estimated effect of the program for the average district is based on the average number of TBY-empanelled private providers across districts (12.3). 2 The estimated effect of the program for the average district is based on the average number of TBY-empanelled private providers per 100,000 people across districts (0.63). * Significant at the 90% confidence level. ** Significant at the 95% confidence level.*** Significant at the 99% confidence level.
12
Table 2: Impact of TBY on self-reported health outcomes and behaviours
Dep. Variable Pre-eclampsia
Severe Bleeding
Severe Fever
Foul-smelling Discharge
Breast-feeding
(1) (2) (3) (4) (5) Panel 1: High TBY Implementation
Program Impact –0.0626 –0.0115 0.0435 0.0319 –0.193*
(0.0451) (0.0633) (0.0453) (0.0323) (0.0930)
Observations 1,440 1,439 1,441 1,440 1,420
R2 0.065 0.058 0.025 0.046 0.225
(6) (7) (8) (9) (10)
Panel 2: Number of TBY-empanelled Private Providers in District
Program Impact –0.00121 0.00219 0.00283*** 0.000895 –0.00438
Panel 3: Number of TBY-empanelled Private Providers in District per 100,000 People
Program Impact –0.0161 0.0412 0.0549*** 0.0247 –0.0666
(0.0187) (0.0230) (0.0109) (0.0129) (0.0419)
Avg. Implied Effect2 - - 0.035 - -
Observations 1,440 1,439 1,441 1,440 1,420
R2 0.064 0.059 0.028 0.047 0.226
Pooled Mean 0.14 0.13 0.049 0.029 0.83
Notes: Panel 1 reports the results of a basic DD analysis, where districts that implemented TBY on a larger scale (Bagalkot and Bijapur) are compared with those that did not (Bidar, Gulbarga, Raichur and Chamarajanagar). Panels 2 and 3 report the results of continuous DD models, considering the impact of the absolute and population-adjusted number of private providers empanelled under TBY in each district. The average number of TBY providers per district in the data was 10.3 (12.3 once the program began), while the average number of TBY providers per 100,000 people was 0.53 (0.63 once the program began). Each regression includes district and time-fixed effects and controls for the mother's age at delivery, mother’s education, household’s caste and house type [houseless, kutcha, semi-pucca, or pucca], head of household's religion, whether the household owns any land, and whether the household owns a BPL card. Robust standard errors, clustered at the district level, are reported in parentheses. 1 The estimated effect of the program for the average district is based on the average number of TBY-empanelled private providers across districts (12.3). 2 The estimated effect of the program for the average district is based on the average number of TBY-empanelled private providers per 100,000 people across districts (0.63). * Significant at the 90% confidence level. ** Significant at the 95% confidence level. *** Significant at the 99% confidence level.
Table 2 reports the impact of the TBY program on self-reported health outcomes and behaviours. Overall, there do not appear to be major impacts on these outcomes, apart from increases in rate of severe fever (average implied effect of 3.5 percentage
13
points), and some evidence of a decrease in the rate of breastfeeding by women who lived in districts with higher TBY intensity. While causality cannot be determined from these data, it is plausible that these effects are due to increased awareness of health issues related to an increase in institutional delivery rates, rather than actual increases in adverse health outcomes.
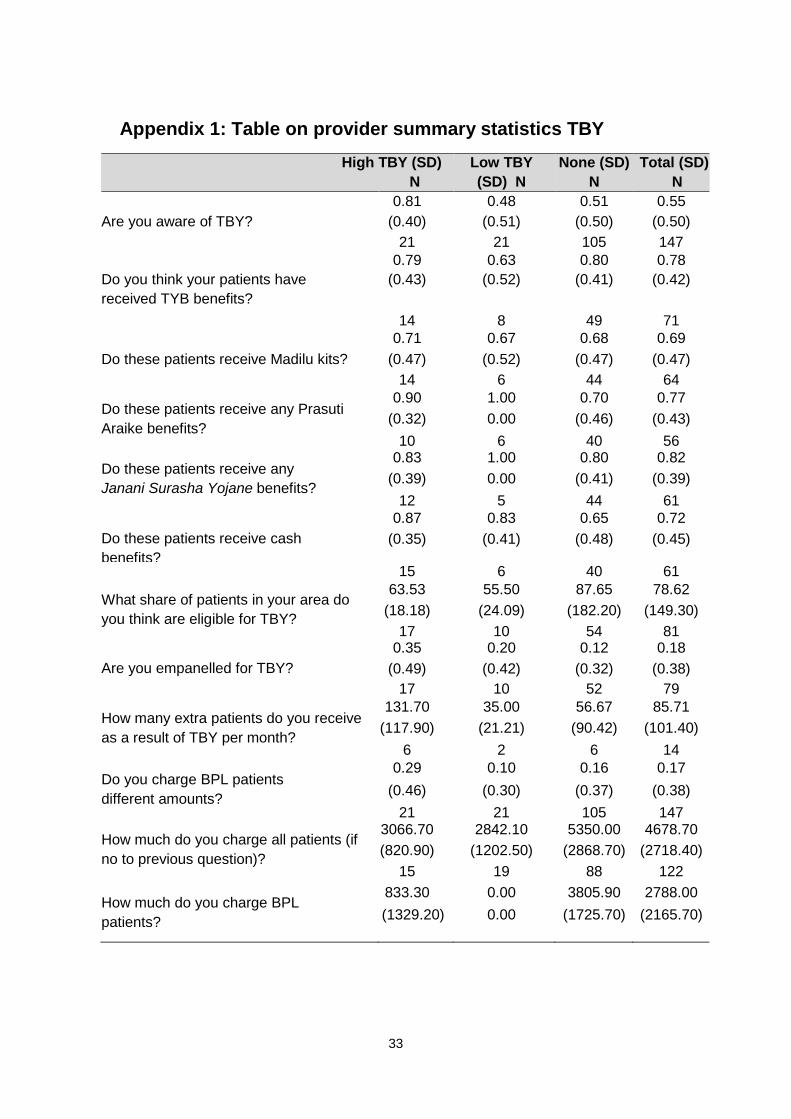
In analysing provider awareness and perceptions of the TBY program, the sample was divided into three groups: high program intensity districts (Bijapur and Bagalkot), lower program intensity districts (Gulbarga, Bidar, Raichur, Koppal and Chamarajanagar), and the remaining districts that were not directly targeted as part of the TBY program (for provider summary statistics TBY, see Appendix 1). From the experimental sample, we have data from 147 providers, of whom 21 are in high intensity districts, 21 are in low intensity districts, and 105 are in no-TBY districts.
Overall, over half the sample (55 per cent) was aware of the TBY programme. In high-intensity areas over 80 per cent of providers in our sample reported being aware of TBY, compared with 48 per cent in low-intensity districts. However, over half of the providers in the non-TBY districts also reported knowing about the programme. Similarly, a significant percentage (12 per cent) of providers from the non-TBY districts reported being empanelled-TBY providers (compared with 35 per cent in high intensity districts and 20 per cent in low intensity districts). Knowledge about the individual components of the program, including the Madilu kits, Prasooti Araike benefits and Janani Suraksha Yojana benefits, was about the same across the three groups. Providers in the non-TBY districts were also somewhat less likely to answer, ‘I don’t know’ to questions about the individual program. The lack of clear pattern across the three groups suggested that private providers did not have a clear understanding of the TBY program or how to best leverage it for the benefits of their patients.
We also asked providers more general questions about fees they charged for regular deliveries, with a focus on differences between BPL and non-BPL patients. Overall, 17 per cent of providers reported charging BPL and non-BPL patients differently. Among the 83 per cent of providers who did not discriminate in price, fees in TBY districts were approximately INR 1,300 lower than in districts implementingthe TBY. Among providers who charged a lower fee from BPL women, the difference in charges was the largest in the TBY districts (INR 3,250 in high and INR 3,500 in low, compared with INR 1,917 in other districts in the state).
Finally, when asked how they would respond if the government were to provide cash or subsidies to BPL patients, the majority in all three groups (64 per cent) responded that they would be able to provide better care because women could afford more, while between 20 per cent and 30 per cent of providers reported that there would be no changes to the quality of care provided.
14
4. Experimental evaluation of performance incentive contracts 4.1 Context
Given the growing interest among various national and state governments to contract with the private sector, there is potentially scope for including explicit rewards for good performance in these contracts. In particular, even if programs like CY and TBY afford a great opportunity to reward contracted providers for improving the quality of care and key outcomes of maternal and neonatal health, one important concern is that even if programs succeed in increasing medical attendance of childbirths and institutional deliveries, doing so may have little impact on actual health outcomes per se if the quality of medical care in rural areas is poor. Moreover, despite their promise to improveservice quality and health, there is little rigorous evidence to demonstratethe actual effectiveness of pay-for-performance incentives directly rewarding good health outcomes.
A related key limitation is that there is little guidance from theory or empirical evidence on how to best structure such performance contracts in health. Contracts can be – and in the case of health– most commonly are structured to reward the use of productive ‘inputs’ considered appropriate to improve health. For example, pay-for-performance contracts commonly reward the use of preventive services or good quality of care (judged by guideline adherence, for example). However, contracts rewarding input use may substantially constrain the ability of local agents/providers to use their superior local knowledge of how to structure programs to be most successful in local contexts, and do not generally reward innovation in health service delivery. Very few programs (and impact evaluations) have experimented with direct rewards for good health outcomes, despite the promise of performance incentives rewarding outcomes to potentially overcome these limitations of contracts rewarding input use. (See Leonard 2003 for an exceptional instance of such outcome-contingent contracts as well as Miller and Singer-Babiarz 2013 for a summary of performance incentive contracts in health.)
The choice of an optimal contract depends on a number of factors, including ‘observability’ of the inputs or outputs, or ‘verifiability’ of these inputs or outputs, and whether it is possible to define all contingencies in a contract. Especially in healthcare, the assumptions of observability (does the patient really know whether the examinations conducted by the physician are appropriate and complete?) and verifiability (is that knee really better, and how does it really compare to what it was like before treatment started?) are easily violated. Further, health outcomes are highly uncertain: patient outcomes are influenced by doctors’ inputs into care, but even the best doctors can have poor outcomes among patients and vice versa. Jointly, these problems in contracting imply that there is no clear theoretical prediction that suggests whether input-based contracts or output-contingent contracts are optimal in improving healthcare performance.
15
4.2 Methodology, theory of change and analysis
4.2.1 Randomised experiment
In order to provide rigorous empirical evidence on the question of whether supply-side incentives (pay-for-performance) structured as input-based contracts or output-contingent contracts yield better performance from providers, we conducted a randomised study among private obstetric care providers in rural Karnataka. The randomised experiment consisted of two orthogonal treatment arms and a control arm. Eligible rural private obstetric providers were randomly assigned to one of the three arms:
• Output-based contracts that rewarded lower rates of post-partum haemorrhage, pre-eclampsia, sepsis and neonatal mortality;
• Input-based contracts that rewarded better provision of healthcare inputs based on WHO guidelines for obstetric care; and
• Control contracts that provided the same information on best practices as other arms, but with no financial incentives. The contracts were structured such that providers had the potential to earn approximately INR 150,000 (about US$ 2,700 at the time of the contract, equivalent to more than 15 per cent of a mid-level government doctor’s salary and more than double the state per capita income), to be paid at the end of the intervention period (approximately 1 year).
We identified the potential universe of private providers who provided obstetric care (conducting deliveries) in rural areas of Karnataka where there were no other formal medical providers of obstetric care nearby. Based on the eligibility criteria (size of their catchment area, proximity of other potentially eligible providers nearby, number of deliveries conducted per month, and proximity to district headquarters), providers were selected for enrolment into the study. Our final sample of eligible providers who participated in the study and had signed incentive contracts, was 140 (53 in the outputs arm, 38 in the inputs arm, and 44 in the control arm). Of these, 5 providers declined to participate in the final interview and the end of the study, and were classified as attrition cases from the study (2 from input and 3 from control). Our final analytical sample thus included 135 providers, representative of private obstetric care providers in rural Karnataka.
All outputs and inputs for evaluation and provider-performance payments were determined using responses from household questionnaires. The questions used for identifying health outcomes and quality of care were generally chosen in order to (1) match with questions previously validated in the literature as useful measures, given the limitations in the recall and ability of women to observe and understand what was happening during pregnancy, labour/delivery and postpartum; or (2) match with questions identified as performing relatively well in a prior validation study. Outputs were measured from survey responses as the incidence of health outcomes, and inputs were measured as the provider’s adherence to WHO guidelines.
To the best of our knowledge, our incentive experiment was the first to reward improvements in health outcomes in medical-care systems of developing countries.
16
Our evaluation compared the impacts of contracting on outputs versus contracting on inputs.
4.2.2 Theory of change
A key starting point for efforts to improve provider performance with incentives is the underlying assumption that providers can do more than they are currently doing, but do not have incentives that encourage them to perform as best as they know how to. Studies of the quality of care in a range of settings in India and elsewhere have shown that healthcare providers know more about best practices than what they actually provide routinely. For example, Das et al. (2012) used standardized patients – trained actors who presented as real patients in providers’ clinics – to study provider quality in Delhi and the rural areas of Madhya Pradesh. The shockingly low quality of care provided for acute myocardial infarction, asthma and childhood dysentery was not systematically associated with availability of equipment or patient load, and quality was only marginally better among providers who had medical qualifications. More recently, Mohanan et al. used vignettes and standardized patients to estimate the know-do gap in quality of care among providers in rural Bihar, and also found larger gaps among qualified providers between what they knew and what they actually did.
Given the reality of low provider effort in health delivery, performance incentives (both financial and non-financial) have the potential to encourage providers to improve performance and align the incentives of the providers with those of patients. Our study only focused on financial-incentive contracts.
The theory of change for both our intervention arms focused on hypotheses about how providers responded to incentive contracts. In the case of output-based contracts, providers were offered financial rewards based on good maternal and neonatal health outcomes among their patients: post-partum haemorrhage, pre-eclampsia, sepsis and neonatal mortality (see Appendix 2 for samples of contracts and Appendix 3 for details of incentive structure in the Pre-Analysis Plan). Providers in the input-based contract arm were rewarded on whether they provided care as recommended in WHO guidelines. We expected these providers to demonstrate better adherence to best-practice guidelines, with associated improvements in health outcomes as well.
In contrast, providers in the output-based contracts arm had incentives to identify innovative solutions that best applied to the context of their own practice and patients. Such providers might have used a range of strategies to improve outcomes: we collected data on what they had planned to do after the contracts were implemented, and also collected data on what they had done differently during the previous year.
We tested empirically whether (a) input-contract providers demonstrated improvements in the quality of care, and if such improvements also resulted in improved health outcomes; (b) output-contract providers achieved improvements in
17
outcomes, and if such improvements were explained by changes in inputs into healthcare quality.
4.2.3 Power calculations
Power calculations for the experiment were conducted prior to the trial. Estimated baseline performance rates and feasible improvement levels were determined using existing data from government surveys and calibrated through piloting with doctors in Karnataka and Delhi to ensure that they were locally appropriate. (Each of these were entered in the contracts as ‘baseline’ and ‘target’ performance levels. See contract samples in Appendix 2.). For all specifications at the individual level, we assumed an intra-class correlation coefficient of 0.05 and 25 patients per provider. At the individual level, all five categories for quality of care had at least 85 per cent power to detect improvements that reached the target levels, with the ‘Childbirth Care’, ‘Postnatal Maternal Care’ and ‘Postnatal Newborn Care’ categories having at least 95 per cent power. Two of the four outcomes, post-partum haemorrhage and pre-eclampsia, had at least 85 per cent power to detect improvements towards the target levels. Note that these calculations did not take into account additional precision gained by including covariates. (Further details on multiple corrections in outcomes are included in the pre-analysis plan – Appendix 3).
4.2.4 Analysis
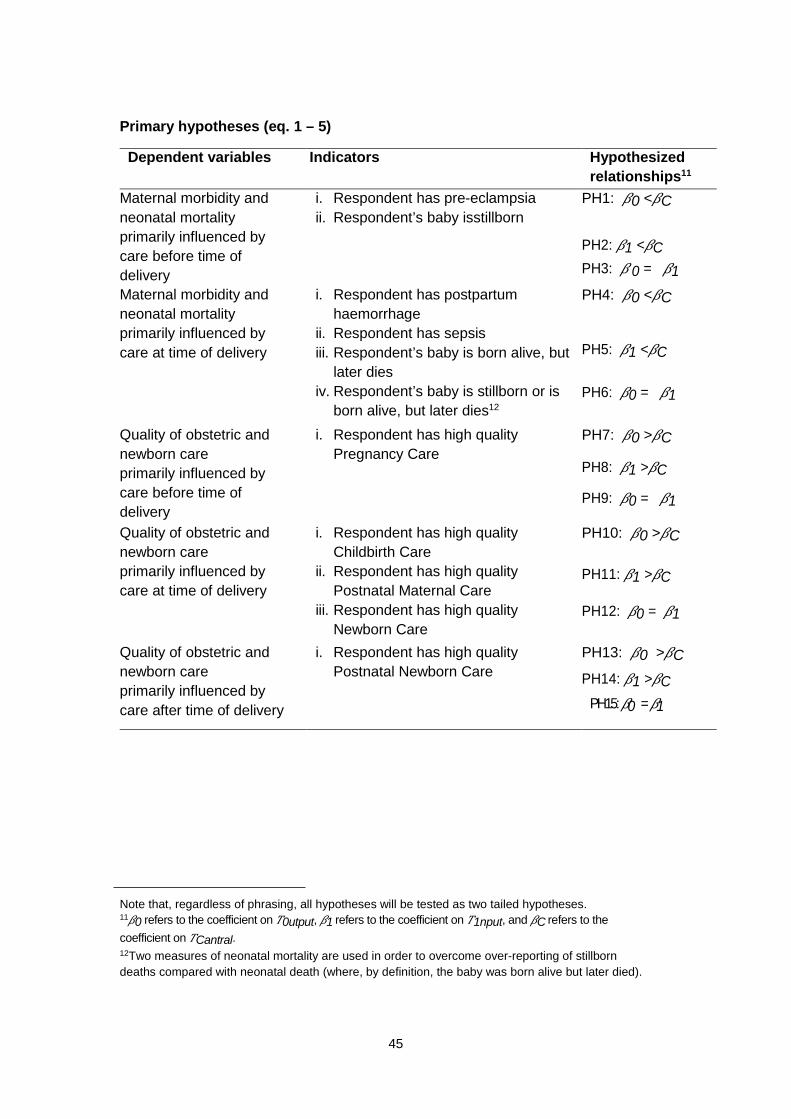
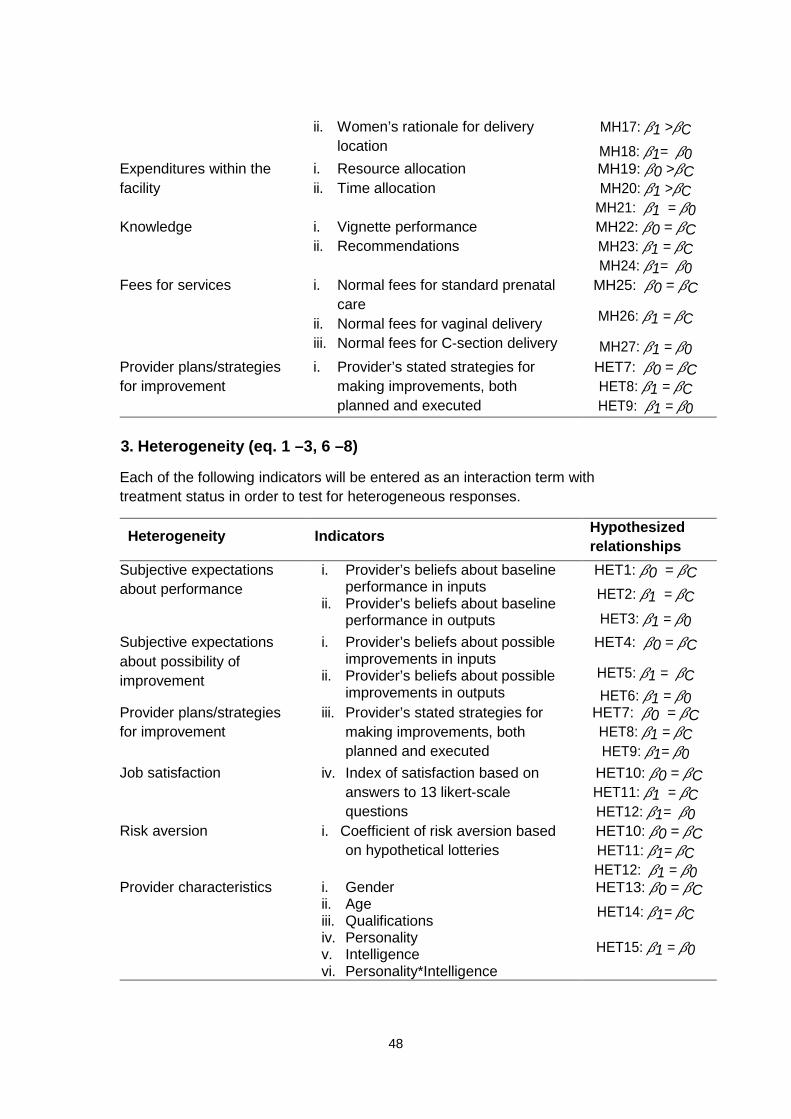
Our key hypotheses focused on the two types of contracts improving health outcomes or inputs into care provided to patients. In order to estimate the treatment effects of the intervention we planned to regress outcomes related to each hypothesis on dummy variables indicating treatment status. We tested a range of specifications, with the full model, including all covariates, district- and enumerator-fixed effects
Where 𝑦𝑦ip was the outcome of interest for a woman i who had received care from provider p, and 𝑇𝑇p was a vector of treatment indicators. 𝑋𝑋p was a vector of baseline (pre-contract) provider characteristics; 𝑍𝑍i was a vector of time-invariant household characteristics (such as mother’s age, educational status, religion and birth history); 𝑠𝑠d were district-level fixed effects, and 𝜆𝜆e were enumerator-fixed effects. All errors were clustered at the provider level.
(For further details on the design, structure of the incentives in the contracts, the full set of analyses and multiple corrections in outcomes, see the Pre-analysis Plan in Appendix 3. The pre-analysis plan was also published on the American Economics Association’s registry for randomized controlled trials: https://www.socialscienceregistry.org/trials/179/history/728)
We also conducted a cost-effectiveness analysis to assess whether the pay-for-performance programs were likely to be economically attractive, given the thresholds of region-specific willingness to pay. For ease of reference, we will discuss key
details of methods used along with results from cost-effectiveness analysis in the next section.
4.2.5 Qualitative component and mixed methods
The evaluation also included a qualitative study component in order to understand how providers in the incentive-contracts arm responded to financial incentives, and how these responses might be linked to the impacts observed in the experiment. The qualitative component, undertaken by researchers from the Foundation for Research in Health Systems (FRHS), included in-depth interviews with 52 providers and 234 new mothers who were either clients of the providers in the study, or at other private facilities that were not a part of the study, and a few mothers who had delivered babies at home. We identified high- and low-performing providers from both input- and output-contract groups. The interviews were conducted around four broad topics: perception of WHO guidelines, reactions to financial incentives and targeted thresholds, changes that providers made in response to the guidelines, and the perceived outcomes of those changes.
The quantitative and qualitative components were developed to complement and inform each other for the mixed-methods analysis. The qualitative field research protocols and instruments were jointly developed in order to inform the hypotheses about mechanisms (of potential impact of incentive contracts on providers) that we planned to test in the quantitative analysis. As soon as the quantitative survey data was available in August 2014, we shared preliminary findings with the qualitative research team to explore potential provider responses that might help explain our findings. Similarly, we also empirically tested the findings from the qualitative analysis with our household survey data. In addition, our qualitative data provided insights into provider perceptions of incentive programs and policies that promoted public-private partnership contracts, as well as perceptions of mothers about provider quality.
4.3 Key findings
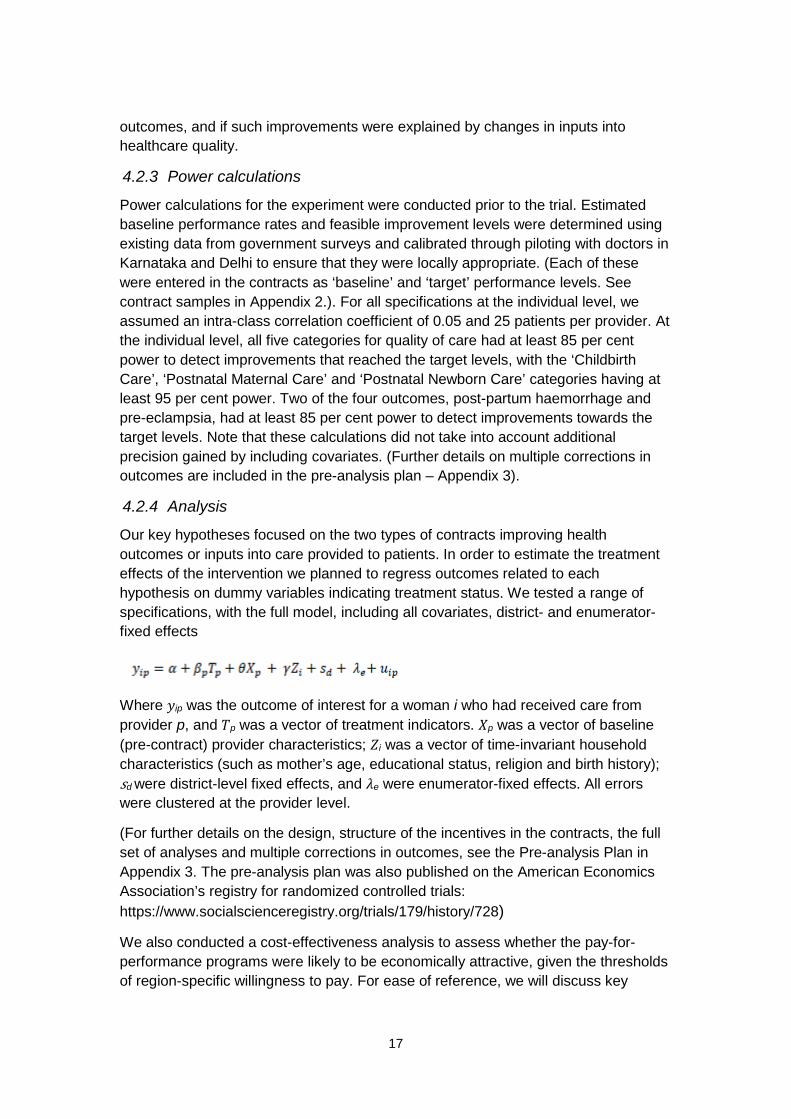
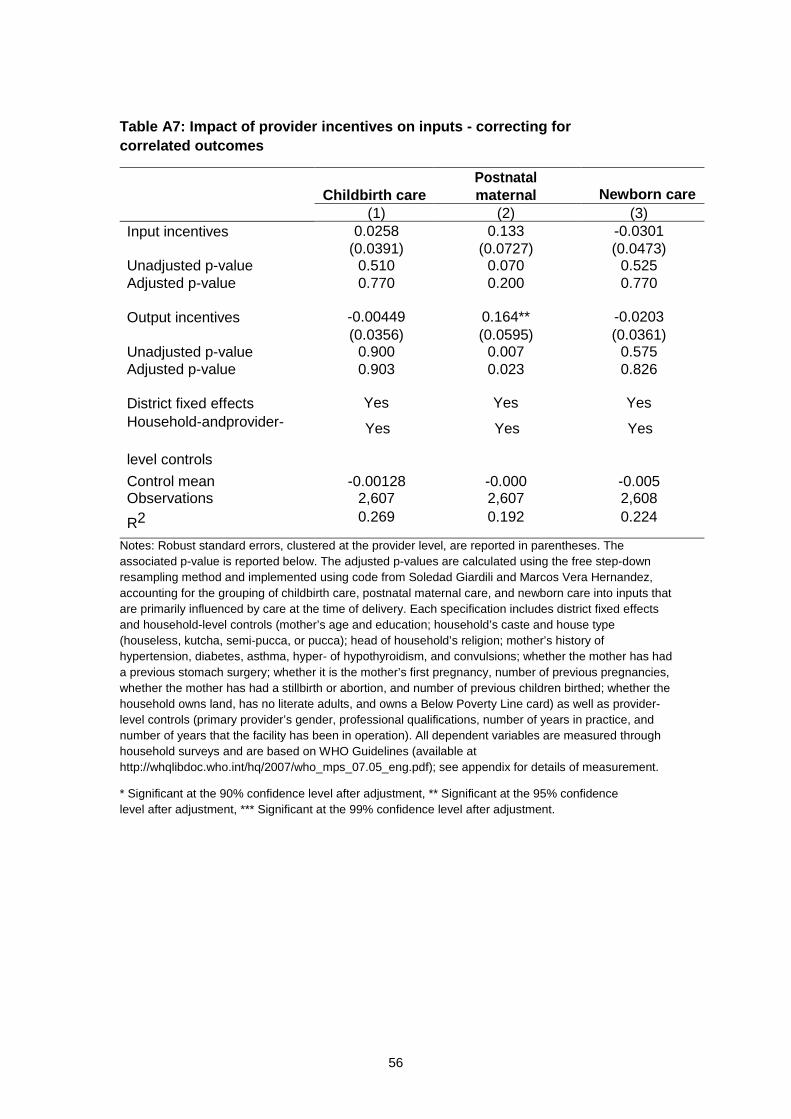
Our evaluation of the results of the experiment focused primarily on the inputs and outputs for which providers were rewarded. Inputs included pregnancy care, childbirth care, postnatal maternal care, newborn care and postnatal newborn care, while outputs included postpartum hemorrhage, pre-eclampsia, sepsis and neonatal death. Performance on inputs and outputs was determined using the results of household surveys taken 7-21 days post delivery of women from the providers’ patient lists over a period of six months.
Table 3 below presents the evaluation of provider performance on each rewarded input category. Providers in both treatment groups appeared to have significantly improved postnatal maternal care by about 12–14 per cent compared to control-group providers. These inputs were largely related to counselling and guidance offered by the providers or their staff, rather than inputs that required specific equipment or technical skills. Tables A3 and A5 in Appendix 4 show the results of additional related specifications.
R2 0.179 0.285 0.181 0.371 0.299 Notes: Robust standard errors, clustered at the provider level, are reported in parentheses. Each specification includes district fixed effects and household-level controls (mother’s age and education, household’s caste and house type [houseless, kutcha, semi-pucca, or pucca]; head of household’s religion; mother’s history of hypertension, diabetes, asthma, hyper- or hypothyroidism and convulsions; whether the mother had had a previous stomach surgery; whether it was the mother’s first pregnancy, number of previous pregnancies, whether the mother had had a stillbirth or abortion, and the number of previous children birthed; whether the household owned land, had no literate adults, and owned a BPL card), as well as provider-level controls (primary provider’s gender, professional qualifications, number of years in practice, and number of years that the facility had been in operation). All dependent variables were measured through household surveys and were based on WHO guidelines (available at http://whqlibdoc.who.int/hq/2007/who_mps_07.05_eng.pdf). * Significant at the 90% confidence level. ** Significant at the 95% confidence level. *** Significant at the 99% confidence level.
20
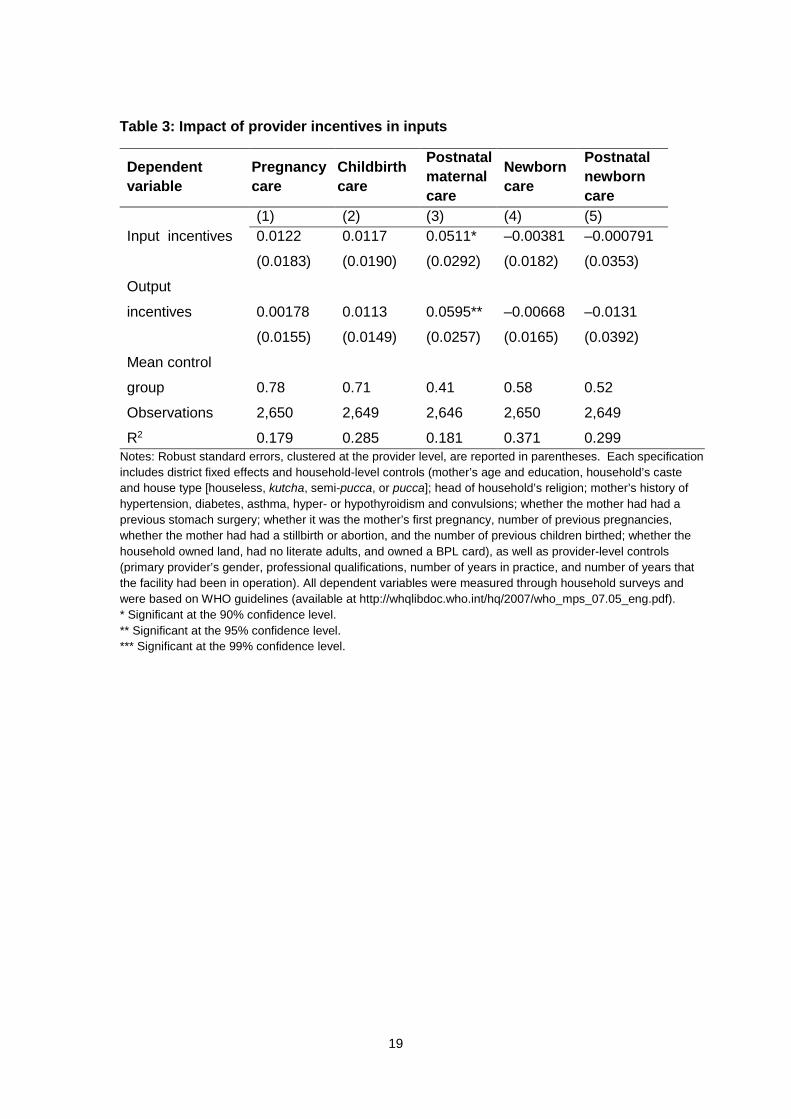
Table 4 presents analogous results of the study-providers’ performance on the four rewarded outputs. Note that because the outputs are rates of adverse health outcomes, superior performance appears as a negative coefficient in the table.
Table 4: Impact of provider incentives on outputs
Dependent variable
Postpartum haemorrhage
Pre-eclampsia Sepsis Neonatal
death (1) (2) (3) (4)
Input incentives –0.0987** 0.0161 0.0181 0.00204 (0.0462) (0.0455) (0.0195) (0.00320) Output incentives 0.00157 0.0320 0.0268* 0.00207 (0.0401) (0.0371) (0.0155) (0.00423) Mean control group 0.36 0.17 0.063 0.012
Notes: Robust standard errors, clustered at the provider level, are reported in parentheses. Each specification includes district fixed effects and household-level controls (mother’s age and education; household’s caste and house type [houseless, kutcha, semi-pucca, or pucca]; head of household’s religion; mother’s history of hypertension, diabetes, asthma, hyper- or hypothyroidism, and convulsions; whether the mother had had a previous stomach surgery; whether it was the mother’s first pregnancy, number of previous pregnancies, whether the mother had had a stillbirth or abortion, and number of previous children birthed; whether the household owned land, had no literate adults, and owned a BPL card) as well as provider-level controls (primary provider’s gender, professional qualifications, number of years in practice, and number of years that the facility had been in operation). All dependent variables were measured through household surveys. * Significant at the 90% confidence level. ** Significant at the 95% confidence level.
Input providers appeared to significantly reduce rates of postpartum hemorrhage by more than a quarter compared to the control group. However, the outputs-treatment group performed worse on the rate of sepsis in their patient populations compared to the control group, suggesting potential adverse effects of financial incentives. Tables A4 and A6 in Appendix 4 show the results of additional related specifications.
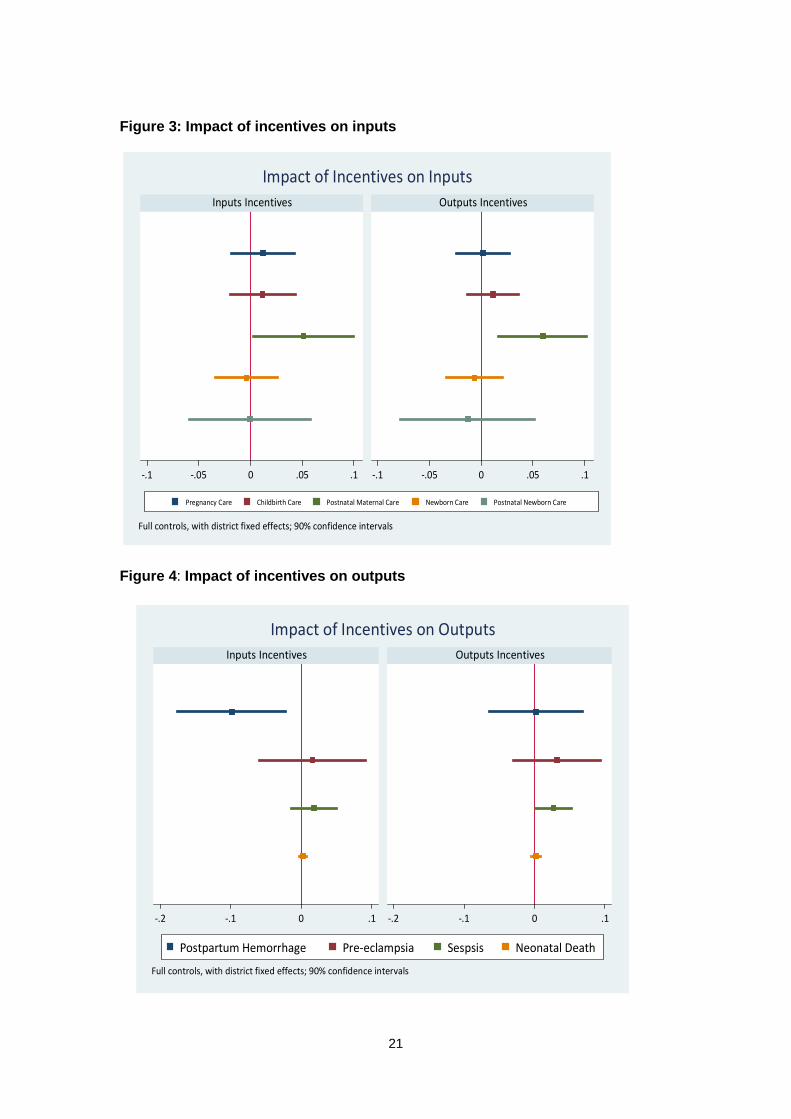
Figures 3 and 4 visually show the results of Tables 3 and 4. Note that coefficients greater than zero correspond to improved performance in inputs (Figure 3), while coefficients less than zero correspond to improved performance on outputs (Figure 4).
21
Figure 3: Impact of incentives on inputs
Figure 4: Impact of incentives on outputs
-.1 -.05 0 .05 .1 -.1 -.05 0 .05 .1
Inputs Incentives Outputs Incentives
Pregnancy Care Childbirth Care Postnatal Maternal Care Newborn Care Postnatal Newborn Care
Full controls, with district fixed effects; 90% confidence intervals
Impact of Incentives on Inputs
-.2 -.1 0 .1 -.2 -.1 0 .1
Inputs Incentives Outputs Incentives
Postpartum Hemorrhage Pre-eclampsia Sespsis Neonatal Death
Full controls, with district fixed effects; 90% confidence intervals
Impact of Incentives on Outputs
22
An important issue in interpreting our results was the extent to which they reflected changes in patient composition (rather than actions taken by providers). There were two primary ways that patient composition might have changed: patient demand could have changed as quality of care improved, or providers could have manipulated the composition of patients that they treated (by selectively referring some patients to other providers, for example). Although we were unable to distinguish between these two channels, we analysed their net effect. We also noted that we deliberately constructed our incentive contracts to minimize provider manipulation of patient selection (explicitly indicating that any evidence of patient selection would nullify their incentive contract).
To investigate changes in patient composition, we first used our control group sub-sample to regress an indicator for whether or not any of the four major adverse health outcomes that we studied had occurred (PPH, pre-eclampsia, sepsis and neonatal mortality) on the individual characteristics that we used as controls when estimating Equation 2 as well as district fixed effects. For each woman in our full sample, we then used the resulting parameter estimates to predict the probability of an adverse health event. Although not quantitatively large, the input-incentive group had patients that were roughly 3 percentage points more likely to experience any adverse health event (a statistically significant difference). Since it seemed unlikely that input-incentive providers would have purposefully tried to select patients with greater risk of health complications, we speculated that this finding might instead have reflected a demand response: as input-incentive providers provided higher-quality services, those with greater underlying risk of adverse health outcomes might have been more likely to seek care from them. An implication of this finding was that if anything, our main results might have underestimated the effect of the input-incentive contract on provider behaviour.
4.3.1 Cost-effectiveness analysis of performance contracts and results
We conducted a cost-effectiveness analysis to assess whether the pay-for-performance programs were likely to be economically attractive, given the thresholds of region-specific willingness to pay. The model considered three different policy scenarios: (1) input-based contracts; (2) output-based contracts, (3) status quo.
Model overview
The model simulated a cohort of pregnant women presenting for delivery at participating provider facilities during the 1-year contract period. For simplicity, the age of all women entering the model was set as equal to the average age of patients who delivered during the randomised experiment (24 years). Within the 1-year contract period, women’s risks of delivery-related complications varied depending on the policy scenario being modelled. Women who experienced complications were at risk of maternal mortality, conditional on the type of complication. Beyond the contract period, those who survived their delivery in Year 1 were assumed to live out their remaining life expectancy, with future life-years discounted at a rate of 3 per cent per year. Costs were calculated from a health-system perspective and included
23
average costs per delivery associated with program implementation (i.e., costs of performance and participation rewards, meetings with providers, and data collection) and the management of complications.
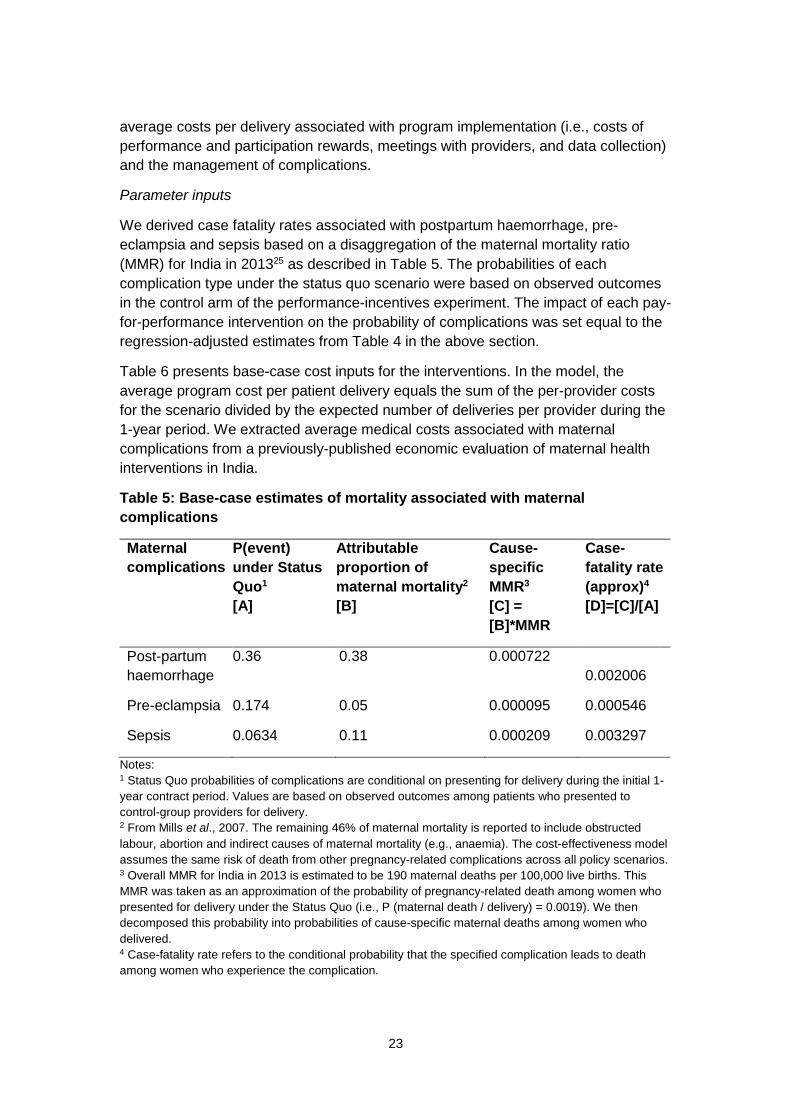
Parameter inputs
We derived case fatality rates associated with postpartum haemorrhage, pre-eclampsia and sepsis based on a disaggregation of the maternal mortality ratio (MMR) for India in 201325 as described in Table 5. The probabilities of each complication type under the status quo scenario were based on observed outcomes in the control arm of the performance-incentives experiment. The impact of each pay-for-performance intervention on the probability of complications was set equal to the regression-adjusted estimates from Table 4 in the above section.
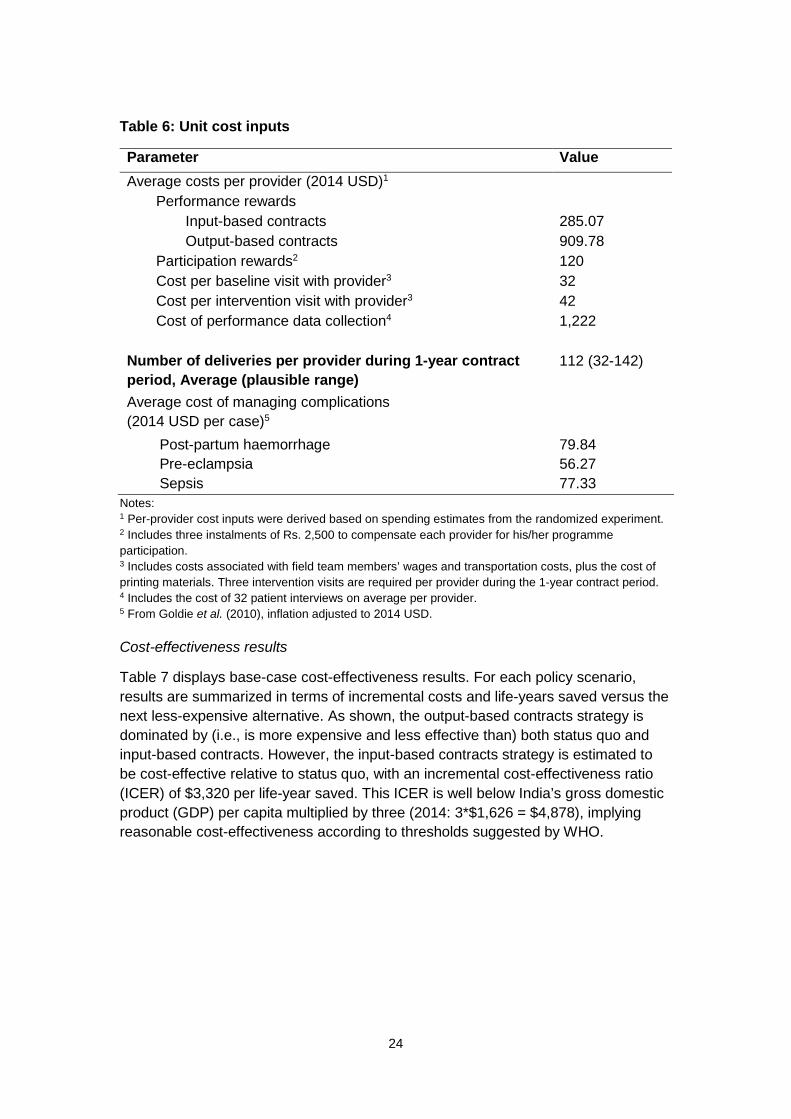
Table 6 presents base-case cost inputs for the interventions. In the model, the average program cost per patient delivery equals the sum of the per-provider costs for the scenario divided by the expected number of deliveries per provider during the 1-year period. We extracted average medical costs associated with maternal complications from a previously-published economic evaluation of maternal health interventions in India.
Table 5: Base-case estimates of mortality associated with maternal complications
Maternal complications
P(event) under Status Quo1 [A]
Attributable proportion of maternal mortality2 [B]
Cause-specific MMR3 [C] = [B]*MMR
Case-fatality rate (approx)4 [D]=[C]/[A]
Post-partum haemorrhage
0.36 0.38 0.000722 0.002006
Pre-eclampsia 0.174 0.05 0.000095 0.000546
Sepsis 0.0634 0.11 0.000209 0.003297
Notes: 1 Status Quo probabilities of complications are conditional on presenting for delivery during the initial 1-year contract period. Values are based on observed outcomes among patients who presented to control-group providers for delivery. 2 From Mills et al., 2007. The remaining 46% of maternal mortality is reported to include obstructed labour, abortion and indirect causes of maternal mortality (e.g., anaemia). The cost-effectiveness model assumes the same risk of death from other pregnancy-related complications across all policy scenarios. 3 Overall MMR for India in 2013 is estimated to be 190 maternal deaths per 100,000 live births. This MMR was taken as an approximation of the probability of pregnancy-related death among women who presented for delivery under the Status Quo (i.e., P (maternal death / delivery) = 0.0019). We then decomposed this probability into probabilities of cause-specific maternal deaths among women who delivered. 4 Case-fatality rate refers to the conditional probability that the specified complication leads to death among women who experience the complication.
24
Table 6: Unit cost inputs
Parameter Value Average costs per provider (2014 USD)1
Participation rewards2 120 Cost per baseline visit with provider3 32 Cost per intervention visit with provider3 42 Cost of performance data collection4 1,222
Number of deliveries per provider during 1-year contract period, Average (plausible range)
112 (32-142)
Average cost of managing complications (2014 USD per case)5 Post-partum haemorrhage 79.84 Pre-eclampsia 56.27 Sepsis 77.33
Notes: 1 Per-provider cost inputs were derived based on spending estimates from the randomized experiment. 2 Includes three instalments of Rs. 2,500 to compensate each provider for his/her programme participation. 3 Includes costs associated with field team members’ wages and transportation costs, plus the cost of printing materials. Three intervention visits are required per provider during the 1-year contract period. 4 Includes the cost of 32 patient interviews on average per provider. 5 From Goldie et al. (2010), inflation adjusted to 2014 USD.
Cost-effectiveness results
Table 7 displays base-case cost-effectiveness results. For each policy scenario, results are summarized in terms of incremental costs and life-years saved versus the next less-expensive alternative. As shown, the output-based contracts strategy is dominated by (i.e., is more expensive and less effective than) both status quo and input-based contracts. However, the input-based contracts strategy is estimated to be cost-effective relative to status quo, with an incremental cost-effectiveness ratio (ICER) of $3,320 per life-year saved. This ICER is well below India’s gross domestic product (GDP) per capita multiplied by three (2014: 3*$1,626 = $4,878), implying reasonable cost-effectiveness according to thresholds suggested by WHO.
Notes: 1 Provides the expected cost and expected life-years per patient entering the model, by policy scenario. ICER: incremental cost-effectiveness ratio. 4.3.2 Findings from qualitative studies/mixed methods
The qualitative study yielded several important insights that will inform the ongoing experimental analysis. While the majority of private providers believed in the utility of WHO guidelines and the standards of care implied therein, they were not following those guidelines to the desired extent. The private providers in the ‘High’ performing ‘Input’ group voiced their view that patient cooperation was a critical prerequisite for proper implementation of the guidelines. These apprehensions of the providers were mirrored in the behaviour of mothers. While there was compliance in terms of antenatal care and institutional delivery, compliance with advice for rest and diet was low, with only one-fourth of the mothers reporting it.
With respect to the performance-based incentives, almost half of the private providers supported the financial incentives. Most of them seemed to suggest that even without the financial incentives they had been performing well in the past but if their performance had improved for the better during the intervention, then it was because of the attention and encouragement they had received and not because of the monetary value of the reward. Further, the data from the high and the low performers within each group brought out some remarkable differences. Significantly, a larger number of high performers in the ‘Output’ group thought that the incentives were motivating, and targets were good and not too difficult to achieve, as compared to the low performers in the same group. Similar differences were not found between the high and low performers in the ‘Input’ group, with one exception. These differences seemed to suggest that High performers drew inspiration from the targets while Low performers perhaps feared them. What seemed also interesting was that stark differences were not found between the high and low performers in the ‘Input’ group. This might have been because the ‘Input’ group had a lot more control over the inputs they provided, while the ‘Output’ group did not have the same level of control over the outcomes such as post-partum haemorrhage, pre-eclampsia, sepsis among postpartum women and neonatal death, based on which their performance was assessed. In that context, confidence about meeting the output targets was, perhaps, the significant factor that differentiated the high performers from the low performers.
26
Moving on to the findings from the interviews with 206 mothers, the majority of mothers, that is, about 113 reported that they had opted for private providers because of the quality of services at their facilities. Another 78 said that the reputation of the doctors had made them decide in favour of a particular facility. In addition, having a scanning machine at the private facility, and the good reputation that doctors at the facility tried their level best to conduct normal deliveries, were also considered desirable attributes of a private facility. Out of the 206 mothers, 128 said that private facilities were best suited for maternal care, and about 95 mothers reported that they were satisfied with both the facilities and the services. However, only a few mothers (30 out of 206) said the private facilities were perfect– that is – without any problem. The remaining mothers talked about the facilities being small, crowded, dirty and lacking in adequate staff and the requisite infrastructure. One-tenth missed the presence of a paediatrician and facilities for the accompanying families.
More mothers who delivered with the ‘Input’ group providers reported receiving advice for maternal care both at home and at facilities and were very happy with the care they received at these facilities. Interestingly the ‘High’-performer ‘Input’ group of providers had mentioned patient co-operation being critical for proper implementation of WHO guidelines. They sought this cooperation through health education to mothers. While most mothers (180/206) reported complying with the advice on the number of antenatal visits and undertaking scans, only about half of them followed the advice on taking rest and nutritional diet during their pregnancy.
More women in this group who had earlier sought maternal care in a government facility showed a shift to a private facility. They cited service quality, proximity and familiarity of the private facility as reasons for their preference.
In conclusion, the WHO guidelines were considered ideal and worth emulating in a somewhat limited way. The targets for performance were considered beneficial and a good reference point for performance assessment, while financial incentives were welcome but not vital for providing good quality care. The outcomes were largely anecdotal and the time was considered to be too short for any visible improvements in health indicators. The ‘Input’ group intervention seems to have succeeded marginally more in achieving the intended outcomes, than the ‘Output’ group.
5. Challenges in implementation and lessons learned 5.1 Chiranjeevi Yojana in Gujarat
5.1.1 Regression discontinuity and BPL status The original plan for the CY evaluation aimed to implement a regression discontinuity design, relying on the BPL eligibility cut-off. We anticipated some amount of contamination across the bright line discontinuity, and had planned to implement a fuzzy RD design, as described in the original proposal. However, based on data that we collected in Gujarat, we learned that the extent of BPL misclassification was so large that it was not feasible to implement even the fuzzy RD design. (See figure on BPL misclassification in Appendix 5.) As a result, we had to modify the evaluation design and employ a DD design.
27
5.1.2 Challenges with policy engagement in Gujarat
The main challenge faced in the evaluation in Gujarat was in terms of engaging with the policy makers. In addition to change of postings, the Gujarat government was invested in the outcome of the study, because the CY program was heralded as a huge success by the then chief minister who was campaigning for national elections. The CY program was the flagship health program in the campaign. As a result, the government was reluctant to engage with us actively on addressing potential ways forward after the negative results of the evaluation were imminent. We presented our findings to the government in the form of draft manuscripts and briefing documents, and also made in-person presentations to the Principal Secretary. While the government has taken steps to address some of the issues of leakages and incorrect targeting that our evaluation highlighted, our policy engagement efforts ended after presenting the results.
5.2 Thayi Bhagya Yojana in Karnataka
The original plan for the TBY evaluation was to rely on a randomised roll-out of the conditional cash transfer component (TBY Plus). The state government had also committed to provide financial support to the evaluation project by funding the household surveys that would collect data to facilitate the TBY evaluation, and also provide the baseline for the experimental evaluation of provider-incentive contracts.
5.2.1 Change in government policy/proposal
The project faced a critical challenge when the state government changed its plans for the conditional cash subsidy component (the TBY Plus). During the budget session of March 2011, the Chief Minister announced that the TBY Plus would be rolled out all across the state simultaneously, thus fundamentally changing the program and the possibility for randomised evaluation as planned. Based on consultation with the government, we decided to conduct a DD analysis to evaluate the main TBY program, which the government was already implementing in seven districts.
Further, related to these changes, the baseline survey contracting process was significantly delayed, resulting in major delays in the overall evaluation. The baseline survey was finally awarded in June 2011.
5.2.2 Baseline data from KHSDRP: delays and data quality
In addition to delays in contracting, the data collection also ran into several unanticipated challenges such as financial and human resources constraints faced by the data collection firm as well as critical lapses in following protocols in data collection. Due to changes in the evaluation design, the TBY evaluation needed to be expanded to all districts in the state. Since the state government was not willing to add additional funds to the baseline, the research team covered this additional cost with its existing resources and additional research funding from Duke and Stanford Universities.
28
In spite of additional resources and intensive monitoring, the firm collecting the data for the state did not adhere to field protocols, making the baseline data unusable for the experimental evaluation or for TBY evaluation. After further consultations with the government, we agreed to rely on the high-quality retrospective data on birth histories and maternal and child-health outcomes collected at the end of the project (in 2014) to conduct a DD evaluation of the TBY program.
5.3 Experimental interventions
5.3.1 Change in experimental design based on data availability
The experimental evaluation was originally designed to reward improvements in provider performance. This strategy required collecting precise baseline data on health outcomes and inputs at the cluster level in order to summarize cluster-specific details in each provider’s incentive contract. As mentioned earlier, due to major lapses in field protocol, we did not have confidence in the cluster-specific estimates of maternal outcomes or quality of care inputs. We modified the design of the experiment to reward providers based on levels of quality or health outcomes they could achieve by the end of the year.
5.3.2 Implementing the performance contracts
Prior to implementation, the input- and output-based contracts were extensively piloted with doctors in Delhi, Bangalore and the Haveri district in Karnataka (among providers who were not part of the study sample).
A major challenge in implementing the performance contracts with private providers in rural areas was the reluctance of such providers to participate in any research effort, especially one that was sanctioned by the government. The field team found it challenging to break this trust barrier and earn the confidence of the private providers to participate in the study. Our field teams dedicated a large amount of time per provider to discuss details of the project and, in some instances, got providers to call up our project offices to confirm specifics of the contracts prior to signing their participation in the study.
5.3.3 Collecting data with two-week maternal recall
During the development of measures of quality relating to obstetric care and measures of maternal health that can be learned from household surveys, we realized an important limitation in the literature. We knew from previous research that recall of details of healthcare inputs received declined very rapidly after two weeks, so we had planned to collect maternal birth histories within a two-week period. However, since there were no studies that had conducted validation of obstetric birth-history questions, we had no information on whether mothers’ recall within two weeks would provide us with reliable measures of maternal healthcare quality. As a result, we undertook a validation study using trained senior nursing students who observed and documented the measures of quality of obstetric care provided, and maternal and neonatal health outcomes. We then compared this data to responses from household surveys with the same mothers two weeks later. We relied on questions
29
from this validation, conducted in Gujarat and Karnataka in 2011, to develop measures for the provider-incentive experiment. Conducting interviews across the state of Karnataka with new mothers within two weeks after their respective deliveries was an enormously challenging task with 132 field investigators, 7 supervisors, 5 tele-callers and additional office staff. In addition to the women identified from each provider’s patient list, we also interviewed new mothers who lived in the geographic areas served by each provider, or the closest 35 villages, whichever was smaller. These new mothers were identified through interviews with key informants (typically AWW– Angadwadi Workers, ASHA – Accredited Social Health Activists, or other health workers) in each cluster. In all, a total of 12,084 women were interviewed at the follow-up interview. We also then visited each mother four weeks after the child’s birth to check on the child and mother’s health in order to collect precise data on neonatal mortality and maternal mortality, if any.
Overall, a key lesson learned from this implementation was that relying on maternal recall data for critical policy purposes was not feasible given the challenges in tracking mothers, and interviewing them within a reasonable period of recall. A related lesson learned was that it was incredibly difficult to ensure high-quality data with large data collection efforts. We invested large amounts of resources from our grant funds to provide intensive supervision and field monitoring support to supplement the efforts of our partners at Sambodhi. Without this level of monitoring and feedback, it was easy to see how the quality of data could be severely compromised due to failure to adhere to protocols, as we had seen at baseline. Finally, before results from large household surveys were used to inform policy – especially in health – it was important to conduct careful validation of key questions used in these surveys.
5.3.4 Qualitative studies
The qualitative component was added after the grant award was made, in response to suggestions from reviewers and the donors that mixed methods would be highly informative in the context of our study. We partnered with Bangalore-based FRHS to undertake the qualitative research component in Karnataka.
One of the key challenges our research partners at FRHS faced was the long delay in the project since the qualitative component was to be conducted immediately after the incentive-contract period ended. Given upcoming project-end dates, the qualitative team faced considerable time pressure. Also, since the in-depth interviews with providers were conducted at the end of the project, the team faced some resistance from providers to commit time for interviews.
6. Policy implications and next steps Given many analogous design features of both Gujarat’s CY program and Karnataka’s TBY program, we first propose policy implications that jointly emerge from experiences with both. We then propose more nuanced recommendations about the structure of financial incentives based on findings from the pay-for-performance experiment in rural Karnataka.
30
6.1 Chiranjeevi Yojana and Thayi Bhagya Yojana
In the backdrop of our proposed recommendations based on experiences with Gujarat’s CY programme and Karnataka’s TBY programme is the fact that improving access to maternity services in these states would seem to require good partnerships with the private sector (in the absence of a massive expansion of public sector facilities and practitioners in remote rural areas). India’s healthcare system in rural areas faces a severe shortage of qualified public sector doctors and a proliferation of untrained private sector providers. The average rural household in India can access 3.2 private providers, 0.3 public providers, and 2.3 public paramedical staff within their village.26Due to the absenceof efforts to contract with the private sector, the public sector remains significantly constrained in its ability to provide high-quality healthcare services to the rural poor. Additionally, we propose four important implications:
- Implication 1: Transparent, efficient mechanisms of contracting with the private sector must be further developed and piloted.
Although there is no definitive evidence, a serious potential implication of the findings from our evaluation of the CY and TBY programmes is that providers collect reimbursements from the state government, and continue to bill patients inappropriately (or keep increasing the intensity of medically unwarranted services provided). While the government compensated providers for almost 800,000 deliveries by 2013, we do not see evidence of significant reduction in out-of-pocket expenditures for institutional deliveries in our analysis. Though it is plausible that reimbursements from the government programme are small in relation to the cost of providing these services, expenditures borne by households for what was promised to be a ‘free’ delivery is an impediment to the potential impact.
- Implication 2: Low cost, easy-to-implement monitoring mechanisms (through phone-based exit interviews with randomly selected beneficiaries, for example) should be developed, piloted and implemented.
A seemingly important component of improving the efficiency and effectiveness of private sector contracting mechanisms is identifying feasible, low-cost ways to monitor provider compliance with contractual terms. Telephone-based exit interviews with randomly selected beneficiaries are an example of one possibility that may be explored.
- Implication 3: Policy efforts to increase institutional delivery rates must be accompanied by parallel efforts to improve the quality of both public and private service provision.
No component of either the CY or TBY contracting mechanisms explicitly focused on the quality of care provided. Neither program appears to have increased institutional delivery rates, making it difficult to ascertain if low quality of care would otherwise impede these programs from having health benefits. However, evidence from our provider-incentive study as well as evidence produced by others suggests that low
31
quality of care may prevent institutional deliveries from achieving the desired health benefits.
- Implication 4: A potentially important maternity care innovation that followed our study period was the introduction of publicly funded ambulance service transportation across states; the combined impact of these programs together with ambulance services should be analysed.
Traditionally, travel to maternity hospitals has been an important non-financial barrier to institutional delivery. The CY program may have required complementary improvements in transportation to hospitals to have its intended effect on institutional delivery rates – but this possibility has not been studied (and is beyond the scope of the current evaluation to study).
6.2 Performance-incentives experiment
Our provider-incentive experiment allows for further insight into how private sector contracts may be better structured to improve the quality of services provided – a potential prerequisite for increases in institutional deliveries to have the desired population health benefits. Based on our findings, we propose four additional implications:
- Implication 1: The quality of care provided by private sector maternity providers in rural Karnataka should be investigated in greater detail.
The quality of care provided by private sector maternity providers in rural Karnataka appears to be poor, perhaps surprisingly so. New methodologies for measuring quality of care (beyond the scope of our study) should be used to assess the current state of maternity care in greater detail. For example, a new tool for measuring knowledge and practice of obstetric care providers (albeit under study settings) is ‘MamaNatalie – a birthing simulator kit that can be employed to test how providers manage normal deliveries as well as complications that arise in labour.
- Implication 2: Financial incentives may play a role in improving the quality of service provision, but their demonstrated potential appears to be quite limited. Despite findings of improvements in health delivery and health outcomes associated with the use of performance incentives that are statistically significant, these improvements are small in practical terms.
- Implication 3: When impactful, provider incentives that focus on rewarding adherence to guidelines, and the provision of concrete service indicators appear to outperform those that simply reward better health.
Despite theoretical reasons to believe that performance incentives rewarding better health may be more desirable in relation to those that reward adherence to guidelines or better quality of care – in part because of the incentives that they create for providers to use their local knowledge to innovate in service delivery – in practice, performance incentives that reward adherence to guidelines are superior.
32
- Implication 4: Efforts to provide real-time feedback to maternity providers about the quality of care that they provide may be a promising quality improvement strategy to consider through piloting and evaluation.
A simple – and yet important – result is that providers may believe that the quality of their services is substantially better than it actually is in reality. The potential impact of real-time feedback mechanisms to providers about the quality of care that they are providing should be explored.
33
Appendix 1: Table on provider summary statistics TBY High TBY (SD)
N Low TBY (SD) N
None (SD) N
Total (SD) N
0.81 0.48 0.51 0.55 Are you aware of TBY? (0.40) (0.51) (0.50) (0.50) 21 21 105 147 Do you think your patients have received TYB benefits?
Do these patients receive any Prasuti Araike benefits?
0.90 (0.32)
10
1.00 0.00
6
0.70 (0.46)
40
0.77 (0.43)
56
Do these patients receive any Janani Surasha Yojane benefits?
0.83 (0.39)
12
1.00 0.00
5
0.80 (0.41)
44
0.82 (0.39)
61 0.87 0.83 0.65 0.72 Do these patients receive cash benefits?
(0.35) (0.41) (0.48) (0.45)
15 6 40 61
What share of patients in your area do you think are eligible for TBY?
63.53 (18.18)
17
55.50 (24.09)
10
87.65 (182.20)
54
78.62 (149.30)
81 0.35 0.20 0.12 0.18 Are you empanelled for TBY? (0.49) (0.42) (0.32) (0.38) 17 10 52 79
How many extra patients do you receive as a result of TBY per month?
131.70 (117.90)
6
35.00 (21.21)
2
56.67 (90.42)
6
85.71 (101.40)
14
Do you charge BPL patients different amounts?
0.29 (0.46)
21
0.10 (0.30)
21
0.16 (0.37) 105
0.17 (0.38) 147
How much do you charge all patients (if no to previous question)?
3066.70 (820.90)
15
2842.10 (1202.50)
19
5350.00 (2868.70)
88
4678.70 (2718.40)
122
How much do you charge BPL patients?
833.30 (1329.20)
0.00 0.00
3805.90 (1725.70)
2788.00 (2165.70)
34
High TBY (SD)
N
Low TBY (SD) N
None (SD) N
Total (SD) N
6 2 17 25 4083.30 3500.00 5723.50 5152.00 How much do you charge non-BPL patients?
(584.50) 0.00 (1971.50) (1845.70)
6 2 17 25 If the government provides cash or subsidies to BPL patients for institutional deliveries… …I would be able to provide better care because women can afford more.
0.62 (0.50)
21
0.62 (0.50)
21
0.64 (0.48) 106
0.64 (0.48) 148
…I would provide the same quality of care, 0.10 0.00 0.08 0.07 but charge BPL women like non-BPL (0.30) 0.00 (0.28) (0.26) women. 21 21 106 148 0.29 0.38 0.26 0.28 ..there would be no changes. (0.46) (0.50) (0.44) (0.45) 21 21 106 148
35
Appendix 2: Performance-based contracts in healthcare
Experimental evaluation of contracting based on inputs and health outcomes: pre- analysis plan December 2013
This document outlines the analysis plan for a randomized controlled trial of performance based incentive contracts for obstetric care providers based on inputs or health outcomes, part of ‘Improving Maternal and Child Health in India: Evaluating Demand and Supply Side Strategies’ (IMATCHINE). The document provides a pre-specified methodology and plan for analyzing the results of the experiment.
1. Study overview ‘Improving Maternal and Child Health in India: Evaluating Demand and Supply Side Strategies’ (IMATCHINE) is a randomized controlled experiment designed to test the effectiveness of supply-side incentives (pay-for-performance) for private obstetric care providers in rural Karnataka, India. In particular, we assess the differential impact of incentive contracts that reward providers based on quality of care (‘inputs’) and those that reward providers for favourable health outcomes (‘outputs’) on provider behaviour, quality of care, and maternal and infant health outcomes. In addition, we also aim to qualitatively understand how providers respond to the presence of these incentives.
2. Experimental design The randomized experiment consists of two orthogonal treatment arms and a control arm. Eligible1 rural private obstetric providers in were randomly assigned to one of the three arms. Below we first describe each of the three arms, and then provide further details about the intervention.
ARM 1: ‘outputs’ contract
Providers in this arm are offered a contract that provides financial rewards based on the incidence of four adverse maternal and neonatal health outcomes among their
patients: post-partum hemorrhage, pre-eclampsia, sepsis, and neonatal mortality.2
For each maternal health outcome (incidence of outcome 𝑖𝑖 = 𝑥𝑥i) the reward payment
(𝑥𝑥i) is starting at a maximum threshold 𝒙𝒙𝒊𝒊� per cent incidence:
structured as a decreasing linear function of incidence in the provider’s patient population, 𝛼𝛼i is predetermined based on the projected range of improvements and budget considerations, and 𝐱𝐱𝐢𝐢� is set at projected pre-intervention average rates. Pre-intervention average rates for each of the three adverse maternal health outcomes were determined using existing data from government surveys and calibrated through piloting with doctors in Karnataka and Delhi to ensure that they were locally appropriate. For neonatal death, providers are offered a flat reward amount for achieving zero neonatal deaths in their patient population. Each provider’s total reward payment is the sum of rewards earned for each of the four adverse health outcomes. For example, pre-intervention rates of post-partum haemorrhage (PPH) were estimated at 35 per cent (�̅�𝑥PPH = 35) in the study area. Providers earn 𝛼𝛼 PPH = Rs. 850 (equivalent to about $17 at the time of the contract) for every percentage point below 35 per cent incidence of PPH in their patient population. For example, if the rate of PPH in their patient population was 25 per cent, they would earn $170, and if they were able to completely eliminate PPH in their patient population, they would earn $595.
Each provider is instructed that outcomes will be measured through household surveys of patients who come to her for care over the following year. At the end of this period, providers in the output group are given a one-time reward payment based on their performance on the four adverse health outcomes. To minimize the likelihood that providers selectively refuse high-risk patients, the contract contains a clause that if evidence of refusal to provide care is detected in the local population, the contract will be voided and the provider will be ineligible for the reward payment.
ARM 2: ‘inputs’ contract.
Providers in this arm are offered a contract that provides financial rewards based on healthcare inputs provided to their patients. These inputs are based on recommendations in the current World Health Organization (WHO) guidelines for basic obstetric care that were distributed to all providers in the study when they agreed to participate.3
Input quality is measured separately in the five domains:
Pregnancy Care, Childbirth Care, Postnatal Maternal Care, Newborn Care, and Postnatal Newborn Care.4 For each domain of care (performance in domain 𝑖𝑖 = 𝑥𝑥i) the reward payment 𝑃𝑃(𝑥𝑥i) is structured as an increasing linear function of the quality level achieved in the provider’s patient population, starting at a minimum threshold performance leve 𝒙𝒙𝒊𝒊 per cent:
𝑷𝑷(𝒙𝒙𝒊𝒊) = �𝒂𝒂𝒊𝒊 �𝒙𝒙𝒊𝒊 − 𝒙𝒙𝒊𝒊� , 𝒙𝒙𝒊𝒊 ≤ 𝒙𝒙𝒊𝒊
𝟎𝟎, 𝒙𝒙𝒊𝒊 > 𝒙𝒙𝒊𝒊
3‘WHO Recommended Interventions for Improving Maternal and Newborn Health.
4See Appendix for a detailed explanation of how inputs are measured.
37
𝛼𝛼i is predetermined based on the projected range of improvements and budget considerations, and 𝒙𝒙𝒊𝒊 is set at projected pre-intervention average rates. Pre-intervention average rates for each of the five domains of care were determined using existing data from government surveys and calibrated through piloting with doctors in Karnataka and Delhi to ensure that they were locally appropriate. Each provider’s total reward payment is the sum of rewards earned for their performance in each of the five domains of care.
For example, pre-intervention coverage of the inputs in the Childbirth Care domain was estimated at about 65 per cent (𝒙𝒙 Childbirth Care = 65) in the study area. Providers earn 𝛼𝛼 Childbirth Care = Rs. 750 (equivalent to about $15 at the time of the contract) for every percentage point in coverage of these inputs above 65 per cent. For example, if the coverage of inputs in the Childbirth Care domain in the provider’s patient population was 75 per cent, she would earn $150, and if she was able to provide care satisfying all the WHO standards for all patients, she would earn $525.
Each provider is instructed that input quality will be measured through household surveys of patients who come to her for care over the following year. At the end of this period, providers in the inputs group are given a one-time reward payment based on their performance in the five domains of care. To minimize the likelihood that providers selectively refuse high-risk patients, the contract contains a clause that if evidence of refusal to provide care is detected in the local population, the contract will be voided and the provider will be ineligible for the reward payment.
ARM 3: control contract Providers in the control arm are offered a contract to participate in the study, but no incentive payments. They are made aware of input and output categories and offered the same information that providers in treatment arms receive (see ‘Intervention Design’ for more details).
Incentive payment amounts calculation
Incentive payment amounts (𝛼𝛼i) were calculated based on budget considerations and the projected range of performance changes. Specifically, we anticipated a maximum average performance of 90 per cent for inputs in each of the five domains and a minimum average rate of 5 per cent for outcomes in the three maternal morbidity categories. We allocated a fixed Rs. 15,000 for zero neonatal deaths in the provider’s patient population. Given these projected performance outcomes in both treatment groups, the total quantity budgeted for rewards was then divided between outputs and inputs. This means that the maximum reward payment in each of the treatment groups is approximately the same and that if all providers included in the experiment achieved our anticipated highest performance on average, no money would be left on the table.
Within each treatment group, the money allocated for rewards was evenly divided among each category (with the exception of neonatal mortality, which was given a
38
fixed reward intended to be close to the amount paid out in other categories). As a result, incentive payment amounts are mechanically higher or lower depending on how high or low baseline rates are. Payments for each higher percentage point in inputs performance range from Rs. 450 to Rs. 3,700, and for each lower percentage point in outputs performance range from Rs. 850 to Rs. 8,650.
Selection of providers into the study
The set of providers included in the experiment was selected in three stages. In the first stage, we identified the potential universe of private providers who offer obstetric care in rural areas in Karnataka. Using 2001 census GIS data from the Government of Karnataka, we generated an initial list of hoblis (geographic areas similar to rural towns) where there was no large public health provider such as a District Hospital, Taluk Hospital, Sub-Divisional Hospital, Community Health Center (CHC), or a fully staffed functional 24/7 Primary Health Center (PHC). Note that this process eliminated all hoblis in urban areas. For all hoblis meeting these criteria, we developed GIS maps of all villages within a 10 km radius of each hobli, using the 2001 census GIS data from the Government of Karnataka. A survey team appointed by the Government of Karnataka visited each of the hoblis and, through interviews with local key informants such as local health workers, identified all formal private medical providers who provide obstetric care. If no such providers were identified in a study hobli, the investigators expanded the search to the rest of the taluk, including to hoblis that have CHCs, well-functioning 24/7 PHCs, or taluk hospitals. 319 potential providers were identified using this method and data on potentially eligible providers was made available to our research team.
Among the 319 providers, 280 were identified as potentially eligible for participation in the study based on the size of their catchment area, number of other potentially eligible providers nearby, number of deliveries conducted per month, and proximity to district headquarters. These 280 providers were contacted and interviewed by a survey team retained by Government of Karnataka between October 2012 and January 2013 to collect preliminary information about providers, the volume of deliveries they conduct, and obstetric services they provide, in order to further refine the list of eligible providers.
In the second stage, based on the results from the baseline provider data collection financed by the Government of Karnataka, 72 providers were dropped from the sample of 280 private obstetric because they stopped conducting deliveries, provided obstetric care services rarely or irregularly, or moved out of the area. The remaining 208 private obstetric care providers were randomized to receive one of the two types of incentive agreements or into the control arm.
In the third stage, our field team verified the eligibility of providers by visiting each of the 208 providers. During this process, we excluded 35 providers who were ineligible (fewer than 2 deliveries in the last month and fewer than 24 deliveries in the last year; stopped conducting deliveries; those who practiced at large multi-specialty hospitals or in urban areas that were included in error in stage. (1). An additional 19
39
providers who were no longer interested in participating were also dropped. We added 21 additional providers who were found to be eligible through snowball sampling, but were not identified in the first stage. Agreements were signed with 175 providers between February and April 2013. Over the course of the study (up through mid-November), an additional 10 providers declined to participate or were found ineligible (e.g. because the provider changed work location or stopped conducting deliveries). Our final sample before household level data collection began was 164 providers, with 47 in the input arm, 60 in the output arm, and 57 in the control arm. 19 per cent of these providers have a BAMS degree and over 70 per cent have at least an MBBS.
Randomization
Providers in the sampling frame were allocated to each of the three experimental arms using simple randomization. To account for new providers identified during the third stage, an additional 200 placeholders with unique ids were also allocated through simple randomization at the same time. New providers were assigned the next available unique ID and corresponding treatment arm as they were identified in the field.
Intervention design & data collection
Baseline provider visit: October 2012 – January 2013
From October 2012 through January 2013, a study team organized by the Government of Karnataka visited all providers and conducted baseline interviews with each provider and one staff member at her facility to learn about her current medical practices, expectations about the performance of the average doctor in rural Karnataka, training, job satisfaction, perceived market share, and the facility’s capacities, staffing, and provider demographics. Only providers in the original sample were included in this visit.
First provider intervention visit: February – April 2013
Beginning in mid-February through April 2013, our field team met with all 229 providers (208 from the original sample plus the additional 21 providers identified in the third stage of provider selection) in the study to introduce the contracts, provide educational resources, and interview each provider about her expectations of her own and the average rural Karnataka doctor’s current performance and ability to improve through a closed- ended survey. All providers received the same educational resources and were asked the same survey questions, apart from a few that were specific to the assigned contract.
Additionally, new providers (those identified through snowballing) and one of their staff members participated in a brief survey with a subset of the questions asked in the baseline interviews of the providers in the original sample.
The field team was trained to administer the visit in the same order at each visit and to verify that the provider understood the contract, including, for treatment groups,
40
that the provider had the potential to earn approximately Rs. 150,000 (about $2,700 at the time of the contract, equivalent to more than 15 per cent of a mid-level doctor’s salary and more than double the state per capita income5) in reward payments and that any evidence of refusal to treat high-risk patients would result in an immediate termination of the contract with no further payments. Additionally, they were instructed to prepare to discuss what kinds of changes they could make to improve their own performance for when the field team returned in a few months.
Providers were given Rs. 2,500 immediately after the first visit for their time and for participating in the study, and instructed that they would receive Rs. 2,500 at each of the two main subsequent visits. The entire visit took about one hour.
Second provider intervention visit: May – August 2013
From mid-May to mid-August 2013, the field team returned to all providers to follow up and learn about what kinds of strategies each provider had adopted or was planning to adopt in order to improve her own performance. They also administered short questionnaires to each provider to measure provider risk aversion, learn about current medical practices, extent of job training, job satisfaction, and perception of market share. Administrators also participated in a one of three randomly assigned questionnaires covering facility capacities and practices (random assignment of these questionnaires was independent of treatment status). Finally, the field team discussed with each provider feasible strategies for gathering the provider’s comprehensive patient list of women who deliver in her facility over the next four-six months. All providers were offered Rs. 2,500 for their time and continued participation.
Household surveys of women: December 2013 – April 2014
Beginning in December 2013 through April 2014, at least 25 women from each provider’s patient list6 who have recently given birth at the provider’s facility will be interviewed with a comprehensive closed-ended survey that covers a range of topics, including questions that allow us to measure adverse health outcomes and the quality of care that each woman has received. Questions used for identifying health outcomes and quality of care were generally chosen in order to (1) match with questions previously validated in the literature as useful measures given limitations in women’s recall and ability to observe and understand what is happening during labor and delivery, or (2) match with questions identified in a validation study in June – July 2011 among women in rural Karnataka, where women’s answers 7 – 14 days after delivery were compared to the observations of a trained observer present through her entire delivery. The household survey is expected to take about one hour and will be administered 7 – 20 days after delivery. A shortened version will be administered in cases where the baby or mother has died.
5‘Karnataka’.
6During the second provider intervention visit, the field team developed a feasible strategy for transmitting each provider’s patient list every 10 days to the field team.
41
In addition to the 25 women interviewed from each provider’s patient list, an additional 110 women who have recently given birth will be interviewed 7 – 20 days post-delivery in each provider’s cluster7, a geographical area formed by asking from which villages each provider receives patients during the baseline provider interview, or the closest 35 villages, whichever is smaller. These women are identified through interviews with key informants (typically ASHA or other health workers) in each cluster. In all, about 14,990 women will be interviewed.
All women who were interviewed using the main household instrument will also be interviewed at least 28 days after delivery with a very brief instrument that will allow us to calculate 28-day infant mortality. This interview is expected to take no more than ten minutes.
Third provider intervention visit: June 2014
In June 2014, the field team will return to all participating providers. All providers will be offered a final Rs. 2,500 participation payment and will be interviewed by the study team. Treatment providers will be given their one-time reward payment corresponding to their performance level over the study period.
1. Empirical strategy
General econometric framework
Individual level
In order to estimate the treatment effects of the intervention we plan to regress outcomes related to each hypothesis on dummy variables indicating treatment status. For patient- level outcomes we will use the following specification:
𝒚𝒚𝒊𝒊𝒊𝒊 = 𝜶𝜶 + 𝜷𝜷𝒊𝒊𝑻𝑻𝒊𝒊 + 𝒖𝒖𝒊𝒊𝒊𝒊 (1)
where𝑦𝑦ip is the outcome of interest for woman i who has received care from provider p, and 𝑇𝑇p is a vector of treatment indicators. In the event that there is a lack of balance on time-invariant covariates, we will control for these in equations (1).
In a second specification, we will add additional covariates to the baseline model:
𝑦𝑦ip =𝛼𝛼 + 𝛽𝛽p𝑇𝑇p + 𝜃𝜃𝑋𝑋p + 𝑠𝑠d + 𝜆𝜆e+ 𝑢𝑢ip ( 2 )
Where 𝑋𝑋p is a vector of baseline (pre-contract) provider characteristics, 𝑠𝑠d are district level fixed effects, and 𝜆𝜆e are enumerator fixed effects. While the inclusion of these covariates will not change the coefficient of interest (given correctly-implemented randomization), doing so may improve precision. Because we did not conduct a pilot
study and suitable data is not otherwise available, we know little about this potential gain in precision a priori.
7Because some providers are located close to one another, there are a total of 99 clusters covering the 164 providers in the study.
42
Additionally, because any improvement in provider quality induced by our interventions may alter demand for an obstetrician’s services and the composition of her patients, we will include patient level covariates to assess the sensitivity of our key estimates of interest.8 In order to get a more accurate assessment of the providers’ response to
where everything is the same as in (2), apart from the additional inclusion of 𝑍𝑍i, a vector of time-invariant household characteristics (such as mother’s age, education status, religion and birth history). All errors are clustered at the provider level.
We plan to implement a similar strategy for individual analysis at the cluster population- level (rather than just the patient-list) sample:
𝑦𝑦ic = 𝛼𝛼 + 𝛽𝛽c𝑇𝑇c + 𝑢𝑢ic (4)
where𝑦𝑦ic is the outcome of interest for woman i who has received care in cluster c, and 𝑇𝑇c is a vector of dummy variables for each treatment arm and interactions among them in cluster c (the cluster’s treatment is based on the treatment of each study provider in the cluster; each cluster has one to six providers, with 92 per cent having three or fewer). In a second specification using the cluster population-level sample, we include additional covariates:
where 𝑋𝑋p is a vector of baseline (pre-contract) provider characteristics, 𝛿𝛿e is a vector of time-invariant cluster characteristics (such as urban status, population), 𝑍𝑍i is a vector of time-invariant household characteristics (such as mother’s age, education status, religion and birth history), 𝑠𝑠d are district level fixed effects, and 𝜆𝜆e are enumerator fixed effects. All errors are clustered at the cluster level.
Provider level
A final approach will look at treatment effects at the provider level. For this approach, we will use the following specification:
𝑦𝑦p = 𝛼𝛼 + 𝛽𝛽p𝑇𝑇p + 𝑢𝑢p (6)
Where 𝑦𝑦p is the outcome for provider 𝑝𝑝 and 𝑇𝑇p is a vector of treatment indicators. In the event that there is a lack of balance on time-invariant covariates, we will control for these in equation (6).
8We will follow Altonji et al. (2005) to assess the sensitivity of our estimates to different covariates.
43
We will also extend this specification to include covariates:
𝑦𝑦p = 𝛼𝛼 + 𝛽𝛽p𝑇𝑇p + 𝜃𝜃𝑋𝑋p + 𝛿𝛿𝛿𝛿e + 𝑠𝑠d + 𝑢𝑢p (7)
where are all variables are similarly defined.
Finally, following the logic for specification (3) at the individual level, we will also extend the specification to:
where 𝑉𝑉p are provider-level averages of their own patients’ characteristics.
Standard errors
Inference will be conducted clustering the standard errors at the provider level unless specified otherwise and using the cluster-corrected Huber-White estimator.
Power calculations
Power calculations were conducted prior to the trial. Estimated baseline performance rates and feasible improvement levels were determined using existing data from government surveys and calibrated through piloting with doctors in Karnataka and Delhi to ensure that they were locally appropriate. (Each of these enters into the contracts as ‘baseline’ and ‘target’ performance level.)
For all specifications at the individual level, we assume an intra-class correlation coefficient of 0.05 and that there are 25 individuals per provider. At the individual level, all five categories for quality of care have at least 85 per cent power to detect improvements that reach the target levels, with the ‘Childbirth Care’, ‘Postnatal Maternal Care’, and ‘Postnatal Newborn Care’ categories having at least 95 per cent power. Two of the four outputs, post-partum haemorrhage and pre-eclampsia have at least 85 per cent power to detect improvements to the target levels.
Note that these calculations do not take into account additional precision gained by including covariates. Multiple outcomes
For each hypothesis, we will report a mean index, which combines the information of closely inter-related outcomes. We will compute this index as in Anderson 2008 (section 3.2.1) and report its associated p-value.9 The individual outcomes that are part of the index (part of the same hypothesis) are defined in the ‘Hypothesis and Indicators’ section below. We will also report the results for individual outcomes. In addition to normal p-values we will also report p-values adjusted for multiple comparisons within the hypothesis so as to control the Familywise Error Rate Control
9The procedure suggested increases efficiency by ensuring that outcomes that are highly correlated with each other receive less weight.
44
(using the free step-down resampling method as in Westfall and Young 1993). For hypotheses regarding heterogeneity in response, we will treat each variable as a separate hypothesis (i.e. tests for heterogeneous effects will not be adjusted).
2. Hypotheses
Main hypotheses are presented below.10 Each of the specifications (equations 1- 6)
above will be estimated using the indicators associated with the listed dependent variables, with coefficients of interest appearing in the third column below. Specific details about how each indicator will be measured are presented in the appendix. For regressions at the provider level (equations 6 – 7), individual (respondent) level indicators are averaged across all women interviewed from the provider’s patient list.
Maternal morbidity and neonatal mortality primarily influenced by care before time of delivery
i. Respondent has pre-eclampsia ii. Respondent’s baby isstillborn
PH1: 𝛽𝛽0 <𝛽𝛽C
PH2: 𝛽𝛽1 <𝛽𝛽C PH3: 𝛽𝛽 0 = 𝛽𝛽1
Maternal morbidity and neonatal mortality primarily influenced by care at time of delivery
i. Respondent has postpartum haemorrhage
ii. Respondent has sepsis iii. Respondent’s baby is born alive, but
later dies iv. Respondent’s baby is stillborn or is
born alive, but later dies12
PH4: 𝛽𝛽0 <𝛽𝛽C
PH5: 𝛽𝛽1 <𝛽𝛽C
PH6: 𝛽𝛽0 = 𝛽𝛽1
Quality of obstetric and newborn care primarily influenced by care before time of delivery
i. Respondent has high quality Pregnancy Care
PH7: 𝛽𝛽0 >𝛽𝛽C
PH8: 𝛽𝛽1 >𝛽𝛽C
PH9: 𝛽𝛽0 = 𝛽𝛽1
Quality of obstetric and newborn care primarily influenced by care at time of delivery
i. Respondent has high quality Childbirth Care
ii. Respondent has high quality Postnatal Maternal Care
iii. Respondent has high quality Newborn Care
PH10: 𝛽𝛽0 >𝛽𝛽C
PH11: 𝛽𝛽1 >𝛽𝛽C
PH12: 𝛽𝛽0 = 𝛽𝛽1
Quality of obstetric and newborn care primarily influenced by care after time of delivery
i. Respondent has high quality Postnatal Newborn Care
PH13: 𝛽𝛽0 >𝛽𝛽C
PH14: 𝛽𝛽1 >𝛽𝛽C
PH15: 𝛽𝛽0 = 𝛽𝛽1
Note that, regardless of phrasing, all hypotheses will be tested as two tailed hypotheses. 11𝛽𝛽0 refers to the coefficient on 𝑇𝑇0utput, 𝛽𝛽1 refers to the coefficient on 𝑇𝑇1nput, and 𝛽𝛽C refers to the coefficient on 𝑇𝑇Cantral. 12Two measures of neonatal mortality are used in order to overcome over-reporting of stillborn deaths compared with neonatal death (where, by definition, the baby was born alive but later died).
46
Non-contracted outcomes and multitasking (eq. 1 – 5)
Contracts were designed to minimize harmful multitasking; potentially affected inputs and outputs therefore are less commonly relevant, so we are likely underpowered to identify any significant effects in this section.
Table A2. Summary statistics and balance by treatment group assignment Variables
Input group mean (N)
Output group mean (N)
Control group mean (N)
Input –output (t-statistic)
Treatment– control (t-statistic)
Mother’s age 24.29 (2976)
24.52 (833)
24.42 (1213)
23.92 (930)
0.098 (0.27)
Mother illiterate 0.13 (2926)
0.15 (813)
0.12 (1194)
0.14 (919)
0.032 (0.62)
Mother ever had hypertension 0.06 (2972)
0.09 (833)
0.05 (1211)
0.05 (928)
0.036 (1.12)
Mother ever diabetic 0.01 (2976)
0.01 (833)
0.01 (1212)
0.01 (931)
–0.002 (–0.25)
Mother ever have asthma 0.01 (2917)
0.01 (823)
0.01 (1185)
0.01 (909)
–0.002 (–0.31)
Mother ever have hyper- or 0.01 0.01 0.02 0.01 –0.005 hypothyroidism (2917) (823) (1185) (909) (–0.76) Mother ever had previous 0.11 0.1 0.1 0.13 –0.001 abdominal surgery (2917) (823) (1185) (909) (–0.05) Mother ever had fit or 0.01 0.01 0 0.01 0.008 convulsion while not pregnant (2977) (833) (1213) (931) (2.16) Mother’s first pregnancy 0.49
(2972) 0.47 (830)
0.51 (1212)
0.47 (930)
–0.042 (–1.43)
Number of previous 1.78 1.77 1.76 1.83 0.018 pregnancies (2970) (829) (1212) (929) (0.28) Number of children birthed 1.7
(2972) 1.68 (830)
1.67 (1212)
1.77 (930)
0.009 (0.16)
Mother ever have previous 0.1 0.1 0.1 0.11 –0.001 stillbirth/abortion (2972) (830) (1212) (930) (–0.07) Head of household is Hindu 0.79
(2970) 0.79 (829)
0.82 (1212)
0.75 (929)
–0.026 (–0.72)
Head of household is in 0.41 0.42 0.37 0.45 0.053 General Caste (2970) (829) (1212) (929) (0.85) House is made of semi-pucca 0.5
(2970) 0.47 (829)
0.52 (1212)
0.5 (929)
–0.049 (–0.91)
House is made of pucca 0.33 (2970)
0.32 (829)
0.31 (1212)
0.38 (929)
0.012 (0.25)
Household owns land 0.51 (2930)
0.54 (816)
0.5 (1200)
0.5 (914)
0.04 (0.78)
Household has no literate 0.12 0.14 0.08 0.14 0.051 adults (2921) (812) (1190) (919) (1.15) Household owns BPL card 0.63
(2924) 0.66 (820)
0.59 (1197)
0.65 (907)
0.065 (1.48)
Monthly HH income in INR 8108.59 (2334)
7406.43 (645)
9027.34 (951)
7538.35 (738)
–1620.904 (–1.24)
Monthly HH income in INR, 5475.69 4963.76 5535.84 5850.51 –572.075 dropping top 5% (2141) (603) (851) (687) (–1.05)
51
Table A3. Summary statistics and balance by treatment group assignment of providers
Variables all Input group
Output group
Control group
Test of equality
(p-value)1
Female provider (%) 0.56 (0.5)
0.55 (0.5)
0.57 (0.5)
0.55 (0.5)
0.98
MBBS (%) 0.79 (0.41)
0.71 (0.46)
0.83 (0.38)
0.8 (0.41)
0.42
BAMS (%) 0.18 (0.38)
0.26 (0.45)
0.15 (0.36)
0.14 (0.35)
0.33
Other qualification (%) 0.04 (0.19)
0.03 (0.16)
0.02 (0.14)
0.07 (0.25)
0.52
Years practicing (mean) 19.93 (10.68)
19.68 (9.95)
20.98 (11)
18.89 (11.04)
0.64
Years clinic operating (mean) 17.32 (11.84)
15.5 (11.04)
19.28 (12.78)
16.52 (11.24)
0.3
N 135 38 53 44
Notes. Provider characteristics are self-reported and measured through interviews with the provider or with a staff member. Standard deviations are reported in parentheses.
1 P-values are associated with F-tests of joint equality across the three study groups.
52
Table A4: Impact of provider incentives on inputs
Pregnancy care Childbirth care Postnatal maternal care
R2 0.144 0.172 0.216 0.269 0.158 0.192 0.191 0.224 0.247 0.306 Notes: Robust standard errors, clustered at the provider level, are reported in parentheses. Each specification includes district fixed effects; even columns additionally include household-level controls (mother’s age and education; household’s caste and house type (houseless, kutcha, semi-pucca, or pucca); head of household’s religion; mother’s history of hypertension, diabetes, asthma, hyper- or hypothyroidism, and convulsions; whether the mother has had a previous stomach surgery; whether it is the mother’s first pregnancy, number of previous pregnancies, whether the mother has had a stillbirth or abortion, and number of previous children birthed; whether the household owns land, has no literate adults, and owns a Below Poverty Line card) as well as provider-level controls (primary provider’s gender, professional qualifications, number of years in practice, and number of years that the facility has been in operation). All dependent variables are measured through household surveys and are based on WHO Guidelines (available at http://whqlibdoc.who.int/hq/2007/who_mps_07.05_eng.pdf); see appendix for details of measurement.
* Significant at the 90% confidence level, ** Significant at the 95% confidence level, *** Significant at the 99% confidence level.
Table A5: Impact of provider incentives on outputs
Postpartum
Notes: Robust standard errors, clustered at the provider level, are reported in parentheses. Each specification includes district fixed effects; even columns additionally include household-level controls (mother’s age and education; household’s caste and house type (houseless, kutcha, semi-pucca, or pucca); head of household’s religion; mother’s history of hypertension, diabetes, asthma, hyper- or hypothyroidism, and convulsions; whether the mother has had a previous stomach surgery; whether it is the mother’s first pregnancy, number of previous pregnancies, whether the mother has had a stillbirth or abortion, and number of previous children birthed; whether the household owns land, has no literate adults, and owns a Below Poverty Line card) as well as provider-level controls (primary provider’s gender, professional qualifications, number of years in practice, and number of years that the facility has been in operation). All dependent variables are measured through household surveys; see appendix for details of measurement.
* Significant at the 90% confidence level, ** Significant at the 95% confidence level, *** Significant at the 99% confidence level.
Household-and No Yes No Yes No Yes No Yes provider-level controls Control mean 0.348 0.348 0.200 0.200 0.0775 0.0775 0.0117 0.0117 Observations 2,890 2,608 2,894 2,608 2,891 2,608 2,894 2,608
As noted in the experimental study’s pre-analysis plan, the reported outcomes can generally be grouped into five broader primary hypotheses related to:
1. Maternal morbidity and neonatal mortality primarily influenced by care before the time of delivery
2. Maternal morbidity and neonatal mortality primarily influenced by care at the time of delivery
3. Quality of obstetric and newborn care primarily influenced by care before the time of delivery
4. Quality of obstetric and newborn care primarily influenced by care at the time of delivery
5. Quality of obstetric and newborn care primarily influenced by care after the time of delivery
In order to correct for the multiple relevant outcomes that fall within each of these hypotheses, as well as the multiple hypotheses arising from two treatment groups, we report adjusted p-values using the free step-down resampling method as in Westfall and Young 1993.1
1Note that these adjustments are preliminary and are likely to change.
55
Table A6: Impact of provider incentives on outputs - correcting for correlated outcomes
District fixed effects Yes Yes Yes Household- and provider- Yes Yes Yes level controls Control mean 0.348 0.0775 0.0117 Observations 2,608 2,608 2,608
R2 0.128 0.0482 0.0300
Notes: Robust standard errors, clustered at the provider level, are reported in parentheses. The associated p-value is reported below. The adjusted p-values are calculated using the free step-down resampling method and implemented using code from Soledad Giardili and Marcos Vera Hernandez, accounting for the grouping of childbirth care, postnatal maternal care, and newborn care into inputs that are primarily influenced by care at the time of delivery. Each specification includes district fixed effects and household-level controls (mother’s age and education; household’s caste and house type (houseless, kutcha, semi-pucca, or pucca); head of household’s religion; mother’s history of hypertension, diabetes, asthma, hyper- of hypothyroidism, and convulsions; whether the mother has had a previous stomach surgery; whether it is the mother’s first pregnancy, number of previous pregnancies, whether the mother has had a stillbirth or abortion, and number of previous children birthed; whether the household owns land, has no literate adults, and owns a Below Poverty Line card) as well as provider-level controls (primary provider’s gender, professional qualifications, number of years in practice, and number of years that the facility has been in operation). All dependent variables are measured through household surveys; see appendix for details of measurement.
* Significant at the 90% confidence level after adjustment, ** Significant at the 95% confidence level after adjustment, *** Significant at the 99% confidence level after adjustment.
56
Table A7: Impact of provider incentives on inputs - correcting for correlated outcomes Postnatal
District fixed effects Yes Yes Yes Household-andprovider- Yes Yes Yes
level controls Control mean -0.00128 -0.000 -0.005 Observations 2,607 2,607 2,608 R2 0.269 0.192 0.224
Notes: Robust standard errors, clustered at the provider level, are reported in parentheses. The associated p-value is reported below. The adjusted p-values are calculated using the free step-down resampling method and implemented using code from Soledad Giardili and Marcos Vera Hernandez, accounting for the grouping of childbirth care, postnatal maternal care, and newborn care into inputs that are primarily influenced by care at the time of delivery. Each specification includes district fixed effects and household-level controls (mother’s age and education; household’s caste and house type (houseless, kutcha, semi-pucca, or pucca); head of household’s religion; mother’s history of hypertension, diabetes, asthma, hyper- of hypothyroidism, and convulsions; whether the mother has had a previous stomach surgery; whether it is the mother’s first pregnancy, number of previous pregnancies, whether the mother has had a stillbirth or abortion, and number of previous children birthed; whether the household owns land, has no literate adults, and owns a Below Poverty Line card) as well as provider-level controls (primary provider’s gender, professional qualifications, number of years in practice, and number of years that the facility has been in operation). All dependent variables are measured through household surveys and are based on WHO Guidelines (available at http://whqlibdoc.who.int/hq/2007/who_mps_07.05_eng.pdf); see appendix for details of measurement.
* Significant at the 90% confidence level after adjustment, ** Significant at the 95% confidence level after adjustment, *** Significant at the 99% confidence level after adjustment.
References Acharya, A, McNamee, P. Assessing Gujarat’s ‘Chiranjeevi’ scheme. Econ Polit Wkly. 44: 2009: 13–15.
ALTONJI, Joseph G., Todd E. ELDER, and Christopher R. TABER. ‘Selection on observed and unobserved variables: Assessing the effectiveness of Catholic schools.’ Journal of political economy 113.1 (2005): 151–184.
Basinga, P, Gertler, P, Binagwaho, A, Soucat, A, Sturdy, J, Vermeersch, C. Effect on maternal and child health services in Rwanda of payment to primary healthcare providers for performance: an impact evaluation. Lancet. 377(9775): 2011: 1421–28.
Bhat, R, Mavalankar, D.V., Singh, P.V., Singh, N. Maternal healthcare financing: Gujarat’s Chiranjeevi scheme and its beneficiaries. J Health Popul Nutr. 27: 2009: 249–58.
Das, J, Hammer, J. Are institutional births institutionalizing deaths? World Bank Future Development blog. 20 November 2014. Retrieved from: http://blogs.worldbank.org/futuredevelopment/are-institutional-births-institutionalizing-deaths
Das, J, Hammer, J, Sánchez-Paramo, C. The impact of recall periods on reported morbidity and health seeking behaviour. J Dev Econ. 98: 2012: 76–88.
Das, J, Holla, A, Das, V, Mohanan, M, Tabak, D, et al. In urban and rural India, a standardized patient study showed low levels of provider training and huge quality gaps. Health Affairs. 31: 2012: 2774–84.
Das, J, Hammer, J. Are institutional births institutionalizing deaths? World Bank Future Development blog. 20 November 2014. Retrieved from: http://blogs.worldbank.org/futuredevelopment/are-institutional-births-institutionalizing-deaths
Das, J. The quality of medical care in low-income countries: from providers to markets. PLoS Med. 8(4): 2011: e1000432.
Department of Health and Family Welfare, Government of Karnataka.
Gandhinagar: Gujarat Government Vital Statistics Division. 2011. Health statistics, Gujarat 2009–2010. Retrieved from: http://www.gujhealth.gov.in/images/pdf/Health-review-09-10.pdf
Goldie, S.J., Sweet, S, Carvalho, N, Natchu, U.C.M., Hu, D. Alternative strategies to reduce maternal mortality in India: a cost-effectiveness analysis. PLoS Med. 7: 2010: e1000264.
Krupp, K, Madhivanan, P. Leveraging human capital to reduce maternal mortality in India: enhanced public health system or public-private partnership? Hum Resour Health.7: 2009: 18.
Leonard, Kenneth L. African traditional healers and outcome-contingent contracts in health care. Journal of Development Economics. 71(1): 2003: 1–22.
Leonard, K.L., and Masatu, M.C. Using the Hawthorne effect to examine the gap between a doctor's best possible practice and actual performance. Journal of Development Economics. 93(2): 2010: 226–34.
Mavalankar, D, Singh, A, Patel, S.R., Desai, A, Singh, P.V. Saving mothers and newborns through an innovative partnership with private sector obstetricians: Chiranjeevi scheme of Gujarat, India. Int J Gynecol Obstet. 107: 2009: 271–6.
Mohanan, M, Bauhoff, S, la Forgia, G, Singer-Babiarz, K, Singh, K, and Miller, G. Effect of Chiranjeevi Yojana on institutional deliveries and neonatal and maternal outcomes in Gujarat, India: a difference-in-differences analysis. Bulletin of the World Health Organization. 92(3): 2014: 153–228.
Miller, G, and Singer-Babiarz, K. 'Pay-for-performance incentives in low- and middle-income country health programs,’ in Tony Cuyler (ed.), Encyclopaedia of Health Economics: Elsevier, forthcoming.
Miller, G, Luo, R, Zhang, L, Sylvia, S, Shi, Y, Foo, P, Zhao, Q, Martorell, R, Medina, A, Rozelle, S. Effectiveness of provider incentives for anaemia reduction in rural China: a cluster randomised trial. BMJ.,2012:345: e4809.
Miller, G, and Singer-Babiarz, K. ‘Pay-for-performance incentives in low- and middle-income country health programs,’ in Tony Cuyler (ed.), Encyclopaedia of Health Economics: Elsevier, forthcoming.
Mohanan, M, et al. The know-do gap in quality of care for childhood diarrhea and pneumonia in India. JAMA-Paediatrics. Forthcoming.
Mazumdar, S, Mills, A, Powell-Jackson, T. Financial incentives in health: new evidence from India’s Janani Suraksha Yojana. 2012. Available from: http://www.lidc.org.uk/_assets/JSY_VersionII_May2012.pdf
Ramesh, M. Innovation award for Gujarat. The Hindu Business Line. 6 November 2006. Available from: http://www.thehindubusinessline.in/bline/2006/11/06/stories/2006110600801500.htm
Randive, B, Diwan, V, De Costa, A. India’s conditional cash transfer programme (the JSY) to promote institutional birth: is there an association between institutional birth proportion and maternal mortality? PLoS ONE. 8(6): 2013: e67452.
Registrar General of India. 2013. Special Bulletin on Maternal Mortality in India 2010-12, Sample Registration System. New Delhi: Government of India.
Rosenthal, M.B., and Frank, R.G. What is the empirical basis for paying for quality in health care? Medical Care Research and Review. 63(2): 2006: 135–57.
Singh, A, Mavalankar, D.V., Bhat, R, Desai, A, Patel, S.R., Singh, P.V., et al. Providing skilled birth attendants and emergency obstetric care to the poor through partnership with private sector obstetricians in Gujarat, India. Bull World Health Organ.87: 2009: 960–4.
World Health Organization. Trends in maternal mortality: 1990 to 2013: estimates by WHO, UNICEF, UNFPA, The World Bank and the United Nations Population Division. 2014. Retrieved from: http://apps.who.int/iris/bitstream/10665/112682/2/9789241507226_eng.pdf
World Health Organization, 2014. Trends in maternal mortality: 1990 to 2013: estimates by WHO, UNICEF, UNFPA, The World Bank and the United Nations Population Division. Retrieved from: http://apps.who.int/iris/bitstream/10665/112682/2/9789241507226_eng.pdf
Publications in the 3ie Impact Evaluation Report Series
The following reports are available from http://www.3ieimpact.org/en/publications/3ie-impact-evaluation-reports/3ie-impact-evaluations/
Evaluating the effectiveness of computers as tutors in China, 3ie Impact Evaluation Report 41. Mo, D, Bai, Y, Boswell, M and Rozelle, S (2016)
A triple win? The impact of Tanzania’s Joint Forest Management programme on livelihoods, governance and forests, 3ie Impact Evaluation Report 34. Persha, L and Meshack, C (2016)
Removing barriers to higher education in Chile: evaluation of peer effects and scholarships for test preparation 3ie Impact Evaluation Report 36. Banerjee, A, Duflo E, Gallego, F (2016)
Sustainability of impact: dimensions of decline and persistence in adopting a biofortified crop in Uganda 3ie Impact Evaluation Report 35. McNiven, S, Gilligan, DO and Hotz, C (2016)
Micro entrepreneurship support programme in Chile, 3ie Impact Evaluation Report 40. Martínez, CA, Puentes, EE and Ruiz-Tagle, JV (2016)
Thirty-five years later: evaluating the impacts of a child health and family planning programme in Bangladesh, 3ie Impact Evaluation Report 39. Barham, T, Kuhn, R, Menken, J and Razzaque, A (2016)
Can egovernance reduce capture of public programmes? Experimental evidence from India’s employment guarantee, 3ie Impact Evaluation Report 31. Banerjee, A, Duflo, E, Imbert, C, Mathew, S and Pande, R (2015)
Smallholder access to weather securities in India: demand and impact on production decisions, 3ie Impact Evaluation Report 28. Ceballos, F, Manuel, I, Robles, M and Butler, A (2015)
What happens once the intervention ends? The medium-term impacts of a cash transfer programme in Malawi, 3ie Impact Evaluation Report 27. Baird, S, Chirwa, E, McIntosh, C, and Özler, B (2015)
Validation of hearing screening procedures in Ecuadorian schools, 3ie Impact Evaluation Report 26. Muñoz, K, White, K, Callow-Heusser, C and Ortiz, E (2015)
Assessing the impact of farmer field schools on fertilizer use in China, 3ie Impact Evaluation Report 25. Burger, N, Fu, M, Gu, K, Jia, X, Kumar, KB and Mingliang, G (2015)
The SASA! study: a cluster randomised trial to assess the impact of a violence and HIV prevention programme in Kampala, Uganda, 3ie Impact Evaluation Report 24. Watts, C, Devries, K, Kiss, L, Abramsky, T, Kyegombe, N and Michau, L (2014)
Enhancing food production and food security through improved inputs: an evaluation of Tanzania’s National Agricultural Input Voucher Scheme with a focus on gender impacts, 3ie Impact Evaluation Report 23. Gine, X, Patel, S, Cuellar-Martinez, C, McCoy, S and Lauren, R (2015)
A wide angle view of learning: evaluation of the CCE and LEP programmes in Haryana, 3ie Impact Evaluation Report 22. Duflo, E, Berry, J, Mukerji, S and Shotland, M (2015)
Shelter from the storm: upgrading housing infrastructure in Latin American slums, 3ie Impact Evaluation Report 21. Galiani, S, Gertler, P, Cooper, R, Martinez, S, Ross, A and Undurraga, R (2015)
Environmental and socioeconomic impacts of Mexico's payments for ecosystem services programme, 3ie Impact Evaluation Report 20. Alix-Garcia, J, Aronson, G, Radeloff, V, Ramirez-Reyes, C, Shapiro, E, Sims, K and Yañez-Pagans, P (2015)
A randomised evaluation of the effects of an agricultural insurance programme on rural households’ behaviour: evidence from China, 3ie Impact Evaluation Report 19. Cai, J, de Janvry, A and Sadoulet, E (2014)
Impact of malaria control and enhanced literacy instruction on educational outcomes among school children in Kenya: a multi-sectoral, prospective, randomised evaluation, 3ie Impact Evaluation Report 18. Brooker, S and Halliday, K (2015)
Assessing long-term impacts of conditional cash transfers on children and young adults in rural Nicaragua, 3ie Impact Evaluation Report 17. Barham, T, Macours, K, Maluccio, JA, Regalia, F, Aguilera, V and Moncada, ME (2014)
The impact of mother literacy and participation programmes on child learning: evidence from a randomised evaluation in India, 3ie Impact Evaluation Report 16. Banerji, R, Berry, J and Shortland, M (2014)
A youth wage subsidy experiment for South Africa, 3ie Impact Evaluation Report 15. Levinsohn, J, Rankin, N, Roberts, G and Schöer, V (2014)
Providing collateral and improving product market access for smallholder farmers: a randomised evaluation of inventory credit in Sierra Leone, 3ie Impact Evaluation Report 14. Casaburi, L, Glennerster, R, Suri, T and Kamara, S (2014)
Scaling up male circumcision service provision: results from a randomised evaluation in Malawi, 3ie Impact Evaluation Report 13. Thornton, R, Chinkhumba, J, Godlonton, S and Pierotti, R (2014)
Targeting the poor: evidence from a field experiment in Indonesia, 3ie Impact Evaluation Report 12. Atlas, V, Banerjee, A, Hanna, R, Olken, B, Wai-poi, M and Purnamasari, R (2014)
An impact evaluation of information disclosure on elected representatives’ performance: evidence from rural and urban India, 3ie Impact Evaluation Report 11. Banerjee, A, Duflo, E, Imbert, C, Pande, R, Walton, M and Mahapatra, B (2014)
63
Truth-telling by third-party audits and the response of polluting firms: Experimental evidence from India, 3ie Impact Evaluation Report 10. Duflo, E, Greenstone, M, Pande, R and Ryan, N (2013)
No margin, no mission? Evaluating the role of incentives in the distribution of public goods in Zambia, 3ie Impact Evaluation Report 9. Ashraf, N, Bandiera, O and Jack, K (2013)
Paying for performance in China’s battle against anaemia, 3ie Impact Evaluation Report 8. Zhang, L, Rozelle, S and Shi, Y (2013)
Social and economic impacts of Tuungane: final report on the effects of a community-driven reconstruction programme in the Democratic Republic of Congo, 3ie Impact Evaluation Report 7. Humphreys, M, Sanchez de la Sierra, R and van der Windt, P (2013)
The impact of daycare on maternal labour supply and child development in Mexico, 3ie Impact Evaluation Report 6. Angeles, G, Gadsden, P, Galiani, S, Gertler, P, Herrera, A, Kariger, P and Seira, E (2014)
Impact evaluation of the non-contributory social pension programme 70 y más in Mexico, 3ie Impact Evaluation Report 5. Rodríguez, A, Espinoza, B, Tamayo, K, Pereda, P, Góngora, V, Tagliaferro, G and Solís, M (2014)
Does marginal cost pricing of electricity affect groundwater pumping behaviour of farmers? Evidence from India, 3ie Impact Evaluation Report 4. Meenakshi, JV, Banerji, A, Mukherji, A and Gupta, A (2013)
The GoBifo project evaluation report: Assessing the impacts of community-driven development in Sierra Leone, 3ie Impact Evaluation Report 3. Casey, K, Glennerster, R and Miguel, E (2013)
A rapid assessment randomised-controlled trial of improved cookstoves in rural Ghana, 3ie Impact Evaluation Report 2. Burwen, J and Levine, DI (2012)
The promise of preschool in Africa: A randomised impact evaluation of early childhood development in rural Mozambique, 3ie Impact Evaluation Report 1. Martinez, S, Naudeau, S and Pereira, V (2012)
Impact Evaluation Series
International Initiative for Impact Evaluation 202-203, Rectangle One D-4, Saket District Centre New Delhi – 110017 India
Local governments in the Indian states of Gujarat and Karnataka have programmes to enable pregnant mothers from poor households to access free maternity care at public or private hospitals. This study evaluated two such programmes to provide empirical evidence on how to structure contracts with private health providers, offering them incentives to improve quality and health outcomes. The researchers found that the Chiranjeevi Yojna in Gujarat and the Thayi Bhagya Yojana in Karnataka had no significant effect on institutional delivery rates or maternal health outcomes. However, the incentive experiment revealed that input incentive contracts reduced rates of post-partum haemorrhage. This study concluded that low quality of healthcare, and lack of motivation and incentives for providers limited the potential impact of such public sector initiatives.