Page 1
IMPROVING NITROGEN EFFICIENCY THROUGH ENHANCED
UREA-NITROGEN RECYCLING IN RUMINANTS
A Thesis Submitted to
the College of Graduate Studies and Research
in Partial Fulfillment of the Requirements for
the Degree of Doctor of Philosophy
in the Department of Animal and Poultry Science
University of Saskatchewan
Saskatoon, SK
Canada
By
KATE DAVIES
Copyright Kate Davies, May, 2013. All rights reserved.
Page 2
i
PERMISSION TO USE
In presenting this thesis in partial fulfillment of the requirements for a Postgraduate
degree from the University of Saskatchewan, I agree that the Libraries of this University may
make it freely available for inspection. I further agree that permission for copying of this thesis
in any manner, in whole or in part, for scholarly purposes may be granted by the professor or
professors who supervised my thesis work or, in their absence, by the Head of the Department or
the Dean of the College in which my thesis work was done. It is understood that any copying or
publication or use of this thesis or parts thereof for financial gain shall not be allowed without
my written permission. It is also understood that due recognition shall be given to me and to the
University of Saskatchewan in any scholarly use which may be made of any material in my
thesis.
Requests for permission to copy or to make other use of material in this thesis in whole or
part should be addressed to:
Head of the Department of Animal and Poultry Science
University of Saskatchewan
51 Campus Drive, Saskatoon SK, S7N 5A8
Canada
Page 3
ii
ABSTRACT
Three experiments were conducted to study dietary effects on urea-nitrogen (N) recycling
as a strategy to improve the efficiency of N utilization in ruminants. Experiment 1 examined the
effects of feeding diets containing two levels of dietary crude protein (CP; 10.8 vs. 14.0%) and
ruminally-degradable protein (RDP; 73.4 vs. 76.0% of CP) on urea-N recycling to the gastro-
intestinal tract (GIT), N balance, and microbial protein production in beef heifers. Feeding the
low CP diet decreased N intake (P < 0.01), ruminal ammonia-N (NH3-N) concentration (P <
0.01) and urinary N excretion (P <0.01). Endogenous urea-N production increased (P = 0.03)
with increasing dietary CP level, as did urinary urea-N loss (P = 0.04). However, urea-N transfer
to the gastro-intestinal tract (GIT) was similar across diets, with most of this N returned to the
ornithine cycle. Microbial N supply was unaffected (P > 0.05) by dietary treatment. Experiment
2 examined the effects of feeding diets containing two levels of ruminally-degradable starch
(RDS; 28.6 vs. 69.2% of total starch) and RDP (48.0% vs. 55.0% of CP) on urea-N recycling to
the GIT, N balance, duodenal nutrient flow, and ruminal microbial protein production in beef
heifers fed low CP (10%) diets. Ruminal NH3-N concentration was greater (P = 0.01) in heifers
fed high RDP as compared with those fed low RDP, and it was also greater (P = 0.01) in heifers
fed low RDS as compared with those fed high RDS. Microbial N flow to the duodenum
increased as RDP level increased on the high RDS diet, but was not affected by RDP level on the
low RDS diet (interaction; P = 0.04). Urea-N entry rate and urea-N transfer to the gastro-
intestinal tract were similar (P > 0.05) across diets. The amount of recycled urea-N that was
incorporated into microbial N increased as RDP level increased on the high RDS diet, but the
opposite was observed on the low RDS diet (interaction; P = 0.008). Experiment 3 examined the
effects of feeding diets containing two levels of CP (14.9 vs. 17.5%) and RDP (63.0 vs. 69.0% of
Page 4
iii
CP) on urea-N recycling to the GIT, microbial protein production, N balance, omasal nutrient
flow, and milk production in lactating dairy cows. Nitrogen intake (P < 0.01) and both urinary N
(P < 0.01) and urea-N (P < 0.01) output were greater for cows fed the high compared with those
fed the low CP diet. Ruminal NH3-N concentration tended to be greater in cows fed the high than
those fed the low CP diet (P = 0.06), and was greater in cows fed high RDP as compared with
those fed the low RDP diet (P < 0.01). However, N balance, milk yield, and microbial N supply
were unaffected (P > 0.05) by dietary treatment. The proportion of endogenous urea-N that was
recycled to the GIT (i.e., GER: UER) was greater (P = 0.02) in cows fed the low CP compared
with those fed the high CP diet. In summary, the results of this thesis show that reducing dietary
CP level in beef and dairy cattle reduces urinary N excretion whilst maintaining microbial N
supply. In addition, judicious combinations of RDP and RDS when feeding low CP diets can
potentially enhance the efficiency of microbial N production. These data show that through
careful dietary manipulation, overall efficiency of N utilization can be improved leading to a
reduction in N excretion into the environment.
Page 5
iv
ACKNOWLEDGEMENTS
I would like to express my sincere gratitude to my co-supervisors Drs. John Mckinnon
and Tim Mutsvangwa for their encouragement, support and constructive critism throughout my
PhD program and for the opportunity to develop my skills and knowledge. Appreciation is also
extended to members of my committee including Drs. Tim McAllister, Peiqiang Yu, Gordon
Zello, and Fiona Buchanan for their time and expertise in completing this thesis.
I am very grateful to Andy Hansen and the staff of the Livestock Research Building as
well as Marlene Fehr and the staff of the Greenbrea Dairy Herd for their assistance and
encouragement whilst conducting research for this thesis. Special thanks to Dr. Fritz Schumman
for expertise and laughter during catheter days and for taking care of the Speckle Park heifers.
The research in this thesis would not have been possible without the technical expertise, endless
hours of sample collections and support of friends, fellow graduate students, researchers and the
staff of the Department of Animal and Poultry Science. I will be forever grateful to the many
people that have helped and encouraged me during this long journey. Your wonderful friendship
and kindness mean a lot and made Saskatoon feel like home; Pam Kish, Dr. Kiran Doranalli,
Amanda Walker, Ravi Heedeniya, Dr. Scott Wright, Gwen Kipfer, Melissa Zink, Janice
Halabura, Lynne DeMare, Betty-Ann Atimoyoo, Angela Hennings, Katie Thiessen, Irene
Northey, Logan Williams, Lee-Anne Walter, Gwinyai Chibisa, Rachel Claassen and members of
Saskatoon Search and Rescue, the Saskatoon and District Kinette Club and Campus Howlers
Toastmasters.
To my family, thank you for your love, patience, motivation and support. Even though
sometimes it feels like you are far away I know that you are always there for me and words
cannot express how much you mean to me.
Page 6
v
TABLE OF CONTENTS
PERMISSION TO USE.................................................................................................... ii
ABSTRACT....................................................................................................................... iii
ACKNOWLEDGEMENTS.............................................................................................. v
TABLE OF CONTENTS................................................................................................. vi
LIST OF TABLES............................................................................................................ x
LIST OF FIGURES.......................................................................................................... xiii
LIST OF ABBREVIATIONS........................................................................................... xiv
1 GENERAL INTRODUCTION........................................................................... 1
2 REVIEW OF LITERATURE............................................................................. 4
2.1 Introduction.................................................................................................... 4
2.2 Ruminal Degradation of Dietary Protein........................................................ 5
2.3 Ammonia Absorption...................................................................................... 10
2.4 The Urea Cycle............................................................................................... 12
2.5 Urea-Nitrogen Recycling................................................................................ 15
2.6 Urea-Nitrogen Transfer to the Gastrointestinal Tract..................................... 16
2.6.1 Urea-Nitrogen Transfer into the Rumen.................................................. 16
2.7 Factors Affecting Urea-Nitrogen Recycling to the Rumen............................ 19
2.7.1 Dietary Nitrogen Intake........................................................................... 19
2.7.2 Dietary Ruminally-Degradable Protein Concentration............................ 20
2.7.3 Dietary Ruminally-Fermentable Carbohydrate Concentration................ 21
2.7.4 Ruminal NH3-N Concentration............................................................... 23
2.7.5 Ruminal Volatile Fatty Acid Concentration and Ruminal pH................ 24
Page 7
vi
2.7.6 Plasma Urea-Nitrogen Concentration...................................................... 25
2.8 Conclusions...................................................................................................... 26
2.8 Hypothesis and Objectives............................................................................... 27
3 EFFECTS OF DIETARY CRUDE PROTEIN AND RUMINALLY-
DEGRADABLE PROTEIN LEVELS ON UREA RECYCLING, MICORIBAL
PROTEIN PRODUCTION, AND NITROGEN BALANCE IN BEEF
HEIFERS............................................................................................. 28
3.1 Abstract............................................................................................................ 28
3.2 Introduction....................................................................................................... 29
3.3 Materials and Methods........................................................................................... 30
3.3.1 Animals and Experimental Design............................................................. 30
3.3.2 Sample Collection....................................................................................... 31
3.3.3 Sample Analyses......................................................................................... 33
3.3.4 Calculations and Statistical Analysis.......................................................... 35
3.4 Results............................................................................................................... 36
3.4.1 Dietary Characteristics................................................................................. 36
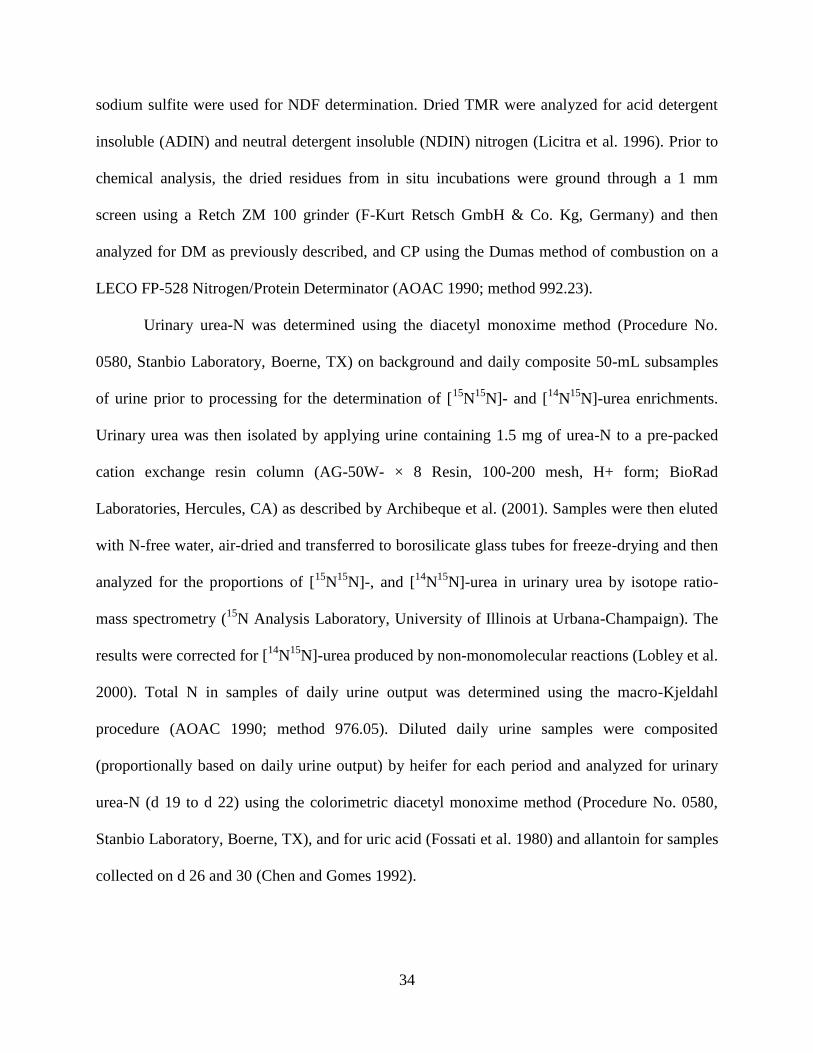
3.4.2 Ruminal Fermentation Characteristics......................................................... 36
3.4.3 Nutrient Intake and Total-tract Nutrient Apparent Digestibility................. 37
3.4.4 Nitrogen Balance......................................................................................... 37
3.4.5 Microbial Protein Production....................................................................... 43
3.4.6 Urea-N Kinetics........................................................................................... 43
3.5 Discussion............................................................................................................... 47
Page 8
vii
4 EFFECTS OF DIETARY RUMINALLY-DEGRADABLE STARCH AND
RUMINALLY-DEGRADABLE PROTEIN LEVELS ON UREA
RECYCLING, MICROBIAL PROTEIN PRODUCTION, NITROGEN
BALANCE, AND DUODENAL NUTRIENT FLOW IN BEEF HEIFERS
FED LOW CRUDE PROTEIN DIETS..............................................................
54
4.1 Abstract.............................................................................................................. 54
4.2 Introduction........................................................................................................ 55
4.3 Materials and Methods............................................................................................. 56
4.3.1 Animals and Experimental Design.............................................................. 56
4.3.2 Sample Collection........................................................................................ 57
4.3.3 Sample Analyses.......................................................................................... 60
4.3.4 Calculations and Statistical Analysis........................................................... 62
4.4 Results................................................................................................................ 64
4.4.1 Dietary Characteristics................................................................................. 64
4.4.2 Ruminal Fermentation Characteristics......................................................... 65
4.4.3 Nutrient Intake, Duodenal Nutrient Flow, and Ruminal and Total-tract
Nutrient Digestibility............................................................................................... 65
4.4.4 Nitrogen Balance......................................................................................... 69
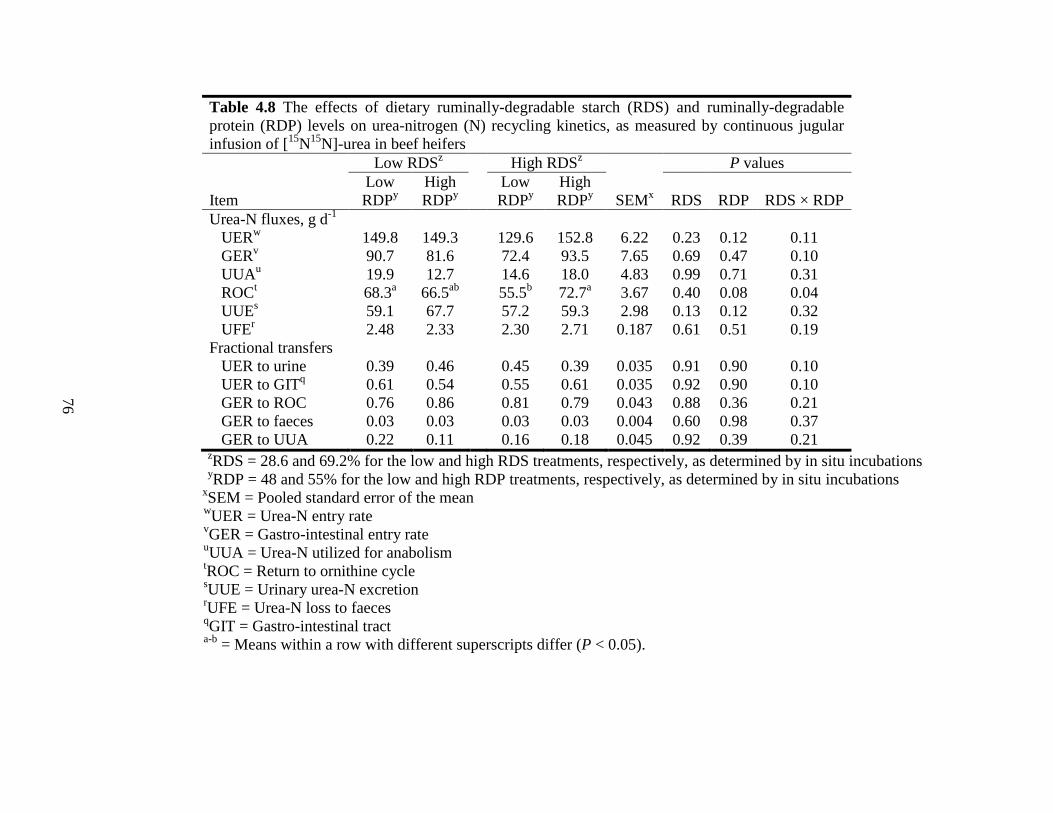
4.4.5 Microbial Protein Production...................................................................... 74
4.4.6 Urea-N Kinetics.......................................................................................... 74
4.5 Discussion........................................................................................................... 77
Page 9
viii
5 EFFECTS OF DIETARY CRUDE PROTEIN AND RUMINALLY-
DEGRADABLE PROTEIN LEVELS ON UREA RECYCLING,
MICROBIAL PROTEIN PRODUCTION, NITROGEN BALANCE,
OMASAL NUTRIENT FLOW, AND MILK PRODUCTION IN
LACTATING HOLSTEIN DAIRY COWS........................................................
85
5.1 Abstract................................................................................................................ 85
5.2 Introduction......................................................................................................... 86
5.3 Materials and Methods.............................................................................................. 88
5.3.1 Animals and Experimental Design................................................................ 88
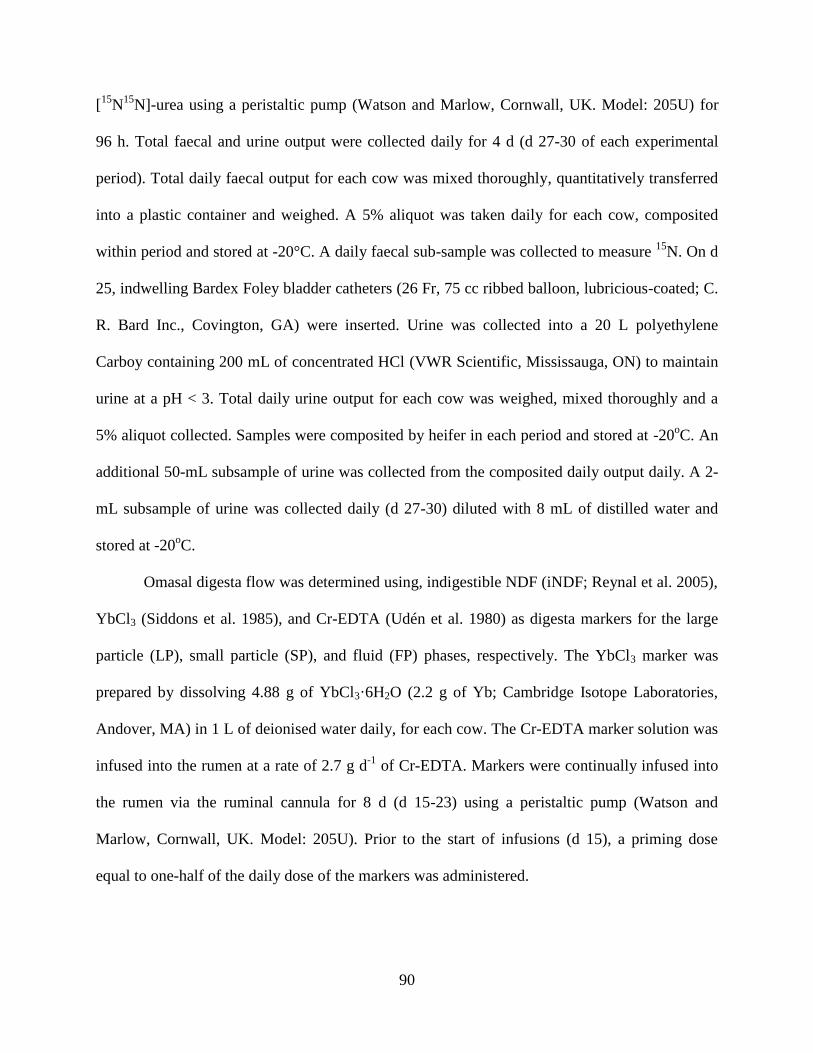
5.3.2 Experimental Treatments and Feeding Management.................................... 89
5.3.3 Sample Collection......................................................................................... 89
5.3.4 Sample Analyses........................................................................................... 91
5.3.5 Calculations and Statistical Analysis............................................................ 94
5.4 Results................................................................................................................. 95
5.4.1 Dietary Characteristics.................................................................................. 95
5.4.2 Ruminal Fermentation Characteristics.......................................................... 95
5.4.3 Nutrient Intake, Omasal Nutrient Flow, and Ruminal and Total-tract
Nutrient Digestibility................................................................................... 99
5.4.4 Nitrogen Balance.......................................................................................... 99
5.4.5 Microbial Protein Production....................................................................... 99
5.4.6 Milk Production and Composition............................................................... 103
5.4.7 Urea-N Kinetics............................................................................................ 106
5.5 Discussion................................................................................................................. 108
Page 10
ix
6 GENERAL DISCUSSION.................................................................................... 114
7 OVERALL CONCLUSIONS............................................................................... 118
8 REFERENCES....................................................................................................... 119
Page 11
x
LIST OF TABLES
Table 3.1 Ingredients and chemical composition of diets fed to beef heifers........... 38
Table 3.2 Chemical composition of dietary ingredients............................................ 39
Table 3.3 In situ ruminal degradation kinetics of crude protein (CP) in dietary
ingredients.................................................................................................. 40
Table 3.4 The effects of dietary crude protein (CP) and ruminally-degradable
protein (RDP) levels on ruminal fermentation characteristics in beef
heifers........................................................................................................... 41
Table 3.5 The effects of dietary crude protein (CP) and ruminally-degradable
protein (RDP) levels on intake and total-tract nutrient apparent
digestibility in beef heifers.......................................................................... 42
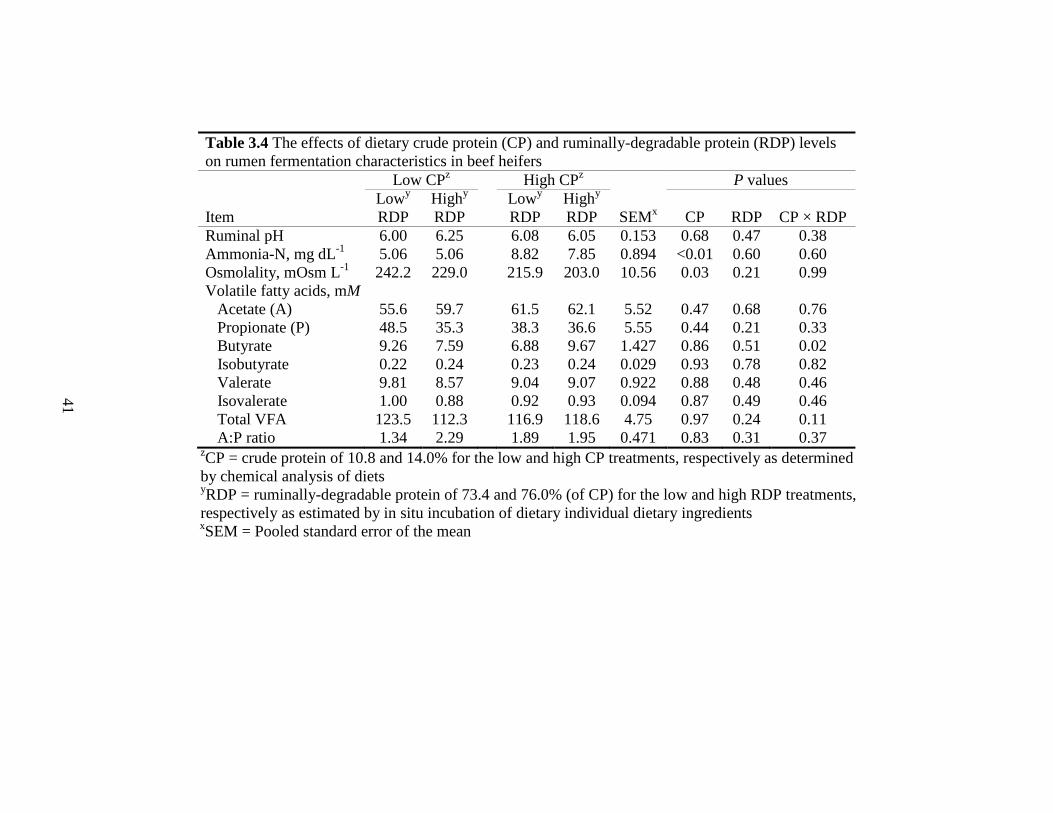
Table 3.6 The effects of dietary crude protein (CP) and ruminally-degradable
protein (RDP) levels on nitrogen (N) intake, retention, digestibility and
plasma urea-N concentrations in beef heifers.............................................. 44
Table 3.7 The effects of dietary crude protein (CP) and ruminally-degradable
protein (RDP) levels on microbial nitrogen (N) supply as measured by
purine derivatives (PD) in beef heifers........................................................ 45
Table 3.8 The effects of dietary crude protein (CP) and ruminally-degradable
protein (RDP) levels on urea-nitrogen (N) recycling kinetics, as
measured by continuous jugular infusions of [15
N15
N]-urea in beef
heifers........................................................................................................... 46
Table 4.1 Ingredient and chemical composition of diets fed to beef heifers............... 66
Table 4.2 Chemical composition of dietary ingredients.............................................. 67
Page 12
xi
Table 4.3 In situ ruminal degradation kinetics of crude protein (CP) and starch in
total mixed rations....................................................................................... 68
Table 4.4 The effects of dietary ruminally-degradable starch (RDS) and ruminally-
degradable protein (RDP) levels on ruminal fermentation characteristics
in beef heifers............................................................................................... 70
Table 4.5 The effects of dietary ruminally-degradable starch (RDS) and ruminally-
degradable protein (RDP) levels on intake, flow to the duodenum,
ruminal digestibility, and total-tract nutrient digestibility in beef heifers... 71
Table 4.6 The effects of dietary ruminally-degradable starch (RDS) and ruminally-
degradable protein (RDP) levels on nitrogen (N) intake, retention,
digestibility, and plasma urea-N concentrations in beef heifers.................. 73
Table 4.7 The effects of dietary ruminally-degradable starch (RDS) and ruminally-
degradable protein (RDP) levels on microbial nitrogen (N) flow at the
duodenum measured by 15
N as a microbial marker in beef heifers............. 75
Table 4.8 The effects of dietary ruminally-degradable starch (RDS) and ruminally-
degradable protein (RDP) levels on urea-nitrogen (N) recycling kinetics,
as measured by continuous jugular infusion of [15
N15
N]-urea in beef
heifers........................................................................................................... 76
Table 5.1 Chemical composition of dietary ingredients.............................................. 96
Table 5.2 Ingredient and chemical composition of diets fed to lactating Holstein
cows........................................................................................................... 97
Table 5.3 The effects of dietary crude protein (CP) and ruminally-degradable
protein (RDP) levels on ruminal fermentation characteristics in lactating
Page 13
xii
Holstein cows............................................................................................. 98
Table 5.4 The effects of dietary crude protein (CP) and ruminally-degradable
protein (RDP) levels on intake, flow at the omasum, rumen digestibility,
and total-tract digestibility in lactating Holstein cows................................ 100
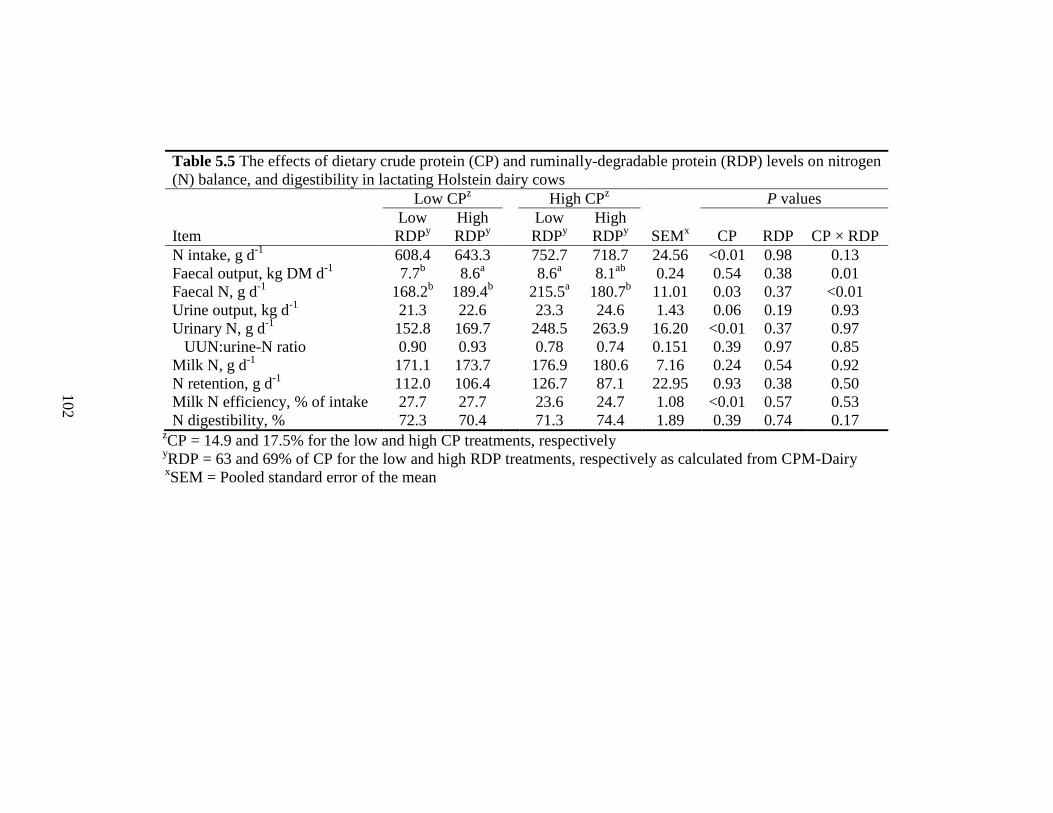
Table 5.5 The effects of dietary crude protein (CP) and ruminally-degradable
protein (RDP) levels on nitrogen (N) balance, and digestibility in
lactating Holstein cows................................................................................ 102
Table 5.6 The effects of dietary crude protein (CP) and ruminally-degradable
protein (RDP) levels on microbial nitrogen (N) flow at the omasum
measured by urinary excretion of purine derivatives (PD) in lactating
Holstein cows............................................................................................... 104
Table 5.7 The effects of dietary crude protein (CP) and ruminally-degradable
protein (RDP) levels on milk production and composition in lactating
Holstein cows.............................................................................................. 105
Table 5.8 The effects of dietary crude protein (CP) and ruminally-degradable
protein (RDP) levels on urea-nitrogen (N) recycling kinetics, as
measured by continuous jugular infusions of [15
N15
N]-urea in lactating
Holstein cows.............................................................................................. 107
Page 14
xiii
LIST OF FIGURES
Figure 2.1 Ruminal nitrogen metabolism................................................................. 6
Figure 2.2 Absorption of ammonia across the ruminal epithelium.......................... 11
Figure 2.3 Metabolic reactions of the urea cycle...................................................... 14
Page 15
xiv
LIST OF ABBREVIATIONS
[15
N15
N]-urea Double-labelled urea
AA Amino acids
ADF Acid detergent fiber
ADIA Acid detergent insoluble ash
ADIN Acid detergent insoluble nitrogen
AOAC Association of Official Analytical Chemists
BW Body weight
CP Crude protein
DM Dry matter
FP Fluid phase
GER GIT entry rate (amount of recycled urea-N entering the GIT)
GIT Gastro-intestinal tract
ILO Intensive Livestock Operation
LP Large particle phase
MUN Milk urea nitrogen
N Nitrogen
NA Natural abundance
NAN Non-ammonia-nitrogen
NDF Neutral detergent fiber
NDIN Neutral detergent insoluble nitrogen
NH3 Ammonia
NH4+ Ammonium ion
Page 16
xv
NO2 Nitrogen dioxide
N2O Nitrous oxide
NPN Non-protein nitrogen
OM Organic matter
OMTDR Organic matter truly digested in the rumen
OTD Omasal true digesta
PD Purine derivatives
PUN Plasma urea-nitrogen
RDP Ruminally-degradable protein
RDN Ruminally-degradable nitrogen
RDS Ruminally-degradable starch
RFC Ruminally-fermentable carbohydrate
ROC Urea-nitrogen reentering the ornithine cycle in the liver
RUP Ruminally-undegradable protein
SP Small particle phase
TMR Total mixed ration
UER Urea-N entry rate (total endogenous urea-N production)
UFE Urea-N in faeces
UT Urea transporter(s)
UUA Urea-N utilized for anabolism
UUE Urinary urea-N elimination
UUN Urinary urea-N
VFA Volatile Fatty Acids
Page 17
1
1 GENERAL INTRODUCTION
Improving the efficiency of nitrogen (N) utilization in ruminant animals is an important
factor in reducing feed costs and mitigating the negative environmental impact of intensive
livestock operations (ILO). Ruminants are relatively inefficient at utilizing dietary N. For
example, in beef cattle approximately 25% of dietary N is retained in tissue, with the remainder
being excreted in the faeces (29%) and urine (39%) (Bierman 1999; Gaylean 1996). In dairy
cows, 25 to 30% of dietary N is deposited in milk protein, with 70 to 75% excreted in the faeces
and urine (Tamminga 1992). The excretion of excess dietary N, particularly as urinary N, can
have a negative impact on the environment. It has been estimated that 50 to 90% of urinary N is
in the form of urea-N (Reynal and Broderick 2005). Once excreted, urea-N is rapidly volatilized
to ammonia, and can be converted to nitrous oxide (N2O) which is an important greenhouse gas
(Janzen et al. 2003; Baggs and Philippot 2010; Hristov et al. 2011). Urinary N can also leach into
soil and ground water as nitrate (Tamminga 1992; Socolow 1999; Cowling and Galloway 2002).
Faecal N is mostly present in a complexed organic form that is less volatile than urinary N, and
therefore, partitioning more excreted N to faeces rather than urine offers an opportunity to reduce
environmental pollution (de Klein and Ledgard 2005). Furthermore, reducing the amount of feed
that is required to produce a unit of meat or milk reduces feed costs and improves overall
production efficiency (Chandler 1996). Efficiency of nutrient utilization is becoming more
important as demand for livestock products increases due to increased population growth and the
increasing affluence of developing countries (Steinfeld et al. 2006; de Klein et al. 2010). As well,
there is increasing public concern over sustainable agricultural production practices (Janzen
2011). Several strategies can be used to address the issue of inefficient N usage in ruminants,
including reducing dietary crude protein (CP) concentration, increasing microbial capture of
Page 18
2
recycled N, and feeding management practices such as feeding frequency and the feeding of a
total mixed ration (TMR) (Tamminga 1992; Castillo et al. 2000; Lapiere and Lobley 2001;
Flachowsky and Lebzien 2006; Hristov et al. 2011).
Extensive ruminal degradation is contributes significantly to the inefficient utilization of
dietary protein. Dietary protein arriving in the rumen is degraded by ruminal microorganisms to
peptides, amino acids (AA) and ammonia (NH3) which can be used by some ruminal microbes to
synthesize microbial protein (Bach et al. 2005). However, ruminal microorganisms degrade
dietary protein regardless of microbial requirements for N, potentially resulting in excess
ammonia-N (NH3-N) in the rumen (Leng and Nolan 1984). Ammonia can become toxic if
allowed to accumulate in the tissues and can even lead to death. Therefore, NH3 in excess of
microbial requirements is absorbed across the ruminal wall and transported to the liver via portal
blood where it is detoxified by conversion to urea-N through the urea cycle and is subsequently
transported to the kidneys for excretion in the urine or it can be recycled to the gastrointestinal
tract (GIT) either through blood of saliva (Lapierre and Lobley 2001).
The recycling of urea-N to the GIT is an important salvage mechanism for ruminants
because if all endogenously produced urea-N was excreted, it would represent a substantial and
irreversible loss of N to the animal and could lead to a negative N balance or N deficiency
(Stewart and Smith 2005). Urea-N recycled to the GIT can be hydrolyzed to NH3 by microbial
enzymes and then utilized as a source of N for microbial protein synthesis, which is a major
source of AA for maintenance and productive functions in the host (Lapierre et al. 2006).
Therefore, enhancing urea-N recycling to the GIT is a potential opportunity to improve the
efficiency of N utilization in ruminants. There are several dietary and ruminal factors that affect
the rate of urea-N recycling to the GIT and its incorporation into microbial protein. These
Page 19
3
include the concentration of dietary protein and N intake (Bunting et al. 1987; Marini and Van
Amburgh, 2003; Marini et al. 2004), dry matter (DM) intake (Sarraseca et al. 1998), forage-to-
concentrate ratio (Huntington et al. 1996), and dietary levels of ruminally-degradable protein
(RDP) (Wickersham et al. 2008a; Rémond et al. 2009), and ruminally-fermentable carbohydrate
(RFC; Kennedy and Milligan 1980; Huntington 1989; Huntington et al. 2009). Ruminal factors
such as NH3-N concentration, bacterial urease activity, concentrations of volatile fatty acids
(VFA), carbon dioxide (CO2) concentration, urea transporters, and pH also effect the movement
of blood urea-N into the rumen (Kennedy and Milligan, 1980; Abdoun et al. 2010). However,
there is limited information on how simultaneous changes in these factors influence the recycling
of urea to the GIT and its subsequent incorporation into microbial protein in both beef and dairy
cattle. Therefore, the goal of this thesis was to investigate how manipulation of dietary CP, RDP
and RFC levels can influence urea-N recycling in ruminants with the aim of improving overall N
efficiency.
Page 20
4
2 REVIEW OF LITERATURE
2.1 Introduction
Modern dairy and beef operators employ intensive management systems leading to the
concentration of large numbers of animals in a confined area. The goals of such management
systems are to improve production efficiency, but they can also lead to environmental concerns
when cattle are not fed and managed properly (NRC 2001). One of the goals of ration
formulation models is to provide cattle with the necessary level of nutrients to achieve a certain
level of production (NRC 1996; NRC 2001; Fox et al. 1992). A nutrient deficiency could result
in lowered production, whereas overfeeding can lead to the excretion of excess nutrients into the
environment and increase the cost of production (Chandler 1996; Hristov and Jouany 2005).
Therefore, maximizing nutrient utilization is important in terms of managing livestock
operations. For example, when dietary protein is fed in excess of requirement, it is not used
efficiently for milk or meat production and the excess is excreted into the environment via the
faeces and urine, resulting in pollution and increased costs of production (Chandler 1996). Not
only is excess N an environmental problem it also represents an irreversible loss of nutrients
from the host (James et al. 1999). Faecal N is less volatile in the environment than urinary N
therefore management strategies that reduce overall N excretion and partition more excess N to
the faeces could potentially reduce the environmental impact of intensive livestock production
systems (de Klein and Ledgard 2005). Optimizing microbial protein production through the
enhancement of urea-N recycling in ruminants is one such strategy that requires further
investigation.
Page 21
5
2.2 Ruminal Degradation of Dietary Protein
The ruminant digestive tract provides an anaerobic environment suitable for the growth
and proliferation of a complex variety of microorganisms including eubacteria, archaebacteria
(methanogens), fungi and protozoa (Hobson and Stewart 1997). This highly diverse microbial
population secretes a wide array of enzymes that enable them to digest plant material from a
variety of sources and in turn provide the host animal with an energy source (i.e., VFA) and
high quality protein (i.e. microbial protein), resulting in a mutually beneficial symbiotic
relationship (McAllister et al. 1994; Wallace et al. 1997; Krause et al. 2003).
Figure 2.1 represents N metabolism in the rumen where feed protein is ingested and
utilized by the ruminal microbial population or might escape degradation and pass to the lower
intestinal tract. Feed nitrogen entering the rumen can be classified as either true protein or non-
protein nitrogen (NPN). True protein consists of both RDP and ruminally-undegradable protein
(RUP). Ruminally-undegradable protein is not degraded by ruminal microorganisms and
therefore exits the rumen (Satter and Roffler 1975). However, RDP has the potential to be
degraded by ruminal microorganisms to peptides, AA, and NH3 (Satter and Roffler 1974), as
illustrated in Figure 2.1. The Cornell Net Carbohydrate and Protein System (CNCPS; Fox et al.
1992) further characterizes feed protein by partitioning it into different fractions based on its rate
of degradation in the rumen (Sniffen et al. 1992). Therefore, the CNCPS provides an estimate of
feed protein availability to ruminal microorganisms (Roe et al. 1990). True protein is degraded to
peptides and AA and ultimately to NH3-N (Bach et al. 2005). Non-protein N, consists of N in
free ammonia, ammonium salts, urea, nucleic acids, biuret, nitrate, peptides, and free AA. Non-
protein nitrogen is highly soluble in the rumen and can be utilized by most ruminal
microorganisms (Bach et al. 2005).
Page 22
6
Figure 2.1. Ruminal nitrogen metabolism (adapted from Satter & Roffler 1974). Feed protein is
degraded by ruminal microorganisms to peptides, amino acids (AA), and ammonia (NH3). These
substrates can then be utilized by microorganisms for growth and proliferation. If NH3 is
produced in excess of the ruminal microorganisms ability to utilize it (i.e., there is insufficient
ruminally-fermentable energy available) then the excess is absorbed from the rumen and
converted to urea in the liver. Urea is either transported to the kidney and excreted in the urine or
recycled to the gastrointestinal tract (GIT) via saliva or across the GIT epithelium. (RDP,
ruminally-degradable protein; RUP, ruminally-undegradable protein; NPN, non-protein nitrogen;
AA, amino acids; MP, microbial protein).
Page 23
7
Multiple microbial species (including bacteria, protozoa and fungi) are involved in feed
degradation with specificity for different chemical components of feed but there is also cross-
utilization of substrates and a co-dependence in order to digest feed entering the rumen (Orpin
and Joblin 1988; Hobson and Stewart 1997; Huntington and Archibeque 2000). This is
particularly the case for cell wall components of fiberous feed (Krause et al. 2003). The ruminal
bacterial population is numerous (1010
– 1011
ml-1
of rumen digesta) and makes up roughly 60 to
90% of the total ruminal microbial biomass (Hobson and Stewart 1997). Approximately 80% of
ruminal bacteria are associated with the particle phase and play a major role in feed digestion
(Stewart et al. 1997). Particle associated bacteria are responsible for 30 to 50% of ruminal
protease activity (Prins et al. 1983). However, bacteria closely associated with feed particles are
generally cellulolytic bacteria involved with the degradation of plant cell walls (Stewart et al.
1997). Bacteria loosely associated with feed particles have been shown to have higher
phosphatase, amylase and protease activity (Stewart et al. 1997). Approximately 20% of ruminal
bacteria are associated with the fluid phase and 1 to 2% of total bacteria with the rumen wall
(Stewart et al. 1997). Most fluid phase bacteria have become detached from feed particles and
subsist on soluble feed components and therefore must constantly seek out soluble substrate
(Krause et al. 2003). The rate of cell division of fluid associated bacteria must be greater than
that of the ruminal fluid outflow rate to ensure survival (Van Soest 1994). Epimural bacteria are
bacteria that adhere to the ruminal epithelium and are mostly facultative anaerobes that sequester
oxygen as well as hydrolyze urea entering the rumen (Krause et al. 2003). Epimural bacteria are
highly proteolytic and recycle protein from sloughed epithelial cells (Hobson and Stewart 1997).
Ruminal protein degradation can be considered a multi-step process. The first step in
protein degradation involves the transport to and colonization of feed particles by ruminal
Page 24
8
microbes (Wallace et al. 1997). Secondly, microbial attachment to feed particles is important
because it places the substrate and microbial enzymes in close proximity and allows the
subsequently released nutrients to be more readily captured by adherent microorganisms
(McAllister et al. 1994). The third step is specific adhesion of microorganisms with the
substrate.. Both primary and secondary colonizers form a multispecies biofilm. The
microorganisms in this biofilm produce an array of enzymes that digest the feed substrate
releasing soluble substrates that can be utilized by the microorganisms which then release their
end-products of digestion for utilization by other microorganisms (McAllister et al. 1994). This
microbial consortium therefore becomes a highly collaborative system resulting in a stable
fermentation environment.
In the case of protein, microorganisms, including bacterial species such as Prevotella
spp., and Butyrivibrio fibrisolvens (Prins et al. 1983) release extracellular proteases, peptidases
and deaminases which degrade proteins to peptides, AA and NH3, respectively (Prins et al. 1983;
Wallace et al. 1997). These substances are then taken up intracellularly by ATP dependent
transport pathways (Leng and Nolan 1984). If there is sufficient energy available from
carbohydrate digestion, then peptides and AA and NH3-N are incorporated into microbial AA
and protein (Bach et al. 2005). It has been shown that at high NH3 concentrations, N assimilation
occurs via a process involving glutamate dehydrogenase (Leng and Nolan 1984). However,
under low NH3 concentrations, NH3 is fixed in a two-step process involving glutamine
synthetase and glutamate synthase (Leng and Nolan 1984). These reactions include the addition
of an amide group to glutamate to form glutamine followed by a reductive transfer of the amide-
N of glutamine to 2-oxoglutarate which requires ATP (Leng and Nolan 1984). Some species of
ruminal bacteria have a preference for NH3-N as their primary N source (Hungate 1966);
Page 25
9
however growth of others has been shown to increase when AA and peptides are present
(Wallace 1997).
Conversely, as depicted in Figure 2.1, if there is insufficient energy available, then
peptides, AA and NH3 are unable to be incorporated into microbial protein (Bach et al. 2005).
Ruminal bacteria do not have mechanisms to transport AA out of the cell (Tamminga 1979).
Therefore, excess AA are deaminated to NH3, VFA and CO2 in order to be passed out of the cell
into the ruminal environment (Groff and Gropper 2000).
Metabolizable protein (MP) reaching the small intestine represents AA that are available
for absorption by the host animal (NRC 2001). Metabolizable protein consists of RUP,
endogenous N sources (sloughed epithelial cells, digestive enzymes) as well as microbial protein
(Satter and Roffler 1974). Microbial protein is a source of high quality protein (i.e. microbial
protein closely matches the AA profile of meat and milk) and accounts for between 60 and 80%
of absorbable AA arriving at the small intestine (Storm and Ørskov 1983).
Ruminal protozoa are slower growing than bacteria and are highly affiliated with the
particle phase of ruminal digesta in order to prevent their washout from the rumen (Williams and
Coleman 1997). With limited passage of protozoa to the lower GIT, they contribute little
metabolizable protein to the host animal (Jouany 1996). However, protozoa cannot synthesize
AA from simple compounds of N and, therefore, they engulf ruminal bacteria or feed particles
(i.e. protein fragments) (Jouany 1996). The synthesis and breakdown of bacterial N by protozoa
represents a significant proportion of N recycling in the rumen. In addition, protozoa have been
shown to be highly proteolytic (Williams and Coleman 1997). One of the main end-products of
protozoa digestion is large amounts of NH3 (Williams and Coleman 1997). Therefore, protozoa
Page 26
10
significantly contribute to the ruminal NH3 pool, potentially increasing the need for
detoxification of NH3 through the formation of urea, which is an energetically costly process.
2.3 Ammonia Absorption
The ruminal ammonia pool consists of ammonia from microbial degradation of dietary
true protein, and from NPN sources such as urea, uric acid, nitrate, and dissolved nucleotides
(Satter and Roffler 1974). In addition, ammonia is derived from protozoa metabolism, as well as
gaseous N2 entering the rumen with feed (Bach et al. 2005). Ruminal ammonia can exit the
rumen via three major routes; 1) Ammonia can be incorporated into microbial cells as AA which
can then pass out of the rumen; 2) ammonia can also flow out of the rumen but the magnitude is
dependent on the ruminal fluid outflow rate; and 3) ammonia can be transferred across the
ruminal epithelium (Satter and Roffler 1974).
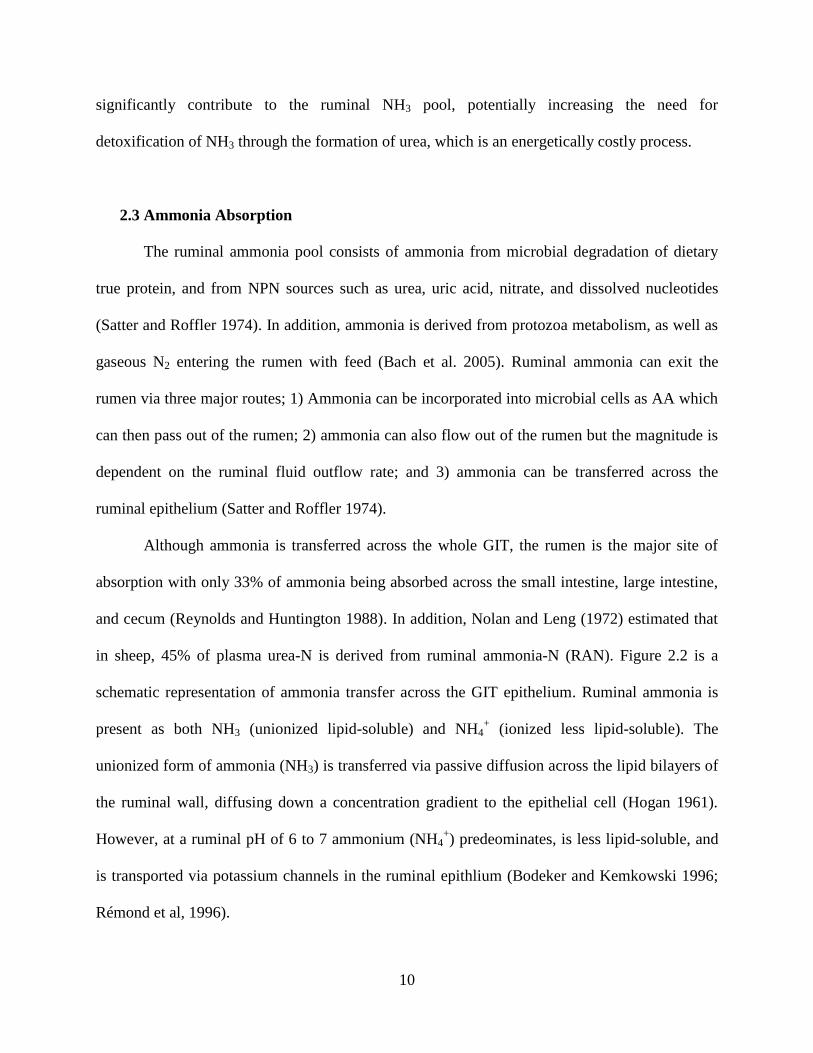
Although ammonia is transferred across the whole GIT, the rumen is the major site of
absorption with only 33% of ammonia being absorbed across the small intestine, large intestine,
and cecum (Reynolds and Huntington 1988). In addition, Nolan and Leng (1972) estimated that
in sheep, 45% of plasma urea-N is derived from ruminal ammonia-N (RAN). Figure 2.2 is a
schematic representation of ammonia transfer across the GIT epithelium. Ruminal ammonia is
present as both NH3 (unionized lipid-soluble) and NH4+ (ionized less lipid-soluble). The
unionized form of ammonia (NH3) is transferred via passive diffusion across the lipid bilayers of
the ruminal wall, diffusing down a concentration gradient to the epithelial cell (Hogan 1961).
However, at a ruminal pH of 6 to 7 ammonium (NH4+) predeominates, is less lipid-soluble, and
is transported via potassium channels in the ruminal epithlium (Bodeker and Kemkowski 1996;
Rémond et al, 1996).
Page 27
11
Figure 2.2. Absorption of ammonia across the ruminal epithelium (adapted from Bödeker et al.
1992a,b; Bödeker and Kemkowski 1996; Rémond et al, 1996). The unionized, more lipid soluble
form of ammonia (NH3) diffuses into the epithelial cell via a concentration gradient. However,
when ruminal pH is between 6 and 7, ammonium (NH4+) is predominate which dissociates into
NH3 and H+ after absorption. During absorption, NH3 forms NH4
+ by incorporating H
+ ions from
H2CO3 dissociation to HCO3- + H
+ as well as from the dissociation of RCOOH (short chain fatty
acids) to RCOO- + H
+. The transport of NH4
+ across the ruminal epithelium is facilitated by
potassium channels ( ) in the ruminal epithelium.
?
CO2
+ Metabolites
LUMEN
H2O + CO2
H+ + HCO3
NH4+
H+ + NH3
H+ + RCOO-
RCOOH
RCOOH
EPITHELIUM
CO2 + H2O
HCO3- + H+
NH4+
NH3 + H+
RCOO- + H+
RCOOH Metabolism
BLOOD
NH4
+
NH3
Metabolites
RCOOH
Page 28
12
Both ruminal and dietary factors can influence ammonia transfer from the rumen
(Huntington 1986; Reynolds and Huntington 1988; Abdoun et al. 2007; Abdoun et al. 2010).
Dietary protein concentration and intake influence ruminal ammonia concentration (Reynolds
and Kristensen 2008) as does the forage to concentrate ratio of the diet (Huntington 1986;
Reynolds and Huntington 1988). The incorporation of ruminal ammonia into microbial protein is
an energy-dependent process. This concept was demonstrated by Reynolds (1996) who reported
a reduction in ruminal ammonia concentration after infusion of starch into the rumen. Ruminal
pH is the major determinant of the NH3 to NH4+ ratio (Siddons et al. 1985; Abdoun et al. 2007)
and therefore dietary alterations influencing ruminal pH affect ammonia transfer from the rumen.
The influence of short-chain fatty acids (SCFA) and CO2 on ammonia transfer have been
discussed above and outlined by Bödeker et al. 1992a,b and Abdoun et al. 2010. Intracellular
carbonic anhydrase is an enzyme involved in the release of HCO3- and H
+ from CO2 and H2O
where the H+ can then be used in the formation of NH4
+ from absorbed NH3 (Bödeker et al.
1992a). Furthermore, the non-ionized form of SCFA are absorbed into the epithelial cell and then
dissociate, releasing H+ which can be utilized by NH3 to from NH4
+ therefore reducing the
intracellular NH3 concentration and facilitating further absorption of NH3 (Bödeker et al. 1992b).
2.4 The Urea Cycle
Ammonia can become toxic if allowed to accumulate in tissues (> 0.5 mg dL-1
). Toxicity
symptoms include tremors, blurred vision, coma, irreversible brain damage and even death (> 4.0
mg dL-1
) (Singer 2003). Different species deal with this problem in different ways. Aquatic
animals are classified as ammonotelic as they excrete ammonia from the gills into the
surrounding water where the dilution effect detoxifies the ammonia (Swenson and Reece 1993;
Page 29
13
Singer 2003). Birds and terrestrial reptiles are classified as uricotelic. They convert ammonia
into uric acid which can be stored in a solid form in a shelled egg or excreted in concentrated
urine (Wright 1995; Stewart and Smith 2005). Mammals, on the other hand, have evolved a
process in the liver called the ornithine or urea cycle and are classified as ureotelic (Singer
2003). In mammals, ammonia is transported to the liver via the portal blood where it is
detoxified by conversion to urea (Stewart and Smith 2005).
The urea cycle consists of a series of metabolic reactions which occur in the
mitochondrial matrix and cytosol of the periportal hepatocyte cells of the liver (Haussinger 1983;
Haussinger et al. 1992). However, in perivenous hepatocytes, ammonia is utilized for glutamine
synthesis, which serves as a scavenging mechanism for ammonia that avoides the formation of
urea in periportal hepatocytes (Haussinger et al. 1992). The periportal hepatocytes are the main
site of urea synthesis and a series of enzymes are employed to convert ammonia into urea.
Briefly (Figure 2.3), ammonia first combines with CO2 or HCO3- in the mitochondrial matrix to
form carbamoyl phosphate (Meijer et al. 1990). A carbamoyl group is then added to ornithine,
forming citrulline, a reaction which is catalyzed by ornithine transcarbomoylase. Citrulline is
translocated into the cytosol where citrulline and aspartate are then combined to form
argininosuccinate which is then split into fumarate (which can enter the tricarboxylic acid cycle
to serve as an intermediate for aspartate production) and arginine. Arginine is cleaved by
hydrolysis to release urea, a reaction which regenerates ornithine. Therefore, ammonia is
converted to urea using the cyclically regenerated ornithine as a carrier (Garret and Grisham
Page 30
14
Figure 2.3. Metabolic reactions of the urea cycle (adapted from Takiguchi and Mori 1995; Xie
2003). The urea cycle converts ammonia from amino acid degradation to urea. The first reaction
in the urea cycle is the condensation of ornithine and carbamaylphosphate forming citrulline (in
the mitochondrial matrix with the enzymes carbomoyl phosphate synthetase and
transcarbamoylase). Citrulline is then exported into the cytosol. Citrulline and aspartate then link
to form argininosuccinate (enzyme involved: arginosuccinate synthetase) which splits to form
fumarate and arginine (enzyme involved: arginosuccinate lyase). Arginine is cleaved by
hydrolysis (enzyme involved: arginase), releasing urea and resulting in the cyclic regeneration of
ornithine.
Page 31
15
1999). Urea formation represents an effective way to detoxify excess ammonia but it is also
energetically expensive. Three moles of ATP are required in addition to one molecule of CO2
and one molecule of aspartate to convert ammonia to urea (Swenson and Reece 1993). This
results in one molecule of urea, one of fumarate, two ADP molecules, one molecule of inorganic
pyrophosphate (PPi) and two of inorganic phosphorus (Pi) (Swenson and Reece 1993).
Rates of hepatic urea-N production (UER) vary among species and are influenced by
several dietary factors. For example, monogastrics, such as humans have low rates of UER (11.3
g N d-1
; McClelland and Jackson 1996) as compared to sheep (3-22 g N d-1
; Lobley et al. 2000;
Sunny et al. 2007; Kiran and Mutsvangwa 2010), beef cattle (20-127 g N d-1
; Archibeque et al.
2001; Wickersham et al. 2008a,b), and dairy cows (262-483 g N d-1
; Gozho et al. 2008).
2.5 Urea-Nitrogen Recycling
Urea synthesized in the liver is either transported to the kidneys for excretion in the urine
or it can be returned to the GIT, a process termed ‘urea recycling’ (Lapierre and Lobley 2001;
Stewart and Smith 2005; Reynolds and Kristensen 2008). Total hepatic urea-N production is
often greater than intake of apparently digestible N therefore if no urea-N was returned to the
GIT the host would be in a negative N balance (Lapierre and Lobley 2001). Urea-N recycling
occurs in both ruminant and non-ruminant animals. However, in ruminants, 40 to 80% of
endogenously produced urea-N can be recycled to the GIT as compared to 15 to 39% in non-
ruminants (Huntington 1989; McClelland and Jackson 1996; Russell et al. 2000). In ruminants,
urea-N can be recycled to the GIT via transfer from the blood to the lumen of the GIT (Houpt
and Houpt 1968; Ritzhaupt et al. 1998; Stewart et al. 2005). However, it has been estimated that
23 to 69% of endogenously produced urea-N is recycled to the GIT through the saliva in
Page 32
16
ruminants (Huntington 1989). The recycling of urea-N to the GIT represents an opportunity for
the anabolic use of recycled urea-N, improved overall N efficiency and the opportunity to reduce
the excretion of N into the environment (mostly via urinary urea-N; UUN).
2.6 Urea-Nitrogen Transfer to the Gastrointestinal Tract
Urea-N can be recycled across the epithelial lining of all compartments of the GIT,
including the rumen, small intestine and large intestine (Varady et al. 1979). Lapierre and Lobley
(2001) reported that 70% of endogenously produced urea-N enters the GIT by recycling to the
small intestine and limited amounts are recycled to the large intestine (cecum and colon). The
rate of entry into the small intestine varies depending on the diet fed. For example, when beef
steers were fed a high concentrate diet, only 19% of urea-N entered the small intestine (Reynolds
and Huntington 1988) but this increased to 90% when steers were fed high fiber diets
(Huntington 1989). Urea-N entering the large intestine is utilized for microbial protein synthesis,
especially when fermentable energy sources are this site are readily avaialble (Kennedy and
Milligan 1980); however, microbial protein produced at this site is excreted in the faeces and
therefore does not contribute to the AA or anabolic processes of the host (Lapierre and Lobley,
2001). Therefore, increasing the proportion of urea-N recycled to the rumen is preferable in
terms of incorporation of recycled urea-N into microbial protein and improving the efficiency of
N utilization in ruminants.
2.6.1 Urea-Nitrogen Transfer into the Rumen
The rate of urea-N entry into the rumen has been reported to vary from 27 to 60% of
urea-N entering the GIT (Houpt 1970; Egan et al. 1986; Kennedy and Milligan 1980). Harmeyer
Page 33
17
and Martens (1980) estimated that between 40 and 80% of endogenous urea-N production
entered the GIT, but this is substantially influenced by diet. For example, Huntington (1989)
reported a greater percentage of urea-N entering the rumen (as a proportion of urea-N entry to
the GIT) in steers fed a high concentrate diet as compared to those fed a low concentrate diet (i.e.
95 vs. 62.5%, respectively). The amount of urea-N entering the GIT via saliva is dependent on
the amount of saliva produced and blood urea-N concentration. Saliva production can be quite
large in cattle (220-250 liters d-1
; Maekawa et al. 2002) but can vary depending on the physical
form of the diet. For instance, high roughage diets stimulate greater saliva production than high
grain diets (Huntington 1989; Theurer et al. 2002). Huntington (1989) reported 69% of urea-N in
the rumen originated from saliva in forage-fed cattle as compared to only 23% in concentrate-fed
cattle. Therefore, increasing the forage content of the diet can increase saliva production and the
proportion of urea-N recycled to the GIT via saliva.
The second route for recycling of urea-N is across the rumen wall via the blood. Previous
studies have shown that urea crosses the ruminal epithelium primarily by passive diffusion down
a blood-rumen urea concentration gradient (Houpt and Houpt 1968). Bacteria colonizing the
ruminal epithelium (epimural bacteria; Wallace et al. 1997) utilize urease to hydrolyze incoming
urea to NH3 and carbon dioxide (CO2) (Reynolds and Kristensen 2008), thereby maintaining the
concentration gradient to allow diffusion of urea into the rumen. It has been shown that urease
activity decreases as ruminal NH3 concentration increases (Cheng and Wallace 1979).
Furthermore, Marini et al. (2004) reported a linear decrease in urease activity with increasing
levels of N intake which led to an increase in ruminal NH3 concentrations. Therefore, ruminal
NH3 concentration and bacterial urease activity are thought to be important factors in the
recycling of urea-N to the rumen (Kennedy and Milligan 1978).
Page 34
18
It has also been suggested that urea recycling to the rumen is also influenced by the
permeability of the ruminal epithelium (Harmeyer and Martens 1980). Further studies have
revealed the presence of bidirectional facilitative urea transporter (UT) proteins in the ruminal
epithelium of both sheep and cattle (Ritzhaupt et al. 1997, 1998; Marini and van Amburgh 2003)
and the bovine UT (UT-B) structure has been determined (Stewart et al. 2005). The expression
of UT-B gene could influence the rate of urea-N recycling. The expression of UT-B has been
found to depend on dietary N content in cattle (Marini and van Amburgh 2003), but this
relationship has not been substantiated in sheep (Marini et al. 2004). Other transporters of urea
include the large family of water transporters called aquaporins (AQP) which have been found in
several different tissues such as the GIT (Ma and Verkman 1999), including the bovine ruminal
papillae (Røjen et al. 2011). Røjen et al. (2011) found that AQP 3, 7, and 8 were expressed in the
ruiminal epithelia of lactating dairy cows but were not correlated with increased permeability of
the ruminal epithelial to urea on low N diets. It was concluded that AQP do not play a role in the
regulation of ruminal epithelial urea transport.
Research has shown that between 46 to 63% of urea-N recycled to the GIT can be
utilized for anabolic purposes (Sarrasecca et al. 1998; Archibeque et al. 2001; Lobley et al.
2000). Furthermore, Wickersham et al (2008a, b) reported that 72% of urea-N recycled to the
GIT was incorporated into microbial protein in cattle or sheep fed low CP diets. This mechanism
is important because it helps to conserve N and counteracts the development of a negative N
balance when dietary N supply is limited or intermittent. Urea-N recycled to the rumen can
contribute to microbial protein synthesis which supplies between 60 and 80% of metabolizable
protein at the small intestine (Satter and Roffler 1974). This is important because microbial
Page 35
19
protein is a high quality protein with an excellent AA profile compared to that of meat and milk
(Ørskov 1992).
2.7 Factors Affecting Urea-Nitrogen Recycling to the Rumen
The rate of urea-N recycled to the rumen and its utilization for anabolic purposes can be
influenced by a number of both dietary and ruminal factors. Many ruminal and dietary factors are
interrelated in terms of affecting urea-N recycling to the rumen. For example, the recycling of
urea-N to the rumen has been shown to be negatively correlated with ruminal NH3 concentration
(Kennedy and Milligan 1980). Therefore, dietary factors affecting the rate of dietary N
partitioning to ammoniagenesis will influence urea-N recycling to the rumen (Lapierre and
Lobley 2001). Furthermore, increasing the supply of ruminally-fermentable carbohydrate
increases the incorporation of ruminal NH3-N into microbial protein. This, in turn, reduces
ruminal NH3-N concentration leading to an increase in the proportion of urea-N recycled to the
rumen (Kennedy and Milligan, 1980). These and other factors are discussed in more detail
below.
2.7.1 Dietary Nitrogen Intake
There is consistent evidence showing that decreasing dietary CP level decreases plasma
urea-N concentration (PUN), the production of endogenous urea, the absolute amount of urea-N
recycled to the ruminant GIT (Kennedy and Milligan 1980; Marini and Van Amburgh 2003;
Reynolds and Kristensen 2008; Huntington et al. 2009; Muscher et al. 2010) and results in a
decrease in the amount of urea excreted in the urine (Bunting et al. 1987; Archibeque et al.
2002). Lobley et al. (2000) showed that total endogenous urea-N production (as a percentage of
Page 36
20
N intake) can vary from 77 to 95% and that this variation is, in part due to changes in dietary N
intake. Archibeque et al. (2001) found that endogenous urea-N recycled to the GIT was 11.5%
lower when steers were fed forage grown under a high N fertilization rate than those grown with
a lower level of N. In addition, Marini et al. (2004) showed that a decrease in dietary N intake
resulted in a linear decrease in urea-N recycled to the GIT. However, as a percentage of dietary
N intake, the amount of urea-N recycled to the GIT was greater for sheep fed low N diets as
compared to those fed high N diets. This mechanism allows ruminants to survive under low or
deficient dietary N conditions due to the urea salvage mechanism of urea-N recycling. Marini
and Van Amburgh (2003) found that, as a proportion of total endogenous urea-N production,
urea-N recycled to the GIT ranged from 29 to 42% in heifers fed dietary N concentrations from
34.0 to 25.0 g N kg-1
of DM. Furthermore, and of importance to this thesis is the fact that as a
proportion of endogenously produced urea-N, ruminants fed low N diets used a greater quantity
of recycled urea-N for productive purposes (i.e. microbial protein production) than ruminants fed
high N diets (Bunting et al. 1989). Also, studies in lambs (Bunting et al. 1987) demonstrated that
N flow at the duodenum was 16% greater than N intake for lambs consuming a low protein (12 g
N/d) diet. The authors suggest that N flow at the duodenum in excess of N intake could represent
either a net flow of endogenous protein or the recycling of urea-N to the rumen.
2.7.2 Dietary Ruminally-Degradable Protein Concentration
Dietary feed ingredients with a higher level of RDP result in higher ruminal NH3-N
concentration which is negatively correlated with urea-N recycling across the ruminal epithelium
(Kennedy and Milligan 1980) and is therefore an important factor influencing urea-N recycling
in ruminants. In addition, ruminal NH3-N concentration is negatively related to urease activity
Page 37
21
(Cheng and Wallace 1979) and the subsequent recycling of urea-N to the rumen (Kennedy and
Milligan 1980). As the level of RDP increased for steers fed low quality forage, there was an
increase in endogenously produced urea-N and its subsequent recycling to the rumen
(Wickersham et al. 2008a). In addition, Wickersham et al. (2009) found that increasing RDP
level in steers fed a low dietary N level, resulted in a linear increase in urea-N recycled to the
rumen and its incorporation into microbial protein. Rémond et al. (2009) showed that ruminal
ammonia loss was reduced for sheep fed a low RDP diet (extruded peas) as compared to sheep
fed a high RDP diet (raw peas), resulting in an increase in efficiency of urea-N recycled to the
GIT. This observation is supported when Siddons et al. (1985) fed grass silage or dried grass hay
to sheep and observed that this resulted in a net loss of 4.0 g N d-1
between the mouth and the
duodenum with silage as compared to a net gain of 5.5 g N d-1
with grass hay. The explanation
for this observation was that more silage NPN was degraded in the rumen leading to a higher
ruminal NH3-N concentration limiting the entry of urea-N into the rumen (Siddons et al. 1985).
Furthermore, Brake et al. (2010) altered N supplementation (urea vs. DDGS) in steers consuming
corn-based diets and found that, as a proportion of total microbial N, microbial capture of
recycled urea-N tended to be greater for the DDGS diet than the urea diet. This demonstrates a
greater reliance of ruminal microbes on recycled urea-N at a higher dietary RUP content.
2.7.3 Dietary Ruminally-Fermentable Carbohydrate Concentration
Research has demonstrated that mechanical processing of cereal grains can partially shift
the site of starch digestion from post-ruminal compartments to the rumen (Theurer et al. 1999;
Huntington 1997). Increasing dietary ruminally-fermentable carbohydrate level has been shown
to increase urea-N recycling to the rumen (Kennedy 1980; Kennedy and Milligan 1980;
Page 38
22
Huntington 1989). For example, Huntington (1989) found that steers fed high concentrate diets
recycled 45% of endogenously produced urea-N in the rumen but only 7% was recycled to the
rumen of steers fed an alfalfa diet. Furthermore, Theurer et al. (2002) showed that shifting the
site of starch digestion from the small intestine to the rumen by feeding steam-flaked as
compared to dry-rolled sorghum grain resulted in a 30% increase in urea-N recycling to the
rumen in beef steers. Lobley et al. (2000) fed an all forage diet (50% grass hay pellets and 50%
dry chopped hay) and mixed concentrate and forage diet (50% hay, 30% barley, and 20%
supplement) to sheep and found that on the concentrate and forage diet both endogenous urea-N
production and urea-N recycled to the GIT increased. Huntington et al. (2009) also demonstrated
that increasing the rumially-degradable carbohydrate level fed to steers on a predominantly
forage diet led to an increase in urea-N utilized for anabolic purposes. The greater recycling of
urea-N to the GIT could be attributed to greater incorporation of ruminal NH3-N into microbial
protein which would decrease the ruminal NH3-N concentration, in turn increasing urea-N
recycling to the rumen (Kennedy and Milligan 1980) and decreasing N excretion (Huntington
1997; Theurer et al. 1999).
The effect of dietary energy and protein supplementation on urea kinetics was studied in
growing beef steers fed prairie hay (Bailey et al. 2012a). In growing steers, energy and protein
suppplemetation did not affect urea-N entry rate or gut entry of urea-N. However, increasing
casein supplementation (120 g/d vs. 240 g/d dosed ruminally) reduced the amount of microbial N
derived from recycled urea-N. This data shows there is opportunity to manipulate the microbial
capture of recycled urea-N to improve the efficiency of N utilization in ruminants. However,
further research is required to further elucidate the effect of combining different dietary factors
Page 39
23
(i.e., RDP and ruminally-fermentable carbohydrate level) on urea-N recycling and microbial
protein production in ruminants.
2.7.4 Ruminal NH3-N Concentration
It has been consistently shown that an increase in dietary CP level results in an increase
in ruminal NH3-N concentration (Cunningham et al. 1996; Kebreab et al. 2002; Reynal and
Broderick 2005; Kiran and Mutsvangwa 2010) as well as a decrease in ruminal bacterial urease
activity (Marini et al. 2004). In addition, Cheng and Wallace (1979) demonstrated that an
increase in ruminal NH3-N concentration reduced ruminal urease activity. This is of significance
because bacterial urease is responsible for hydrolysis of urea-N to NH3 and CO2 and thereby
maintains a concentration gradient which favors the transfer of urea-N across the ruminal
epithelium (Rémond et al. 1996). Houpt and Houpt (1968) reported a decrease in urea-N transfer
as urease activity decreased. Kennedy and Milligan (1980) demonstrated that urea-N transfer to
the rumen decreased at high ruminal NH3-N concentrations. Therefore, ruminal NH3-N
concentration can directly affect the transfer of urea-N to the rumen and is an important factor
influencing urea-N recycling to the GIT. In cattle, a ruminal NH3-N concentration of 5 to 8 mg
dL-1
results in maximal ruminal epithelial transfer of urea-N (Kennedy and Milligan 1978).
Therefore, it is important to understand how dietary factors can influence ruminal NH3-N
concentration and the subsequent transfer and utilization of urea-N in the GIT.
As previously discussed, changing RDP level can be used to manipulate ruminal NH3-N
concentration and the rate of urea-N recycling to the GIT. However, protozoa are also important
ruminal microorganisms comprising 20 to 70% of the ruminal biomass (Jouany 1996) as well as
in terms of intra-ruminal recycling of N. For example, between 10 and 40% of total ruminal N is
Page 40
24
sequestered in protozoa (Williams and Coleman 1997). Protozoa are highly proteolytic, ingesting
and degrading bacteria and releasing NH3 into the ruminal environment (Jouany 1996).
Defaunation is the removal of ruminal protozoa from the rumen by means such as the application
of substances that are toxic to protozoa (e.g. copper sulphate or canola and sunflower oil), or by
isolating animals at birth or by emptying and sterilization of ruminal contents (Jouany 1996).
Defaunation results in a reduction in ruminal NH3 concentrations (Jouany 1996; Ivan et al. 2001)
and has been shown to increase the amount of bacterial protein flowing to the duodenum
(Koenig et al. 2000). Therefore, depending on protein concentration in the diet, defaunation can
increase the recycling of urea-N to the rumen (Kiran and Mutsvangwa 2010).
2.7.5 Ruminal Volatile Fatty Acid Concentration and Ruminal pH
Volatile fatty acids (i.e., acetate, propionate and butyrate) are byproducts of ruminal
microbial metabolism which are released into the ruminal environment. As ruminal VFA
concentration increases, ruminal pH declines (Pylot et al. 1999), making these two factors
closely related. In terms of urea-N transfer to the rumen, ruminal butyrate concentration has been
shown to positively affect urea-N transfer to the rumen (Thorlacius et al. 1971; Engelhardt et al.
1978). It was suggested that changes in ruminal concentration of VFA influences the
permeability of the ruminal epithelium to urea-N (Harmeyer and Martens 1980). More recently,
Simmons et al. (2009) fed steers either a concentrate- or silage-based diet leading to a
numerically greater butyrate concentration for the concentrate-fed steers. Furthermore, their
results showed a higher expression of UT-B mRNA for steers fed the concentrate as compared to
the silage-based diet, demonstrating a possible link between ruminal butyrate concentration and
UT-B expression.. The rumen is a highly reduced environment leading to the conversion of NH3
Page 41
25
to NH4+ and increasing ruminal concentration of NH4
+ which results in a decrease in ruminal
urease activity (Marini et al. 2004) in turn reducing urea-N transfer to the rumen (Rémond et al.
1993; 1996). Furthermore, Abdoun et al. (2010) observed, using isolated ruminal epithleia
mounted in Ussing chambers that a reduction of ruminal mucosal buffer pH from 7.4 to 5.4 (and
in the presence of short chain fatty acids) resulted in a bell-shaped relationship with mucosal pH.
Maximal urea flux was observed around pH 6.2 and as pH dropped below 5.8 urea flux
decreased to prestimulation levels (Abdoun et al. 2010). Therefore short-term changes in urea
flux may be mediated by changes in mucosal pH. Altering certain ruminal factors, such as an
increase or decarase in ruminal pH, can have a positive influence on urea-N transfer across the
ruminal epithelium (Abdoun et al. 2010). However, in vivo observations in Holstein steers
demonstrated that changes in pH were not accompanied by a reduction in urea-N recycling as
was expected (Titgemeyer et al. 2012). These researchers reported that other factors may have
inhibited urea-N transport. There is a need for more research to further elucidate the many
potential factors influencing urea-N transport across the ruminal epithelium.
2.7.6 Plasma Urea-Nitrogen Concentration
Plasma urea-N (PUN) can be recycled to the rumen across the epithelial tissue via simple
passive diffusion (Houpt 1959) and be hydrolyzed by bacterial urease to NH3 for subsequent
utilization for AA synthesis by ruminal microorganisms (Houpt 1959). Previous research has
shown that the transfer of urea to the GIT is positively correlated to PUN concentration (Vercoe
1969; Harmeyer and Martens 1980; Huntington and Archibeque 2000). Sunny et al. (2007) fed
sheep a low protein diet (6.8% CP on DM basis) and infused urea at different rates (0, 3.8, 7.5 or
11.3 g urea N d-1
) into the jugular vein. As PUN concentration increased so did the amount of
Page 42
26
urea-N entering the GIT; however, the increase was less as PUN concentration became greater.
This is further evidence of the relationship between PUN concentration and urea-N recycling to
the GIT. Earlier, Lapierre and Lobley (2001) gathered data from studies in cattle showing no
evidence linking PUN concentration and urea-N recycling to the GIT. However, several other
factors, such as ruminal concentrations of CO2, butyrate and ammonia, may have influenced the
rate of urea-N recycling to the rumen and counteracted the effects of PUN concentration.
2.8 Conclusions
Inefficient utilization of dietary N can be detrimental to animal production systems and
the environment. The excretion of excess dietary N can lead to pollution of the environment and
an increase in feeding costs in ruminant production systems. Several dietary strategies have been
investigated to address these issues. For example, reducing dietary N intake and increasing
microbial capture of recycled urea-N can both lead to a decrease in the excretion of N and
improve the overall efficiency of N utilization. Investigating how simultaneous changes in
different dietary factors affect urea-N recycling in ruminants may provide further insight into
strategies to improve N efficiency.
Page 43
27
2.9 Hypothesis and Objectives
It was hypothesized that the efficiency of nitrogen utilization can be improved by enhancing
urea-nitrogen recycling to the rumen through the judicious balance of ruminal fermentable
carbohydrate and the level and ruminal degradability of dietary protein.
The objectives of the research carried out in this thesis were to determine the effects of:
a) Feeding diets containing two levels of dietary CP (10.8 vs. 14.0%) and RDP (76.0 vs.
73.6% of CP) on urea-N transfer to the GIT, N balance, and microbial protein production
in beef heifers;
b) Feeding diets containing two levels of RDS (28.6 vs. 69.2% of total starch) and RDP
(48.0% vs. 55.0% of CP) on urea-N recycling to the GIT, N balance, duodenal nutrient
flow, and microbial protein production in beef heifers fed low CP diets; and
c) Feeding diets containing two levels of dietary CP (14.9 vs. 17.5%) and RDP (63.0 vs.
69.0% of CP) on urea-N recycling, microbial protein production, N balance, omasal
nutrient flow, and milk production in lactating dairy cows.
Page 44
28
3 EFFECTS OF DIETARY CRUDE PROTEIN AND RUMINALLY-DEGRADABLE
PROTEIN LEVELS ON UREA RECYCLING, MICROBIAL PROTEIN
PRODUCTION, AND NITROGEN BALANCE IN BEEF HEIFERS
3.1 Abstract
The objective of this study was to determine the effects of dietary crude protein (CP) and
ruminally-degradable protein (RDP) level on urea recycling, microbial protein production and
nitrogen (N) balance in beef heifers. Four ruminally-cannulated beef heifers (437 ± 24 kg BW)
were used in a 4 × 4 Latin Square design with a 2 × 2 factorial arrangement of dietary treatments
with 23 d periods. Jugular infusions of [15
N15
N]-urea (220 mg d-1
; 98+ atom percent) were
conducted for 4 d (d 18-22) to estimate urea kinetics, with total collection of faeces and urine.
Proportions of [15
N15
N]-, and [14
N15
N]-urea in urinary urea, and 15
N enrichment in faeces were
used to calculate urea kinetics. Microbial N production was estimated using urinary excretion of
purine derivatives. Dietary treatments were 10.8 vs. 14.0% CP and 73.4 vs. 76.0% RDP (% of
CP). Feeding the low CP diet decreased N intake (P < 0.01), ruminal ammonia-N concentration
(P < 0.01) and urinary N excretion (P <0.01). Endogenous urea-N production increased (P =
0.03) with increasing dietary CP level, as did urinary urea-N loss (P = 0.04). However, urea-N
transfer to the gastro-intestinal tract was similar across diets, with most of this N returned to the
ornithine cycle. Microbial N supply was unaffected (P > 0.05) by dietary treatment. Therefore,
low CP diets showed greater efficiency of N utilization, and less N excreted into the environment
with no significant change in microbial protein production.
Page 45
29
3.2 Introduction
Dietary protein is extensively degraded in the rumen to peptides, amino acids, and
ammonia (NH3), due to the proteolytic activity of ruminal microorganisms (Prins et al. 1983).
However, NH3-N in excess of ruminal microbial requirement is absorbed across the ruminal
epithelium into the portal blood, converted to urea in the liver and excreted via the urine (Lobley
et al. 1995). This can be detrimental to the environment (Cowling and Galloway 2002;
Klopfenstein and Erickson 2002; Hristov et al. 2011) as well as represent an irreversible loss of
nitrogen (N) to the animal. Lowering dietary crude protein (CP) concentration has been found to
reduce ruminal NH3-N concentration in beef steers (Brake et al. 2010). Lowering ruminal NH3-N
concentration enhances the transfer of urea to the rumen (Kennedy and Milligan 1980) through
an increase in bacterial urease activity of epimural bacteria (Cheng and Wallace 1979). Bacterial
urease aids in the transfer of urea-N across the ruminal epithelium by maintaining a favourable
blood-rumen urea-N concentration gradient (Rémond et al. 1996). There is also evidence that
other factors such as urea transporters, ruminal pH and VFA concentration influence the
recycling of urea-N to the rumen and therefore should be considered (Abdoun et al. 2007;
Abdoun et al. 2010). The recycling of urea is an important N salvage mechanism (Stewart and
Smith 2005) and can be a significant source of N for microbial growth (Lapierre and Lobley
2001).
Dietary CP consists of both ruminally-degradable (RDP) and ruminally-undegradable
(RUP) protein. The peptides, amino acids, and ammonia of RDP are precursors for bacterial
protein synthesis (Bach et al. 2005). The amounts of dietary CP and RDP therefore directly
influence the availability of these substrates for bacterial protein synthesis (Hristov and Jouany
2005). Feeding a higher level of dietary RDP results in higher ruminal NH3-N concentration
Page 46
30
which is negatively correlated with urea-N transfer across the ruminal epithelium (Kennedy and
Milligan 1980). It has been demonstrated that in steers fed low quality forage, increasing dietary
RDP level increases both total endogenous urea-N production and urea-N recycling to the GIT
(Wickersham et al. 2008a). Furthermore, Wickersham et al. (2009) observed a linear increase in
urea-N recycled to the GIT and its incorporation into microbial protein with increasing RDP
level in steers fed a low level of dietary N. There is therefore opportunity to improve the
efficiency of N utilization through concomitant changes in dietary CP and RDP to influence
urea-N kinetics and microbial protein synthesis in ruminants. The hypothesis of this study was
that lowering the level of both dietary CP and RDP would result in greater transfer of
endogenous urea-N to the gastro-intestinal tract (GIT), thus maintaining microbial protein
production. The objective was to determine the effect of varying dietary CP and RDP levels on
urea transfer to the GIT, microbial protein production, N balance, and duodenal nutrient flow in
beef heifers.
3.3 Materials and Methods
Heifers used in this study were cared for in accordance with guidelines of the Canadian
Council of Animal Care (1993) and their use was approved by the University of Saskatchewan
Animal Care Committee (UCACS Protocol No. 20040048).
3.3.1 Animals and Experimental Design
Four Speckle Park beef heifers (437 ± 24 kg BW) surgically fitted with ruminal (10 cm
diameter opening, Bar Diamond, Parma, ID) cannulas were used in a 4 × 4 Latin square design
experiment with a 2 × 2 factorial arrangement of treatments with 23 d periods. Each
Page 47
31
experimental period consisted of 18 d of dietary adaptation and 5 d of sample collection. Heifers
were housed in individual 3 m × 3 m pens on rubber mats in the Livestock Research Building of
the Department of Animal and Poultry Science (University of Saskatchewan). Four isoenergetic
diets delivered 2 levels of CP (10.8% vs. 14.0%, DM basis) with 2 levels of RDP (73.4 vs.
76.0% of CP). Canola meal and/or heated canola meal were included in diets to control the RDP
level. The canola meal was obtained from Federated Co-Operative Ltd (Saskatoon, SK, Canada)
and the heated canola meal (Alberta Gold) from Canbra Foods Ltd (Lethbridge, AB, Canada).
Experimental diets were fed twice daily at 0800 and 1600 h as a pelleted ration and heifers had
free access to water. Chemical composition of ingredients is presented in Table 3.1. Ingredients
and chemical composition of experimental diets are shown in Table 3.2.
3.3.2 Sample Collection
During the 5-d collection period (d 18 to d 23), individual heifer feed intake was recorded
daily. Also, samples of total mixed rations (TMR) and orts were collected daily, stored at -20oC
and then composited by treatment for each experimental period.
On d 17 of each experimental period, heifers were fitted with temporary vinyl catheters
(0.86 mm i.d. × 1.32 mm o.d.; Scientific Commodities Inc., Lake Havasu City, AZ) in both the
right and left jugular veins to allow for simultaneous blood sampling and stable isotope infusion.
Total N balance (d 18 to d 23) and urea-N transfer to the GIT (d 18 to d 22) were determined
using the procedures of Lobley et al. (2000), except that urine was collected using bladder
catheters. During total collection of urine and faeces, heifers were restrained within pens. On d
17, indwelling Bardex Foley bladder catheters (26 Fr, 75 cc ribbed balloon, lubricious-coated; C.
R. Bard Inc., Covington, GA) were inserted into heifers as described by Crutchfield (1968). Just
Page 48
32
before 0800 h on d 18, background samples of urine and faeces were collected and the bladder
catheters were connected to urine collection tubing. Starting at 0800 h on d 18, double-labeled
urea ([15
N15
N]-urea, 98+ atom percent; Cambridge Isotope Laboratories, MA, USA) in 2 L of
sterile saline solution was continuously infused into the jugular vein at a rate of 220 mg d-1
using
a peristaltic pump (Watson and Marlow, Cornwall, UK. Model: 205U) for 96 h. Urine was
collected into 20-L Carboy polyethylene containers into which 80 mL of concentrated HCl
(VWR Scientific, Mississauga, ON) had been added in order to maintain a pH < 3. Total daily
urine output for each heifer was weighed, mixed thoroughly and a sample (20% of total output)
collected. A 50-mL subsample of urine was collected from the composited daily output. In
addition, a 2-mL subsample of urine was collected daily from the composited daily output and
diluted with 8 mL of distilled water. All urine samples were stored at -20oC. Total faecal output
was collected daily for a 5 d period (d 18 to d 23) by thoroughly scraping feces from the pen
floors. A sub sample (10% of total output) of feces was taken each day and composited by heifer
within each period and stored at -20°C.
Ruminal (every 2 h) and blood (every 4 h) samples were collected over 24 h (0800 h on d
21 to 0600 h on d 22). Ruminal contents (1 L; 250 mL from the cranial ventral, caudal ventral,
central, and cranial dorsal regions) were collected, mixed thoroughly and strained through 4
layers of cheesecloth. Ruminal fluid pH was immediately determined on the filtrate, using a
Model 265A portal pH meter (Orion Research Inc., Beverly, MA). A 5-mL aliquot of ruminal
fluid was preserved with 1 mL of meta-phosphoric acid (25% wt vol-1
), and a second 5-mL
aliquot was preserved with 1 mL of 1% sulfuric acid and stored at -20oC. A third 15-mL aliquot
was not acidified and stored at -20oC for later determination of osmolality. Blood samples (5
mL) were collected from a jugular catheter into tubes containing heparin (144 USP units; Becton
Page 49
33
Dickinson, Rutherford, NJ) and transferred to the laboratory on ice. Blood samples were
centrifuged at 1,500 × g for 15 min at 4oC (Beckman Instruments Inc., Model J6-MC Centrifuge,
Mississauga, Ontario, Canada) and the resulting plasma stored at -20oC.
Contents of RDP in the TMR and dietary ingredients were determined using the in situ
incubation technique (Yu et al. 2003) with one beef heifer (454 kg BW) that was fitted with a
ruminal cannula (10 cm diameter opening, Bar Diamond, Parma, ID). The heifer was housed in a
3 × 3 m pen in the Livestock Research Building (University of Saskatchewan) and was fed a
blend of all four experimental diets at 2% of body weight (DM basis) at 0800 and 1600 h daily.
Briefly, samples of each dietary ingredient were ground through a 3 mm screen (Christy and
Norris Ltd., Chelmsford, England), and then a 7 g sample was weighed into number-coded bags
(10 × 20 cm, Nitex 03-41/31 monofilamnet open mesh fabric, Screentec Corp., Mississauga, ON;
with a 40 μm pore size). Incubations were carried out for 48, 24, 12, 8, 2, and 0 h. Procedures
for ruminal incubation and post-incubation procedures were as described by Yu et al. (2004).
3.3.3 Sample Analyses
After completion of the experiment, frozen TMR, orts and faecal samples were thawed at
room temperature and then dried at 55oC for 96 h. Dried TMR, orts, and faecal samples were
ground through a 1 mm screen using a Christy-Norris mill (Christy and Norris Ltd., Chelmsford,
England). Samples were then analyzed for DM by oven-drying at 135°C for 2 h [Association of
Official Analytical Chemists (AOAC) 1990; method 930.15], OM by ashing at 600oC for at least
8 h (AOAC 1990; method 942.05), CP using the macro-Kjeldahl procedure (AOAC 1990;
method 984.13), ether extract (AOAC 1990; method 920.39), acid detergent fiber (ADF) (AOAC
1990; method 973.18), and neutral detergent fiber (NDF; Van Soest et al. 1991). Amylase and
Page 50
34
sodium sulfite were used for NDF determination. Dried TMR were analyzed for acid detergent
insoluble (ADIN) and neutral detergent insoluble (NDIN) nitrogen (Licitra et al. 1996). Prior to
chemical analysis, the dried residues from in situ incubations were ground through a 1 mm
screen using a Retch ZM 100 grinder (F-Kurt Retsch GmbH & Co. Kg, Germany) and then
analyzed for DM as previously described, and CP using the Dumas method of combustion on a
LECO FP-528 Nitrogen/Protein Determinator (AOAC 1990; method 992.23).
Urinary urea-N was determined using the diacetyl monoxime method (Procedure No.
0580, Stanbio Laboratory, Boerne, TX) on background and daily composite 50-mL subsamples
of urine prior to processing for the determination of [15
N15
N]- and [14
N15
N]-urea enrichments.
Urinary urea was then isolated by applying urine containing 1.5 mg of urea-N to a pre-packed
cation exchange resin column (AG-50W- × 8 Resin, 100-200 mesh, H+ form; BioRad
Laboratories, Hercules, CA) as described by Archibeque et al. (2001). Samples were then eluted
with N-free water, air-dried and transferred to borosilicate glass tubes for freeze-drying and then
analyzed for the proportions of [15
N15
N]-, and [14
N15
N]-urea in urinary urea by isotope ratio-
mass spectrometry (15
N Analysis Laboratory, University of Illinois at Urbana-Champaign). The
results were corrected for [14
N15
N]-urea produced by non-monomolecular reactions (Lobley et al.
2000). Total N in samples of daily urine output was determined using the macro-Kjeldahl
procedure (AOAC 1990; method 976.05). Diluted daily urine samples were composited
(proportionally based on daily urine output) by heifer for each period and analyzed for urinary
urea-N (d 19 to d 22) using the colorimetric diacetyl monoxime method (Procedure No. 0580,
Stanbio Laboratory, Boerne, TX), and for uric acid (Fossati et al. 1980) and allantoin for samples
collected on d 26 and 30 (Chen and Gomes 1992).
Page 51
35
Frozen plasma samples were thawed and composited by heifer for each experimental
period. Urea-N was determined in urine and plasma using the diacetyl monoxime method.
Ruminal fluid samples preserved with meta-phosphoric acid were analyzed for volatile fatty acid
(VFA) concentration (Erwin et al. 1961) using an Agilent 6890 Series Gas Chromatography
system (Wilmington, DE). Ruminal fluid samples preserved with sulphuric acid were analyzed
for NH3-N using a phenol-hypochlorite assay (Broderick and Kang 1980). Osmolality was
measured on non-acidified ruminal fluid samples using a VaproTM
Vapor Pressure Osmomemter
(Model 5520; Wescor Inc., Logan, Utah).
3.3.4 Calculations and Statistical Analysis
Total N retention was calculated as intake N – faecal N – urinary N. The urinary
excretion of purine derivatives (i.e., uric acid and allantoin) was used to estimate microbial
nonammonia-N (NAN) production according to the methods of Chen and Gomes 1992. Urea-N
kinetics was calculated according to the model of Lobley et al. (2000), using urinary 15
N
enrichment of [15
N15
N]- and [14
N15
N]-urea, and total 15
N excretion in faeces.
Ruminal degradation characteristics of CP were analyzed using the non-linear regression
procedure of SAS (Version 9.1; SAS Institute, Inc. Cary, N. C.) using least squares regression
(Gauss-Newton method) as described by Yu et al. (2004). Ruminal fermentation characteristics
(pH, NH3-N, osmolality and VFA concentration) were analyzed using the Proc Mixed repeated
measures procedure of SAS. All other data were analyzed as a 4 × 4 Latin square design with a
factorial arrangement of dietary treatments using the Proc Mixed procedure of SAS. The
following model was used: Yijkl = μ + Hi + Pj + CPk + RDPl + (CP x RDP)kl + εijkl, where Yijkl =
dependent variable, μ = overall mean, Hi = random effect of heifer i, Pj = fixed effect of period j,
Page 52
36
CPk = fixed effect of dietary CP k, RDPl = fixed effect of dietary RDPl, (CP x RDP)kl = fixed
effect of the interaction between CPk and RDPl, and εijkl = random residual error. When the RDS
× RDP interaction was significant, means were compared using the LSD test. Treatment
differences were considered significant when P ≤ 0.05 and tendencies were discussed when 0.05
< P ≤ 0.10.
3.4 Results
3.4.1 Dietary Characteristics
Chemical composition of ingredients is presented in Table 3.1. Ingredient and chemical
composition of experimental diets are presented in Table 3.2. Chemical analysis of TMR
indicated that CP levels were 10.8 and 14.0%. In situ ruminal incubation of dietary ingredients
showed that dietary RDP levels were 76.0 and 73.6% of CP for the low and high RDP
treatments, respectively (Table 3.3).
3.4.2 Ruminal Fermentation Characteristics
Ruminal pH averaged 6.1 ± 0.15 and was unaffected (P > 0.05) by dietary treatment
(Table 3.4). Ruminal NH3-N concentration was lower (P < 0.05) in heifers fed the low as
compared with those fed the high CP diet (5.06 vs. 8.34 mg dL-1
), but was unaffected (P = 0.60)
by RDP level. Ruminal osmolality was higher (P = 0.03) for heifers on the low as compared with
those on the high CP diet (235.6 vs. 209.5 mOsm L-1
), but was unaffected (P = 0.21) by RDP
level. Total VFA concentration, acetate:propionate ratio, and concentration of individual VFA
were unaffected (P > 0.05) by dietary treatment, except for ruminal butyrate concentration. On
Page 53
37
the high CP diet, ruminal butyrate concentration was higher with the high RDP level, whereas
the opposite was observed on the low CP diet (interaction, P = 0.02).
3.4.3 Nutrient Intake and Total-tract Nutrient Digestibility
Nutrient intake and total-tract apparent digestibility of DM, OM, NDF, and ADF were
unaffected (P > 0.05) by dietary treatment (Table 3.5).
3.4.4 Nitrogen Balance
Nitrogen intake of heifers fed the low CP diet was lower (P < 0.01) compared with those
fed the high CP diet (134.1 vs. 168.3 g N d-1
; Table 3.6). Feeding the high CP diet increased (P <
0.01) urinary N excretion by 30% when compared with feeding the low CP diet (71.2 vs. 49.9 g
N d-1
). However, faecal N excretion was not affected (P > 0.05) by dietary treatment. Nitrogen
retained was greater (P = 0.05) on the high as compared with the low CP diet (67.7 vs. 56.5 g N
d-1
); however, N retained, as a proportion of N intake, was unaffected (P > 0.05) by dietary CP
level. Nitrogen loss in faeces, as a proportion of N intake, was unaffected (P > 0.05) by dietary
treatment. Nitrogen loss in urine, as a proportion of N intake, was greater (P = 0.04) on the high
as compared with the low CP diet (42.0 vs. 37.3 % of N intake). Nitrogen digestibility was not
affected (P > 0.05) by dietary treatment. Plasma urea-N (PUN) concentration was greater (P <
0.01) on the high as compared with the low CP diet (12.9 vs. 9.6 mg dL-1
). Dietary RDP level did
not affect (P > 0.05) N intake, faecal N output, urinary N output, N retention, N digestibility or
PUN concentration.
Page 54
38
Table 3.1 Chemical composition of dietary ingredients
%, DM basis Barley Oat hulls Canola meal Heated canola meal
Dry Matter (DM) 86.9 89.9 87.5 95.7
Crude Protein 10.8 3.9 43.0 41.5
Page 55
39
Table 3.2 Ingredients and chemical composition of diets fed to beef heifers
Low CPz
High CPz
Item
Lowy
RDP
Highy
RDP
Lowy
RDP
Highy
RDP
Total mixed ration, % DM basis
Barley grain 54.6 54.6 47.7 47.7
Oat hulls 35.4 35.4 32.4 32.4
Canola meal - 4.9 7.9 14.8
Heated canola meal 4.9 - 6.9 -
Supplement 5.1 5.1 5.1 5.1
Supplement, % DM basis
Barley grain 54.6 54.6 54.6 54.6
Limestone 20.8 20.8 20.8 20.8
Rumensin premixx 7.2 7.2 7.2 7.2
Trace mineral saltw 7.7 7.7 7.7 7.7
LS 106v 9.7 9.7 9.7 9.7
Chemical composition of total mixed ration
Dry matter (DM), % 89.9 88.7 89.8 89.7
Organic matter, % DM 95.6 95.3 95.1 95.1
Crude protein (CP), % DM 10.8 10.8 13.9 14.1
Crude fat, % DM 2.1 2.1 2.5 2.3
Acid detergent fiber, % DM 17.9 16.8 18.4 18.3
Neutral detergent fiber, % DM 38.3 38.2 37.8 37.9
Neutral detergent insoluble nitrogen, % of total N 2.7 2.8 2.6 2.3
Acid detergent insoluble nitrogen, % of total N 1.7 1.7 2.3 2.2
Ruminally-degradable proteinu, % of CP 74.4 77.1 72.3 74.9
zCP = crude protein of 10.8 and 14.0% for the low and high CP treatments, respectively as
determined by chemical analysis of diets yRDP = ruminally-degradable protein of 73.4 and 76.0% (of CP) for the low and high RDP
treatments, respectively as estimated by in situ incubation of dietary individual dietary
ingredients xRumensin premix: 3% monensin sodium or 30,000 mg kg
-1 monensin sodium.
wTM Salt: 95% salt,12,000 ppm zinc, 10,000 ppm manganese, 4,000 ppm copper, 400 ppm
iodine, 60 ppm cobalt, 30 ppm added selenium. vLS 106: 440,500 IU vitamin A, and 88,000 IU vitamin D3 kg
-1.
uRuminal degradation of CP was estimated by in situ incubation of individual dietary ingredients
Page 56
40
40
zS = rapidly-degradable fraction (soluble; %)
yD = slowly-degradable fraction (potential; %)
xU = undegradable fraction (%)
wKd = degradation rate of the D fraction (%h
-1)
v%BCP = percent ruminally-undegradable crude protein
u%EDCP = percent effective (ruminally) degradable crude protein
(calculated assuming a rumen outflow rate of 6% h-1
)
Table 3.3 In situ ruminal degradation kinetics of crude protein (CP) in dietary ingredients
Dietary Ingredients
Items Canola Meal Heated Canola Meal Oat Hulls Barley
Sz (%) 22.19 16.04 49.85 31.88
Dy (%) 67.29 67.33 18.37 59.41
Ux (%) 10.52 16.63 31.78 8.71
Kdw (% h
-1) 15.79 10.42 24.69 30.84
%BCP v (%RUP) 29.05 41.23 35.37 18.39
%EDCPu (%RDP) 70.95 58.77 64.63 81.61
Page 57
41
41
Table 3.4 The effects of dietary crude protein (CP) and ruminally-degradable protein (RDP) levels
on rumen fermentation characteristics in beef heifers
Low CPz
High CPz
P values
Item
Lowy
RDP
Highy
RDP
Lowy
RDP
Highy
RDP
SEMx
CP
RDP
CP × RDP
Ruminal pH 6.00 6.25 6.08 6.05 0.153 0.68 0.47 0.38
Ammonia-N, mg dL-1
5.06 5.06 8.82 7.85 0.894 <0.01 0.60 0.60
Osmolality, mOsm L-1
242.2 229.0 215.9 203.0 10.56 0.03 0.21 0.99
Volatile fatty acids, mM
Acetate (A) 55.6 59.7 61.5 62.1 5.52 0.47 0.68 0.76
Propionate (P) 48.5 35.3 38.3 36.6 5.55 0.44 0.21 0.33
Butyrate 9.26 7.59 6.88 9.67 1.427 0.86 0.51 0.02
Isobutyrate 0.22 0.24 0.23 0.24 0.029 0.93 0.78 0.82
Valerate 9.81 8.57 9.04 9.07 0.922 0.88 0.48 0.46
Isovalerate 1.00 0.88 0.92 0.93 0.094 0.87 0.49 0.46
Total VFA 123.5 112.3 116.9 118.6 4.75 0.97 0.24 0.11
A:P ratio 1.34 2.29 1.89 1.95 0.471 0.83 0.31 0.37 zCP = crude protein of 10.8 and 14.0% for the low and high CP treatments, respectively as determined
by chemical analysis of diets yRDP = ruminally-degradable protein of 73.4 and 76.0% (of CP) for the low and high RDP treatments,
respectively as estimated by in situ incubation of dietary individual dietary ingredients x
SEM = Pooled standard error of the mean
Page 58
42
42
Table 3.5 The effects of dietary crude protein (CP) and ruminally-degradable protein (RDP) levels on intake
and total-tract nutrient apparent digestibility in beef heifers
Low CPz
High CPz
P values
Item
Lowy
RDP
Highy
RDP
Lowy
RDP
Highy
RDP
SEMx
CP
RDP
CP × RDP
Dry matter (DM)
Intake, kg d-1
7.75 7.52 7.63 7.63 0.466 0.98 0.70 0.70
Total-tract digestibility, % 71.9 73.9 74.3 72.7 1.16 0.61 0.83 0.16
Organic matter (OM)
Intake, kg d-1
7.41 7.19 7.25 7.25 0.443 0.87 0.70 0.69
Total-tract digestibility, % 73.1 75.0 75.3 74.0 1.19 0.57 0.74 0.17
Neutral detergent fiber (NDF)
Intake, kg d-1
2.98 2.87 2.87 2.88 0.159 0.68 0.73 0.61
Total-tract digestibility, % 45.5 48.4 48.4 46.0 3.79 0.92 0.94 0.36
Acid detergent fiber (ADF)
Intake, kg d-1
1.39 1.26 1.39 1.40 0.085 0.37 0.41 0.34
Total-tract digestibility, % 41.0 41.9 45.3 42.3 3.93 0.53 0.74 0.46 zCP = crude protein of 10.8 and 14.0% for the low and high CP treatments, respectively as determined by chemical
analysis of diets yRDP = ruminally-degradable protein of 73.4 and 76.0% (of CP) for the low and high RDP treatments,
respectively as estimated by in situ incubation of dietary individual dietary ingredients xSEM = Pooled standard error of the mean
Page 59
43
3.4.5 Microbial Protein Production
Microbial N supply averaged 61.0 g N d-1
and the efficiency of microbial N production
averaged 11.6 g N kg-1
OMTDR, but neither were affected (P > 0.05; Table 3.7) by treatment
when estimated by urinary excretion of purine derivatives.
3.4.6 Urea-N Kinetics
Endogenous production of urea (UER) was higher (P = 0.03; Table 3.8) in heifers fed the
high as compared with the low CP diet (166.3 vs. 133.3 g d-1
), but was unaffected (P = 0.84) by
dietary RDP level. The amount of endogenous urea production partitioned to the GIT (GER; P ≥
0.18) and urea-N utilized for anabolic purposes (UUA; P ≥ 0.72) were unaffected by dietary
treatment. Urea-N returned to the ornithine cycle (ROC) tended (P = 0.07) to increase as dietary
CP level increased. Urinary urea-N excretion (UUE; P = 0.04) increased as dietary CP level
increased. On the low CP diet, UUE tended to increase with the high RDP level, whereas the
opposite was observed on the high CP diet (tendency for an interaction, P = 0.06). Urea-N
transferred to the faeces (UFE; P = 0.06) tended to decrease as dietary CP level increased.
Fractional transfers of urea-N were largely unaffected by dietary treatment; however, the
proportion of gastrointestinal entry rate of urea-N (GER) that was voided in the faeces (GER to
feces; P = 0.02) decreased as dietary CP level increased.
Page 60
44
44
Table 3.6 The effects of dietary crude protein (CP) and ruminally-degradable protein (RDP) levels on
nitrogen (N) intake, retention, digestibility and plasma urea-N concentrations in beef heifers
Low CPz
High CPz
P values
Item
Lowy
RDP
Highy
RDP
Lowy
RDP
Highy
RDP
SEMx
CP
RDP
CP × RDP
N intake, g d-1
138.5 129.7 165.2 171.4 11.32 <0.01 0.86 0.34
Faecal N, g d-1
28.4 26.7 28.8 30.6 2.01 0.34 0.98 0.43
Urinary N, g d-1
50.7 49.0 72.9 69.5 7.08 <0.01 0.58 0.86
UUNw:urine-N ratio 0.69 0.82 0.88 0.73 0.107 0.69 0.92 0.25
N retained, g d-1
59.1 53.8 63.7 71.6 5.64 0.05 0.79 0.21
N retained, % of N intake 42.4 41.4 38.5 42.2 2.00 0.40 0.50 0.24
N in faeces, % of N intake 20.9 20.5 17.5 18.2 1.63 0.13 0.91 0.77
N in urine, % of N intake 36.7 37.9 44.1 39.8 2.47 0.04 0.42 0.18
N digestibility, % 79.1 79.5 82.5 81.8 1.63 0.13 0.91 0.77
Plasma Urea-N, mg dL-1
10.3 8.9 13.6 12.3 0.87 <0.01 0.15 0.90 zCP = crude protein of 10.8 and 14.0% for the low and high CP treatments, respectively as determined by
chemical analysis of diets yRDP = ruminally-degradable protein of 73.4 and 76.0% (of CP) for the low and high RDP treatments,
respectively as estimated by in situ incubation of dietary individual dietary ingredients xSEM = Pooled standard error of the mean
wUUN = urinary urea-nitrogen
Page 61
45
45
Table 3.7 The effects of dietary crude protein (CP) and ruminally-degradable protein (RDP) levels on
microbial nitrogen (N) supply as measured by purine derivatives (PD) in beef heifers
Low CPz
High CPz
P values
Item
Lowy
RDP
Highy
RDP
Lowy
RDP
Highy
RDP
SEMx
CP
RDP
CP × RDP
Organic matter intake, kg/d 7.4 7.2 7.3 7.3 0.44 0.87 0.70 0.69
Organic matter digestibility, % 73.1 75.0 75.3 74.0 1.19 0.57 0.74 0.17
OMTDRw, kg/d 5.6 5.3 5.1 5.3 0.43 0.38 0.99 0.34
Urinary excretion
Total output, kg/d 4.7 4.5 6.7 5.9 0.65 <0.01 0.09 0.28
Allantoin, mmol/d 104.7 114.3 128.7 124.4 11.55 0.11 0.76 0.51
Uric acid, mmol/d 10.9 8.2 9.4 12.7 2.51 0.34 0.86 0.14
Total PD, mmol/d 115.9 122.4 138.0 136.7 13.49 0.10 0.77 0.72
Microbial N supplyv
g microbial N/d 52.0 56.7 68.2 67.2 9.53 0.10 0.78 0.72
g microbial N/kg OMTDRw 9.8 10.5 14.1 12.0 2.46 0.21 0.71 0.57
zCP = crude protein of 10.8 and 14.0% for the low and high CP treatments, respectively as determined by
chemical analysis of diets yRDP = ruminally-degradable protein of 73.4 and 76.0% (of CP) for the low and high RDP treatments,
respectively as estimated by in situ incubation of dietary individual dietary ingredients xSEM = Pooled standard error of the mean
wMicrobial N supply per kg of organic matter (OM) truly digested in the rumen (OMTDR)
vMicrobial N supply was calculated according to the methods of Chen and Gomes (1992)
Page 62
46
Table 3.8 The effects of dietary crude protein (CP) and ruminally-degradable protein
(RDP) levels on urea-nitrogen (N) recycling kinetics, as measured by continuous jugular
infusions of [15
N15
N]-urea in beef heifers
Low CPz
High CPz
P values
Item
Lowy
RDP
Highy
RDP
Lowy
RDP
Highy
RDP
SEMx
CP
RDP
CP × RDP
Urea-N fluxes, g d-1
UERw
135.0 131.7 166.9 165.7 10.81 0.03 0.84 0.92
GERv
98.4 93.3 105.6 121.1 11.35 0.18 0.67 0.40
UUAu
25.4 20.9 17.2 35.1 7.71 0.72 0.43 0.21
ROCt
70.3 69.8 86.2 84.0 6.47 0.07 0.84 0.90
UUEs
36.6 38.4 61.3 44.6 5.06 0.04 0.35 0.06
UFEr
2.69 2.58 2.13 2.05 0.220 0.06 0.68 0.95
Fractional transfers
UER to urine 0.27 0.31 0.37 0.28 0.035 0.38 0.50 0.11
UER to GITq
0.73 0.69 0.63 0.72 0.035 0.38 0.50 0.11
GER to ROC 0.71 0.75 0.82 0.70 0.055 0.64 0.49 0.18
GER to faeces 0.03 0.03 0.02 0.02 0.002 0.02 0.93 0.74
GER to UUA 0.26 0.22 0.16 0.29 0.057 0.76 0.50 0.19 zCP = crude protein of 10.8 and 14.0% for the low and high CP treatments, respectively as
determined by chemical analysis of diets yRDP = ruminally-degradable protein of 73.4 and 76.0% (of CP) for the low and high RDP
treatments, respectively as estimated by in situ incubation of dietary individual dietary
ingredients xSEM = Pooled standard error of the mean
wUER = Urea-N entry rate.
vGER = Gastro-intestinal entry rate.
uUUA = Urea-N utilized for anabolism.
tROC = Return to ornithine cycle.
sUUE = Urinary urea-N excretion.
rUFE = Urea-N loss to faeces.
qGIT = Gastro-intestinal tract.
Page 63
47
3.5 Discussion
Beef cattle retain approximately 25% of their dietary N intake with the remaining N
excreted in the urine (39%) and faeces (29%) (Biermen 1999; Gaylean 1996). Furthermore,
between 50 and 90% of urinary N is excreted as urea-N (Reynal and Broderick 2005) which is
highly volatile in the environment, leading to pollution of the atmosphere as NH3 and N2O
(Baggs and Philippot 2010), and soil and ground water as nitrate (Socolow 1999; Cowling and
Galloway 2002). Public concern over the environmental impact of intensive livestock operations
is increasing (Janzen 2011), making it important to address the efficiency of nutrient utilization.
This study attempted to manipulate the amount and form of dietary protein in an effort to
minimize excretion of N into the environment and improve the overall efficiency of N use in
beef heifers.
In the present study, endogenous production of urea (UER) was higher (P = 0.03) in
heifers fed the high CP diet (14.0% CP) as compared with those fed the low CP diet (10.8% CP).
Previous research has clearly demonstrated that UER increases as dietary CP intake increases
(Archibeque et al. 2001; Marini and Van Amburgh 2003; Marini et al. 2004; Brake et al. 2010).
Lobley et al. (2000) observed an increase UER in sheep as dietary N intake increased.
Furthermore, UER tended to be greater in steers fed a corn-based diet containing DDGS as
compared to a control diet (14.9 vs. 10.2% CP, respectively) (Brake et al. 2010). This is
explained by the fact that dietary protein is degraded to NH3 by ruminal bacteria (Bach et al.
2005) and that NH3 produced in excess of bacterial requirements for protein synthesis is
absorbed systemically and transported to the liver and used for urea production via the ornithine
cycle (Stewart and Smith 2005). This urea can either be returned to the GIT or excreted in the
urine (Harmeyer and Martens 1980; Lapierre and Lobley 2001). In the current study both GER
Page 64
48
and UUA were unaffected by dietary treatment (P > 0.05). However, GER was numerically
greater in heifers fed the high CP diet compared with the low CP diet. Previous research which
showed that GER increases as dietary CP decreases (Marini and Van Amburgh 2003), attributed
this response to a lower ruminal NH3-N concentration (Kennedy and Milligan 1980). Bacterial
urease facilitates the transfer of urea-N across the ruminal epithelium (Rémond et al. 1996) but
the activity of bacterial urease decreases as ruminal NH3-N concentration increases (Marini et al.
2004). In the present study ruminal NH3-N concentrations increased (P < 0.01) with an increase
in dietary CP concentration. The increase in ruminal NH3-N concentration may therefore have
reduced GER on the high CP diets due to a reduction in ruminal epithelium’s permeability to
urea-N via a decrease in bacterial urease activity.
Several reports in the literature have demonstrated a direct association between dietary
CP concentration and ruminal NH3-N concentration (Cunningham et al. 1996; Kebreab et al.
2002; Reynal and Broderick 2005). Kiran and Mutsvangwa (2010) found that reducing dietary
CP concentration from 15% to 10% (DM basis) reduced ruminal NH3-N concentration by
approximately 42% in sheep, while reducing CP content from 18.6% to 17.5 % in lactating dairy
diets reduced ruminal NH3-N concentration from 12.0 to 7.2 mg dL-1
(Reynal and Broderick
2005). Ammonia is required for microbial protein production (Wallace 1997) and reducing
ruminal NH3-N concentration below a critical threshold could potentially impede microbial
protein production (Balcells et al. 1993). Previous in vitro studies have concluded that thiscritical
threshold is 5 mg of NH3 dL-1
of ruminal fluid (Satter and Slyter 1974; Russell and Strobel
1987). However, in vivo estimates have shown that optimal ruminal NH3-N concentration for
microbial protein synthesis depends on the fermentability of the diet. Several authors have
concluded that as the fermentability of the diet increases so does the requirement for ruminal
Page 65
49
NH3-N to maximize microbial protein production (Erdman et al. 1986; Odle and Schaefer 1987).
For example, Odle and Schaefer (1987) demonstrated that barley fed steers required a minimum
ruminal NH3-N concentration of 12.5 mg dL-1
to maximize ruminal nutrient whereas corn fed
steers only required 6.1 mg dL-1
. In the present study, heifers were fed a diet consisting of
approximately 34% (DM basis) oat hulls, which have a relatively high lignin content and low
ruminal degradability (Thompson et al. 2000; Thompson et al. 2002). Although ruminal NH3-N
concentrations on the low CP diet may be considered marginal (5.1 mg dL-1
), it still met the
critical threshold proposed by others (Satter and Slyter 1974; Russell and Strobel 1987).
Although N intake differed among diets (P < 0.01), microbial protein flow to the
duodenum was not significantly affected by dietary treatment. Dietary protein is extensively
degraded in the rumen to peptides, AA, and NH3 which are subsequently utilized for microbial
growth (Bach et al. 2005). Therefore, increasing protein intake often results in increases in
microbial protein synthesis (Wickersham et al. 2008a; Kiran and Mutsvangwa 2010). These
results indicate that feeding growing beef heifers a low CP diet (10.8% CP) will reduce urinary
N excretion without significantly impacting microbial protein flow to the small intestine,
indicating a greater efficiency of N utilization by heifers fed the low CP diet as compared with
the high CP diet. One mechanism improving the efficiency of N utilization could be the
increased capture of recycled urea-N by ruminal microbes as has been reported in the literature.
Brake et al. (2010) found that the proportion of recycled urea-N in microbial N was greater in
steers fed a control diet (10.2% CP) than steers supplemented with either urea (13.3 % CP) or
DDGS (14.9% CP).
In the present study, in situ estimates of dietary RDP level showed a lower than expected
spread between the low and high RDP treatments. Ruminally-degradable protein values were
Page 66
50
manipulated by the use of regular and heated canola meal. Typically, regular canola meal has a
RUP value of 30% of CP (NRC 1996). Heat treatment of canola meal has been shown to increase
the RUP fraction of the meal (McKinnon et al. 1995) to values approaching 60% of CP (NRC
1996). The magnitude of the increase in RUP is influenced by the temperature and duration of
heating (McKinnon et al. 1991). In this study, the heated canola meal was obtained from a
commercial source with a stated RUP content of 70% of CP (Canbra Foods Ltd 2007). In situ
incubation of the regular and heated canola meal indicated RUP values of 29.0 and 41.5% of CP,
respectively. This difference between actual (41.5%) and expected (70%) RUP of the heated
canola meal explains the lower than expected RUP level of the total mixed ration. The fact that
differences between dietary RDP levels were lower than expected could account for the reduced
effect of dietary RDP level on urea kinetics in this study as compared to previous studies. For
example, when supplementing forage-fed steers with different levels of casein, to manipulate
RDP level, Wickersham et al. (2008) found that GER increased as the level of casein
supplementation increased.
Ruminal pH is influenced by total VFA concentration (Beauchemin et al. 2003). It has
been shown that as the amount of readily fermentable carbohydrate increases, ruminal VFA
concentration increases and, as a consequence, ruminal pH decreases (Nocek 1997; Bach et al.
2005). In this study, heifers were fed isoenergetic diets containing a slowly fermentable forage
source (i.e., oat hulls). This explains the limited effect of diet on VFA concentration and ruminal
pH (P > 0.05). Normal ruminal osmolality levels are between 240 and 300 mOsm L-1
(Owens et
al. 1998). Animals in the present study had lower than normal levels of ruminal osmolality.
Ruminal osmolality is a measure of dissolved solutes (i.e. minerals, VFA, and lactate; Owens et
al. 1998) and as such, osmolality increases with increasing concentrate in the diet (Brown et al.
Page 67
51
2000). The low osmolality values observed likely reflect the poor ruminal digestibility of oat
hulls (Thompson et al. 2000).
A reduction in dietary CP from 14.0 to 10.8% did not impact nutrient intake or total-tract
apparent digestibility of DM, OM, N, NDF, and ADF. Low CP diets (12%) have been reported
to negatively influence feed digestibility in first lactation Holstein cows (MacLeod et al. 1982) as
well as reduce microbial growth and fermentation activity (Martin-Orue et al. 2000) leading to a
reduction in ruminal nutrient disappearance (Klevesahl et al. 2003). These results along with
ruminal NH3-N levels indicate that lowering dietary CP level to 10.8% did not negatively impact
overall digestibility of dietary nutrients and that ruminal NH3-N levels were at or above the
critical threshold reported by Satter and Slyter (1974) and sufficient to support microbial
fermentation activity in beef heifers.
Feeding the high CP (14.0%) diet increased (P < 0.01) urinary N excretion by 30%
compared to the low CP (10.8%) diet, a finding in agreement with several other studies
(Archibeque et al. 2001; Marini and Van Amburgh 2003; Marini et al. 2004; Kiran and
Mutsvangwa 2010). This shows that reducing dietary N intake is an effective nutritional strategy
for reducing the excretion of urinary N into the environment. Urinary N is mainly excreted as
urea (Broderick 2003), which can be rapidly converted to NH3 by anaerobic and aerobic bacteria
present in the environment (McGinn et al. 2002; Hristov et al. 2011). This is evident from the
work of McGinn et al. (2002) who showed a positive relationship between dietary CP level and
the concentration of NH3-N in beef cattle manure. In this study, between 36.6 and 61.3% of
urinary N was excreted as urinary urea-N by heifers, with lower values attributed to the low CP
diet. These results further support the concept that the potential impact of cattle on the
environment can be reduced by lowering the CP content of the diet (McGinn et al. 2002;
Page 68
52
Reynolds and Kristensen 2008; Hristov et al. 2011). Faecal N excretion was not affected by
increasing the level of dietary CP. Hristov and Jouany (2005) reported that faecal N output is less
affected by dietary N intake than urinary N output, and that excess dietary N is more readily
partitioned to the urine. This is in agreement with previously reported data (Siddons et al. 1985;
Marini and Van Amburgh 2003). However, the proportion of GER excreted in the faeces was
lower (P = 0.02) for heifers fed the low CP diets as compared with the high CP diets. Nitrogen
digestibility was not affected (P > 0.05) by dietary treatment. It has previously been shown that
reducing dietary CP concentration leads to a decrease in fiber digestibility (Willms et al. 1991).
The fact that this did not occur is further evidence that in the present study the low dietary CP
diet did not significantly restrict ruminal microbial fermentation.
Nitrogen retention was greater on the high CP diet as compared with the low CP diet as
has been previously reported (Willms et al. 1991; Wright et al. 1998). However, N retained as a
proportion of N intake was not affected (P > 0.05) by an increase in N intake. This result has
been previously observed in sheep (Kiran and Mutsvangwa 2007; Kiran and Mutsvangwa 2010).
This is also in agreement with findings of Archibeque et al. (2001), where efficiency of N use
was not affected by N intake in beef heifers. Failure to see an increase in N retained, as a
proportion of N intake, is explained by the observation that N supplied in excess of requirements
is excreted as urea-N in the urine and this represents a waste of feed N (Lapierre and Lobley
2001). Nitrogen loss in urine, as a proportion of N intake, was greater (P = 0.04) on the high CP
diet as compared with the low CP diet. Whereas, N loss in faeces, as a proportion of N intake,
was not affected (P > 0.05) by dietary treatment and further illustrates the fact that excess dietary
N is more readily partitioned to the urine than the faeces (Hristov and Jouany 2005). Plasma
urea-N concentration was greater (P < 0.01) in heifers fed the high CP diet as compared with
Page 69
53
those fed the low CP diet. This would be expected due to the greater N intakes and subsequent
higher ruminal NH3-N concentration leading to greater rates of ruminal NH3-N absorption. In
agreement with this result, Marini et al. (2004) reported a linear increase in PUN concentrations
with increasing N intake in ewe lambs.
In conclusion, lowering dietary CP level reduced urinary N excretion and did not affect
nutrient digestibility or microbial protein supply to the duodenum. Results also indicate that GER
was similar across diets, and that most of the urea which entered the GIT was returned to the
ornithine cycle. The implications of these findings are that lowering dietary CP to 10.8% can
reduce the excretion of N into the environment and improve the efficiency of N utilization with
no significant change in microbial protein production.
Page 70
54
4 EFFECTS OF DIETARY RUMINALLY-DEGRADABLE STARCH AND
RUMINALLY-DEGRADABLE PROTEIN LEVELS ON UREA RECYCLING,
MICROBIAL PROTEIN PRODUCTION, NITROGEN BALANCE, AND DUODENAL
NUTRIENT FLOW IN BEEF HEIFERS FED LOW CRUDE PROTEIN DIETS1
4.1 Abstract
The objective of this study was to determine the effects of ruminally-degradable starch
(RDS; 28.6 and 69.2% of total starch) and ruminally-degradable protein (RDP; 48.0 and 55.0%
of crude protein [CP]) content on urea recycling, nitrogen (N) balance, duodenal nutrient flow,
and microbial protein production in beef heifers fed low CP (10%) diets. Four ruminally- and
duodenally-cannulated beef heifers (723 ± 57 kg BW) were used in a 4 × 4 Latin square design
with a 2 × 2 factorial arrangement of dietary treatments with 23-d periods. Jugular infusions of
[15
N15
N]-urea (220 mg d-1
; 98+ atom percent) were conducted for 4 d (d 18-22) to estimate urea
kinetics, with total collection of faeces and urine. Proportions of [15
N15
N]- and [14
N15
N]-urea in
urinary urea, and 15
N enrichment in faeces were used to calculate urea kinetics. Ruminal
microbial N production was estimated using 15
N as a marker. Ruminal ammonia-N concentration
was greater (P = 0.01) in heifers fed high RDP as compared with those fed low RDP, and it was
also greater (P = 0.01) in heifers fed low RDS as compared with those fed high RDS. Microbial
N flow to the duodenum increased as RDP level increased on the high RDS diet, but was not
affected by RDP level on the low RDS diet (interaction; P = 0.04). Urea-N entry rate and urea-N
transfer to the gastro-intestinal tract were similar (P > 0.05) across diets. The amount of recycled
1A version of this chapter has been published: Davies, K L., McKinnon, J. J. and Mutsvangwa, T. 2013.
Effects of dietary ruminally-degradable starch and ruminally-degradable protein levels on urea recycling,
microbial protein production, nitrogen balance and duodenal nutrient flow in beef heifers fed low crude
protein diets. Can. J. Anim. Sci. 93(1): 123-136.
Page 71
55
urea-N incorporated into microbial N increased as RDP level increased on the high RDS diet, but
the opposite was observed on the low RDS diet (interaction; P = 0.008). These results indicate
that at a low CP level (10%), increasing both RDS and RDP levels can increase microbial N flow
to the duodenum and improve the efficiency of use of recycled urea-N for microbial N synthesis.
4.2 Introduction
There has been increasing concern over the impact of animal agriculture on the
environment (Socolow 1999; Food and Agriculture Organization of the United Nations 2006), in
particular, the overfeeding of nutrients such as nitrogen (N) (Cowling and Galloway 2002). One
strategy to reduce N excretion in livestock waste is to reduce dietary crude protein (CP)
concentration (Hristov et al 2011). However, a low dietary CP content will restrict microbial
protein synthesis due to a shortage of ruminally degradable protein (RDP). Reduced microbial
growth will, in turn, lead to a reduction in ruminal fermentation activity and, thus, a reduction in
the digestibility of nutrients, thereby reducing animal performance (Clark and Overton 1995).
In ruminants, there is a constant recycling of urea between the liver and the gastro-
intestinal tract (GIT), a mechanism that conserves N (Stewart and Smith 2005). The recycling of
urea can contribute to the ruminal ammonia (NH3) pool for microbial production and improve
efficiency of conversion of feed N to animal products (Lapierre and Lobley 2001). It has been
shown that urea recycling to the GIT is enhanced on low RDP diets (Marini and Van Amburgh
2003) and is associated with decreased ruminal ammonia-N (NH3-N) concentration (Kennedy
and Milligan 1980). It has also been shown that more severe processing of cereal grains can shift
the site of starch digestion from the small intestine to the rumen (Huntington 1997; Theurer et al.
1999). Greater ruminally-degradable starch (RDS) availability also increases the proportion of
Page 72
56
urea recycled to the GIT due to increased microbial utilization of ruminal NH3 (Kennedy and
Milligan 1978; Kennedy and Milligan 1980; Huntington 1989). However, there is limited
information on how simultaneous changes in dietary content of RDP and RDS influence urea
kinetics and microbial production in heifers fed low CP diets.
The hypothesis of this study was that with beef heifers fed low CP diets, urea recycling to
the GIT will be enhanced at a low dietary RDP level and that a greater proportion of this
recycled urea will be captured for microbial protein production when the dietary level of RDS is
increased. The objective was to determine the effects of feeding diets formulated to contain two
levels of RDS (30 and 70% of total starch) and two levels of RDP (48% vs. 64% of CP) on urea
recycling to the GIT, N balance, duodenal nutrient flow, and microbial protein production in beef
heifers fed low CP diets.
4.3 Materials and Methods
Heifers used in this study were cared for in accordance with the guidelines of the
Canadian Council of Animal Care (1993) and their use was approved by the University of
Saskatchewan Animal Care Committee (UCACS Protocol No. 20040048).
4.3.1 Animals and Experimental Design
Four Speckle Park beef heifers (723 ± 57 kg BW) surgically fitted with ruminal (10 cm
diameter opening; Bar Diamond, Parma, ID) and duodenal T-type (2.5 cm internal diameter;
Lethbridge Research Centre, Lethbridge, AB) cannulas were used in a 4 × 4 Latin square design
experiment with a 2 × 2 factorial arrangement of treatments and 23-d experimental periods.
Page 73
57
Duodenal cannulas were placed proximal to the common bile and pancreatic ducts,
approximately 10 cm distal to the pylorus. Each experimental period consisted of 18 d of dietary
adaptation and 5 d of sample collection. Heifers were housed in individual 3 m × 3 m pens on
rubber mats in the Livestock Research Building of the Department of Animal and Poultry
Science (University of Saskatchewan). Dietary treatments consisted of two levels of RDS (28.6
and 69.2% of total starch) and (48.0 and 55.0% of CP). Dietary levels of RDS were manipulated
by feeding either whole-shelled corn or steam-rolled corn, obtained from the same lot. Dietary
RDP levels were manipulated by feeding either canola meal or fishmeal as the protein
supplement. All dietary ingredients except for the corn grain were pelleted. The steam-rolled
corn was processed at a rolling temperature of 96 to 99oC, with an average retention time in the
steam chest of 15 to 20 min and an average gap between rolls of 4 mm. All diets were formulated
to contain 10% CP (dry matter [DM] basis). Experimental diets were fed twice daily at 0800 and
1600 h and heifers had free access to water. Ingredient and chemical composition of
experimental diets are presented in Table 4.1. Chemical composition of ingredients is presented
in Table 4.2.
4.3.2 Sample Collection
During the 5-d collection period (d 18 to d 23), individual heifer feed intake was recorded
daily. Also, samples of total mixed ration (TMR) and orts were collected daily, stored at -20ºC
and then composited by treatment for each experimental period.
On d 17 of each experimental period, heifers were fitted with temporary vinyl catheters
(0.86 mm i.d. × 1.32 mm o.d.; Scientific Commodities Inc., Lake Havasu City, AZ) in both the
right and left jugular veins to allow for simultaneous blood sampling and isotope infusion. Total
Page 74
58
N balance (d 18 to d 23) and urea-N transfer to the GIT (d 18 to d 22) were determined using the
procedures of Lobley et al. (2000), except that urine was collected using bladder catheters.
During total collection of urine and faeces, heifers were restrained within the pens. On d 17,
indwelling Bardex Foley bladder catheters (26 Fr, 75 cc ribbed balloon, lubricious-coated; C. R.
Bard Inc., Covington, GA) were inserted into heifers as described by Crutchfield (1968). Just
before 0800 h on d 18, background samples of urine, faeces, and ruminal and duodenal contents
were collected to measure 15
N natural abundance (NA), and the bladder catheters were connected
to urine collection tubing. Starting at 0800 h on d 18, double-labeled urea ([15
N15
N]-urea, 98+
atom percent; Cambridge Isotope Laboratories, MA, USA) dissolved in 2 L of sterile saline
solution was continuously infused into the jugular vein at a rate of 220 mg d-1
using a peristaltic
pump (Watson and Marlow, Cornwall, UK. Model: 205U) for 96 h. Urine was collected into 20
L Carboy polyethylene containers into which 80 mL of concentrated HCl (VWR Scientific,
Mississauga, ON) had been added to achieve a urine pH < 3. The acidification of urine was
necessary to avoid the loss of volatile NH3-N, which would lead to the underestimation of N
excretion. Total daily urine output for each heifer was weighed, mixed thoroughly and a sample
(20% of total output) collected. A 50 mL sub-sample of urine was collected from the composite
daily output. In addition, a 2 mL sub-sample of urine was collected daily from the composite
daily output and diluted with 8 mL of distilled water. All urine samples were stored at -20oC.
Total faecal output was collected daily for 5 d (d 18 to d 23 of each experimental period). Faecal
samples (10% of total output) were taken daily, a sub-sample was taken and the remainder
composited by heifer per period and stored at -20oC.
Ruminal, duodenal and blood samples were collected every 3 h for 24 h (0800 h on d 21
to 0500 h on d 22). Ruminal contents (1 L; 250 mL from the cranial ventral, caudal ventral,
Page 75
59
central, and cranial dorsal regions) were collected, mixed thoroughly and strained through four
layers of cheesecloth. Ruminal fluid pH was immediately determined on the filtrate, using a
Model 265A portal pH meter (Orion Research Inc., Beverly, MA). A 5 mL aliquot of ruminal
fluid was preserved with 1 mL of meta-phosphoric acid (25% wt/vol), and a second 5-mL aliquot
was preserved with 1 mL of 1% sulphuric acid and stored at -20oC. A third 15-mL aliquot was
not acidified and was stored at -20 oC for later determination of osmolarity. The solid ruminal
digesta that was retained on the cheesecloth was mixed with 400 mL of saline solution and then
homogenized in a blender to dislodge particle-associated bacteria. The blended digesta was then
strained through four layers of cheesecloth. The resulting fluid was mixed with the previously
strained ruminal fluid and then stored on ice until further processing to isolate mixed ruminal
bacteria by differential centrifugation (Reynal et al. 2005). Ruminal bacterial samples from each
heifer in each period were composited and stored at -20oC. Duodenal samples (500 mL) were
composited for each heifer in each period and stored at -20°C. Blood samples (5 mL) were
collected from a jugular catheter into tubes containing heparin (144 USP units; Becton
Dickinson, Rutherford, NJ) and transferred to the laboratory on ice. Blood samples were
centrifuged at 1,500 × g for 15 min at 4oC (Beckman Instruments Inc., Model J6-MC Centrifuge,
Mississauga, Ontario, Canada). The resulting plasma was stored at -20oC.
Dietary contents of RDP and RDS of the TMR were determined using the in situ
incubation technique (Yu et al. 2004) with two beef heifers (average BW 784 kg) that were fitted
with ruminal cannula (10 cm diameter opening, Bar Diamond, Parma, ID). The animals were
housed in individual 3 m × 3 m pens in the Livestock Research Building (University of
Saskatchewan) and were fed a blend of all four experimental diets at 2% of body weight (DM
basis) at 0800 and 1600 h daily. Briefly, samples of each of the diet pellets and the steam-rolled
Page 76
60
corn were ground through a 3 mm screen (Christy and Norris Ltd., Chelmsford, England), and
whole-shelled corn was crushed with a hammer to minimize grain shattering. The pellets and
corn were then combined in the correct ingredient proportions as in the TMR before a 7 g sample
was weighed into number-coded bags (10 cm × 20 cm, Nitex 03-41/31 monofilament open mesh
fabric, Screentec Corp., Mississauga, ON; with a 40 μm pore size). Incubations were carried out
for 72, 48, 24, 12, 8, 4, 2, and 0 h. Procedures for ruminal incubation and post-incubation
processing of bags were as described by Yu et al. (2004). Two incubation runs were conducted
and, within each incubation run, all diets were randomly incubated in duplicate in the two
heifers.
4.3.3 Sample Analyses
After completion of the experiment, frozen TMR, orts and faecal samples were thawed at
room temperature and then dried at 55oC for 96 h. Dried TMR, orts, and faecal samples were
ground through 1 mm screen using a Christy-Norris mill (Christy and Norris Ltd., Chelmsford,
England). Samples were then analyzed for DM by oven-drying at 135°C for 2 h [Association of
Official Analytical Chemists (AOAC) 1990; method 930.15], OM by ashing at 600oC for at least
8 h (AOAC 1990; method 942.05), CP using the macro-Kjeldahl procedure (AOAC 1990;
method 984.13), ether extract (AOAC 1990; method 920.39), starch (AOAC 1990; method
996.11), acid detergent fiber (ADF) (AOAC 1990; method 973.18), and neutral detergent fiber
(NDF; Van Soest et al. 1991). Amylase and sodium sulfite were used for NDF determination.
Dried TMR were analyzed for acid detergent insoluble (ADIN) and neutral detergent insoluble
(NDIN) nitrogen (Licitra et al. 1996), and acid detergent insoluble ash (ADIA; Van Soest et al.
1991). Prior to chemical analysis, the dried residues from in situ incubations were ground
Page 77
61
through a 1 mm screen using a Retch ZM 100 grinder (F-Kurt Retsch GmbH & Co. Kg,
Germany) and then analyzed for DM and starch as previously described, and CP using the
Dumas method of combustion on the LECO FP-528 Nitrogen/Protein Determinator (AOAC
1990; method 992.23. Duodenal samples were freeze-dried (Virtus ’72, Gardner, New York) and
then ground in a Braun Aromatic coffee grinder (KSM 2, 2.5 oz). Ground duodenal samples
were analyzed for OM, NDF, ADF, starch, and ADIA using the procedures described above.
Urinary urea-N was determined using the diacetyl monoxime method (Procedure No.
0580, Stanbio Laboratory, Boerne, TX) on background and daily composite 50 mL subsamples
of urine prior to processing for the determination of [15
N15
N]- and [14
N15
N]-urea enrichments.
Urinary urea was then isolated by applying urine containing 1.5 mg of urea-N to a pre-packed
cation exchange resin column (AG-50W- × 8 Resin, 100-200 mesh, H+ form; BioRad
Laboratories, Hercules, CA) as described by Archibeque et al. (2001). Samples were then eluted
with N-free water, air-dried and transferred to borosilicate glass tubes for freeze-drying and then
analyzed for the proportions of [15
N15
N]-, [14
N15
N]-, and [14
N14
N]-urea in urinary urea by isotope
ratio-mass spectrometry (15
N Analysis Laboratory, University of Illinois at Urbana-Champaign).
The results were corrected for [14
N15
N]-urea produced by non-monomolecular reactions (Lobley
et al. 2000). Total N in samples of daily urine output was determined using the macro-Kjeldahl
procedure (AOAC 1990; method 976.05). Diluted daily (d 19 to d 22) urine samples were
composited (proportionally based on daily urine output) by heifer for each period. Frozen plasma
samples were thawed and composited by heifer for each experimental period. Urea-N was
determined in urine and plasma using the diacetyl monoxime method.
In preparation for 15
N analysis, ruminal bacterial samples were freeze-dried and finely
ground with a mortar and pestle. Dried duodenal and daily faecal samples were finely ground
Page 78
62
using a ball mill. Finely ground ruminal bacterial, duodenal, and faecal samples were prepared
for 15
N analysis as described by Brito et al. (2006). Briefly, ruminal bacterial, duodenal, and
faecal samples containing approximately 100 µg of N were weighed into 5 × 9 mm tin capsules
(Elemental Microanalysis Limited, Okehampton, UK). To volatilize NH3-N, 50 µL of 72 mM
K2CO3 was then added to each tin capsule followed by incubation in a forced-air oven at 60°C
for 24 h. Enrichment of 15
N in ruminal bacterial, duodenal, and faecal samples was then
measured by combustion to N2 gas in an elemental analyzer and continuous flow isotope ratio-
mass spectrometry (Lobley et al. 2000). Dried duodenal digesta samples were analyzed for NH3-
N as described by Brito et al. (2006). Briefly, 10 mL of sodium citrate (77.5 mM, pH 2.2) was
added to 0.5 g of duodenal digesta sample, the mixture was mixed thoroughly by vortexing, and
then held at 39°C for 30 min. Samples were subsequently centrifuged at 15,000 × g for 15 min at
4°C and NH3-N concentration was determined in the supernatant using a phenol-hypochlorite
assay (Broderick and Kang 1980). Ruminal fluid samples preserved with meta-phosphoric acid
were analyzed for volatile fatty acid (VFA) concentration (Erwin et al. 1961) using an Agilent
6890 Series Gas Chromatography system (Wilmington, DE). Ruminal fluid samples preserved
with sulphuric acid were analyzed for NH3-N using a phenol-hypochlorite assay (Broderick and
Kang 1980). Osmolality was measured on non-acidified ruminal fluid samples using aVaproTM
Vapor Pressure Osmomemter (Model 5520; Wescor Inc., Logan, Utah).
4.3.4 Calculations and Statistical Analysis
Duodenal DM flow was determined as ADIA intake ÷ concentration of ADIA in
duodenal digesta. Dietary RDP and ruminally-undegradable protein (RUP) in vivo levels were
calculated as %RDP on CP basis = [(CP intake, g/d – RUP Flow, g d-1
) ÷ (CP intake, g d-1
)] ×
Page 79
63
100 and %RUP on CP basis = [(duodenal CP flow, g d-1
– 15
N bacterial CP flow, g d-1
) ÷ (CP
intake, g d-1
)] × 100 (Reynal and Broderick 2005). Dietary RDS was calculated as %RDS on
total starch basis = [(Total starch intake, kg d-1
– duodenal starch flow, kg d-1
) / Total starch
intake, kg/d)] × 100. Total N retention was calculated as intake N – faecal N – urinary N.
Apparent digestion of nutrients in the rumen was calculated as nutrient intake – duodenal flow of
nutrient (kg d-1
). Duodenal bacterial flow was determined based on calculations from Reynal and
Broderick (2005). The natural abundance of 15
N (15
NA) in rumen bacteria and duodenal digesta
were determined from samples collected from each heifer in each period prior to the initiation of
[15
N15
N]-urea isotope infusion. The 15
N enrichment was calculated for bacterial and duodenal
digesta samples for each heifer in each period as 15
N-atom % in sample minus individual heifer
15NA. Total microbial N flowing to the duodenum was calculated using
15N as a microbial
marker as nonammonia-nitrogen (NAN) flow to the duodenum × (duodenal 15
N enrichment of
NAN ÷ rumen bacteria 15
N enrichment), expressed in g per d. The above RUP flow (assumed to
comprise of dietary and endogenous NAN) was calculated as total duodenal N flow – bacterial N
flow, expressed in g per d. The flow of bacterial N derived from recycled urea-N was calculated
as bacterial N flow × (bacterial 15
N enrichment ÷ urinary 15
N enrichment) (Wickersham et al.
2008a). Microbial efficiency was calculated using 2 approaches: 1) based on g of N per kg of
OM truly digested in the rumen (OMTDR), calculated as microbial N flow ÷ kg of OMTDR, and
2) based on g of N per kg of total digestible organic matter intake (TDOMI), calculated as
microbial N flow ÷ TDOMI. Urea-N kinetics was calculated according to the model of Lobley et
al. (2000), using urinary 15
N enrichment of [15
N15
N]-urea, and [14
N15
N]-urea, and total 15
N
excretion in faeces.
Page 80
64
Ruminal degradation characteristics of CP and starch were analyzed using the non-linear
regression procedure of SAS (Version 9.1; SAS Institute, Inc. Cary, N. C.) using least squares
regression (Gauss-Newton method) as described by Yu et al. (2004). Ruminal fermentation
characteristics (pH, NH3-N, osmolality and VFA concentration) were analyzed using the Proc
Mixed repeated measures procedures of SAS. All other data were analyzed as a 4 × 4 Latin
square design with a factorial arrangement of dietary treatments using the Proc Mixed procedure
of SAS. The following model was used: Yijk = μ + Hi + Pj + RDSk + RDPl + (RDS x RDP)kl +
εijkl, where Yijkl = dependent variable, μ = overall mean, Hi = random effect of heifer i, Pj = fixed
effect of period j, RDSk = fixed effect of dietary RDS k, RDPl = fixed effect of dietary RDPl,
(RDS x RDP)kl = fixed effect of the interaction between RDSk and RDPl, and εijkl = random
residual error. When the RDS × RDP interaction was significant, means were compared using
the LSD test. Treatment differences were considered significant when P ≤ 0.05 and tendencies
were discussed when 0.05 < P ≤ 0.10.
4.4 Results
4.4.1 Dietary Characteristics
Dietary ingredients and chemical composition are presented in Table 4.1. As expected, all
diets were similar (mean ± SEM) in CP (10.0 ± 0.14%), ADF (20.4 ± 0.22%) and NDF (41.8 ±
0.41%) content. In situ ruminal incubation of TMR showed that dietary RDS levels were 28.6%
and 69.2% of total starch for the low and high RDS treatments, respectively, and that dietary
RDP levels were 48.0% and 55.0 % of CP for the low and high RDP treatments, respectively
(Table 4.3).
Page 81
65
4.4.2 Ruminal Fermentation Characteristics
Ruminal pH was lower (P < 0.01) in heifers fed high RDS as compared with those fed the low
RDS diets (5.93 vs. 5.76; Table 4.4). In addition, ruminal pH was lower (P = 0.01) in heifers fed
the high RDP as compared with those fed the low RDP diets (5.79 vs. 5.90). Ruminal NH3-N
concentration was greater (P = 0.01) in heifers fed high RDP as compared with those fed low
RDP (8.6 vs. 6.3 mg dL-1
). Ruminal NH3-N concentration was greater (P = 0.01) in heifers fed
low RDS as compared with those fed high RDS (8.5 vs. 6.3 mg dL-1
). Ruminal osmolality was
higher (P = 0.02) for heifers on the high RDP diet as compared with the low RDP diet (273.9 vs.
258.6 mOsm L-1
). Total and individual VFA concentrations were unaffected by dietary
treatment, except for ruminal valerate concentration which was greater (P = 0.03) in heifers fed
the low RDS diet compared with those fed the high RDS diet (0.6 vs. 0.5 mM).
4.4.3 Nutrient Intake, Duodenal Nutrient Flow, and Ruminal and Total-tract
Nutrient Digestibility
Nutrient intake and duodenal flows of DM, OM, NDF, ADF, and starch were unaffected by
dietary treatment (P > 0.05; Table 4.5). The percentages of DM (interaction, P = 0.05) and OM
(tendency for an interaction, P = 0.10) digested in the rumen decreased as RDP level increased
on the high RDS diet, but no differences were observed on the low RDS diet. Ruminal digestion
of NDF, when expressed in absolute amounts (interaction, P = 0.03) or as a percentage of NDF
intake (interaction, P = 0.02), decreased as RDP level increased on the high RDS diet but no
differences were observed on the low RDS diet. Total tract digestibility of NDF was greater (P =
0.03) on the low RDP diet as compared with the high RDP diet (48.6 vs. 41.4%). The amount of
ADF digested in the rumen tended (P = 0.08) to decrease as RDP level increased on the high
Page 82
66
Table 4.1 Ingredient and chemical composition of diets fed to beef heifers
Low RDSz High RDS
z
Item
Low
RDPy
High
RDPy
Low
RDPy
High
RDPy
Total mixed ration, % DM basis
Oat hulls 49.6 48.9 47.0 46.1
Steam-rolled corn - - 42.4 42.6
Whole-shelled corn 40.9 42.9 - -
Canola meal - 3.0 - 6.0
Fishmeal 4.4 - 5.5 -
Supplement 5.1 5.2 5.1 5.3
Supplement, % DM basis
Barley grain 51.9 38.3 56.6 45.3
Limestone 18.6 18.3 18.7 20.6
Rumensin premixx
7.2 7.1 7.3 7.2
Urea 4.9 19.2 - 9.7
Trace mineral saltw
7.7 7.6 7.7 7.6
LS 106v
9.7 9.5 9.7 9.6
Chemical composition of total mixed ration
Dry matter (DM), % 91.4 91.4 91.2 90.9
Organic matter, % DM 95.3 95.6 95.1 95.5
Crude protein (CP), % DM 9.6 10.3 9.7 9.8
Starch, % DM 33.9 35.2 35.6 35.7
Crude fat, % DM 2.7 2.5 2.9 2.5
Acid detergent fiber, % DM 21.5 20.3 19.4 20.5
Neutral detergent fiber, % DM 44.0 41.3 40.8 41.1
Neutral detergent insoluble nitrogen, % of total N 3.10 1.56 3.71 2.06
Acid detergent insoluble nitrogen, % of total N 0.60 0.70 0.70 0.80
Rumen degradation (% of total)u
Crude Protein 45.9 57.3 50.1 52.8
Starch 29.0 28.2 69.6 68.8
Energy contentt, DM basis
Metabolizable energy, Mcal kg-1
DM 2.33 2.48 2.33 2.49
Net energym, Mcal kg-1
DM 1.45 1.59 1.46 1.60
Net energyg, Mcal kg-1
DM 0.87 0.99 0.87 0.99 zRDS = ruminally degradable starch of 28.6 and 69.2% for the low and high RDS treatments,
respectively as determined by in situ incubations. yRDP = ruminally degradable protein of 48 and 55% for the low and high RDP treatments,
respectively as determined by in situ incubations. xRumensin premix: 3% monensin sodium or 30,000 mg kg
-1 monensin sodium
wTM Salt: 95% salt,12,000 ppm zinc, 10,000 ppm manganese, 4,000 ppm copper, 400 ppm
iodine, 60 ppm cobalt, 30 ppm added selenium. vLS 106: 440,500 IU vitamin A, and 88,000 IU vitamin D3 kg
-1.
uRuminal degradation of CP and starch were estimated by in situ incubation of total mixed
rations. tCalculated based on NRC (1996) equations.
Page 83
67
Table 4.2 Chemical composition of dietary ingredients
%, DM basis Whole-shelled corn Steam-rolled corn Oat hulls Fishmeal Canola meal Barley
Dry Matter (DM) 85.5 84.2 89.2 96.4 87.5 87.6
Organic Matter 98.5 98.4 95.3 79.8 92.7 96.5
Crude Protein 9.2 8.8 3.3 68.6 41.2 13.1
Ether Extract 4.4 4.3 1.5 11.6 4.4 2.3
Starch 70.0 72.9 5.1 0.2 1.1 53.6
Page 84
68
Table 4.3 In situ ruminal degradation kinetics of crude protein (CP) and starch in total mixed rations
Low RDSz
High RDSz
P values
Item
Low
RDPy
High
RDPy
Low
RDPy
High
RDPy
SEMx
RDS
RDP
RDS × RDP
CP
Sw (%) 34.5 36.9 37.1 34.9 1.20 0.83 0.95 0.12
Dv (%) 26.3 29.3 45.5 45.8 2.79 <0.01 0.59 0.64
Uu (%) 39.2 36.7 17.3 19.3 3.42 <0.01 0.64 0.34
Kdt (% h
-1) 5.0 22.1 2.4 3.8 8.51 0.29 0.34 0.41
%BCP s (%RUP) 54.1 42.7 49.9 47.3 5.12 0.98 0.24 0.44
%EDCP r (%RDP) 45.9 57.3 50.1 52.8 5.12 0.98 0.24 0.44
Starch
Sw (%) 14.8 12.2 37.5 40.7 1.44 <0.01 0.83 0.11
Dv (%) 46.7 50.7 61.3 57.2 9.34 0.32 0.99 0.69
Uu (%) 38.5 37.2 1.3 2.1 8.33 0.01 0.97 0.90
Kdt (% h
-1) 4.2 4.3 6.7 5.8 2.16 0.41 0.86 0.82
%BSq (%RUS) 71.0 71.8 30.4 31.2 4.30 <0.01 0.86 0.99
%EDSp (%RDS) 29.0 28.2 69.6 68.8 4.30 <0.01 0.86 0.99
zRDS = ruminally degradable starch of 28.6 and 69.2% for the low and high RDS treatments, respectively as
determined by in situ incubations. yRDP = ruminally degradable protein of 48 and 55% for the low and high RDP treatments, respectively as determined
by in situ incubations. xSEM = pooled standard error of the mean
wS = rapidly-degradable fraction (soluble; %)
vD = slowly-degradable fraction (potential; %)
uU = undegradable fraction (%)
tKd = degradation rate of the D fraction (%h
-1)
s%BCP = percent ruminally-undegradable crude protein
r%EDCP = percent effective (ruminally) degradable crude protein (calculated assuming a rumen outflow rate of 6% h
-1)
q%BS = percent ruminally-undegradable starch
p%EDS = percent effective (ruminally) degradable starch (calculated assuming a rumen outflow rate of 6% h
-1)
Page 85
69
RDS diet, but no difference was observed on the low RDS diet. The percentage of ADF intake
digested in the rumen decreased as RDP level increased on the high RDS diet, but no difference
was observed on the low RDS diet (interaction, P = 0.01). Total tract digestibility of ADF was
greater (P = 0.03) on the low RDP diet as compared to the high RDP diet (48.9 vs. 40.9%). Total
tract digestibility of starch was greater (P = 0.02) on the high RDS diet as compared to the low
RDS diet (99.4 vs. 98.2%).
4.4.4 Nitrogen Balance
Nitrogen intake, urinary N output, retention, and N digestibility, were unaffected by
dietary treatment (P > 0.05; Table 4.6); however, faecal N output tended to increase as dietary
RDP level increased on the high RDS diet, but no difference was observed on the low RDS diet
(tendency for an interaction, P = 0.08). Plasma urea-N concentration tended to increase as
dietary RDP level increased on the high RDS diet, but no differences due to RDP level were
observed at the low RDS (tendency for an interaction, P = 0.08).
Page 86
70
Table 4.4 The effects of dietary ruminally-degradable starch (RDS) and ruminally-degradable protein
(RDP) levels on ruminal fermentation characteristics in beef heifers
Low RDSz High RDS
z P values
Item
Low
RDPy
High
RDPy
Low
RDPy
High
RDPy
SEMx
RDS
RDP
RDS × RDP
Rumen pH 5.99 5.86 5.81 5.71 0.040 <0.001 0.01 0.59
Ammonia-N, mg dL-1
7.50 9.47 4.97 7.55 1.316 0.01 0.01 0.71
Osmolality, mOsm L-1
258.5 268.8 258.7 279.0 10.06 0.42 0.02 0.44
Volatile fatty acids, mM
Acetate (A) 61.2 57.6 62.5 57.2 3.77 0.91 0.27 0.83
Propionate (P) 16.6 19.0 20.0 21.6 2.62 0.21 0.38 0.84
Butyrate 6.83 6.99 7.29 7.63 0.916 0.56 0.79 0.93
Isobutyrate 0.48 0.50 0.46 0.46 0.030 0.32 0.81 0.67
Valerate 0.55 0.58 0.46 0.46 0.048 0.03 0.68 0.79
Isovalerate 1.17 1.49 1.05 1.08 0.185 0.18 0.36 0.45
Total VFA 86.8 86.2 91.8 88.4 5.93 0.55 0.74 0.82
A:P ratio 3.88 3.19 3.21 2.84 0.375 0.16 0.15 0.65 zRDS = 28.6 and 69.2% for the low and high RDS treatments, respectively, as determined by in situ incubations.
yRDP = 48 and 55% for the low and high RDP treatments, respectively, as determined by in situ incubations.
xSEM = pooled standard error of the mean.
Page 87
71
Table 4.5 The effects of dietary ruminally-degradable starch (RDS) and ruminally-degradable protein (RDP)
levels on intake, flow to the duodenum, ruminal digestibility, and total tract nutrient digestibility in beef heifers
Low RDSz High RDS
z P values
Item
Low
RDPy
High
RDPy
Low
RDPy
High
RDPy
SEMx
RDS
RDP
RDS × RDP
Dry Matter (DM)
Intake, kg d-1
10.31 10.49 10.03 10.12 0.759 0.55 0.81 0.93
Flow at the duodenum, kg d-1
5.16 5.18 4.81 5.69 0.563 0.83 0.24 0.26
Digested in the rumen
kg d-1
4.81 5.37 5.35 4.39 0.377 0.56 0.61 0.08
% of DM intake 49.2 51.2 53.4 43.5 2.02 0.46 0.14 0.05
Total tract digestibility, % 67.5 67.6 70.6 66.3 1.47 0.57 0.22 0.21
Organic Matter (OM)
Intake, kg d-1
9.82 10.03 9.53 9.66 0.724 0.52 0.75 0.93
Flow at the duodenum, kg/d 4.44 4.48 4.19 4.97 0.434 0.71 0.23 0.28
App. digested in the rumen
kg d-1
5.05 5.61 5.41 4.67 0.409 0.46 0.82 0.12
% of OM intake 54.7 54.7 56.8 48.4 1.44 0.30 0.07 0.10
Total tract digestibility, % 69.1 69.0 72.1 67.9 1.32 0.51 0.17 0.19
Nitrogen (N)
Intake, g d-1
156.7 170.3 151.7 157.0 11.76 0.34 0.33 0.66
Flow at the duodenum, g/d 136.8 118.9 125.6 148.5 24.11 0.40 0.81 0.07
App. digested in the rumen
g d-1
23.0 46.3 29.7 6.2 17.79 0.16 0.99 0.07
% of N intake 16.9 28.4 19.7 5.6 11.52 0.21 0.86 0.13
Total tract digestibility, % 76.7 78.2 78.0 75.1 1.69 0.50 0.58 0.13
Neutral detergent fiber (NDF)
Intake, kg d-1
4.56 4.42 4.34 4.35 0.395 0.54 0.89 0.56
Flow at the duodenum, kg/d 2.79 2.68 2.45 3.01 0.244 0.98 0.39 0.21
Digested in the rumen
kg d-1
1.75a
1.75a
1.86a
1.35b
0.266 0.14 0.03 0.03
% of NDF intake 37.9ab
39.8a
42.4a
30.3b
3.49 0.29 0.06 0.02
Total tract digestibility, % 47.1 41.3 50.0 41.5 2.50 0.54 0.03 0.62
Page 88
72
Acid detergent fiber (ADF)
Intake, kg d-1
2.24 2.19 2.09 2.18 0.194 0.54 0.89 0.53
Flow at the duodenum, kg/d 1.38 1.30 1.20 1.45 0.095 0.91 0.43 0.15
Digested in the rumen
kg d-1
0.85 0.90 0.89 0.73 0.125 0.29 0.33 0.08
% of ADF intake 36.5ab
41.0a
42.3a
32.9b
3.36 0.55 0.22 0.01
Total tract digestibility, % 47.8 40.4 49.9 41.3 2.76 0.62 0.03 0.85
Starch
Intake, kg d-1
3.33 3.57 3.51 3.35 0.304 0.94 0.85 0.33
Flow at the duodenum, kg d-1
0.13 0.13 0.11 0.16 0.027 0.60 0.21 0.17
Digested in the rumen
kg d-1
3.07 3.44 3.39 3.20 0.287 0.85 0.69 0.25
% of Starch intake 96.1 96.3 96.5 95.6 0.71 0.75 0.46 0.28
Total tract digestibility, % 97.8 98.5 99.4 99.4 0.47 0.02 0.38 0.43 z
RDS = 28.6 and 69.2% for the low and high RDS treatments, respectively, as determined by in situ incubations. y
RDP = 48 and 55% for the low and high RDP treatments, respectively, as determined by in situ incubations. x
SEM = Pooled standard error of the mean.
a,b
= Means within a row with different superscripts differ (P < 0.05).
Page 89
73
Table 4.6 The effects of dietary ruminally-degradable starch (RDS) and ruminally-degradable protein
(RDP) levels on nitrogen (N) intake, retention, digestibility, and plasma urea-N concentrations in beef
heifers
Low RDSz High RDS
z P values
Item
Low
RDPy
High
RDPy
Low
RDPy
High
RDPy
SEMx
RDS
RDP
RDS × RDP
N intake, g d-1
156.7 170.3 151.7 157.0 11.76 0.34 0.33 0.66
Faecal N, g d-1
37.6 35.3 32.7 39.5 3.56 0.87 0.32 0.08
Urinary N, g d-1
85.1 90.5 81.3 89.8 6.88 0.57 0.11 0.69
UUNw:urine-N ratio 0.69 0.78 0.67 0.70 0.050 0.33 0.28 0.56
N retention, g d-1
32.2 45.1 38.0 28.8 6.64 0.50 0.81 0.20
N retained, % of N intake 20.8 24.8 24.5 17.9 3.71 0.68 0.75 0.24
N in faeces, % of N intake 23.3 21.8 22.0 24.9 1.69 0.50 0.58 0.13
N in urine, % of N intake 56.0 53.2 53.6 57.1 3.00 0.81 0.91 0.37
N digestibility, % 76.7 78.2 78.0 75.1 1.69 0.50 0.58 0.13
Plasma Urea-N, mg dL-1
10.6 10.2 8.6 11.4 1.03 0.60 0.19 0.08 z
RDS = 28.6 and 69.2% for the low and high RDS treatments, respectively, as determined by in situ incubations. y
RDP = 48 and 55% for the low and high RDP treatments, respectively, as determined by in situ incubations. x
SEM = Pooled standard error of the mean.
wUUN = urinary urea-nitrogen
Page 90
74
4.4.5 Microbial Protein Production
Total N flow at the duodenum was unaffected by dietary treatment (Table 4.7). Microbial N flow
to the duodenum (interaction, P = 0.04) and microbial efficiency, expressed as g N kg-1
OMTDR
(interaction, P = 0.01) or g N kg-1
TDOMI (interaction, P = 0.02), increased as RDP level
increased on the high RDS diet but was not affected by RDP level on the low RDS diet. The
incorporation of recycled urea-N in microbial N increased as RDP level increased on the high
RDS diet, but the opposite was observed on the low RDS diet (interaction, P = 0.01). The
amount of recycled urea-N incorporated into microbial N, when expressed as a percentage of
total microbial N, was greater (P = 0.04) on the low RDP diet as compared to the high RDP diet.
The amount of recycled urea-N in microbial N (as a percentage of urea-N production) tended to
be greater as RDP level decreased on the low RDS diet, but was not different at the high RDS
level (tendency for an interaction, P = 0.06).
4.4.6 Urea-N Kinetics
Endogenous production of urea-N (UER), urea-N transfer to the GIT (GER), urea-N
utilized for anabolism (UUA), urinary urea-N excretion (UUE), and urea-N loss to faeces (UFE)
were similar across diets (P > 0.05; Table 4.8). The amount of GER that was returned to the
ornithine cycle (i.e., ROC) was 23.7% greater in heifers fed the high RDP when compared to
those fed the low RDP at the high RDS diet, but ROC was unaffected by RDP level on the low
RDS diet (interaction, P = 0.04). Fractional transfers of urea-N were unaffected (P > 0.05) by
dietary treatment.
Page 91
75
Table 4.7 The effects of dietary ruminally-degradable starch (RDS) and ruminally-degradable protein (RDP)
levels on microbial nitrogen (N) flows at the duodenum measured by 15
N as a microbial marker in beef heifers
Low RDSz High RDS
z P values
Item
Low
RDPy
High
RDPy
Low
RDPy
High
RDPy
SEMx
RDS
RDP
RDS × RDP
Duodenal N flow (g N d-1
)
Total 106.4 125.6 126.0 149.3 24.11 0.40 0.81 0.07
Microbial 77.9ab
98.7a 76.7
b 110.6
a 22.48 0.41 0.06 0.04
Microbial efficiency
g N kg-1
OMTDRw
15.7ab
14.8bc
11.9c 18.4
a 2.25 0.91 0.03 0.01
g N kg-1
TDOMIv
14.2a 14.0
a 10.8
b 16.2
a 2.24 0.48 0.02 0.02
Recycled urea-N in microbial N
N, g d-1
10.74ab
7.85c 8.46
bc 11.30
a 2.643 0.42 0.97 <0.01
% of total microbial N 11.15 7.64 11.01 10.17 1.020 0.18 0.04 0.12
% of urea-N production 7.16d 4.96
e 6.44
de 6.84
de 1.275 0.35 0.18 0.05
% of gut entry of urea-N 12.35 9.17 12.08 11.00 2.272 0.61 0.20 0.45 z
RDS = 28.6 and 69.2% for the low and high RDS treatments, respectively, as determined by in situ incubations. y
RDP = 48 and 55% for the low and high RDP treatments, respectively, as determined by in situ incubations. x
SEM = Pooled standard error of the mean. w
Microbial N flowing to the duodenum per kg of organic matter (OM) truly digested in the rumen (OMTDR). v
Microbial N flowing to the duodenum per kg of total digestible OM intake (TDOMI).
a-e
= Means within a row with different superscripts differ (P < 0.05).
Page 92
76
Table 4.8 The effects of dietary ruminally-degradable starch (RDS) and ruminally-degradable
protein (RDP) levels on urea-nitrogen (N) recycling kinetics, as measured by continuous jugular
infusion of [15
N15
N]-urea in beef heifers
Low RDSz High RDS
z P values
Item
Low
RDPy
High
RDPy
Low
RDPy
High
RDPy
SEMx
RDS
RDP
RDS × RDP
Urea-N fluxes, g d-1
UERw
149.8 149.3 129.6 152.8 6.22 0.23 0.12 0.11
GERv
90.7 81.6 72.4 93.5 7.65 0.69 0.47 0.10
UUAu
19.9 12.7 14.6 18.0 4.83 0.99 0.71 0.31
ROCt 68.3
a 66.5
ab 55.5
b 72.7
a 3.67 0.40 0.08 0.04
UUEs
59.1 67.7 57.2 59.3 2.98 0.13 0.12 0.32
UFEr
2.48 2.33 2.30 2.71 0.187 0.61 0.51 0.19
Fractional transfers
UER to urine 0.39 0.46 0.45 0.39 0.035 0.91 0.90 0.10
UER to GITq
0.61 0.54 0.55 0.61 0.035 0.92 0.90 0.10
GER to ROC 0.76 0.86 0.81 0.79 0.043 0.88 0.36 0.21
GER to faeces 0.03 0.03 0.03 0.03 0.004 0.60 0.98 0.37
GER to UUA 0.22 0.11 0.16 0.18 0.045 0.92 0.39 0.21 z
RDS = 28.6 and 69.2% for the low and high RDS treatments, respectively, as determined by in situ incubations y
RDP = 48 and 55% for the low and high RDP treatments, respectively, as determined by in situ incubations x
SEM = Pooled standard error of the mean
wUER = Urea-N entry rate
vGER = Gastro-intestinal entry rate
uUUA = Urea-N utilized for anabolism
tROC = Return to ornithine cycle
sUUE = Urinary urea-N excretion
rUFE = Urea-N loss to faeces
qGIT = Gastro-intestinal tract
a-b
= Means within a row with different superscripts differ (P < 0.05).
Page 93
77
4.5 Discussion
In intensive ruminant production systems, N excretion as urea into the environment is a
source of pollution and so there is increasing public pressure to improve the efficiency of N
utilization in ruminants. Because dietary N intake is a major factor that determines total N intake
(Castillo et al. 2000; Yan et al. 2000), lowering dietary N level has been shown to decrease N
excretion into the environment in both cattle (Archibeque et al. 2001) and sheep (Kiran and
Mutsvangwa 2010). Lowering dietary N levels consistently decreases ruminal NH3-N
concentrations. Because ruminal NH3-N concentration is negatively correlated with urea-N
transfer into the rumen (Kennedy and Milligan 1980), the improved efficiency of N utilization
with a lower dietary N level is partly mediated by increased urea-N recycling to the GIT
(Lapierre and Lobley 2001). The microbial sequestration of recycled urea-N for microbial
protein synthesis depends on the availability of ruminally-fermentable carbohydrate (RFC), and
large amounts of recycled urea-N can be reabsorbed into the bloodstream if RFC is limiting.
Therefore, it is important to gain an insight into how concomitant manipulation of dietary levels
of RDP and RDS in low CP diets would alter urea-N recycling to the GIT and the incorporation
of urea-N into microbial protein, which was a major objective of the present study.
Our results show that manipulation of dietary levels of RDP and RDS did not alter UER
or GER. A meta-analysis of experimental data on trans-hepatic urea-N fluxes in ruminants at
variable N intakes and productive states showed a strong, positive correlation (r2 = 0.96) between
N intake and UER (Huntington and Archibeque 1999). Because N intake was not affected by diet
in the present study, it is not surprising that UER was similar across diets. When UER:digestible
N intake ratios were calculated, they ranged from 1.10 to 1.30, which is within the range of 0.43
to 1.23 reported by Lapierre and Lobley (2001). When compared to previous studies with cattle
Page 94
78
fed low CP diets (Marini and Van Amburgh 2003; Wickersham et al. 2008b; Wickersham et al.
2009), our UER estimates are greater and this may be a reflection of the greater N intakes and
larger body weights of the heifers used in the present study. The quantity of hepatic urea-N
output that was transferred to the GIT (GER), when expressed as a proportion of UER (i.e.,
GER:UER), ranged from 0.54 to 0.61 and this falls within the range of 0.10 to 0.95 reported by
others (Harmeyer and Martens 1980). There is evidence in the literature that providing more
RFC by feeding more starch (Kennedy and Milligan 1980; Huntington 1989; Rémond et al.
1996) or by more extensive processing of cereal grains to increase ruminal starch fermentation
(Alio et al. 2000; Theurer et al. 2002) increases urea-N transfer to the rumen and microbial
protein production. Based on these previous studies, we had anticipated that feeding steam-rolled
corn would increase both urea-N transfer to the rumen and UUA (which is assumed to be
primarily microbial utilization; Lobley et al. 2000) when compared to feeding whole-shelled
corn. In contrast to previous studies, we did not observe any differences in GER or UUA. Even
though in situ RDS measurements indicated large differences in RDS between steam-rolled and
whole-shelled corn, in vivo measurements of ruminal starch digestion (expressed as absolute
amounts or as a proportion of starch intake) were similar. This would indicate that ruminal
energy supply was not quantitatively different between heifers fed steam-rolled or whole-shelled
corn, which could be a possible explanation for the discrepant results. Other studies (Kiran and
Mutsvangwa 2007; Gozho et al. 2008) have also failed to detect differences in GER or UUA
when ruminal energy supply was altered via grain processing. Besides ruminal energy supply,
ruminal NH3-N concentration also affects GER (Kennedy and Milligan 1980), possibly because
a high ruminal NH3-N concentration decreases the ruminal epithelium’s permeability to urea-N
(Egan et al. 1986). Also, high ruminal NH3-N concentrations decrease bacterial urease activity
Page 95
79
(Cheng and Wallace 1979) and, although bacterial urease activity in the rumen was not measured
in the present study, Muscher et al. (2010) reported a negative correlation between ruminal
urease activity and in vitro serosal-to-mucosal urea flux across ruminal epithelia. Ruminal NH3-
N concentration was lower in heifers fed the high RDS diet when compared with those fed the
low RDS diet. Based on the documented effects of ruminal NH3-N concentration on urea-N
transfer, the lower ruminal NH3-N concentration in heifers fed the high RDS would be expected
to have stimulated urea-N transfer to the GIT; however, that was not the case and the reasons for
these discrepant results are unclear. It is plausible that the lower ruminal pH that was observed
in heifers fed the high RDS when compared with those fed the low RDS diet might have negated
any potential stimulatory effects of low ruminal NH3-N concentration on urea-N transfer. Under
the acidotic ruminal conditions that were imposed in heifers fed the high RDS diet, depressed
bacterial urease activity might have impaired urea-N transfer to the rumen (Gozho et al. 2008).
Using the Ussing chamber technique, Abdoun et al. (2010) varied mucosal pH between 7.4 and
5.4 and observed that serosal-to-mucosal urea flux across ruminal epithelia was maximal at a pH
of 6.2 before it declined sharply as mucosal pH was reduced to 5.4. In the present study, ruminal
pH in heifers fed the high RDS diet was 5.76 as compared with 5.93 in those fed the low RDS
diet. Although this difference was small, we can surmise that the more acidic ruminal conditions
with the high RDS diet could have inhibited urea-N transfer to the GIT.
A major goal when feeding ruminants is to optimize ruminal microbial protein supply as
it can contribute as much as 60% of the metabolizable protein that is digested in the small
intestine (National Research Council 2001). Also, microbial protein synthesis in the rumen offers
the only opportunity for anabolic utilization of recycled urea-N that would then benefit the host
animal by providing amino acids at the small intestine. Although total N flow at the duodenum
Page 96
80
was unaffected by diet, microbial N flow to the duodenum and microbial efficiency both
increased as RDP level increased on the high RDS diet, but were not affected by RDP level on
the low RDS diet. Data from several studies summarized by Cruz Soto et al. (1994) showed that
ruminal fermentation responded to RDP supplementation when dietary RFC was increased, a
response that can be attributed to a coupling of energy production with NH3-N release that,
consequently, increases the capture of NH3-N for microbial protein synthesis. The available
evidence indicates that both duodenal flow of microbial N and microbial efficiency are greatest
when diets are synchronized for rapid rates of energy and protein degradation (Aldrich et al.
1993; Herrera-Saldana et al. 1990). In diets containing low RDS, supplying additional RDP had
minimal positive effects on microbial growth likely because the rates of energy and protein
degradation were unsynchronized. Although urea-N transfer can occur across the entire GIT
(Lapierre and Lobley 2001), only urea-N that is recycled into the rumen can potentially
contribute amino acids to the host animal. In the present study, the amount of recycled urea-N
that was recovered as microbial N was low, ranging from 7.85 to 11.30 g d-1
. These values are
lower when compared to those reported by Wickersham et al. (2008a) (12.3 to 28.9 g d-1
) and
Wickersham et al. (2008b) (22.9 to 47.4 g d-1
). Apart from recycled urea-N, ruminal NH3-N for
microbial use can also be derived from the degradation of dietary RDP. As dietary RDP supply
increases, ruminal bacteria become less dependent on recycled urea-N as a source of NH3-N. In
the studies of Wickersham et al. (2008a, 2009b), dietary N intakes (and, therefore, RDP intakes)
were much lower than those used in the present study, thus resulting in lower ruminal NH3-N
concentrations and greater rates of urea-N recycling (when expressed as a proportion of UER).
Coupled together, lower ruminal NH3-N concentrations and greater rates of urea-N recycling
would, in turn, promote a greater dependence on recycled urea-N as a source of NH3-N. These
Page 97
81
differences could explain the discrepant results between studies in recycled urea-N use for
microbial N production.
Most indicators of N utilization (i.e., N intake, retention, and excretion) were not affected
by dietary levels of RDS and RDP. Averaged across diets, as a percentage of N intake, 23% of N
was excreted in faeces, 55% excreted in urine, and only 22% was retained. Satter et al. (2002)
reported that 80 to 90% of N fed to feedlot cattle was excreted with over 50% excreted as urinary
N. Over 50% of urinary N was excreted as urea-N which could be readily volatilized to ammonia
(Van Horn et al., 1996) and nitrate can leach into the ground (Pakrou and Dillon 1995), thus
leading to environmental concerns. On the high RDS diet, increasing dietary RDP level tended to
increase faecal N output. This could be due to increased hindgut fermentation leading to a greater
recovery of N in microbial protein (Ushida et al. 1991). Microbial protein synthesized in the
hindgut cannot be digested or absorbed and is, therefore, excreted in the faeces. Faecal N is
considered less of an environmental pollutant than urinary N. Nutritional strategies that partition
more excreted N to the faeces than the urine could reduce the negative environmental impact of
feedlot production systems.
Only minor dietary effects were observed on ruminal and total tract nutrient digestion.
When expressed in absolute amounts or as a percentage of nutrient intake, ruminal digestion of
NDF and ADF decreased as RDP level increased on the high RDS diet but no difference was
observed on the low RDS diet. The reasons for this interaction are unclear, but could be related
to changes in ruminal pH. A ruminal pH below 6.0 suppresses cellulolytic bacterial activity
(Ørskov 1986; Owens and Goetsh 1988), thereby decreasing fibre digestion (Hoover 1986;
Oliveira et al. 1993). When compared to heifers fed low RDS whose mean ruminal pH was 6.0,
heifers fed high RDS had a mean ruminal pH of 5.8, which is below the optimum ruminal pH for
Page 98
82
fibre digestion. Although ruminal starch digestion was unaffected, total tract digestibility of
starch was greater in heifers fed the high RDS diet as compared with those fed the low RDS diet.
In a review of 19 published studies, Theurer et al. (1999) reported a consistent increase in total
tract starch digestion when corn grain was processed (i.e., ground, steam-rolled or steam-flaked)
when compared with whole-shelled corn. In the present study, however, it should be noted that
differences in total tract starch digestion were small and the major site of starch digestion was the
rumen as has been reported previously in ruminants fed corn-based diets (Theurer 1986; Theurer
et al. 1999). In the present study, we used duodenal sampling and ADIA as an internal marker to
estimate duodenal nutrient flows. Other workers (Galloway et al. 1993; Stafford et al. 1996;
Heldt et al. 1999; Lehloenya et al. 2008; Wickersham et al. 2008a; Wickersham et al. 2008b)
have used ADIA in dairy and beef cattle and it has been established as a reliable method for
estimating digesta flow rate (Porter and Sniffen 1986). However, it is recognized that errors
associated with sample collection via a T-type duodenal cannula can arise (Harmon and Richards
1997; Titgemeyer 1997), thus leading to erroneous nutrient flows. The reliability of nutrient flow
data can be determined by how well it compares with reliable estimates published in the
literature and whether it falls within biological limits (Titgemeyer 1997). In the present study,
mean OM intake and duodenal OM flow were 9.8 and 4.5 kg d-1
, respectively. In comparison,
Lehloenya et al. (2008) reported duodenal OM flow of 6.6 kg d-1
with an OM intake of 13.7 kg d-
1 in beef steers weighing an average of 534 kg. Although OM intakes were different between the
two studies, OM digested in the rumen (expressed as a percentage of OM intake) was similar
(52.1 and 53.7%) and falls within the range of 30 to 60% that has been suggested to be typical
for ruminal OM digestion (Titgemeyer 1997). Also, ruminal NDF digestion (mean = 37.6%)
represented 84% of total tract NDF digestion. According to Titgemeyer (1997), at least 80% of
Page 99
83
total tract NDF digestion should occur in the rumen. Because the proportion of OM and NDF
intake that was digested in the rumen in the present study compares favorably with published
data (see Titgemeyer 1997), this suggests that ADIA was a suitable marker and that our protocol
for duodenal sampling yielded representative digesta samples.
Observed changes in ruminal pH and NH3-N concentration were typical of those reported
when dietary RDS or RDP content is altered. With processed corn, the rapid fermentation of
starch in the rumen can lead to increased production of VFA and a reduction in ruminal pH
(Owens et al. 1998; Nagaraja and Titgemeyer 2007). However, in the present study, depressed
ruminal pH in heifers fed the high RDS diet occurred without any changes in ruminal VFA
concentrations. It is possible that the decrease in ruminal pH was due to increased concentrations
of other acids such as lactic acid that were not measured. Lactic acid has a lower pKa value than
the other VFA and, therefore, has a greater potential of decreasing ruminal pH (Krause and
Oetzel 2006; Nagaraja and Titgemeyer 2007). Ruminal pH was also lower in heifers fed high
RDP when compared with those fed low RDP, which could be indicative of greater microbial
fermentative activity (Cabrita et al. 2006). For all diets, mean ruminal NH3-N concentration was
≥5.0 mg dL-1
, which has been suggested to be optimum for maximum microbial protein synthesis
(Satter and Slyter 1974). As expected, ruminal NH3-N concentration was greater in heifers fed
high RDP as compared with those fed low RDP, which is in agreement with previous studies in
dairy cows (Cunningham et al. 1996; Reynal and Broderick 2005). In the rumen, RDP is broken
down through microbial activity to peptides, amino acids and NH3-N (McAllister et al. 1994).
Therefore, a greater concentration of ruminal NH3-N would be expected when more RDP is fed.
Also, ruminal NH3-N concentration was greater in heifers fed low RDS when compared with
those fed high RDS and this could be reflective of reduced microbial proteolytic activity as a
Page 100
84
result of the more acidic ruminal environment that was observed in heifers fed high RDS (Van
Soest 1994). Microbial sequestration of ruminal NH3-N during microbial protein synthesis is an
energy-dependent process and is most efficient when energy and N availability are coupled
(Reynolds and Kristensen 2008), so the lower ruminal NH3-N concentration in heifers fed high
RDS may also be reflective of a more efficient capture of NH3-N. However, it should be noted
that the extent of ruminal starch digestion (and, therefore, ruminal energy supply) and duodenal
microbial N supply were unaltered by dietary RDS. Ruminal osmolality was higher for heifers
on the high as compared with those on the low RDP diets. Osmolality is a measure of solute
concentration in the ruminal fluid (Owens et al. 1998). Higher osmolality values would be
expected on high RDP diets with a corresponding higher ruminal NH3-N concentration.
However, normal ruminal osmolality levels are between 240 and 300 mOsm L-1
(Owens et al.
1998) and, therefore, all experimental animals were within the normal range.
In summary, when beef heifers were fed a low dietary CP level (10 %), increasing RDP
and RDS content increased the amount of urea-N ROC and resulted in greater microbial N
supply to the duodenum and improved the efficiency of microbial N production. Incorporation of
this feed formulation strategy by producers could be beneficial in terms of reducing overall
dietary CP level in beef heifer diets and in reducing the impact of excess N excreted into the
environment. Furthermore, judicious combinations of RDP and RDS when feeding low CP diets
can potentially enhance the efficiency of microbial N production, which, in turn, can lead to
greater animal productivity.
Page 101
85
5 EFFECTS OF DIETARY CRUDE PROTEIN AND RUMINALLY-DEGRADABLE
PROTEIN LEVELS ON UREA RECYCLING, MICROBIAL PROTEIN
PRODUCTION, NITROGEN BALANCE, OMASAL NUTRIENT FLOW, AND
MILK PRODUCTION IN LACTATING HOLSTEIN DAIRY COWS
5.1 Abstract
The objective was to determine the effects of dietary crude protein (CP; 14.9 vs. 17.5%)
and ruminally-degradable protein (RDP; 63 vs. 69% of CP) content on urea recycling, nitrogen
(N) balance, microbial protein production, omasal nutrient flow, and milk production in lactating
Holstein cows. Eight multiparous, lactating Holstein cows (4 with ruminal cannulas) were used
in a replicated 4 × 4 Latin square design with a 2 × 2 factorial arrangement of dietary treatments
and 30-d experimental periods. Diet adaptation (d 0-14) was followed by 15 d (d 15-29) of
sample and data collection. Jugular infusions of [15
N15
N]-urea (220 mg d-1
; 98+ atom percent)
were conducted for 4 d (d 26-30) to estimate urea kinetics, with total collection of faeces and
urine. Proportions of [15
N15
N]- and [14
N15
N]-urea in urinary urea, and 15
N enrichment in faeces
were used to calculate urea kinetics. Nitrogen intake (P < 0.01), and both urinary N (P < 0.01)
and urea-N (P < 0.01) output were greater for cows fed the high compared with those fed the low
CP diet. Ruminal ammonia-N concentration tended to be greater in cows fed the high than the
low CP diet (20.3 vs. 17.4 mg dL-1
; P = 0.06), and was greater in cows fed the high RDP as
compared with those fed the low RDP diet (21.5 vs. 16.2 mg dL-1
; P < 0.01). However, N
balance, milk yield, and microbial N supply were unaffected (P > 0.05) by dietary treatment.
Urea-N entry rate (UER) increased (P < 0.01) with dietary CP level, but was unaffected (P >
0.05) by dietary RDP level. The proportion of urea-N recycled to the GIT (as a percent of UER)
Page 102
86
was greater (P = 0.02) in cows fed the low CP compared with those fed the high CP diet. In the
short-term, lowering dietary CP level reduced urinary N excretion and had no significant effect
on either microbial N supply or milk yield. This resulted in an overall improvement in milk N
efficiency.
5.2 Introduction
Current feeding practices often result in lactating dairy cows being fed relatively high
crude protein (CP) diets (17.5 to 19.0% CP) in order to support high levels of milk production
(NRC 2001). However, overfeeding protein to lactating dairy cows can cause both environmental
(Cowling and Galloway 2002; Hristov et al. 2011) and production management (Chandler 1996;
Butler 1998; Guo et al. 2004) issues for producers and society. Excess dietary CP is hydrolyzed
to ammonia (NH3) in the rumen, which ultimately is converted to urea in the liver (Lobley et al.
1995) and is subsequently excreted into the environment via the urine (Lapierre and Lobley
2001). Urea is then rapidly hydrolyzed to NH3 (Van Horn et al. 1996) leading to concerns
associated with leaching of nitrates into ground water (Pakrou and Dillon 1995) as well as
contributing to air pollution (Hristov et al. 2011). Per unit of feed, protein is a relatively costly
nutrient (Chase, et al. 2009). Therefore, the overfeeding of protein and subsequent excretion of
excess N represents an inefficient utilization of dietary N (Lobley 1993; Tamminga 1996;
Dewhurst et al. 2000) and can increase feed costs (Chandler 1996; Godden et al. 2001; Broderick
2003). Milk urea nitrogen (MUN) is an indicator of the animal’s protein status and metabolism
(Roseler et al. 1993), and as dietary CP intake increases so does MUN concentration (Canfield et
al. 1990). There is evidence that MUN concentrations above 19 mg dL-1
lead to a decrease in
reproductive function (Butler et al. 1996; Larson et al. 1997) in lactating dairy cows. It is
Page 103
87
therefore important to reduce dietary CP levels whilst still maintaining an optimal level of animal
production.
Ruminal microorganisms require a balance of fermentable carbohydrate and protein for
efficient growth (Nocek and Russell 1988; Hoover and Stokes 1991). Dietary protein is
comprised of both ruminally-degradable protein (RDP) and ruminally-undegradable protein
(RUP). The RDP portion is broken down into peptides, amino acids and NH3 which, if sufficient
energy is available, are utilized as precursors for microbial protein synthesis (Leng and Nolan
1984; Oldham 1984). Therefore, it is necessary to feed sufficient amounts of RDP to support
microbial growth. However, on low CP diets, where RDP supply is insufficient there is
opportunity to promote the recycling of urea-N to the gastro-intestinal tract (GIT; Stewart and
Smith 2005) and allow incorporation of the N into microbial protein (Lapierre and Lobley 2001).
Reducing dietary RDP level has been shown to increase urea recycling to the GIT (Rémond et al.
2009) due to a decrease in ruminal NH3-N concentration (Kennedy and Milligan 1980). Several
studies have investigated the effect of dietary RDP level on urea recycling (Ferrell et al. 2001;
Archibeque et al. 2002; Wickersham et al. 2008a, 2009). Increasing RDP intake in steers fed a
low quality forage diet lead to an increase in both total endogenous urea-N production and the
transfer of urea-N to the rumen (Wickersham et al. 2008a). However, it is unclear how
concomitant changes in dietary CP and RDP levels affect urea recycling and microbial protein
production in dairy cows fed at higher levels of N intake and with a greater requirement for
metabolizable protein.
Optimizing both the level and degradability of dietary CP in high producing dairy cow
diets may help lower the excretion of N into the environment, in turn reducing environmental
pollution. Through careful manipulation of dietary RDP level on low CP diets, it may be possible
Page 104
88
to increase urea-N recycling to the rumen and maintain both microbial protein and milk
production of lactating dairy cows typically seen with higher CP diets. The objective of this
study was to determine the effects of reduced dietary CP and RDP levels on urea-N recycling,
microbial protein production, N balance, omasal nutrient flow, and milk production in lactating
dairy cows.
5.3 Materials and Methods
Cows used in this study were cared for in accordance with the guidelines of the Canadian
Council of Animal Care (1993) and their use was approved by the University of Saskatchewan
Animal Care Committee.
5.3.1 Animals and Experimental Design
Eight multiparous, lactating Holstein cows (711 ± 21 kg of BW; 91 ± 17 days in milk at
the start of the study), were used in a replicated 4 × 4 Latin square design with a 2 × 2 factorial
arrangement of dietary treatments. All cows were housed in individual tie-stalls at the Greenbrae
Dairy Research Facility (University of Saskatchewan, Saskatoon, SK, Canada). Four cows were
surgically fitted with permanent ruminal cannulas (Bar Diamond, Parma, ID) and used in a
metabolism study to determine dietary effects on urea-N recycling, microbial protein production,
ruminal fermentation characteristics, N balance, and omasal nutrient flow. Each period consisted
of 14 d of dietary adaptation (d 0-14) and 15 d of sample and data collection (d 15-29).
Page 105
89
5.3.2 Experimental Treatments and Feeding Management
Experimental diets were composed of a 50:50 forage to concentrate ratio (on a DM basis)
and fed to cows as a total mixed ration (TMR) at ad libitum intake twice daily at 0900 and 1700.
Diets were formulated to contain two levels of CP (14.9 vs. 17.5%, on DM basis) and two levels
of RDP (63 vs. 69% of CP). The forage portion of the diet consisted of barley silage and chopped
alfalfa hay. Dietary RDP was manipulated by feeding regular canola meal or heated canola meal.
All canola meal was purchased from one source (Cargill Ltd, Clavet, SK, Canada). To
manipulate ruminally-degradable protein content, a portion of this canola meal was micronized
at 160-165oC and held at this temperature for 20 minutes in an insulated container (InfraReady
Products Ltd, Saskatoon, SK, Canada). Chemical composition of dietary ingredients is presented
in Table 5.1 and ingredients and chemical composition of diets are presented in Table 5.2.
5.3.3 Sample Collection
During each experimental period, individual feed intake and orts remaining were
recorded. Samples of TMR were collected on three consecutive days (d 27-29). On d 25,
cannulated cows were fitted with temporary vinyl catheters (0.86 mm i.d. × 1.32 mm o.d.;
Scientific Commodities Inc., Lake Havasu City, AZ) in both the right and left jugular veins to
enable isotope infusion. Both urea-N transfer to the GIT (d 26-30; Lobley et al. 2000) and total-
tract N balance (d 26-30) were determined. Samples of urine and faeces were collected on d 26
(prior to the start of [15
N15
N]-urea infusions) to measure natural background levels of 15
N
abundance. Starting at 0800 on d 26 of each experimental period, double-labeled urea ([15
N15
N]-
urea, 98+ atom percent excess; Cambridge Isotope Laboratories, MA, USA) dissolved in 2 L of
sterile saline solution was continuously infused into the jugular vein at a rate of 220 mg d-1
of
Page 106
90
[15
N15
N]-urea using a peristaltic pump (Watson and Marlow, Cornwall, UK. Model: 205U) for
96 h. Total faecal and urine output were collected daily for 4 d (d 27-30 of each experimental
period). Total daily faecal output for each cow was mixed thoroughly, quantitatively transferred
into a plastic container and weighed. A 5% aliquot was taken daily for each cow, composited
within period and stored at -20°C. A daily faecal sub-sample was collected to measure 15
N. On d
25, indwelling Bardex Foley bladder catheters (26 Fr, 75 cc ribbed balloon, lubricious-coated; C.
R. Bard Inc., Covington, GA) were inserted. Urine was collected into a 20 L polyethylene
Carboy containing 200 mL of concentrated HCl (VWR Scientific, Mississauga, ON) to maintain
urine at a pH < 3. Total daily urine output for each cow was weighed, mixed thoroughly and a
5% aliquot collected. Samples were composited by heifer in each period and stored at -20oC. An
additional 50-mL subsample of urine was collected from the composited daily output daily. A 2-
mL subsample of urine was collected daily (d 27-30) diluted with 8 mL of distilled water and
stored at -20oC.
Omasal digesta flow was determined using, indigestible NDF (iNDF; Reynal et al. 2005),
YbCl3 (Siddons et al. 1985), and Cr-EDTA (Udén et al. 1980) as digesta markers for the large
particle (LP), small particle (SP), and fluid (FP) phases, respectively. The YbCl3 marker was
prepared by dissolving 4.88 g of YbCl3·6H2O (2.2 g of Yb; Cambridge Isotope Laboratories,
Andover, MA) in 1 L of deionised water daily, for each cow. The Cr-EDTA marker solution was
infused into the rumen at a rate of 2.7 g d-1
of Cr-EDTA. Markers were continually infused into
the rumen via the ruminal cannula for 8 d (d 15-23) using a peristaltic pump (Watson and
Marlow, Cornwall, UK. Model: 205U). Prior to the start of infusions (d 15), a priming dose
equal to one-half of the daily dose of the markers was administered.
Page 107
91
Ruminal and omasal samples were collected every 6 h for 48 h (0900, 1500, and 2100 on
d 21, 0300, 1200, 1800, and 2400 on d 22 and 0600 on d 23) to represent a 24 h feeding period.
Ruminal contents (1 L; 250 mL from the cranial ventral, caudal ventral, central, and cranial
dorsal regions) were collected, mixed thoroughly and strained through 4 layers of cheesecloth.
Ruminal fluid pH was immediately determined on the filtrate, using a Model 265A portal pH
meter (Orion Research Inc., Beverly, MA). A 5 mL aliquot of ruminal fluid was preserved with 1
mL of meta-phosphoric acid (25% wt vol-1
), and a second 5 mL aliquot was preserved with 1 mL
of 1% sulfuric acid and stored at -20oC. A third 15 mL aliquot was not acidified and was stored
at -20oC. Omasal digesta was collected following the procedure of Huhtanen et al. (1997). A 300
mL sample was collected at each sampling time to yield 2.4 L of omasal digesta that was
composited by cow within each period and stored at -20oC.
Cows were milked three times a day (0430, 1230, and 1900) and milk weights recorded
daily. Milk samples were collected on 3 consecutive days (d 27-29), composited by cow for each
day within each period and stored at 4oC.
5.3.4 Sample Analyses
Chemical analysis of dietary ingredients was performed prior to diet formulation,
including DM by oven drying at 135°C for 2 h (AOAC 1990; ID no. 930.15), CP using the
macro-Kjeldahl procedure (AOAC 1990; ID no. 984.13), soluble CP (Roe et al. 1990), ADF
(AOAC 1990; ID no. 973.18), NDF (Van Soest et al. 1991), and ADIN and NDIN (Licitra et al.
1996).
The composited omasal digesta samples were thawed at room temperature and separated
by straining through cheesecloth and centrifugation into three phases i.e., LP, SP and FP (Brito et
Page 108
92
al. 2006), then freeze-dried (Virtus ‘72, Gardner, New York) and ground in a Braun Aromatic
coffee grinder (KSM 2, 2.5 oz). Concentrations of Cr and Yb were determined on a 1 g sample
from each of the three phases. Samples were combusted in a muffle furnace at 550oC for 8 h
followed by nitric acid digestion as described by Vicente at al. (2004). Chromium concentration
was measured by atomic absorption spectrophotometry (Perkin Elmer 2300, Perkin-Elmer Corp,
Norwalk, CT) and Yb concentration was measured by atomic emission spectroscopy (Varian
Spectra 220, Varian, Mulgrave, Australia). Indigestible NDF was determined on experimental
diets and on composited omasal LP and SP phases by ruminal incubation of samples in 5 × 10
cm nylon mesh bags (6 μm pore size; part no. 03-6/5, Sefar America Inc., Depew, NY) for 288 h
followed by analysis for NDF (Huhtanen et al. 1994). The concentrations of Cr, Yb, and iNDF in
the LP and SP phases, and Cr and Yb concentrations in the FP phase were used to reconstitute
the omsasl true digesta (OTD) according to the triple marker method as described by France and
Siddons (1986).
Faecal, TMR and ort samples were dried at 55°C for 96 h (Despatch Oven Co., Model V-
31) then ground through a 1 mm screen using a Christy-Norris mill (Christy and Norris Ltd.,
Chelmsford, England). Total fecal output samples were composited by cow for each period.
Total faecal output, OTD, TMR and ort samples were then analyzed for DM by oven drying at
135°C for 2 h (AOAC 1990; ID no. 930.15), OM by ashing at 600oC for at least 8 h (AOAC
1990; ID no. 942.05), CP using the macro-Kjeldahl procedure (AOAC 1990; ID no. 984.13),
ether extract (AOAC 1990; ID no. 920.39), ADF (AOAC 1990; ID no. 973.18), and NDF (Van
Soest et al. 1991). Amylase and sodium sulfite were used for NDF determination. Total mixed
ration samples were also analyzed for ADIN and NDIN (Licitra et al. 1996).
Page 109
93
Daily faecal sub-samples were finely ground using a ball mill and prepared for 15
N
analysis as described by Brito et al. (2006). Briefly, ruminal bacterial, duodenal, and faecal
samples containing approximately 100 µg of N were weighed into 5 × 9 mm tin capsules
(Elemental Microanalysis Limited, Okehampton, UK). To volatilize NH3-N, 50 µL of 72 mM
K2CO3 was then added to each tin capsule followed by incubation in a forced-air oven at 60°C
for 24 h. Enrichment of 15
N in faecal sub-samples was then measured by combustion to N2 gas in
an elemental analyzer and continuous flow isotope ratio-mass spectrometry (Lobley et al. 2000).
Urinary urea-N was determined using the diacetyl monoxime method (Procedure No. 0580,
Stanbio Laboratory, Boerne, TX) on background and composited 50 mL subsamples of urine (d
26-30) prior to processing for determination of proportions of [15
N15
N]-urea, [14
N15
N]-urea, and
[14
N14
N]-urea. Urinary urea was then isolated by applying urine containing 1.5 mg of urea-N to
a prepacked cation exchange resin column (AG-50W- × 8 Resin, 100-200 mesh, H+ form;
BioRad Laboratories, Hercules, CA) as described by Archibeque et al. (2001). Samples were
then eluted with N-free water, air-dried and transferred to borosilicate glass tubes for freeze-
drying and then analyzed for the proportions of [15
N15
N]-urea, [14
N15
N]-urea and [14
N14
N]-urea
in urinary urea by isotope ratio-mass spectrometry (IRMS: 15
N Analysis Laboratory, University
of Illinois at Urbana-Champaign). The results were corrected for [14
N15
N]-urea produced by non-
molecular reactions (Lobley at al. 2000), and this correction was typically 4 to 6%. Total N in
samples of composited daily urine output was determined using the macro-Kjeldahl procedure
(AOAC 1990; ID no. 976.05). Diluted daily urine samples were composited by cow for each
period (proportional to daily urine output) and analyzed for urinary urea-N (d 26-30) using the
colorimetric diacetyl monoxime method (Procedure No. 0580, Stanbio Laboratory, Boerne, TX),
and for uric acid (Fossati et al. 1980) and allantoin (Chen and Gomes 1992) (d 26-30). The
Page 110
94
urinary excretion of purine derivatives (i.e., uric acid and allantoin) was then used to estimate
microbial nonammonia-N (NAN) production (Chen and Gomes 1992).
Ruminal fluid samples preserved with meta-phosphoric acid were analyzed for volatile
fatty acid (VFA) concentration (Erwin et al. 1961) using an Agilent 6890 Series Gas
Chromatography system (Wilmington, DE) including an Agilent 683 Series injector (5 μL) fitted
with a Zebron ZB-FFAP High Performance GC Capillary Column (30.0 m × 320 μm × 0.25 μm,
Phenomenex, Torrance, CA). Ruminal fluid samples preserved with sulfuric acid were analyzed
for NH3-N using a phenol-hypochlorite assay (Broderick and Kang 1980). Osmolality was
measured on non-acidified ruminal fluid samples using a VaproTM
Vapor Pressure Osmomemter
(Model 5520; Wescor Inc., Logan, Utah).
Milk samples were submitted to the Central Milk Testing Lab (Edmonton, AB, Canada)
for analysis of protein, fat, lactose, and milk urea nitrogen (MUN) using an infrared analyzer
(Milko ScanTM
FT 6000, Foss Electric, Denmark) (AOAC 1996; ID no. 972.16).
5.3.5 Calculations and Statistical Analysis
Nitrogen retention was calculated as intake N – faecal N – urinary N – milk N. Apparent
digestion of nutrients in the rumen was calculated as nutrient intake – omasal flow of nutrient (kg
d-1
). Urea-N kinetics was calculated according to the model of Lobley et al. (2000), using urinary
enrichment of [15
N15
N]-urea and [14
N15
N]-urea, and total 15
N excretion in faeces.
Ruminal fermentation characteristics (pH, NH3-N, osmolality and VFA concentration)
were analyzed using the Proc Mixed repeated measures procedure of SAS (Version 9.1; SAS
Institute, Inc. Cary, N. C., 2004). All other data were analyzed as replicated 4 × 4 Latin square
design with a factorial arrangement of dietary treatments using the Proc Mixed procedure of SAS
Page 111
95
(Version 9.1; SAS Institute, Inc. Cary, N. C. 2004). The following model was used: Yijkl = μ + Ci
+ Pj + CPk + RDPl + (CP × RDP)kl+ εijkl, where Yijk = dependent variable, μ = overall mean, Ci =
random effect of cow i, Pj = fixed effect of period j, CPk = fixed effect of dietary CP k, RDPl =
fixed effect of dietary RDP l, (CP × RDP)kl = fixed effect of the interaction between CPk and
RDPl, and εijkl = random residual error. When significant treatment effects were found, means
were compared using the LSD test. Treatment differences were considered significant when P ≤
0.05 and tendencies were discussed when 0.05 < P ≤ 0.10.
5.4 Results
5.4.1 Dietary Characteristics
Chemical composition of dietary ingredients is presented in Table 5.1. Soluble crude
protein content was lower for heated canola meal as compared with the regular canola meal (16.3
vs. 29.7% of CP) and heated canola meal had a higher ADIN content than the regular canola
meal (1.53 vs. 0.73% of N). Dietary ingredients and chemical composition are presented in Table
5.2. Chemical analysis of TMR indicated that CP levels were 14.9 and 17.5% CP (on DM basis).
5.4.2 Ruminal Fermentation Characteristics
Daily average ruminal pH was unaffected (P > 0.05) by dietary treatment (Table 5.3).
Ruminal NH3-N concentration tended (P = 0.06) to be greater in cows fed the high compared
with the low CP diet (20.3 and 17.4 mg dL-1
, respectively), and was greater (P <0.01) in cows
fed the high compared with the low RDP diet (21.5 and 16.2 mg dL-1
). Ruminal osmolality was
unaffected (P > 0.05) by dietary treatment. Individual VFA concentrations, total VFA
concentration, and acetate:propionate ratio were unaffected (P > 0.05) by dietary treatment,
Page 112
96
Table 5.1 Chemical composition of dietary ingredients
DMz
CPy
SCPx
ADFw
NDFv
ADINu
NDINt
Barley silage 35.9 11.2 69.2 29.2 52.2 0.47 1.07
Alfalfa hay 92.8 14.1 39.5 35.7 51.0 1.17 2.18
Canola meal 88.1 41.0 29.7 21.7 31.6 0.73 1.95
Heated canola meals
97.7 41.0 16.3 24.0 41.0 1.53 5.21
Barley grain 88.8 10.34 28.3 6.4 25.0 0.29 1.76 zDM = dry matter, %
yCP = crude protein, % DM
xSCP = soluble crude protein, % of CP
wADF = acid detergent fiber, % DM
vNDF = neutral detergent fiber, % DM
uADIN = acid detergent insoluble nitrogen (N), % N
tNDIN = neutral detergent insoluble nitrogen, % N
sHeated canola meal = canola meal micronized at 160-165
oC and held at this temperature for 20
minutes
Page 113
97
Table 5.2 Ingredient and chemical composition of diets fed to lactating Holstein dairy cows
Low CPz
High CPz
Item
Low
RDPy
High
RDPy
Low
RDPy
High
RDPy
Total mixed diet, % DM basis
Barley Silage 34.6 34.6 34.4 34.4
Alfalfa Hay 14.6 14.6 14.5 14.5
Barley Grain 38.3 38.3 30.8 30.8
Canola meal 0.0 10.2 0.0 18.1
Heated Canola Meal 10.2 0.0 18.1 0.0
U of S Premixx 1.6 1.6 1.5 1.5
MagSulf7H2Ow 0.1 0.1 0.1 0.1
Limestonev 0.4 0.4 0.4 0.4
Sodium Bicarbonateu 0.3 0.3 0.3 0.3
Chemical composition of total mixed diet
Dry matter (DM), % 46.3 46.5 45.4 46.8
Organic matter, % of DM 92.0 92.0 91.2 91.5
Crude protein (CP), % of DM 14.9 14.9 17.5 17.5
RDP, % of CP 65.1 69.8 61.0 68.0
Crude fat, % DM 2.6 2.5 2.8 2.6
Acid detergent fiber, % DM 22.9 21.8 25.3 24.2
Neutral detergent fiber, % DM 36.3 35.6 38.6 37.0
Neutral detergent insoluble nitrogen (N), % of total N 2.3 1.4 2.9 1.4
Acid detergent insoluble nitrogen, % of total N 1.8 1.1 2.6 1.6
NELt, Mcal/kg of DM 1.48 1.45 1.50 1.49
zCP = Crude protein at 14.9 and 17.5% for the low and high CP treatment, respectively
yRDP = Ruminally degradable protein at 63 and 69% of CP for the low and high RDP
treatments, respectively as calculated from CPM-Dairy xU of S Premix: 16.0 %DM Ca, 8.0 %DM P, 4.5 %DM Mg, 1.8 %DM K, 1.0 %DM S, 6.3 %DM
Na, 10.0 %DM Cl, 2100.0 mg/kg Fe, 2160.0 mg/kg Zn, 675.0 mg/kg Cu, 1120.0 mg/kg Mn, 17.0
mg/kg Se, 16.0 mg/kg Co, 40.0 mg/kg I, 240.0 KIU/kg Vitamin A, 50.0 KIU/kg Vitamin D and
1500.0 IU/kg Vitamin E wMagSulf7H2O: 9.85 %DM Mg and 13.0 %DM S
vLimesonte: 33.0 %DM Ca, 0.02 %DM P, 2.1 %DM Mg, 0.12 %DM K, 0.04 %DM S, 0.06
%DM Na, 0.03 %DM Cl and 3500.0 mg/kg Fe uSodium Bicarbonate: 27.0 %DM Na
tNet energy of lactation, calculated from CPM-Dairy
Page 114
98
Table 5.3 The effects of dietary crude protein (CP) and ruminally-degradable protein (RDP) levels on
ruminal fermentation characteristics in lactating Holstein dairy cows
Low CPz
High CPz
P values
Item
Low
RDPy
High
RDPy
Low
RDPy
High
RDPy
SEMx
CP
RDP
CP × RDP
Ruminal pH 5.90 5.93 5.91 5.99 0.049 0.44 0.26 0.58
Ammonia-N, mg dL-1
14.5 20.2 17.8 22.8 1.45 0.06 <0.01 0.81
Osmolality, mOsmol L-1
231.9 218.3 226.9 233.0 11.95 0.69 0.76 0.43
Volatile fatty acids, mM
Acetate (A) 48.0 48.2 49.4 48.8 1.54 0.15 0.83 0.58
Propionate (P) 23.4 20.7 21.4 21.7 2.45 0.85 0.63 0.56
Butyrate 9.0 9.9 10.1 9.5 0.95 0.69 0.91 0.44
Valerate 1.5 1.2 1.2 1.4 0.26 0.88 0.81 0.44
Isobutyrate 0.59 0.63 0.59 0.64 0.046 0.78 0.04 0.86
Isovalerate 0.68 0.80 0.73 0.78 0.074 0.67 0.03 0.39
Total VFA 83.1 81.4 83.5 82.8 1.52 0.54 0.43 0.73
A:P ratio 2.25 2.42 2.42 2.47 0.262 0.48 0.47 0.68 zCP = 14.9 and 17.5% for the low and high CP treatments, respectively
yRDP = 63 and 69% of CP for the low and high RDP treatments, respectively as calculated from CPM-Dairy
xSEM = Pooled standard error of the mean
Page 115
99
except that isobutyrate and isovalerate concentrations were greater (P < 0.05) in cows fed the
high as compared with the low RDP diet.
5.4.3 Nutrient Intake, Omasal Nutrient Flow, and Ruminal and Total-Tract
Nutrient Digestibility
A CP × RDP interaction was detected for DM and OM apparently digested in the rumen
expressed as kg d-1
or as a percent of nutrient intake (Table 5.4). On the low CP diet, both DM (P
≤ 0.02) and OM (P ≤ 0.03) digested in the rumen were greater on the high as compared with the
low RDP diet, but no difference due to dietary RDP was observed on the high CP diet. Total-
tract OM digestibility was unaffected (P > 0.05) by dietary treatment. Organic matter flow at the
omasum was greater (P < 0.05) for cows fed the high as compared with the low CP diet but was
unaffected (P > 0.05) by dietary RDP level. An interaction was detected for NDF (P = 0.02)
intake. For the low CP diet, NDF intake was greater (P = 0.02) on the high as compared with the
low RDP diet. The opposite was observed on the high CP diet. A similar trend (P = 0.07) was
observed for ADF intake. Both NDF and ADF flow at the omasum were greater (P < 0.01) on
the high as compared with the low CP diet. Both NDF and ADF apparently digested in the rumen
(kg d-1
or as a percent of nutrient intake), and total-tract digestibility were greater (P < 0.05) for
the low as compared with the high CP diet.
5.4.4 Nitrogen Balance
Nitrogen intake (P < 0.01), and both urinary N (P < 0.01) and urea-N (P < 0.01) output
were lower in cows fed the low CP diets as compared with those fed the high CP diet (Table
5.5). On the high CP diet, faecal N output was greater on the low as compared with the high RDP
Page 116
100
Table 5.4 The effects of dietary crude protein (CP) and ruminally-degradable protein (RDP) levels on intake,
flow at the omasum, ruminal digestibility, and total-tract digestibility in lactating Holstein dairy cows
Low CPz
High CPz
P values
Item
Low
RDPy
High
RDPy
Low
RDPy
High
RDPy
SEMx
CP
RDP
CP × RDP
Dry matter (DM)
Intake, kg d-1
25.5b 27.0
ab 27.0
a 25.2
b 0.80 0.83 0.77 0.03
Flow at the omasum, kg d-1
15.0 13.8 15.1 15.5 0.91 0.13 0.40 0.16
Digested in the rumen
kg d-1
10.4b
13.0a
11.8ab
10.0b
0.72 0.23 0.53 0.01
% of DM intake 41.1b 48.5
a 44.0
ab 38.8
b 2.69 0.14 0.59 0.02
Total-tract digestibility, % 69.5 67.9 68.2 67.7 1.24 0.52 0.40 0.66
Organic matter (OM)
Intake, kg d-1
23.2 24.7 24.8 23.3 0.67 0.85 0.99 0.05
Flow at the omasum, kg d-1
11.5 10.9 12.0 12.2 0.65 0.03 0.52 0.28
Digested in the rumen
kg d-1
11.9b
13.7a
12.7ab
11.2b
0.59 0.16 0.76 0.02
% of OM intake 50.9ab
55.6a 51.7
ab 47.6
b 2.08 0.05 0.83 0.03
Total-tract digestibility, % 71.6 70.1 70.4 70.1 1.17 0.61 0.45 0.61
Neutral detergent fiber (NDF)
Intake, kg d-1
9.4ab
10.1a
9.8ab
9.2b
0.40 0.34 0.88 0.02
Flow at the omasum, kg d-1
3.3 3.3 4.3 3.9 0.26 <0.01 0.31 0.23
Digested in the rumen
kg d-1
6.1 6.7 5.6 5.3 0.47 0.03 0.51 0.23
% of NDF intake 64.9 67.4 56.3 58.0 3.01 0.01 0.42 0.88
Total-tract digestibility, % 68.9 68.3 66.1 64.8 1.18 <0.01 0.30 0.74
Acid detergent fiber (ADF)
Intake, kg d-1
6.1
6.3
6.2
5.9
0.34 0.23 0.63 0.07
Flow at the omasum, kg d-1
1.6 1.7 2.2 2.1 0.13 <0.01 0.87 0.13
Digested in the rumen
kg d-1
4.5 4.6 4.1 3.9 0.33 0.01 0.83 0.31
Page 117
101
% of ADF intake 72.7 72.8 65.3 65.3 2.36 <0.01 0.96 0.97
Total-tract digestibility, % 22.4 18.4 15.1 14.3 3.86 0.02 0.25 0.42 z
CP = 14.9 and 17.5% for the low and high CP treatments, respectively y
RDP = 63 and 69% of CP for the low and high RDP treatments, respectively as calculated from CPM-Dairy x
SEM = Pooled standard error of the mean
a,b
= Means within a row with different superscripts differ (P < 0.05)
Page 118
102
Table 5.5 The effects of dietary crude protein (CP) and ruminally-degradable protein (RDP) levels on nitrogen
(N) balance, and digestibility in lactating Holstein dairy cows
Low CPz
High CPz
P values
Item
Low
RDPy
High
RDPy
Low
RDPy
High
RDPy
SEMx
CP
RDP
CP × RDP
N intake, g d-1
608.4 643.3 752.7 718.7 24.56 <0.01 0.98 0.13
Faecal output, kg DM d-1
7.7b 8.6
a 8.6
a 8.1
ab 0.24 0.54 0.38 0.01
Faecal N, g d-1
168.2b 189.4
b 215.5
a 180.7
b 11.01 0.03 0.37 <0.01
Urine output, kg d-1
21.3 22.6 23.3 24.6 1.43 0.06 0.19 0.93
Urinary N, g d-1
152.8 169.7 248.5 263.9 16.20 <0.01 0.37 0.97
UUN:urine-N ratio 0.90 0.93 0.78 0.74 0.151 0.39 0.97 0.85
Milk N, g d-1
171.1 173.7 176.9 180.6 7.16 0.24 0.54 0.92
N retention, g d-1
112.0 106.4 126.7 87.1 22.95 0.93 0.38 0.50
Milk N efficiency, % of intake 27.7 27.7 23.6 24.7 1.08 <0.01 0.57 0.53
N digestibility, % 72.3 70.4 71.3 74.4 1.89 0.39 0.74 0.17 z
CP = 14.9 and 17.5% for the low and high CP treatments, respectively y
RDP = 63 and 69% of CP for the low and high RDP treatments, respectively as calculated from CPM-Dairy x
SEM = Pooled standard error of the mean
Page 119
103
diet, but no difference was observed on the low CP diet (interaction, P < 0.01). Milk N output, N
retention, and N digestibility were not affected (P > 0.05) by dietary treatment. Milk N efficiency
was greater (P < 0.01) for cows on the low as compared with those on the high CP diet, but was
unaffected (P > 0.05) by dietary RDP level.
5.4.5 Microbial Protein Production
Microbial N supply averaged 386.5 g microbial N d-1
and did not differ (P > 0.05)
amongst dietary treatments (Table 5.6).
5.4.6 Milk Production and Composition
Milk yield and yields of protein and lactose were unaffected (P > 0.05) by dietary
treatment (Table 5.7). On the low CP diet, milk fat yield was greater for cows fed the low as
compared with those fed the high RDP diet but was unaffected by RDP level on the high CP diet
(interaction, P = 0.05). Milk urea nitrogen (MUN) was greater (P < 0.01) on the high as
compared with the low CP diet (17.8 and 12.7 mg dL-1
, respectively). On the high CP diet, MUN
was greater for cows fed the high as compared with those fed the low RDP diet, but no
difference was observed between RDP levels fed the low CP diet (interaction, P < 0.01). Milk
fat, protein and lactose contents were unaffected (P > 0.05) by diet.
Page 120
104
Table 5.6 The effects of dietary crude protein (CP) and ruminally-degradable protein (RDP) levels on
microbial nitrogen (N) flow at the omasum measured by urinary excretion of purine derivatives (PD) in
lactating Holstein dairy cows
Low CPz
High CPz
P values
Item
Low
RDPy
High
RDPy
Low
RDPy
High
RDPy
SEMx
CP
RDP
CP × RDP
Urinary excretion
Total output, kg d-1
21.3 22.6 23.3 24.6 1.43 0.06 0.19 0.93
Allantoin, mmol d-1
452.4 519.7 490.9 495.5 16.65 0.71 0.10 0.14
Uric acid, mmol d-1
47.7 54.6 58.1 51.7 5.87 0.45 0.95 0.20
Milk PDw, mmol d
-1 32.9 33.6 33.6 33.6 2.70 0.57 0.49 0.52
Total PD, mmol d-1
532.9 607.9 582.6 580.8 19.94 0.63 0.15 0.14
Microbial Nv supply
-1
g microbial N d-1
355.2 409.4 391.3 390.0 14.44 0.63 0.16 0.14
g microbial N kg-1
DOMRu 36.6 40.3 38.4 42.1 2.35 0.45 0.15 0.98
zCP = 14.9 and 17.5% for the low and high CP treatments, respectively
yRDP = 63 and 69% of CP for the low and high RDP treatments, respectively as calculated from CPM-Dairy
xSEM = Pooled standard error of the mean
wEstimated as 1 mmol L
-1 milk (i.e. 1 × milk yield (L d
-1)) from Chen and Gomes (1992)
vMicrobial N supply was calculated according to Chen and Gomes (1992)
uDigestible organic matter in the rumen (DOMR) was calculated as 0.65 x digestible OM intake (Chen and Gomes
1992)
Page 121
105
Table 5.7 The effects of dietary crude protein (CP) and ruminally-degradable protein (RDP) levels on milk
production and composition in lactating Holstein dairy cows
Low CPz
High CPz
P values
Item
Low
RDPy
High
RDPy
Low
RDPy
High
RDPy
SEMx
CP
RDP
CP × RDP
Milk and component yield
Milk, kg d-1
38.3 38.5 39.0 39.4 1.22 0.26 0.68 0.89
3.5% FCMw, kg d
-1 39.3 38.4 39.4 39.4 0.71 0.15 0.25 0.18
Fat, kg d-1
1.43a
1.30b
1.40a
1.38a
0.037 0.27 0.01 0.05
Protein, kg d-1
1.25 1.30 1.25 1.30 0.046 0.54 0.54 0.54
Lactose, kg d-1
1.73 1.75 1.78 1.80 0.064 0.21 0.51 1.00
MUNv, mg dL
-1 12.3
c 13.0
c 16.0
b 19.5
a 0.93 <0.01 <0.01 <0.01
Milk components
Fat, % 3.68 3.53 3.60 3.50 0.158 0.66 0.29 0.82
Protein, % 3.30 3.25 3.28 3.28 0.118 1.00 0.70 0.70
Lactose, % 4.56 4.55 4.50 4.52 0.072 0.20 0.75 0.72 zCP = 14.9 and 17.5% for the low and high CP treatments, respectively
yRDP = 63 and 69% of CP for the low and high RDP treatments, respectively as calculated from CPM-Dairy
xSEM = Pooled standard error of the mean
wFCM = Fat corrected milk
vMUN = Milk urea nitrogen
a,b = Means within a row with different superscripts differ (P < 0.05)
Page 122
106
5.4.7 Urea-N Kinetics
Urea- N entry rate (UER) increased (P < 0.01) with dietary CP level, but was unaffected
(P > 0.05) by RDP level (Table 5.8). Urea-N utilized for anabolism (UUA) tended (P = 0.07) to
decrease as dietary CP level increased, but was unaffected by dietary RDP level. Urinary urea-N
excretion (UUE) increased (P < 0.01) as dietary CP level increased, but was unaffected by
dietary RDP level. Gastro-intestinal entry rate (GER) and urea-N loss to faeces (UFE) were
unaffected (P > 0.05) by dietary treatment. The proportion of urea-N utilized for anabolic
purposes (as a percent of urea-N returned to the GIT; GER to UUA) tended (P = 0.06) to be
greater in cows fed the low when compared with those fed the high CP diet. Consequently, the
proportion of urea-N returned to the ornithing cycle (ROC) was lower (P = 0.05) in cows fed the
low as compared with those fed a high CP level. Fractional transfers of urea-N were unaffected
(P > 0.05) by dietary RDP level; however, the proportion of UER excreted in the urine increased
(P = 0.02) as dietary CP level increased. Conversely, the proportion of UER partitioned to the
GIT decreased (P = 0.02) as dietary CP level increased. The proportion of GER from ROC
increased (P = 0.03) as dietary CP level increased, but the proportion of GER voided in the
faeces was unaffected (P > 0.05) by dietary CP level.
Page 123
107
Table 8. The effects of dietary crude protein (CP) and ruminally-degradable protein (RDP)
levels on urea-nitrogen (N) recycling kinetics, as measured by continuous jugular infusions
of [15
N15
N]-urea in lactating Holstein dairy cows
Low CPz
High CPz
P values
Item
Low
RDPy
High
RDPy
Low
RDPy
High
RDPy
SEMx
CP
RDP
CP × RDP
Urea-N fluxes, g d-1
UERw
405.1 436.5 502.0 495.1 26.61 <0.01 0.54 0.35
GERv
279.0 292.9 309.3 287.2 23.30 0.50 0.82 0.34
UUAu
59.0 51.4 46.7 24.0 10.29 0.07 0.14 0.43
ROCt
213.3 230.4 251.0 252.1 16.39 0.05 0.47 0.52
UUEs
129.0 146.7 193.1 201.6 13.71 <0.01 0.38 0.76
UFEr
9.0 12.8 9.2 9.2 1.59 0.26 0.23 0.22
Fractional transfers
UER to urine 0.31 0.33 0.40 0.41 0.027 0.02 0.45 0.84
UER to GITq
0.69 0.67 0.60 0.56 0.027 0.02 0.45 0.84
GER to ROC 0.76 0.78 0.85 0.88 0.029 0.03 0.47 0.91
GER to faeces 0.03 0.05 0.03 0.03 0.008 0.27 0.16 0.12
GER to UUA 0.21 0.17 0.12 0.09 0.034 0.06 0.36 0.94 zCP = 14.9 and 17.5% for the low and high CP treatments, respectively
yRDP = 63 and 69% of CP for the low and high RDP treatments, respectively as calculated from
CPM-Dairy xSEM = Pooled standard error of the mean
wUER = Urea-N entry rate
vGER = Gastro-intestinal entry rate
uUUA = Urea-N utilized for anabolism
tROC = Return to ornithine cycle
sUUE = Urinary urea-N excretion
rUFE = Urea-N loss to faeces
qGIT = Gastro-intestinal tract
Page 124
108
5.5 Discussion
Dairy cows capture only 25 to 35% of their dietary CP intake as milk protein (Chase et al.
2009); therefore, large amounts of dietary N are excreted, potentially leading to environmental
pollution (Cowling and Galloway 2002) and a decrease in the efficiency of N utilization.
Reducing dietary N intake reduces overall N excretion into the environment (Archibeque et al.
2001) but has also been shown to reduce milk production (Kung and Huber 1983). Lowering
dietary RDP level reduces ruminal NH3 concentration which, in turn, increases urea-N transfer to
the rumen (Kennedy and Milligan 1980). The recycling of urea-N to the GIT is an opportunity to
improve the efficiency of N utilization and provide a source of N for microbial protein
production (Lapierre and Lobley 2001). Therefore, this study employed nutritional strategies to
investigate the influence of simultaneous changes in the dietary content and degradability of CP
on urea-N recycling, N balance, microbial protein production, and milk production in lactating
Holstein dairy cows.
Endogenous urea-N production in the present study averaged 459.7 g d-1
which is similar
to values (average 388.2 g d-1
) reported by Gozho et al. (2008) in dairy cows. Results show that
UER increased with increasing N intake which is in agreement with others studies (Archibeque
et al. 2001; Marini and Van Amburgh 2003; Marini et al. 2004). Endogenous urea-N production
is a consequence of ruminal microbial degradation of dietary protein to NH3 (Bach et al. 2005)
and the subsequent need for excess NH3 to be detoxified by the liver through conversion to urea
(Stewart and Smith 2005). Therefore, higher UER values on higher CP diets is expected. A
positive correlation between N intake and UER values has been reported by Huntington and
Archibeque (1999). The UER:digestible N intake ratios ranged from 0.92 to 0.96 and are similar
to those reported by Lapierre and Lobley (2001). The high ratios observed in the present study
Page 125
109
show that large amounts of N passed through the urea-N pool daily, indicating that urea-N
recycling is important in maintaining a positive N balance in dairy cows. The transfer of hepatic
urea-N output to the GIT (GER) was unaffected by dietary treatment; however, when the GER
was expressed as a proportion of UER the value was greater for the 14.9% CP diet as compared
with the 17.5% CP diet, and ranged from 0.56 to 0.69 which is within the range of previous
reports of 0.10 to 0.95 (Harmeyer and Martens 1980). The transfer of hepatic urea-N output to
the GIT can be influenced by several factors, including dietary protein level (Marini et al. 2004;
Wickersham et al. 2009), forage to concentrate ratio (Huntington et al. 1996), dry matter intake
(Sarraseca et al. 1998), and diet digestibility (Theurer et al. 2002). In particular, it has been
shown that an increase in ruminal NH3-N concentration can lead to a reduction in GER
(Kennedy and Milligan 1980). This could be due to the negative influence of high NH3-N
concentration on both the ruminal epithelium’s permeability to urea-N (Egan et al. 1986) and
ruminal urease activity (Cheng and Wallace 1979). However, more recently, in vitro studies by
Abdoun et al. (2006) demonstrated a pH-dependent effect of ammonia on urea flux. The greater
proportion of endogenous urea-N transferred to the GIT on the 14.9% CP diet can therefore be
explained by lower ruminal NH3-N concentration as compared with the 17.5% CP diet. Recycled
urea-N would therefore provide additional N that could potentially be used for microbial protein
production. The amount of GER used for anabolic purposes (UUA) tended to be greater for the
14.9% CP diet as compared with the 17.5% diet. Kiran and Mutsvangwa (2010) also noted an
increase in utilization of UUA from GER in lambs fed a 10% as compared with a 15% CP diet
(GER to UUA; 0.526 vs. 0.384). Lobley et al. (2000) reported that UUA is utilized for amination
and transamination reactions but that the major use of UUA is the sequestration of NH3-N into
microbial protein. The utilization of recycled urea-N for microbial protein production offers an
Page 126
110
opportunity to improve the efficiency of N utilization in ruminants. The tendency for an increase
in UUA, on the low (14.9%) CP diet, may have aided in the maintenance of microbial protein in
the present study.
Microbial protein supply averaged 386.5 g microbial N d-1
however microbial N supply
values reported in the literature are variable. Colmenero and Broderick (2006) fed diets ranging
from 13.5 to 19.4% CP (DM basis) to lactating Holstein cows and reported an average value of
455 g microbial N d-1
for microbial production. Cunningham et al. (1996) reported an average
value of 223 g microbial N d-1
for dairy cows fed dietary CP levels ranging from 16.5 to 18.5%.
These data demonstrate that microbial protein production can vary across different dietary
treatments and between studies but values from the present study fall within the reported range.
Microbial protein is an important source of amino acids for the ruminant, with an amino
acid profile closely matching that of both meat and milk (Ørskov 1992) and can contribute 60 to
80% of the metabolizable protein supply reaching the small intestine (NRC 2001). Dietary
protein is degraded in the rumen to peptides, amino acids and NH3-N which are important
precursors for microbial growth (Wallace 1997). It has been found that ruminal NH3-N
concentrations below 5 mg dL-1
could limit microbial protein production (Satter and Slyter 1974;
Russell and Strobel 1987). Ruminal NH3-N concentrations tended to decrease as dietary CP level
decreased from 17.5% to 14.9% CP (20.3 vs. 17.4 mg dL-1
) but were above the critical threshold
reported earlier. Other studies in dairy cows have reported a decrease in ruminal NH3-N
concentrations with a reduction in dietary CP level (Christensen et al. 1993; Cunningham et al.
1996; Reynal and Broderick 2005). Reynal and Broderick (2005) observed a reduction in
ruminal NH3-N concentration from 12.0 to 7.2 mg dL-1
with an approximate 1% unit decrease in
dietary CP level (18.6 to 17.5%, respectively). The tendency for ruminal NH3-N levels to
Page 127
111
decrease on the 14.9% CP diet as compared with the 17.5% CP diet affected urea-N recycling to
the GIT. The increase in UER to GIT on the 14.9% CP diet, as compared with the 17.5% CP diet
compensated for the decreased dietary CP level. This could explain why microbial protein supply
was maintained the same on the 14.9% CP diets as on the 17.5% CP diets. The salvage of N via
urea-N recycling (Stewart and Smith 2005) represents an opportunity to improve the efficiency
of feed N utilization and can lead to a reduction in the loss of N to the environment.
As expected, cows fed the 14.9% diet consumed less N than the cows fed the 17.5% CP
diet. Furthermore, N retention averaged 108.1 g d-1
but did not differ across dietary treatments.
Nitrogen retention values in the present study are higher than the 28.3 g d-1
reported by Castillo
et al. (2001). This discrepancy may be accounted for by the lower N intakes reported by Castillo
et al. (2001) as compared with our experimental cows (468.8 vs. 680.8 g d-1
, respectively).
However, a review of N balance data from 35 published studies summarizing 125 different diets
by Spanghero and Kowalski (1997) reported on several factors that can lead to either the
underestimation or overestimation of N retention values. For example, the incomplete collection
or volatile losses of NH3-N during collection or subsequent drying of faeces can lead to the
underestimation of faecal N (Spanghero and Kowalski 1997).
Furthermore, feeding the 14.9% CP diet decreased urinary N excretion by 37% when
compared to feeding the 17.5% CP diet. Other studies have reported similar findings
(Archibeque et al. 2001; Marini and Van Amburgh 2003; Davies et al. 2013). Excess N is
excreted in both the faeces and urine. However, urinary N is composed of mainly urea
(Broderick 2003) and in this study between 76.4 and 86.4% of urinary N was excreted as UUN.
This represents an irreversible loss of N to the cow. Urinary urea-N is also more damaging to the
environment than faecal N, as it can be rapidly volatilized to NH3 (Van Horn et al. 1996) in the
Page 128
112
presence of bacterial urease (McGinn et al 2002). This can lead to the pollution of both ground
water and air (Pakrou and Dillon 1995; Hristov et al. 2011). Therefore, a reduction in N intake
can be beneficial in terms of environmental stewardship related to intensive farming practices.
Feeding the 14.9% CP diet also improved milk N efficiency (MNE) by 13% when compared
with feeding the 17.5% CP diet (27.7% vs. 24.2% of intake, respectively). Milk N efficiency is
calculated as the quantity of N secreted in milk expressed as a proportion of feed N intake and is
a commonly-used as an index for assessing the efficiency of conversion of feed into milk N.
Broderick (2003) reported a 30.3% MNE when feeding a 15.1% CP diet and a subsequent
decline to 27.0% when dietary CP level was increased to 16.7%. On average, milk yield was
38.8 kg/d and did not differ amongst diets, demonstrating that, at least in the short-term, cows
fed 14.9% CP can maintain similar levels of milk yield when compared to cows fed 17.5% CP.
The average for the Greenbrae Dairy Research Herd (University of Saskatchewan) is 39.1 kg d-1
;
therefore, the performance of cows in this study was similar to that of other cows in the herd. In
agreement with these findings, Colmenero and Broderick (2006) fed diets containing 13.5 to
19.4% CP and reported average milk yields ranging from 36.3 to 38.8 kg d-1
with no difference
between dietary treatments. The ability to maintain milk yield in the present study could be a
result of the maintenance of microbial protein production in this short-term study. Maintaining
milk production levels with a reduction in dietary N input not only improves MNE but also
reduces overall feed costs. However, further research is needed to define production throughout a
full lactation and document any potential influence a reduction in dietary CP level may have on
reproductive efficiency.
Ruminal NH3-N decreased as dietary RDP level decreased from high to low (16.2 vs.
21.5 mg dL-1
, respectively). Dietary RDP level was manipulated by inclusion of canola meal
Page 129
113
and/or heated canola meal in the diet. Canola meal is a commonly used feed ingredient in
western Canada and is an excellent source of protein in terms of matching the amino acid
requirements of milk production (NRC 2001). The ruminal degradability of canola meal can be
altered through treatment with heat (McKinnon et al. 1991; McKinnon et al. 1995). As seen in
Table 2, both the soluble crude protein and acid detergent insoluble nitrogen levels were altered
by heating canola meal and explain the differences in ruminal NH3-N concentrations for the low
and high RDP diets.
In summary, ruminal NH3-N concentrations were altered by lowering diet CP and RDP
levels. However, increases in the fractional transfer of UER to the GIT compensated for reduced
ruminal NH3-N concentrations and allowed for the maintenance of microbial protein supply, in
this short-term study. Even though both dietary CP and RDP levels were reduced, this did not
result in reduced milk yield. In addition, as dietary CP level was reduced, there was also a
decline in N excretion via the urine. Lowering N excretion not only improves N efficiency, but
also reduces the negative environmental impact of such intensive farming systems. There are
also potential economic benefits to lowering the level of CP in the diet. Per unit of feed, the cost
of protein in the diet is quite high and therefore reducing the CP level may reduce the overall
cost of the diet. However, the long term effects of lowering diet CP level to 14.9% on milk
production and the possible influence on reproductive performance are unknown. Full lactation
trials are needed to confirm wide spread use of a low protein diet and to investigate the use of
such diets in early lactation cows.
Page 130
114
6. GENERAL DISCUSSION
The efficiency with which ruminants utilize dietary N leads to the excretion of excess
dietary N in feaces and urine (Tamminga 1992; Gaylean 1996; Bierman 1999). This loss of
dietary N is expensive in terms of both environmental pollution (Socolow 1999; Janzen et al.
2003; Hristov et al. 2011) and its impact on the cost of ruminant production (Chandler 1996).
Therefore, improving the efficiency of N utilization in ruminants not only benefits producers
with potential cost savings but also offers the opportunity to reduce the environmental impact of
intensive livestock operations through incorporating sustainable agricultural practices.
The recycling of urea-N to the GIT in ruminants is a salvage mechanism that conserves N
during low dietary N conditions (Lapierre and Lobley 2001). Without this mechanism N would
be irreversibly lost to the animal and could result in a N deficiency (Stewart and Smith 2005). By
increasing urea-N recycling to the GIT there would be more N available for ruminal microbial
protein production which could be utilized for anabolic purposes by the animal (i.e., meat and
milk production) (Lapierre et al. 2006), improving N efficiency. Both dietary and ruminal factors
have been shown to affect the rate at which urea-N is recycled to the GIT (Kennedy and Milligan
1980; Huntington et al. 1989; Marini and Van Amburgh 2003; Abdoun et al. 2010). There is
limited information on how concomitant changes in certain dietary factors affect the recycling of
urea-N to the GIT and its subsequent incorporation into microbial protein. Therefore, the goal of
this thesis was to investigate how manipulation of dietary CP, RDP, and RFC levels can
influence urea-N recycling in ruminants with the aim of improving overall N efficiency. Three
experiments were conducted. The first investigated the interactive effects of dietary CP level and
degradability on urea recycling, microbial protein production, and nitrogen balance (Chapter 3);
the second investigated the effects of dietary RDS and RDP levels on urea recycling, microbial
Page 131
115
protein production, nitrogen balance, and duodenal nutrient flow (Chapter 4). Both used beef
heifers as experimental models. The final experiment investigated the effects of dietary CP and
RDP levels in lactating Holstein dairy cows on urea recycling, microbial protein production,
nitrogen balance, omasal nutrient flow, and milk production (Chapter 5).
Reducing dietary N level has been shown to increase urea-N recycling to the GIT and
reduce overall N excretion to the environment (Marini and Van Amburgh 2003). Furthermore,
dietary RDP level affects ruminal NH3-N concentration (Wickersham et al. 2008a) which, in
turn, influences urea-N transfer to the GIT (Kennedy and Milligan 1980). In Chapter 3, reducing
dietary CP level from 14.0 to 10.8% (on DM basis) reduced both ruminal NH3-N concentration
and endogenous production of urea-N. Substantial amounts of urea-N were recycled to the GIT
but the absolute amounts remained similar across diets with most urea-N subsequently being
returned to the ornithine cycle. It has previously been demonstrated that decreasing ruminal NH3-
N concentration increases urea-N transfer to the GIT (Marini ad Van Amburgh 2003; Marini et
al. 2004). This indicates that in beef heifers (Chapter 3) urea-N escaped incorporation into
microbial protein and therefore was not available to the animal. This offers the opportunity to
further enhance the efficiency of N utilization of ruminants fed low CP diets by directing more
urea-N to anabolic purposes.
In Chapter 3, lowering dietary CP level to 10.8% (on DM basis) did not negatively
impact diet digestibility or microbial protein production. Microbial protein is an important source
of AA and can provide 60% to 80% of metabolizable protein (NRC 2001) which can be used for
productive purposes. This finding is important and suggests that microbial protein sythesis can
be maintained at a dietary CP level of 10.8%. If microbial protein production can be sustained
when feeding rations formulated to 10.8% CP and translated into sustained animal growth and
Page 132
116
production, substantial advances could be made in reducing N excretion into the environment as
well reducing dietary protein costs. However, animal growth trials would need to be conducted
to investigate whether or not the maintenance of microbial protein production on low CP diets
translates into enhanced growth and production in beef cattle.
Furthermore, feeding a reduced dietary CP level was associated with a 30% decrease in
urinary N excretion. The excretion of excess dietary N, particularly as urinary urea-N (Reynal
and Broderick 2005) can cause environmental degradation as urea-N is rapidly volatilized to
ammonia, which can subsequently be converted to NO2 and N2O causing environmental
pollution (Hristov et al. 2011). However, GER to faeces was significantly greater in heifers fed
the low CP diet compared with high CP diet. Since, faecal N is less volatile than urinary N, there
is opportunity to reduce environmental pollution by partitioning more excreted N to faeces rather
than urine (de Klein and Ledgard 2005). If this management strategy of reducing dietary CP
level was incorporated into intensive livestock operations, particularly those feeding a large
number of animals, it could result in a significant decline in N excretion and reduce the potential
negative environmental impact of such production systems.
Ruminal microbes require ruminally-fermentable carbohydrate in order to incorporate
ruminal NH3-N into microbial protein (Nocek and Russell 1988). Therefore altering the supply
of both ruminally-fermentable carbohydrate and RDP may affect microbial incorporation of
urea-N returned to the GIT and increase microbial protein reaching the small intestine. In
Chapter 4, total N flow to the duodenum was unaffected by dietary treatment however, when
feeding the high RDS, increasing RDP level increased both microbial N flow to the duodenum
and microbial efficieny in accordance with previously published data (Herrera-Saldana et al.
1990; Aldrich et al. 1993; Cruz Soto et al. 1994). These results can be attributed to the judicious
Page 133
117
combination of dietary ingredients resulting in the synchrony of energy and NH3-N release in the
rumen. Microbial protein closely matches the amino acid profile of beef and milk (Storm and
Ørskov 1983). Therefore optimizing ruminal microbial production is important in terms of
supplying amino acids to the host animal.
Resluts from Chapter 4 showed that by reducing dietary N level and through feeding a
judicious balance of RDS and RDP, overall N efficiency in beef heifers can be improved, whilst
still maintaining microbial protein supply to the animal. Although further investigation is
required, the incorporation of such feeding strategies by producers could result in lowered feed
costs and a reduction in the negative environmental impact from the excretion of excess dietary
N whilst still maintaining productive performance. These are important factors to consider when
deciding to incorporate new feed formulation approaches on farm. Furthermore, agricultural
practices that enhance the stewardship of the environment and promote sustainability are crucial
to abating public concerns over the impact of intensive livestock production systems (Steinfeld et
al. 2006; de Klein et al. 2010; Janzen 2011).
Lactating dairy cows are normally fed relatively high CP diets (17.5 to 19.0% on DM
basis; NRC 2001). As with beef heifers, the overfeeding of dietary CP to lactating dairy cows
results in the excretion of excess dietary N into the environment potentially causing pollution.
However, in dairy cows increasing dietary CP level also leads to an increase in MUN level
(Canfield et al. 1990). Milk urea N levels exceeding 19 mg dL-1
are linked to a reduction in
pregnancy rate (Butler et al. 1993) as well as reduced fertility (Larson et al. 1997) in lactating
dairy cows. Feeding strategies that reduce dietary CP intake whilst still maintaining productive
performance are essential to improving the efficiency of N utilization in lactating dairy cows. In
Chapter 5, results showed that reducing dietary CP level from 17.5 to 14.9% not only
Page 134
118
significantly reduced urinary excretion of N but also improved milk N efficiency, as there was no
effect of treatment on milk yield. This provides the opportunity to reduce the impact of excess N
excreted into the environment whilst at the same time reducing overall feed costs. The data
suggested that milk yield may not have been affected by treatment due the maintenance of
microbial protein production, even on the low CP diet. Whilst these results are promising it is
unknown whether or not lactating dairy cows would be able to maintain milk yield throughout
lactation or during early lactation when fed diets containing 14.9% CP. It is also of significance
to note that lowering dietary CP level reduced MUN level, a factor shown to influence pregnancy
rate and fertility in lactating dairy cows. Reduced fertility of dairy cows can be costly to
producers, therefore, investigating the impact of low CP diets on reproductive factors, such as
conception and pregnancy rates may further enhance the adoption of such feeding strategies
within the dairy industry.
7. OVERALL CONCLUSIONS
This thesis provides data relating to improving the efficiency of N utilization through
enhanced urea-N recycling in ruminants. The results presented here show that reducing dietary
CP levels, for both beef heifers and dairy cows reduces the excretion of urinary N. Furthermore,
on low CP diets, microbial protein production was, at the very least, maintained and this was
partially mediated by effects on urea-N recycling to the GIT due to the judicious combinations of
dietary RDS and RDP. The data presented in this thesis is from short-term trials. Additional
information is required to elucidate the impact of these dietary manipulations over an entire
production cycle.
Page 135
119
8 REFERENCES
Abdoun, K. , Stumpff, F. and Martens, H. 2007. Ammonia and urea transport across the
rumen epithelium: a review. Anim. Health Res. Rev. 7: 43-59.
Abdoun K, Stumpff, F, Rabbani, I, Martens, H. 2010. Modulation of urea transport across
sheep rumen epithelium in vitro by SCFA and CO2. Am. J. Physiol. Gastrointest. Liver Physiol.
298:G190-G202.
Ahvenjärvi, S., Vanhatalo, A. and Huhtanen, P. 2002. Supplementing barley or rapeseed meal
to dairy cows fed grass-red clover silage: I. Rumen degradability and microbial flow. J. Anim.
Sci. 80: 2176-2187.
Aldrich, J. M., Muller, L. D., Varga, G. A. and Griel, Jr. L. C. 1993. Nonstructural
carbohydrate and protein effects on rumen fermentation, nutrient flow, and performance of dairy
cows. J. Dairy Sci. 76:1091-1105.
Alio, A., Theurer, C. B., Lozano, O., Huber, J. T., Swingle, R. S., Delgado-Elorduy, A.,
Cuneo, P., DeYoung, D. and Webb, Jr. K. E. 2000. Splanchnic nitrogen metabolism by
growing beef steers fed diets containing sorghum grain flaked at different densities. J. Anim. Sci.
78:1355-1363.
Archibeque, S. L., Burns, J. C. and Huntington, G. B. 2001. Urea flux in beef steers: Effects
of forage species and nitrogen fertilization. J. Anim. Sci. 79: 1937-1943.
Archibeque, S. L., Burns, J. C. and Huntington, G. B. 2001. Nitrogen metabolism of beef
steers fed endophyte-free tall fescue hay: effects of ruminally protected methionine
supplementation. J. Anim. Sci. 80: 1344-1351.
Association of Official Analytical Chemists. 1990. Official Methods of Analysis. 15th
ed.
Assoc. Off. Anal. Chem., Arlington, VA.
Page 136
120
Bach, A., Calsamiglia, S. and Stern M. D. 2005. Nitrogen metabolism in the rumen. J. Dairy
Sci. 88:(E. Suppl.): E9-E21.
Baggs, E. and Philippot, L. 2010. Microbial terrestrial pathways to nitrous oxide. pp 4-35. In
Nitrous oxide and climate change, Ed Smith, K. Earthscan, UK.
Bailey, E. A., Titgemeyer, E. C., Olson, K. C., Brake, D. W., Jones, M. L. and Anderson, D.
E. 2012a. Effects of supplemental energy and protein on forage digestion and urea kinetics in
growing beef cattle. J. Anim. Sci. 90: 3492-3504.
Bailey, E. A., Titgemeyer, E. C., Olson, K. C., Brake, D. W., Jones, M. L. and Anderson, D.
E. 2012b. Effects of ruminal casein and glucose on forage digestion and urea kinetics in beef
cattle. J. Anim. Sci. 90: 3505-3514.
Balcells, J., Guada, J. A., Castrillo, C. and Gasa, J. 1993. Rumen digestion and urinary
excretion of purine derivatives in response to urea supplementation of sodium-treated straw fed
to sheep. Br. J. Nutr. 69: 721-732.
Beauchemin, K. A., Yang, W. Z., Morgavi, D. P., Ghorbani, G. R., Kautz, W. and Leedle, J.
A. Z. 2003. Effects of bacterial direct-fed mcirobials and yeast on site and extent of digestion,
blood chemistry, and subclinical ruminal acidosis in feedlot cattle. J. Anim. Sci. 81: 1628-1640.
Bierman, S., Erickson, G. E., Klopfenstein, T. J., Stock, R. A. and Shain, D. H. 1999.
Evaluation of nitrogen and organic matter balance in the feedlot as affected by level and source
of dietary fiber. J. Anim. Sci. 77: 1645-1653.
Bödeker, D., Oppelland, G. and Holler, H. 1992a. Involvement of carbonic anhydrase in
ammonia flux across rumen mucosa in vitro. Exp. Physiol. 77: 517-519.
Bödeker, D., Shen, Y., Kemkowski, J. and Holler, H. 1992b. Influence of short-chain fatty
acids on ammonia absorption across the ruman wall of sheep. Exp. Physiol. 77: 369-376.
Page 137
121
Bödeker, D. and Kemkowski, J. 1996. Participation of NH4+ in total ammonia absorption
across the rumen epithelium of sheep (Ovis aries). Comp. Biochem. Physiol. A114: 305-310.
Brake, D. W., Titgemeyer, E. C., Jones, M. L. and Anderson, D. E. 2010. Effect of nitrogen
supplementation on urea kinetics and microbial use of recycled urea in steers consuming conr-
based diets. J. Anim. Sci. 88: 2729-2740.
Brito, A. F., Broderick, G. A. and Reynal, S. M. 2006. Effect of varying dietary ratios of
alfalfa silage to corn silage on omasal flow and microbial protein synthesis in dairy cows. J.
Dairy Sci. 89:3939-3953.
Britton, R. and Stock, R. 1989. Acidosis: A continual problem in cattle fed high grains diets.
Pages 8-15 in Proc. Cornell Nutr. Conf. Feed Manuf., Cornell Univ., Ithaca, NY.
Broderick, G. A. 2003. Effects of varying dietary protein and energy levels on the production of
lactating dairy cows. J. Dairy Sci. 73: 2760-2773.
Broderick, G. A. and Kang, J. H. 1980. Automated and simultaneous determination of
ammonia and total amino acids in ruminal fluids and in vitro media. J. Dairy Sci. 63: 64-75.
Brown, M. S., Krehbiel, C. R., Galyean, M. L., Remmenga, M. D., Peters, J. P., Hibbard,
B., Robinson, J. and Moseley, W. M. 2000. Evaluation of models of acute and subacute
acidosis on dry matter intake, ruminal fermentation, blood chemistry, and endocrine profiles of
beef steers. J. Anim. Sci. 78: 3155-3168.
Bunting, L. D., Boling, J. A., MacKown, C. T. and Muntifering, R. B. 1987. Effect of dietary
protein level on nitrogen metabolism in lambs: studies using 15
N-nitrogen. J. Anim. Sci. 64: 855-
867.
Page 138
122
Bunting, L. D., Boling, J. A., MacKown, C. T. and Davenport, G. M. 1989. Effect of dietary
protein level on nitrogen metabolism in the growing bovine: II. Diffusion into and utilization of
endogenous urea nitrogen in the rumen. J. Anim. Sci. 67: 820-826.
Butler, W. R., Calaman, J. J. and Beam, S. W. 1996. Plasma milk urea nitrogen in relatin to
pregnancy rate in lactating dairy cattle. J. Anim. Sci. 74: 858-865.
Butler, W. R. 1998. Review: Effect of protein nutrition on ovarian and uterine physiology in
dairy cattle. J. Dairy Sci. 81: 2533-2539.
Cabrita, A. R., Dewhurst, R. J., Abreu, J. M. F. and Fonseca, A. J. M. 2006. Evaluation of
the effects of synchronizing the availability of N and energy on rumen function and production
responses of dairy cows – a review. Anim. Res. 55: 1-24.
Canadian Council on Animal Care. 1993. Guide to the care and use of experimental animals.
2nd
ed. Vol. 1. CCAC, Ottawa, ON.
Canbra Foods Ltd. 2007. Canbra Food Products, Lethbridge, Alberta, Canada. High By-Pass
Canola Meal Pellet Profile. http://www.canola.com/products/hibypass.html Accessed: 3/5/2007.
Canfield, R. W., Sniffen, C. J. and Butler, W. R. 1990. Effects of excess degradable protein on
postpartum reproduction and energy balance in dairy cattle. J. Dairy Sci. 73: 2342-2349.
Castillo, A. R., Kebreab, E., Beever, D. E. and France, J. 2000. A review of the efficiency of
nitrogen utilisation in lactating dairy cows and its relationship with environmental pollution. J.
Anim. Feed Sci. 9:1–32.
Chandler, P.T. 1996. Environmental challenges as related to animal agriculture – dairy. pp 7-19
in Nutrient management of food animals to enhance and protect the environment. E. T. Korngay
ed. CRC Press, Inc. Boca Raton, FL.
Page 139
123
Chase, L. E., Higgs, R. J. and Van Amburgh, M. E. 2009. Feeding low crude protein rations
to dairy cows – opportunities and challenges. Proceedings of the Cornell Nutrition Conference
for Feed Manufacturers, East Syracuse, New York.
Chen, X. B., and Gomes, M. J. 1992. Estimation of microbial protein supply to sheep and cattle
based on urinary excretion of purine derivatives in sheep. J. Sci. Food Agric. 63: 189-194.
Cheng, K. J., and Wallace, R. J. 1979. The mechanism of passage of endogenous urea through
the rumen wall and the role of ureolytic epithelial bacteria in the urea flow. Br. J. Nutr. 42:553.
Christensen, R. A., Cameron, M. R., Klusmeyer, T. H., Elliott, J. P. and Clark, J. H. 1993.
Influence of amount and degradability of dietary protein on nitrogen utilization by dairy cows. J.
Dairy Sci. 76: 3497-3513.
Clark, J. H. and Overton, T. R. 1995. The dairy industry and dairy cattle nutrition in the 21st
century. Pp. 4-59. Proc. California Anim. Nutr. Conf., Fresno, CA. California State Poltechnic
University, Pomona, CA.
Colmenero, J. J. and Broderick, G. A. 2006. Effect of dietary crude protein concentration
onmilk production and nitrogen utilization in lactating dairy cows. J. Dairy Sci. 89: 1704-1712.
Cowling, E. B. and Galloway, J. N. 2002. Challenges and opportunities facing animal
agriculture: Optimizing nitrogen management in the atmosphere and biosphere of the Earth. J.
Anim. Sci. 80:E157-E167.
Crutchfield, W. O. 1968. A technique for placement of an in-dwelling catheter in the cow. Vet.
Med. Small Anim. Clin. 63:1141-1144.
Cruz Soto, R., Muhammed, S. A., Newbold, C. J., Stewart, C. S. and Wallace, R. J. 1994.
Influence of peptides, amino acids and urea on microbial activity in the rumen of sheep receiving
grass hay and on the growth of rumen bacteria in vitro. Anim. Feed Sci. Technol. 49: 151-161.
Page 140
124
Cunningham, K. D., Cecava, M. J., Johnson, T. R. and Ludden, P. A. 1996. Influence of
source and amount of dietary protein on milk yield by cows in early lactation. J. Dairy Sci. 79:
620-630.
de Klein, C. A. M. and Ledgard, S. F. 2005. Nitrous oxide emissions from New Zealand
agriculture – key sources and mitigation strategies. Nutr. Cyc. Agroeco. 72: 77-85.
de Klein, C., Eckard, R. and van der Weerden, T. 2010. Nitrous oxide emissions from the
nitrogen cycle in livestock agriculture: Estimation and mitigation. pp 107-142. In Nitrous oxide
and climate change, Ed Smith, K. Earthscan, UK.
Dewhurst, R. J., Davies, D. R. and Merry, R. J. 2000. Microbial protein supply from the
rumen. Anim. Feed Sci. Technol. 85: 1-21.
Egan, A. R., Boda, K. and Varady, J. 1986. Regulation of nitrogen metabolism and recycling.
Pages 386-402 in Control of Digestion and Metabolism in Ruminants. L. P. Milligan, W. L.
Grovum and A. Dobson, eds. Prentice-Hall, Englewood Cliffs, NJ.
Erdman, R. A., Proctor, G. H. and Vandersall, J. H. 1986. Effect of rumen ammonia
concentration on in situ rate and extent of digestion of feedstuffs. J. Dairy Sci. 69: 2312-2320.
Erwin, E. S., Marco, G. J. and Emery, E. M. 1961. Volatile fatty acids analysis of blood and
rumen fluid by gas chromatography. J. Dairy Sci. 44: 1768-1776.
Faichney, G. J. 1975. The use of markers to partition digestion within the gastrointestinal tract
of ruminants. Pages 277-291 in I. W. McDonald and A. C. I. Warner, eds. Digestion and
metabolism in the ruminant. Proc. IV Int. Symposium on Ruminant Physiology. The Unviersity
of New England Publishing Unit, Sydney, Australia.
Page 141
125
Flachowsky, G. and Lebzien, P. 2006. Possibilities for reduction of nitrogen (N) excretion from
ruminants and the need for further research – a review. Landbauforschung Völkenrode. 56: 19-
30.
Food and Agriculture Organization of the United Nations (FAO). 2006. Livestock’s Long
Shadow. Environmental effects and options. Rome. http://www.virtualcentre.org. Accessed Nov
8, 2011.
Fossati, P., Prencipe, L. and Berti, G. 1980. Use of 3,5-dichloro-2-hydroxybenzenesulfonic
acid/4-aminophenazone chromogenic system in direct enzymic assay of uric acid in serum and
urine. Clin. Chem. 26: 227-231.
Fox, D. G., Sniffen, C. J., O’Connor, J. D., Russell, J. B. and Van Soest, P. J. 1992. A net
carbohydrate and protein system for evaluating cattle diets: III Cattle requirements and diet
adequacy. J Anim. Sci. 70: 3578-3596.
France, J. and Siddons, R. C. 1986. Determination of digesta flow by continuous marker
infusion. J. Theor. Biol. 121: 105-119.
Galloway, Sr., D. L., Goetsch, A. L., Patil, A., Forster, Jr. L. A. and Johnson, Z. B. 1993.
Feed intake and digestion by Holstein steer calves consuming low-quality grass supplemented
with lasalocid or monensin. Can. J. Anim. Sci. 73: 869-879.
Galyean, M. L. 1996. Protein levels in beef cattle finishing diets: Industry application,
University research and systems results. J. Anim. Sci. 74: 2860-2870.
Garret, R. H. and Grisham, C. M. 1999. Biochemistry. pp 852-898. Harcourt, Inc., Orlando,
FL.
Page 142
126
Godden, S. M., Lissemore, K. D., Kelton, D. F., Leslie, K. E., Walton, J. S. and Lumsden, J.
H. 2001. Relationships between milk urea concentrations and nutritional management,
production and economic variables in Ontario dairy herds. J. Dairy Sci. 84: 1128-1139.
Gozho, G. N., Hobin M. R., and Mutsvangwa, T. 2008. Interactions Between Barley Grain
Processing and Source of Supplemental Dietary Fat on Nitrogen Metabolism and Urea-Nitrogen
Recycling in Dairy Cows. J. Dairy Sci. 91: 247-259.
Groff, J. L. and Gropper, S. S. 2000. Advanced Nutrition and Human Metabolism. 3rd
Edition.
Chapter 7: Protein. Wadsworth / Thomson Learning.
Guo, K., Russek-Cohen, E., Varner, M. A. and Kohn, R. A. 2004. Effects of milk urea
nitrogen and other factors on probability of conception of dairy cows. J. Dairy Sci. 87: 1878-
1885.
Harmeyer, J. and Martens, H. 1980. Aspects of urea metabolism in ruminants with reference
to the goat. J. Dairy Sci. 63:1707-1728.
Harmon, D. L. and Richards, C. J. 1997. Considerations for gastrointestinal cannulations in
ruminants. J. Anim. Sci. 75: 2248-2255.
Haussinger, D. 1983. Hepatocyte heterogeneity in glutamine and ammonia metabolism and the
role of an intercellular glutamine cycle during ureogenesis in perkised rat liver. Euro. J.
Biochem. 1 33: 269-275.
Haussinger, D., Lamers, W. H. and Mooman, A. F. M. 1992. Hepatocyte heterogeneity in the
metabolism of amino acids and ammonia. Enzyme. 46: 72-93.
Heldt, J. S., Cochran, R. C., Mathis, C. P., Woods, B. C., Olson, K. C., Titgemeyer, E. C.,
Nagaraja, T. G., Vanzant, E. S. and Johnson, D. E. 1999. Effects of level and source of
Page 143
127
carbohydrate and level of degradable intake protein on intake and digestion of low-quality tall-
grass prairie hay by beef steers. J. Anim. Sci. 77: 2846-2854.
Herrera-Saldana, R., Gomez-Alarcon, R., Torabi, M. and Huber, J. T. 1990. Influence of
synchronizing protein and starch degradation in the rumen on nutrient utilization and microbial
protein synthesis. J. Dairy Sci. 73: 142-148.
Hobson, P. N. and Stewart, C. S. 1997. The rumen microbial ecosystem, 2nd
Edition. Blackie
Academic and Professional, London, UK.
Hogan, J. P. 1961. The absorption of ammonia through the rumen of the sheep. Aust. J. Biol.
Sci. 14: 448-460.
Hoover, W. H. 1986. Chemical factors involved in ruminal fiber digestion. J. Dairy Sci. 69:
2755-2766.
Hoover, W. H. and Stokes, S. R. 1991. Balancing carbohydrates and proteins for optimum
rumen microbial yield. J. Dairy Sci. 74: 3630-3644.
Houpt, T. R. 1970. Transfer of urea and ammonia to the rumen. In Physiology of Digestion and
Metabolism in the Ruminant. pp 119-131. A. T. Phillipson, ed. Oriel Press, Newcastle upon
Tyne, UK.
Houpt, T. R. and Houpt, K. A. 1968. Transfer of urea nitrogen across te rumen wall. Am. J.
Physiol. 214: 1296-1303.
Hristov, A. N., McAllister, T. A., Ouellet, D. R. and Broderick, G. A. 2005. Comparison of
purines and nitrogen-15 as microbial flow markers in beef heifers fed barley- or corn-based diets.
Can. J. Anim. Sci. 85: 211-222.
Page 144
128
Hristov, A. N. and Jouany, J. P. 2005. Factors affecting the efficiency of nitrogen utilization in
the rumen. In: Pfeffer, E. and A.V. Hristov, Nitrogen and Phosphorus Nutrition of Cattle:
Reducing the Environmental Impact of Cattle Operations. CABI Publishing.
Hristov, A. N., Hanigan, M., Cole, A., Todd, R., McAllister, T. A., Ndegwa, P. M. and Rotz,
A. 2011. Review: Ammonia emissions from dairy farms and beef feedlots. Can. J. Anim. Sci. 91:
1-35.
Huhtanen, P., Kaustell, K. and Jaakkola, S. 1994. The use of internal markers to predict total
digestibility and duodenal flow of nutrients in cattle given six different diets. Anim. Feed Sci.
Technol. 48: 211-227.
Huhtanen, P., Brotz, P. G., and Satter, L. D. 1997. Omasal sampling technique for assessing
fermentative digestion in the forestomach of dairy cows. J. Anim. Sci. 75: 1380-1392.
Hungate, R. E. 1966. The Rumen and its Microbies. Academic Press. London.
Huntington, G. B. 1986. Uptake and transport of non-protein nitrogen by the ruminant gut. Fed.
Proc. 45: 2272-2276.
Huntington, G. B. 1989. Hepatic urea synthesis and site and rate of urea removal from blood of
beef steers fed alfalfa hay or a high concentrate diet. Can. J. Anim. Sci. 69: 215-223.
Huntington, G. B. 1997. Starch utilization by ruminants: from basics to the bunk. J. Anim. Sci.
75: 852- 867.
Huntington, G. B., and Archibeque, S. L. 2000. Practical aspects of urea and ammonia
metabolism in ruminants. Proc. Am. Soc. Anim. Sci. Available at:
http://www.asas.org/jas/symposia/proceedings/filename. Accessed June 2, 2007.
Page 145
129
Huntington, G. B., Zetina,E. J., Whitt, J. M. and Potts, W. 1996. Effects of dietary
concentrate level on nutrient absorption, liver metabolism, and urea kinetics of beef steers fed
isonitrogenous and isoenergetic diets. J. Anim. Sci. 74: 908-916.
Huntington, G. B., Magee, K., Matthews, A., Poore, M. and Burns, J. 2009. Urea metabolism
in beef steers fed tall fescue, orchardgrass, or gammagrass hays. J. Anim. Sci. 87: 1346-1353.
Ivan, S. K., Grant, R. J., Weakley, D. and Beck, J. 2005. Comparison of a corn silage hybrid
with high cell-wall content and digestibility with a hybrid of lower cell-wall content on
performance n Holstein cows. J. Dairy Sci. 88: 244-254.
Janzen, H. H., Beauchemin, K. A., Bruinsma, Y., Campbell, C. A., Desjardins, R. L., Ellert,
B. H. and Smith, E. G. 2003. The fate of nitrogen in agroecosystems: An illustration using
Canadian estimates. Nutr. Cyc. Agroeco. 67: 85-102.
Jonker, J. S., Kohn, R. A. and High, J. 2002. Dairy herd management practices that impact
nitrogen utilization efficiency. J. Dairy Sci. 85: 1218-1226.
Jouany, J. P. 1996. Effect of rumen protozoa on nitrogen utilization by ruminants. J. Nutr. 126:
1335S-1346S.
Kebreab, E., France, J., Mills, J. A. N., Allison, R. and Dijkstra, J. 2002. A dynamic model
of N metabolism in the lactating dairy cow and an assessment of impact of N excretion on the
environment. J. Anim. Sci. 80: 248-259.
Kennedy, P. M. 1980. The effects of dietary sucrose and the concentrations of plasma urea and
rumen ammonia on the degradation of urea in the gastrointestinal tract of cattle. Br. J. Nutr. 43:
125-140.
Kennedy, P. M. and Milligan, L. P. 1978. Transfer of urea from the blood to the rumen of
sheep. Br. J. Nutr. 40: 149-154.
Page 146
130
Kennedy, P. M. and Milligan, L. P. 1980. The degradation and utilization of endogenous urea
in the gastrointestinal tract of ruminants: A review. Can. J. Anim. Sci. 60: 205-221.
Kiran, D, and Mutsvangwa, T. 2007. Effects of Barley Grain Processing and Dietary
Ruminally-Degradable Protein on Urea-Nitrogen Recycling and Nitrogen Metabolism in
Growing Lambs. J. Anim. Sci. 85: 3391-3399.
Kiran, D. and Mutsvangwa, T. 2010. Effects of partial defaunation on urea-nitrogen recycling,
nitrogen metabolism, and microbial nitrogen supply in growing lambs fed low or high dietary
crude protein concentrations. J. Anim. Sci. 88: 1034-1047.
Klevesahl, E. A., Cochran, R. C., Titgemeyer, E. C., Wickersham, T. A., Farmer, C. G.,
Arroquy, J. I. and Johnson, D. E. 2003. Effect of a wide range in the ratio of supplemental
rumen degradable protein to starch on utilization of low-quality, grass hay by beef steers. Anim.
Feed Sci. Technol. 105: 5-20.
Klopfenstein, T. J. and Erickson, G. E. 2002. Effects of manipulating protein and phosphorous
nutrition of feedlot cattle on nutrient management and the environment. J Anim Sci 80(E Suppl.
2): E106-E114.
Koenig, K. M., Newbold, C. J., McIntosh, F. M. and Rode, L. M. 2000. Effects of protozoa
on bacterial nitrogen recycling in the rumen. J. Anim. Sci. 78: 2431-2445.
Krause, D. O., Denman, S. E., Mackie, R. I., Morrison, M., Rae, A. L., Attwood, G. T. and
McSweeney, C. S. 2003. Opportunities to improve fiber degradation in the rumen:
microbiology, ecology, and genomics. FEMS Microbiology Reviews. 27: 663-693.
Krause, K. M. and Oetzel, G. R. 2006. Understanding and preventing subacute ruminal
acidosis in dairy herds: A review. Anim. Feed Sci. Technol. 126: 215-236.
Page 147
131
Kung, Jr., L. and Huber, J. T. 1983. Performance of high producing cows in early lactation fed
protein of varying amounts, sources, and degradability. J. Dairy Sci. 66: 227-234.
Lapierre, H. and Lobley, G. E. 2001. Nitrogen recycling in the ruminant: A review. J. Dairy
Sci. 345 84(Suppl.):E223-E236.
Lapierre, H., Pacheco, D., Berthiaume, R., Ouellet, D. R., Schwab, C. G., Dubreuil, P.,
Holtrop, G. and Lobley, G. E. 2006. What is the true supply of amino acids for a dairy cow? J.
Dairy Sci. 89: (E. Suppl.): E1-E14.
Larson, S. F., Butler, W. R. and Currie, W. B. 1997. Reduced fertility associated with low
progesterone postbreeding and increased milk urea nitrogen in lactating cows. J. Dairy Sci. 80:
1288-1295.
Lehloenya, K. V., Krehbiel, C. R., Mertz, K. J., Rehberger, T. G. and Spicer, L. J. 2008.
Effects of Propionibacteria and Yeast Culture Fed to Steers on Nutrient Intake and Site and
Extent of Digestion. J. Dairy Sci. 91: 653-662.
Leng, R. A. and Nolan, J. V. 1984. Nitrogen metabolism in the rumen. J. Dairy Sci. 67: 1072-
1089.
Licitra, G., Hernandez, T. M. and Van Soest, P. J. 1996. Standardization of procedures for
nitrogen fractionation of ruminant feeds. Anim. Feed Sci. Technol. 57: 347-358.
Lobley, G. E. 1993. Species comparisons of tissue protein metabolism: effects of age and
hormonal action. J. Nutr. 123: 337-343.
Lobley, G. E., Connell, A., Lomax, M. A., Brown, D. S., Milne, E., Calder, A. G. and
Farningham, D. A. H. 1995. Hepatic detoxification of ammonia in the ovine liver: possible
consequences for amino acid catabolism. Brit. J Nutr. 73: 667-685.
Page 148
132
Lobley, G. E., Bremner, D. M. and Zuur, G. 2000. Effects of diet quality on urea fates in
sheep as assessed by refined, non-invasive [15
N15
N] urea kinetics. Br. J. Nutr. 84: 459-468.
Ma, T. and Verkmena, A. 1999. Aquaporin channels in gastrointestinal physiology. J. Physiol.
517: 317-326.
MacLeod, G.K., Grieve, D.G. and McMillan, I. 1982. Effect of varying protein and energy
densities in diets of first lactation cows. J. Dairy Sci. 65(Suppl. 1): 126. (Abstr.).
Maekawa, M., Beauchemin, K. A. and Christensen, D. D. 2002. Chewing activity, saliva
production and ruminal pH of primiparous and multiparous lactating dairy cows. J. Dairy Sci.
85: 1176-1182.
Marini, J. C. and Van Amburgh, M. E. 2003. Nitrogen metabolism and recycling in Holstein
heifers. J. Anim. Sci. 81: 545-552.
Marini, J. C., J. D. Klein, J. M. Sands, and M. E. Van Amburgh. 2004. Effect of nitrogen
intake on nitrogen recycling and urea transporter abundance in lambs. J. Anim.
Sci. 82:1157-1164.
Martin-Orue, S. M., Balcells, J., Vicente, F. and Castrillo, C. 2000. Influence of dietary
rumen-degradable protein supply on rumen characteristics and carbohydrate fermentation in beef
cattle offered high-grain diets. Anim. Feed Sci. Technol. 88: 59-77.
McAllister, T. A., Bae, H. D., Jones, G. A. and Jones, K. J. 1994. Microbial attachments and
feed digestion in the rumen. J. Anim. Sci. 72: 3004-3018.
McClelland, I. S. and Jackson, A. A. 1996. Urea kinetics in healthy young women: minimal
effect of stage of menstrual cycle contraceptive pill and protein intake. Br. J. Nutr. 76: 199-209.
McGinn, S. M., Koenig, K. M. and Coates, T. 2002. Effect of diet on odorant emissions from
cattle manure. Can. J. Anim. Sci. 82: 435-444.
Page 149
133
McKinnon, J. J., Olubokokun, J. A., Christensen, D. A. and Cohen, R. D. H. 1991. The
influence of heat and chemical treatment on ruminal disappearance of canola meal. Can. J. Anim.
Sci. 71(3): 773-780.
McKinnon, J. J., Olubokokun, J. A., Mustafa, A. F., Cohen, R. D. H. and Christensen, D.
A. 1995. Influence of dry heat treatment of canola meal on site and extent of nutrient
disappearance in ruminants. Anim Feed Sci Technol 56: 243-252.
Meijer, A. J., Camers, W. H. and Chamuleau, R. A. 1990. Nitrogen metabolism and ornithine
cycle function. Phsiol. Rev. 70: 701-748.
Muck, R. E. 1987. Dry matter level effects on alfalfa silage quality. 1. Nitrogen transformations.
Trans. ASES 30: 7-14.
Muscher, A.S., Schröder, B., Breves, G. and Huber, K. 2010. Dietary nitrogen reduction
enhances urea transport across goat rumen epithelium. J. Anim. Sci. 88:3390-3398.
Nagaraja, T. G. and Titgemeyer, E. C. 2007. Ruminal acidosis in beef cattle: The current
microbiological and nutritional outlook. J. Dairy Sci. 90(E. Suppl.): E17-E38.
National Research Council. 1996. Nutrient requirements of beef cattle. 7th
rev. ed. Nat’l Acad.
Sci. Washington, DC.
National Research Council. 2001. Nutrient Requirements of Dairy Cattle. 7th
rev. ed. National
Academy Press. Washington, DC.
Nocek, J. E. and Russell, J. B. 1988. Protein and energy as an integrated system. Relationship
of ruminal protein and carbohydrate availability to microbial synthesis and milk production. J.
Dairy Sci. 71: 2070-2107.
Nocek, J. E. 1997. Bovine acidosis: implications on laminitis. J. Dairy Sci. 80: 1005-1028.
Page 150
134
Nolan, J. V. and Leng, R. A. 1972. Dynamic aspects of ammonia and urea metabolism in sheep.
Br. J. Nutr. 27: 177-194.
Oba, M., Baldwin, R. L., Owens, S. L. and Bequette, B. J. 2004. Urea synthesis by ruminal
epithelial and duodenal mucosal cells from growing sheep. J. Dairy Sci. 87: 1803-1805.
Odle, J. and Schaefer, D. M. 1987. Influence of rumen ammonia concentration on the rumen
degradation rates of barley and maize. Br. J. Nutr. 57: 127-138.
Oldham, J. D. 1984. Protein-energy interrelationships in dairy cows. J. Dairy Sci. 67: 1090-
1114.
Oliveira, J. S., Huber, J. T., Ben-Ghedalia, D., Swingle, R. S., Theurer, C. B. and
Pessarakli, M. 1993. Influence of sorghum grain processing on performance of lactating dairy
cows. J. Dairy Sci. 76: 575-581.
Orpin, C. G. and Joblin, K. N. 1988. The rumen anaerobic fungi. In: P. N. Hobson (Ed.), The
Rumen Microbial Ecosystem. pp 129. Elsevier Applied Science. London.
Ørskov, E. R. 1982. Protein nutrition in ruminants. Academic Press Inc., London.
Ørskov, E. R. 1986. Starch digestion and utilization in ruminants. J. Anim. Sci. 63: 1624-1633.
Ørskov, E. R. 1992. Protein Nutrition in Ruminants. 2nd
Edition. Academic Press: London and
San Diego.
Owens, F. N. and Goetsh, A. L. 1998. Ruminal fermentation. Page 145 in Ruminant Animal –
Digestive Physiology and Nutrition. D. C. Church, ed. O&B Books, Inc., Corvallis, OR.
Owens, F. N., Secrist, D. S., Hill, W. J. and Gill, D. R. 1998. Acidosis in cattle: A review. J.
Anim. Sci. 76: 275-286.
Page 151
135
Pakrou, N. and Dillon, P. 1995. Preferential flow, nitrogen transformations and 15N balance
under urine-affected areas of irrigated and non-irrigated clover-based pastures. J. Contam.
Hydrol. 20: 329-347.
Porter, P. A. and Sniffen, C. J. 1986. Comparison of acid detergent insoluble ash (ADIA)
internal digestibility marker and total collection digestibility values of lactating cows and grab
sample analysis for diurnal excretion patterns of ADIA. J. Dairy Sci. 69: (Suppl. 1): 192 (Abstr.).
Prins, R. A., vanRheenen, D. L. and van’t Klooster, A. T. 1983. Characterization of microbial
proteolytic enzymes in the rumen. J. Microbiol. Serol. 49: 585-595.
Rémond, D., F. Meschy, and Boivin, R. 1996. Metabolites, water and mineral exchanges cross
the rumen wall: Mechanisms and regulation. Ann. Zootech. 45:97-119.
Rémond, D., Bernard, L., Savary-Auzeloux, I. and Noziere, P. 2009. Partitioning of nutrient
net fluxes across te portal-drained viscera in sheep fed twice daily: effect of dietary protein
degradability. Br. J. Nutr. 102: 370-381.
Reynal, S. M. and Broderick, G. A. 2005. Effect of dietary level of rumen-degraded protein on
production and nitrogen metabolism in lactating dairy cows. J. Dairy Sci. 88: 4045-4064.
Reynal, S. M., Broderick, G. A. and Bearzi, C. 2005. Comparison of four markers for
quantifying microbial protein flow from the rumen of lactating dairy cows. J. Dairy Sci. 88:
4065-4082.
Reynolds, C. K. and Huntington, G. B. 1988. Partition of portal-drained visceral net flux in
beef steers. 1. Blood flow and net flux of oxygen, glucose and nitrogenous compounds across
stomach and post-stomach tissues. Br. J. Nutr. 60: 539-551.
Page 152
136
Reynolds, C. K. and Kristensen, N. B. 2008. Nitrogen recycling through the gut and the
nitrogen economy of ruminants: An asynchronous symbiosis. J. Anim. Sci. 86(E. Suppl.): E293-
E305.
Ritzhaupt, A., Breves, G., Schroder, B., Winckler, C. G. and Shirazi-Beechey, S. P. 1997.
Urea transport in the gastrointestinal tract of ruminants: effects of dietary nitrogen. Biochem.
Soc. Trans. 25: S490 (Abstr.).
Ritzhaupt, A., Wood, I. S., Jackson, A. A., Moran, B. J. and Shirazi-Beechey, S. P. 1998.
Isolation of RT-PCR fragment from human colon and sheep rumen RNA with nucleotide
sequence similarity to human and rat urea transporter isoforms. Biochem. Soc. Trans. 26: S122
(Abstr.).
Roe, M. B., Sniffen, C. J. and Chase, L. E. 1990. Techniques for measuring protein fractions in
feedstuffs. Proc. Cornell Nutr. Conf. p 81. Ithaca NY.
Røjen, B. A., Poulsen, S. B., Theil, P. K., Fenton, R. A. and Kristensen, N. B. 2011. Short
Communication: Effects of dietary nitrogen concentration on messenger RNA expression and
protein abundance of urea transporter-B and aquaporins in ruminal papillae from lactating
Holstein cows. J. Dairy Sci. 94: 2587-2591.
Roseler, D. K., Ferguson, J. D., Sniffen, C. J. and Herrema, J. 1993. Dietary protein
degradability effects on plasma and milk urea nitrogen and milk nonprotein nitrogen in Holstein
cows. J. Dairy Sci. 76: 525-534.
Russell, J. B. and Strobel, H. J. 1987. Concentration of ammonia across cell membranes of
mixed rumen bacteria. J. Dairy Sci. 70: 970-976.
Russell, K., Lobley, G. E., Rawlings, J., Millward, D. J. and Harper, E. J. 2000. Urea
kinetics of a carnivore, Felix silvestris catus. Br. J. Nutr. 84: 597-604.
Page 153
137
Sands, J. M. 2003. Molecular mechanisms of urea transport. J. Mem. Nutr. 191: 597-163.
Sarraseca, A., E. Milne, M. J. Metcalf, and G. E. Lobley. 1998. Urea recycling in sheep:
effects of intake. Br. J. Nutr. 79:79-88.
Satter, L. D. and Slyter, L. L. 1974. Effect of ammonia concentration on rumen microbial
protein production in vitro. Br. J. Nutr. 32:199-208.
Satter, L. D. and Roffler, R. E. 1975. Nitrogen requirement and utilization in dairy cattle. J.
Dairy Sci. 58: 1219-1237.
Satter, L. D., Klopfenstein, T. J. and Erickson, G. E. 2002. The role of nutrition in reducing
nutrient output from ruminants. J. Anim. Sci. 80(E Suppl. 2): E143-E156.
Siddons, R. C., Nolan, J. V., Beever, D. E. and MacRae, J. C. 1985. Nitrogen digestion and
metabolism in sheep consuming diets containing contrasting forms and levels of N. Br. J. Nutr.
54: 175-187.
Simmons, N. L., Chaudhry, A. S., Graham, C., Scriven, E. S., Thistlewaite, A., Smith, C. P.
and Stewart, G. S. 2009. Dietary regulation of ruminal bovine UT-B urea transporter expression
and localization. J. Anim. Sci. 87:3288-3299.
Singer, M. A. 2003. Do mammals, birds, reptiles and fish have similar nitrogen conserving
mechanisms? Comp. Biochem. And Physiol. Part B: Biochem. And Mol. Biol. 134: 543-558.
Socolow, R. H. 1999. Nitrogen management and the future of food: Lessons from the
management of energy and carbon. Proc. Natl. Acad. Sci. USA. 96: 6001-6008.
Stafford, S. D., Cochran, R. C. Vanzant, E. S. and Fritz, J. O. 1996. Evaluation of the
potential of supplements to substitute for low-quality, tallgrass-prairie forage. J. Anim. Sci. 74:
639-647.
Page 154
138
Statistical Analysis System Institute Inc (SAS). 2004. SAS/STAT 9.1 User’s Guide. SAS
Institute Inc., Cary, NC.
Steinfeld, H., Greber, P. T. W., Castel, V., Rosales, M. and de Haan, C. 2006. Livestock
Long shadow – environmental issues and options. Food and Agricultural Organization of the
United Nations, Rome.
Stewart, C. S., Flint, H. J. and Bryant, M. P. 1997. Chapter 2: The rumen bacteria. In The
Rumen Microbial Ecosystem pp. 10-72. 2nd
Edition. P. N. Hobson and C. S. Stewart, ed.
Chapman & Hall, London, UK.
Stewart, G. S. and Smith, C. P. 2005. Urea nitrogen salvage mechanisms and their relevance to
ruminants, non-ruminants and man. Nutr. Res. Rev. 18: 49-62.
Stewart, G. S., Graham, C., Cattell, S., Smith, T. P. L., Simmons, N. L. and Smith, C. P.
2005. UT-B is expressed in bovine rumen: potential role in ruminal urea transport. Am. J
Physiol. Regul. Integr. Comp. Physiol. 289: R605-R612.
Storm, E. and Ørskov, E. R. 1983. The nutritive value of rumen micro-organisms in ruminants.
1. Large-scale isolation and chemical composition of rumen micro-organisms. Br. J. Nutr. 50:
463-470.
Sunny, N. E., Owens, S. L., Baldwin, R. L., El-Kadi, S. W., Kohn, R. A. and Bequette, B. J.
2007. Salvage of blood urea nitrogen in sheep is highly dependent on plasma urea concentration
and the efficiency of capture within the digestive tract. J. Anim. Sci. 85: 1006-1013.
Swenson, M. J. and Reece, W. O., Eds. 1993. Dukes’ Physiology of Domestic Animals, 11th
Ed. Ithaca, New York: Cornell University.
Takiguchi, M. and Mori, M. 1995. Transcriptional regulation of genes for ornithine cycle
enzymes. Biochem. J. 312: 649-659.
Page 155
139
Tamminga, S. 1979. Protein degradation in the forestomachs of ruminants. J. Anim. Sci. 49:
1615-1013.
Tamminga, S. 1992. Nutrition management of dairy cows as a contribution to pollution control.
J. Dairy Sci. 49: 1615-1630.
Tamminga, S. 1996. A review on environmental impacts of nutritional strategies in ruminants. J
Anim. Sci. 74: 3112-3124.
Theurer, C. B. 1986. Grain processing effects on starch utilization by ruminants. J. Anim. Sci.
63: 1649-1662.
Theurer, C. B., Huber, J. T., Delgado-Elorduy, A. and Wanderley, R. 1999. Invited review:
summary of steam-flaking corn or sorghum grain for lactating dairy cows. J. Dairy Sci. 82:
1950-1959.
Theurer, C. B., Huntington, G. B., Huber, J. T., Swingle, R. S. and Moore, J. A. 2002. Net
absorption and utilization of nitrogenous compounds across ruminal, intestinal, and
hepatic tissues of growing beef steers fed dry-rolled or steam-flaked sorghum grain. J.
Anim. Sci. 80:525-532.
Thompson, R. K., Mustafa, A. F., McKinnon, J. J., Maenz, D. and Rossnagel, B. 2000.
Genotypic differences in chemical composition and ruminal degradability of oat hulls. Can. J.
Anim. Sci. 80: 377-379.
Thompson, R. K., McKinnon, J. J., Mustafa, A. F., Maenz, D. D., Racz, V. J. and
Christensen, D. A. 2002. Chemical composition, ruminal kinetic parameters, and nutrient
digestibility of ammonia treated oat hulls. Can. J. Anim. Sci. 82: 103-109.
Titgemeyer, E. C. 1997. Design and interpretation of nutrient digestion studies. J. Anim. Sci.
75: 2235-2247.
Page 156
140
Udén, P., Colucci, P. E., and Van Soest, P. J. 1980. Investigation of chromium, cerium and
cobalt as markers in digesta: Rate of passage studies. J. Sci. Food Agric. 31: 625-632.
Ushida, K., Jouany, J. P. and Demeyer, D. I. 1991. Effects of presence or absence of rumen
protozoa on the efficiency of utilization of concentrate and fibrous feeds. Pages 625-654 in
Physiological Aspects of Digestion and Metabolism in Ruminants. T. Tsuda, Y. Sasaki, and R.
Kawashima, eds. Academic Press, New York, NY.
Vagnoni, D. B., Broderick, G. A., Clayton, M. K. and Hatfield, R. D. 1997. Excretion of
purine derivatives by Holstein cows abomasally infused with incremental amounts of purines. J.
Dairy Sci. 80: 1695-1702.
Van Horn, H. H., Newton, G. L. and Kunkle, W. E. 1996. Ruminant nutrition from an
environmental perspective: factors affecting whole-farm nutrient balance. J. Anim. Sci. 74:
3082-3102.
Van Soest, P. J. 1994. Function of the ruminant forestomach. Pages 230–252 in Nutritional
Ecology of the Ruminant. 2nd ed. Cornell University Press, Ithaca, NY.
Van Soest, P. J., Robertson, J. B. and Lewis, B. A. 1991. Methods for dietary fiber, neutral
detergent fiber and non-starch polysaccharides (NSP) in relation to animal nutrition. J. Dairy Sci.
74: 3583-3597.
Varady, J., Tashenov, K. T., Boda, K., Fejes, J. and Kosta, K. 1979. Endogenous urea
secretion into the sheep gastrointestinal tract. Physiol. Bohemoslov. 28: 551-559.
Vicente, F., Sarraseca, A., de Vega, A. and Guada, J. A. 2004. Performance of several Cr and
Yb analytical techniques applied to samples of different biological origin (digesta or faeces). J.
Sci. Food Agric. 84: 2035-2040.
Page 157
141
Wallace, R. J. 1997. Peptide metabolism and its efficiency in ruminant production. In Rumen
microbes and digestive physiology in ruminants. pp 95-105. Eds Onodera, R., H. Itabashi, K.
Ushida, H. Yano, and Y. Sasakai.
Wallace, R. J., Onodera, R. and Cotta, M. A. 1997. Metabolism of nitrogen-containing
compounds. In The Rumen Microbial Ecosystem pp. 283-328. 2nd
Edition. P. N. Hobson and C.
S. Stewart, ed. Chapman & Hall, London, UK.
Wickersham, T. A., Titgemeyer, E. C., Cochran, R. C., Wickersham, E. E. and Gnad, D. P.
2008a. Effect of rumen-degradable intake protein supplementation on urea kinetics and
microbial use of recycled urea in steers consuming low-quality forage. J. Anim. Sci. 86: 3079-
3088.
Wickersham, T. A., Titgemeyer, E. C., Cochran, R. C., Wickersham, E. E. and Moore, E. S.
2008b. Effect of frequency and amount of rumen-degradable intake protein supplementation on
urea kinetics and microbial use of recycled urea in steers consuming low-quality forage. J. Anim.
Sci. 86: 3089-3099.
Wickersham, T. A., Titgemeyer, E. C. and Cochran, R. C. 2009. Methodology for concurrent
determination of urea kinetics and the capture of recycled urea nitrogen by ruminal microbes in
cattle. Animal. 3: 372-379.
Williams, A. G. and Coleman, G. S. 1997. Chapter 3: The rumen protozoa.
In Rumen microbes and digestive physiology in ruminants. pp 73-139. Eds Onodera, R., H.
Itabashi, K. Ushida, H. Yano, and Y. Sasakai.
Willms, C. L., Berger, L. L., Merchen, N. R., Fahey, G. C. Jr. and Fernando, R. L. 1991.
Effects of increasing crude protein level on nitrogen retention and intestinal supply of amino
Page 158
142
acids in lambs fed diets based on alkaline hydrogen peroxide-treated wheat straw. J. Anim. Sci.
69: 4939-4950.
Wright, P. A. 1995. Nitrogen excretion: three end products, many physiological roles. J. Exp.
Biol. 198: 273-281.
Wright, T. C., Moscardini, S., Luimes, P. H., Susmel, P. and McBride, B. W. 1998. Effects
of rumen-undegradable protein and feed intake on nitrogen balance and milk protein production
in dairy cows. J. Dairy Sci. 81: 784-793.
Xie, J. 2003. Establishment of a two-dimensional electrophoresis map of human mitrochondrial
proteins. PhD Dissertation. Humboldt University, Berlin, Germany.
Yan, T., Frost, J. P., Agnew, R. E., Binnie, R. C. and Mayne, C. S. 2000. Relationships
among manure nitrogen output and dietary and animal factors in lactating dairy cows. J. Dairy
Sci. 89:3981–3991.
You, G. Smith, C. P., Kanai, Y., Lee, W., Stelzner, M. and Hediger, M. 1993. Cloning and
characterization of the vasopressin-regulated urea transporter. Nature. 365: 844-847.
Yu, P., Christensen, D. A. and McKinnon, J. J. 2003. Effect of variety and maturity stage on
chemical composition, carbohydrate and protein sub-fractions, in vitro rumen degradability and
energy values of timothy and alfalfa. Can J. Anim. Sci. 83: 279-290.
Yu, P., Christensen, D. A. and McKinnon, J. J. 2004. In situ rumen degradation kinetics of
timothy and alfalfa as affected by cultivar and stage of maturity. Can. J. Anim. Sci. 84: 255-263.