93
Final Report A synthesis of the Auckland Research Programme Improving our understanding of Auckland's competitiveness June 2011

Final Report
A synthesis of the Auckland Research Programme
Improving our understanding of Auckland's competitiveness
June 2011


Commercial In Confidence
Preface
This report has been prepared for the Ministry of Economic Development by Nick Davis from
MartinJenkins (Martin, Jenkins & Associates Limited).
MartinJenkins is a New Zealand-based consulting firm providing strategic management
support to clients in the public, private and not-for-profit sectors.
Our over-riding goal is to build the effectiveness of the organisations we work with. We do
this by providing strategic advice and practical support for implementation in the areas of:
• Strategy, Transformation & Performance
• Policy & economics
• Evaluation & research.
MartinJenkins was established in 1993 and is 100% New Zealand owned. It is governed by
executive directors Doug Martin, Kevin Jenkins, Michael Mills, Nick Davis and Nick Hill, plus
independent directors Peter Taylor (Chair) and Sir John Wells.
Acknowledgements
This report has been prepared with funding from the Ministry of Science and Innovation’s
Cross Departmental Research Pool fund secured and administered by the Ministry of
Economic Development, New Zealand Government – Auckland Policy Office.
The author is grateful to staff of the Auckland Policy Office, Auckland Council and New
Zealand Trade and Enterprise who participated in a useful workshop discussion at the mid-
way stage and, in particular, to EeMun Chen, Abbe Marks and Stephen Knuckey of the
Ministry of Economic Development for their ongoing involvement and helpful comments
throughout the project.
Disclaimer
The views, opinions, findings, and conclusions or recommendations expressed in this report
are strictly those of the author(s). They do not necessarily reflect the views of the Ministry of
Economic Development, the Ministry of Transport, the Ministry for the Environment or the
Department of Labour. The Ministries take no responsibility for any errors or omissions in, or
for the correctness of, the information contained in this report. The report is presented not as
policy, but with a view to inform and stimulate wider debate.


Commercial In Confidence
Contents
Executive Summary 1
1. Introduction 8
2. Summary of research findings 11
3. Integrated analysis 48
4. Implications and recommendations 63
References 81
Appendix 1: Auckland Unleashed 84
Tables
Table 1: Auckland Research Programme Studies by Theme ....................................................... 8
Table 2: Other studies included in this research synthesis ........................................................... 9
Table 3: Characteristics and experiences of successful cities .................................................... 64
Figures
Figure 1: City competitiveness framework .................................................................................. 65
Figure 2: Proposed Auckland Economic Development Strategic Approach ............................... 87


Commercial In Confidence
Improving our understanding of Auckland's competitiveness 1
Executive Summary
Between 2007 and 2011, the Auckland Policy Office (APO) managed a research programme
with the objective of acquiring evidence about how policy can best contribute to improving the
city-region’s productivity and economic growth. In particular, the research programme aimed to
shed light on a wide range of factors potentially determining and limiting Auckland’s economic
development.
The research programme was broad in scope, covering issues as diverse as population and
firm location patterns, economic linkages between cities, Auckland’s competitiveness and
distinctiveness, the knowledge economy, and housing needs and aspirations. In addition to the
studies commissioned under the research programme, this synthesis considers findings from a
number of complementary studies in the areas of transport infrastructure, innovation and tertiary
education. The result is the wide-ranging discussion of Auckland’s comparative economic
performance and competitiveness.
Collectively, the studies show that Auckland generally compares favourably in terms of
economic performance when compared with the rest of New Zealand. However, Auckland’s
relative economic performance is mid-table when compared with international comparators.
While Auckland has cemented its role as New Zealand’s core city, it remains vulnerable to
intense international competition for ideas, talent and capital.
Reflecting Auckland’s relative attractiveness and competitiveness, its population has grown
strongly over time, with much of this growth coming from net international migration. Particular
sources of advantage for the region include: relatively deep and specialised labour markets;
large population base; role as an international gateway; centre for further processing and
distribution; commercial hub; centre for capital market activity; quality of education and research
institutions; cultural diversity; good infrastructure; strong creative sector; outstanding natural
amenity; high quality of life; relatively low traffic and world-class public facilities.
A number of these factors (i.e., especially those related to population size) give Auckland a
competitive edge domestically but are disadvantages on an international scale. The research
identifies a number of areas of distinct competitive disadvantage for the region including: low
export intensity; weaknesses in the innovation system; specific infrastructure constraints;
expensive housing and lack of progress on residential intensification; shallow capital markets;
lack of readily available land for residential and commercial development; large distance from
major markets; relatively small population base; weak city-region brand; issues with literacy and
numeracy and educational attainment amongst lower socio-economic population groups; and
specific neighbourhood concentrations of deprivation.
Commercial In Confidence
Some specific findings from the research that are worth noting include:
• Agglomeration - The research provided further evidence of agglomeration economies in
Auckland, although the results were somewhat weaker than expected on the basis of
previous research. However, it should be noted that the quantification of agglomeration
economies was not a primary focus for the research programme.
• Spatial patterns of development - The research found significant evidence of household
clustering by ethnicity and country of birth, after taking account of other factors that may
determine household location patterns. Clustering is strongest for Pacific people, but is
also significant for Māori, people of Asian ethnicity, and returning New Zealanders. The
results strongly imply that the future spatial patterns of population distribution in Auckland
will depend on the characteristics of new entrants into the region.
• Housing – The affordability and quality of housing is an important dimension of city
competitiveness. The research highlights a wide range of issues with the affordability of
housing and the operation of the housing market in Auckland, including under-supply of
housing, constrained residential land supply, dissatisfaction with intensive housing, lack of
tenure security, and issues with poor quality of rental accommodation.
• Transportation – The research found significant evidence of benefits from transport
infrastructure investment, particularly in relation to the northern motorway extensions. The
motorway investments have significantly influenced patterns of spatial development.
Anticipated benefits do not appear to be as great, relative to costs, for rail upgrades
although it remains too early to tell what the full benefits from improved rail services will be.
It is worth noting that factors that influenced households location decisions were consistent
across the range of studies. All of these studies emphasised the need to take an
integrated and holistic approach to planning of urban form, amenities and infrastructure
provision.
• Inter-city linkages – The research finds that the degree of economic inter-linkage between
Auckland, Hamilton and Tauranga is negligible, although there are significant freight
linkages between Auckland and Tauranga. By the standards of international city-systems,
the three cities are economically distant. The findings suggest that improving accessibility
and connectivity within cities is likely to have greater economic impact, other things being
equal, than trying to improve accessibility between cities.
• Innovation – The research finds that Auckland is a moderate performer in terms of
innovation. There are weaknesses in Auckland’s regional innovation system ranging from
ineffective mechanisms for commercialising research through to a lack of key supports
such as industry-based science and business parks.
The research programme has an important contribution toward the development of a framework
for thinking about Auckland’s competitiveness from an economic perspective. Broadly, the
framework that has emerged from the research conceptualises how the city-region’s
endowments (e.g., physical assets and infrastructure; land and natural environment; population,

Commercial In Confidence
Improving our understanding of Auckland's competitiveness 3
education and skills base; entrepreneurial base; institutions/governance; social/cultural capital;
financial capital/investor base) support and underpin the city-region’s sources of competitive
advantage. These sources of advantage include: image & identity; knowledge resources;
connectedness; amenities; built environment; business environment; and industrial diversity and
specialisation). Individually and in combination, these sources of advantage underpin and
support firm/industry competitive advantage and competitiveness, which in turn underpin
aggregate industry and regional economic performance. This framework, which is shown
diagrammatically below, has the potential to guide policy makers in thinking holistically about
ways to improve Auckland’s economic growth prospects.
The research gives rise to a number of specific implications for policy, economic strategy and
spatial planning in the Auckland region. Applying the above framework, we highlight the
following specific policy implications:
Image & identity
The research suggests that Auckland does not have a strongly internationally recognisable
brand image. An implication is that Auckland needs to more deliberately foster and cultivate an
international image and brand for the city-region that contributes not only to visitor and events
attraction, but also to investors and potential migrants to the city. A city branding strategy
Commercial In Confidence
should align with, and support, the economic strategy for the region and should build upon the
city’s high quality of life, outstanding natural amenity, cultural diversity, creativity and
innovativeness.
Knowledge resources
Knowledge resources encompass a range of city-region attributes, including the skills and
experience of the workforce, the knowledge intensity of the economy, and the strength of
industry-science linkages. In general, the research programme suggests Auckland performs
moderately in relation to knowledge resources. Despite strengths in terms of overall
qualification levels and the share of knowledge-intensive services, there is significant
educational under-achievement among large segments of the population, problems with
foundational skills, and skills gaps in key areas of management capability. The findings suggest
a need for initiatives aimed at: improving numeracy and literacy; improving the
commercialisation and internationalisation capability of firms; increasing educational
participation and achievement by Māori and Pacific groups; attracting and retaining more highly
skilled people; and strengthening connections between education and research institutions and
business.
Connectedness
The research explored three aspects of connectedness: international; inter-regional and intra-
regional. In relation to international connectedness, the overall conclusion of the research
programme is that Auckland’s international connections are under-developed. While Auckland
is one of the most international cities in the world and is New Zealand’s major international
gateway, it has not harnessed these strengths. A clear implication is that Auckland needs to
pursue strategies that strengthen its international connections in relation to the flows of people,
trade, investment and ideas.
In relation to inter-regional connectedness, the major finding is that Auckland has relatively
weak economic inter-linkages with Hamilton and Tauranga, with the exception of significant
freight flows. An implication of the research is that, other things being equal, improving intra-
regional accessibility and connectedness is likely to have a greater economic impact than
attempting to improve accessibility between cities. Indeed, the research shows there are
substantial economic benefits to be had from infrastructure investments that expand and
enhance the major transport networks within Auckland. This conclusion does not necessarily
imply that inter-regional connectedness is not an important economic issue. Auckland should
also look to strengthen its supply chain linkages with other cities and regions.
Amenities
The research provides strong evidence that amenities are valued by households; however it
failed to find evidence in support of the provision of specific amenities. A key insight from the
research is that households appear to chose between ‘bundles’ of amenities; it is the quality and
combination of amenities that is important for influencing choice of location. While firms do not
Commercial In Confidence
Improving our understanding of Auckland's competitiveness 5
appear to strongly value amenities, they do value access to a deep pool of labour and this
means they indirectly value the provision of amenities that make cities attractive to workers.
These findings mean an integrated and holistic view needs to be taken to the provision of
amenities. While public amenities undoubtedly contribute to city liveability, there is a long bow
between their provision and economic growth. Smart investments are those that seek not only
to provide amenity, but effectively target specific economic objectives such as tourism
promotion and events attraction. Auckland’s CBD waterfront has the potential to significantly
improve amenity values in the central city, where agglomeration economies have the best
chance of being harnessed.
Built environment
Decisions regarding the built environment, including the appropriate city form to pursue and
related decisions about which major city-shaping investments are the priorities for Auckland,
have potentially significant long-term economic impacts. Unfortunately, the research
programme provides little specific guidance on which development strategies or investments to
pursue. The research does, however, suggest the need to address land-related constraints to
both residential and industrial growth and highlights a number of housing-related risks to the
city-region’s growth prospects. The research also highlights the importance of both the CBD
and secondary city centres, implying a need to focus on twin strategies of enhancing the
accessibility and attractiveness of the downtown area for mixed use development as well as
providing for well connected subsidiary centres that service and provide local employment
opportunities.
Business environment
While the research did not focus significantly on the business environment, or the ease of doing
business in Auckland, specific findings that emerged included the need to ensure an adequate
supply of business land, particularly for industrial activities, and strengthen linkages between
education and research institutions and businesses, so as to enhance the commercialisation of
new knowledge and ideas.
Industrial diversity and specialisation
The research highlighted comparative strengths in knowledge-intensive services as well as high
growth prospects in a number of specific industry sectors with established competitive
advantage (e.g., food and beverage processing, niche manufacturing and certain high value
services). The research also highlighted a number of industry-specific infrastructure constraints
to growth, on the basis of specific sector studies. If policy-makers wish to pursue specific sector
development policies, then further sector-specific research of the kind initiated as part of the
research programme would be worthwhile, directed at improving our understanding of the
sources of competitive advantage and barriers and impediments to industry expansion for a
broader range of industrial sectors.

Commercial In Confidence
Recommendations
The following recommendations are directed towards the Auckland Policy Office and Auckland
Council:
(i) The framework for city competitiveness described in part 3 of this report should be used
by agencies as a useful guide for the development of policies to improve city
competitiveness, both for Auckland and other city-regions
(ii) There should be ongoing monitoring of a refined set of indicators in relation to city
competitiveness, city outcomes, and firm/industry outcomes to enable Auckland and
other cities economic progress to be measured and reported on
(iii) There should be further targeted research in a number of areas to better inform our
understanding of Auckland’s competitiveness and, in particular, to inform the
development of policy. Specific areas for further research include:
a. developing a better understanding of the relationship between land constraints and
land prices and its effects on residential and business location decisions to inform
Auckland spatial planning processes
b. in-depth, targeted sector-specific research for a wider set of industries with a
particular focus on improving our understanding of:
i. industry competitive advantage, including the sources of competitiveness
as well as barriers and constraints to growth
ii. the innovation performance of the sectors, and the underlying performance
of the regional innovation system as it applies those sectors
c. further developing our knowledge of the actual returns to investment in transport
infrastructure, based on the approaches taken by Motu in the studies of the
Northern Motorway Extension
(iv) Policymakers should further consider the opportunities to improve each element of
Auckland’s sources of advantage including:
a. Developing and cultivating a stronger image and brand for the city that contributes
to visitor and events attraction, and which also assists in drawing investors and
potential migrants to the city.
b. Further developing the knowledge resources of Auckland, including initiatives that
seek to address under-achievement amongst large segments of the population,
problems with functional numeracy and literacy, and weaknesses in relation to
management capability, particularly as it relates to the commercialisation of
technology and business internationalisation strategies. Policy should also seek to
strengthen linkages between firms and education and research organisations and
target known problems in relation to skills supply, particularly in relation to scarce
skills in areas such as science, technology and engineering.

Commercial In Confidence
Improving our understanding of Auckland's competitiveness 7
c. Strengthening international connections between Auckland and other international
cities, especially with a view to improving trade and investment ties, better
harnessing the international connections of overseas born Aucklanders, and
improving the internationalisation capability of firms. To fully realise agglomeration
benefits, improving connectedness within the city (especially through improved
transport linkages and better broadband) is important, and may be economically
more important than strengthening connections between cities. Nevertheless, if
Auckland is to further develop its role as a value-adding processing centre, then
strengthening its supply chain linkages with other cities and regions is important.
d. In relation to amenities, there are few specific conclusions that can be drawn but a
key finding is that bundles of amenities matter more than individual amenities.
Policymakers therefore need to take an integrated and holistic approach to the
provision of amenities. Amenities are important to both households and firms (for
different reasons) and both groups should contribute financially to their provision.
e. Policymakers should reconsider existing regulatory settings in relation to land-use,
so that land-related constraints do not hinder residential or business growth
(especially for industrial activities). The Auckland Council should carefully consider
the nature and application of urban limits (alongside related instruments and
strategies) in support of desired patterns of urban growth.

Commercial In Confidence
1. Introduction
1 Between 2007 and 2010, the Auckland Policy Office managed a research programme
with the objective of acquiring evidence about how policy can best contribute to
improving the city-region’s productivity and economic growth performance. In
particular, the research programme aimed to shed light on a wide range of factors
potentially determining and limiting Auckland’s economic development.
2 Following initial scoping work by Grimes (2007), eight separate studies were
commissioned on a range of inter-related themes:
Table 1: Auckland Research Programme Studies by Theme
Theme Study
Population location
patterns and determinants
Maré, D. C., Coleman, A., & Pinkerton, R. (2011) Patterns of population
location in Auckland, Motu Economic and Public Policy Research.
Coleman, A. and D. C. Maré (2011) Estimating the determinants of
population location in Auckland, Motu Economic and Public Policy
Research.
Beacon Pathway Ltd (2010) The Determinants of Tenure and Location
Choices of 20-40 year old Households in the Auckland Region, Prepared
for the Centre for Housing Research, Aotearoa New Zealand.
Firm location patterns and
determinants
Coleman, A. and D. C. Maré (2011) Patterns of business location in
Auckland, Motu Economic and Public Policy Research.
Ascari, Strateg.Ease and PricewaterhouseCoopers (2011) Drivers of firm
location, firm success and industry success in the Auckland region.
Economic linkages
between cities
Ascari, Richard Paling Consulting and Berl economics (2011) Economic
linkages between New Zealand Cities.
Auckland’s competitiveness
and distinctiveness
Market Economics Ltd (2011) Auckland’s Competitiveness,
Distinctiveness and Sources of Competitive Advantage.
Knowledge-intensive
economic activities
Grimes, A., J. Le Vaillant and P. McCann (2011) Auckland’s Knowledge
Economy: Australasian and European Comparisons, Ministry of Economic
Development Occasional Paper 11/02.
Commercial In Confidence
Improving our understanding of Auckland's competitiveness 9
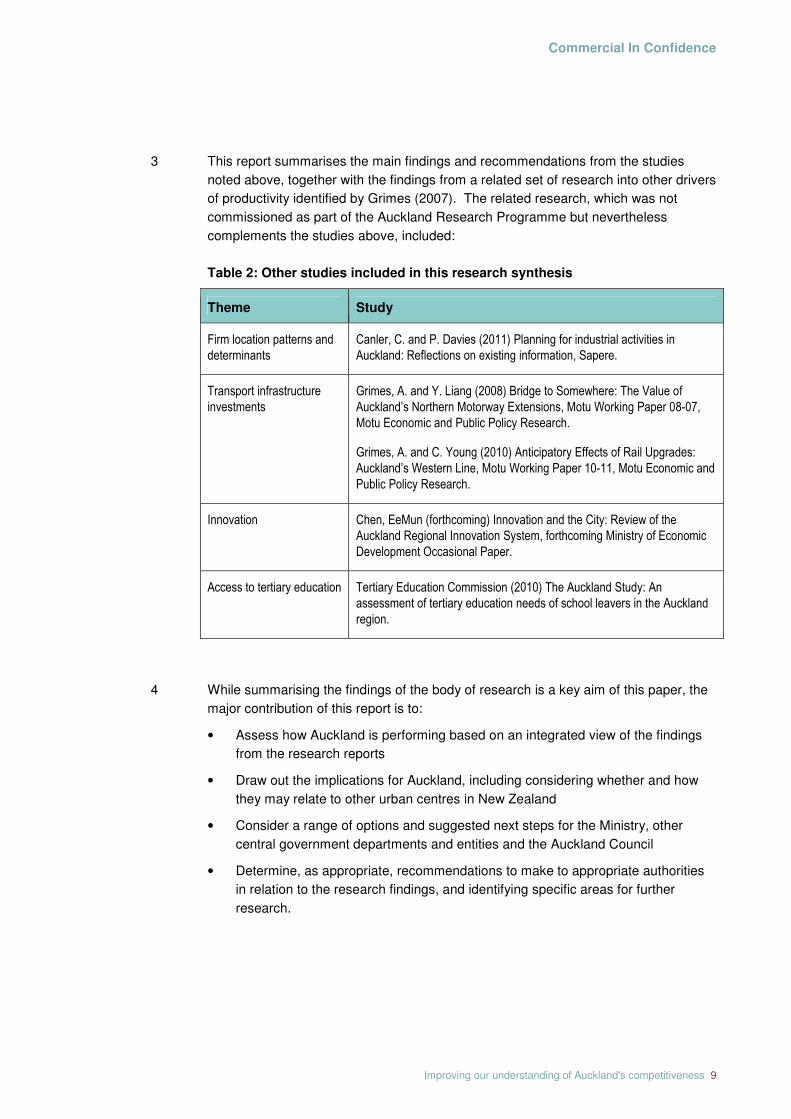
3 This report summarises the main findings and recommendations from the studies
noted above, together with the findings from a related set of research into other drivers
of productivity identified by Grimes (2007). The related research, which was not
commissioned as part of the Auckland Research Programme but nevertheless
complements the studies above, included:
Table 2: Other studies included in this research synthesis
Theme Study
Firm location patterns and
determinants
Canler, C. and P. Davies (2011) Planning for industrial activities in
Auckland: Reflections on existing information, Sapere.
Transport infrastructure
investments
Grimes, A. and Y. Liang (2008) Bridge to Somewhere: The Value of
Auckland’s Northern Motorway Extensions, Motu Working Paper 08-07,
Motu Economic and Public Policy Research.
Grimes, A. and C. Young (2010) Anticipatory Effects of Rail Upgrades:
Auckland’s Western Line, Motu Working Paper 10-11, Motu Economic and
Public Policy Research.
Innovation Chen, EeMun (forthcoming) Innovation and the City: Review of the
Auckland Regional Innovation System, forthcoming Ministry of Economic
Development Occasional Paper.
Access to tertiary education Tertiary Education Commission (2010) The Auckland Study: An
assessment of tertiary education needs of school leavers in the Auckland
region.
4 While summarising the findings of the body of research is a key aim of this paper, the
major contribution of this report is to:
• Assess how Auckland is performing based on an integrated view of the findings
from the research reports
• Draw out the implications for Auckland, including considering whether and how
they may relate to other urban centres in New Zealand
• Consider a range of options and suggested next steps for the Ministry, other
central government departments and entities and the Auckland Council
• Determine, as appropriate, recommendations to make to appropriate authorities
in relation to the research findings, and identifying specific areas for further
research.

Commercial In Confidence
5 The remainder of this report is laid out as follows:
• Part 2 briefly summarises the key findings and recommendations from each of
the nine studies in the Auckland Research Programme plus five other recent
studies that complement the analysis
• Part 3 presents an integrated analysis of the evidence, drawing out the common
themes from the research and identifying what it tells us about the city-region’s
economic performance and competitiveness
• Part 4 summarises the implications for Auckland and other urban centres and
sets out suggested next steps and recommendations.

Commercial In Confidence
Improving our understanding of Auckland's competitiveness 11
2. Summary of research findings
6 This part briefly summarises the main findings and recommendations for each of the
studies reviewed as part of this project. For each study we briefly summarise the:
• Scope and purpose
• Method
• Main findings
• Conclusions and Recommendations
7 This approach is intended to make the key findings accessible to a broad audience. In
later sections we discuss the common themes and broad conclusions that can be
drawn from the suite of papers, and discuss the policy implications.
Population location patterns and determinants
Patterns of population location in Auckland
Maré, Coleman and Pinkerton, Motu Economic and Public Policy Research
Motive and Purpose
8 Improved knowledge of how people choose where to live within the Auckland Urban
Area has the potential to inform planning decisions on land-use zoning, the best
places to build new amenities, roads and public transport infrastructure. It may assist
central and local government to anticipate the demand for land, housing and facilities.
It may also shed light on the potential for negative social problems associated with
income-based clustering and the various economic forces acting on residential
location decisions.
9 The key aim of this study, and the companion paper discussed below, is to shed light
on the question of “why people choose to live where they live?” Specifically, this first
paper examines whether there are identifiable population sub-groups that cluster
together in Auckland, including the extent to which:
• Income sorting occurs within Auckland
• People wish to locate near various types of amenities
• Different population sub-groups live in different parts of Auckland.

Commercial In Confidence
Scope and Method
10 The paper uses spatial statistical techniques to examine and describe the patterns of
residential location in the Auckland region using Census data from 2006. It focuses
on the residential location of people aged 18 years and over living in the Auckland
Urban Area. The analysis uses graphical presentation and mapping as well as a
range of summary statistics to identify how location choices differ for different
population sub-groups. The analysis is conducted at a fine level of geographical
disaggregation, roughly equivalent to a city block. A limitation of the research is that it
uses individual rather than family or household income, which may weaken evidence
of income-based clustering and confound interpretation at a household level.
Main findings
Basic location patterns around Auckland
11 Auckland has evolved over time from a mono-centric to a poly-centric form, consistent
with the pattern of development in many cities globally. Between 1956 and 2006, 80
percent of the increase in Auckland’s population located outside the central area of
Auckland. The resulting city form is characterised by many subsidiary sub-centres.
12 In 2006, one third of the 1.2 million Aucklanders lived in central Auckland, 31 percent
lived in the South, 20 percent lived in the North and 16 percent lived in the West.
Employment was comparatively more concentrated centrally but not overwhelmingly
so. For example, 55 percent of employment was in central Auckland, 19 percent in
the south, 17 percent in the north and 9 percent in the West.
13 While 80 percent of central Auckland residents worked in central Auckland, only 30
percent of northern, 43 percent of western and 36 percent of southern Aucklanders
worked in the central area of Auckland. Most of the remaining workers were
employed in the parts of the city in which they lived, suggesting most people avoid
cross-suburb commutes.
14 There is a tendency for land prices to decline, on average, with distance from the
central city but at any given distance from the centre there remains considerable
heterogeneity in land prices in the Auckland Urban Area. Population density is also
highly variable at all distances from the central city, although it gradually decreases
with distance; more markedly so on the outskirts of the Urban Area.
Patterns of neighbourhood clustering
15 Consistent with previous studies, the research found evidence of strong
neighbourhood clustering by ethnicity:
• Pacific peoples were highly clustered in some areas of Auckland and entirely
absent from some other areas of Auckland. The average Pacific person lives in
an area that has 36 percent of people of Pacific ethnicity, even though Pacific

Commercial In Confidence
Improving our understanding of Auckland's competitiveness 13
people represent only 11 percent of the Auckland population. Pacific people
were more clustered than can be expected given their income profile.
• The spatial distribution of Māori is similar to Pacific people but the strength of
clustering is not as strong. Māori are over-represented in low priced and low
density areas of southern and western Auckland.
• Asian residents are also highly clustered, although less so than Pacific people
and, despite their lower than average incomes, clustering is in areas
characterised by higher than average density and land prices.
• Returning New Zealanders tended to disproportionately locate in neighbourhoods
with concentrations of other returning New Zealanders. Both returning New
Zealanders and degree holders with high incomes tend to live in areas with
higher than average land prices and population densities. The areas that attract
returning New Zealanders are also characterised by proximity to the sea,
beaches and other desirable natural phenomena.
16 Clustering was also observed on the basis of qualification levels and labour force
status, especially areas with high concentrations of unemployed. While this is
suggestive of income based sorting, evidence of clustering by income-alone is weak.
17 The authors note that the decade to 2006 was characterised by a large increase in the
size of the Asian, Pacific and degree-qualified population subgroups and it is plausible
that these aggregate population trends are behind the observed changes in residential
location patterns during the decade.
Premium for convenient locations
18 The study found that people are prepared to pay a premium to avoid inconvenient
locations, with convenience proxied by distance to various amenities (e.g., retail and
bank facilities, schools, transport networks etc). In particular, there is a clear premium
paid to be close to downtown Auckland.
19 The analysis quantifies the size of this premium: land prices decline by 9 percent for
every 10 percent increase in the distance from the port. This premium is sizeable and
partially explains the high densities in areas close to downtown. However, the paper
was unable to establish the extent to which this premium is because of the quality of
the natural amenities in downtown Auckland, the quality of the commercial and social
facilities, because of clustering effects, or because central Auckland is an unusually
job-rich location.
20 Further, in spite of general evidence of “amenity value”, specific local amenities
appear to play little role in determining location patterns because the most commonly
used amenities, such as schools, parks and commercial facilities, tend to be fairly
evenly distributed and are found in most areas. Further, most neighbourhoods in
Commercial In Confidence
Auckland are located within relatively small distances to motorways and other
transport infrastructure. The study was unable to test the predictive power of amenity
quality, such as school quality, due to a lack of suitable data.
Conclusions and Recommendations
21 The analysis of clustering by population subgroups has extended our knowledge of
clustering, in particular by finding the strongest evidence yet of clustering by ethnicity.
The strength of the result is attributed to the much finer spatial scale (radius of 1 km)
used in this paper. The paper also establishes clustering by factors other than
ethnicity. Returning New Zealanders cluster and people also cluster on the basis of
highest qualification and labour force status. While sub-group clustering by
qualification and ethnicity suggests income based sorting may have some importance
in Auckland, it is notable that clustering by income alone is not particularly strong.
22 In addition to establishing the extent to which different groups cluster, the paper also
tried to ascertain the value of living in a location convenient to different types of
amenities and commercial facilities. Two aspects of the analysis suggest that
distance to commercial centres (supermarkets or banks) and community services
(schools) are valuable. First, for each type of facility, a 10 percent increase in the
distance from the facility is associated with a 4-5 percent decrease in land price.
Secondly, the median distance to each facility is very low, approximately 1,000 metres
for banks and supermarkets and 500 metres for schools. Three quarters of
Aucklanders live within 2000 metres of a supermarket and 700 metres of a school.
23 This suggests that not only are people prepared to pay a reasonable premium to avoid
inconvenient locations, but that investors (and the Ministry of Education) provide these
facilities so that their customers and clients are not inconvenienced. Consequently,
such facilities are found in all regions, and commercial facilities probably play little role
in determining within-region location patterns.
Estimating the determinants of population location in Auckland
Coleman and Maré, Motu Economic and Public Policy Research
Scope and Purpose
24 The specific aims of the research were to understand the extent to which the specific
patterns of residential sorting within Auckland can be explained by:
• Population subgroups being differentially attracted to particular local amenities1
1 If that were the case, local government policies to influence access to local amenities would affect the population
mix in an area.

Commercial In Confidence
Improving our understanding of Auckland's competitiveness 15
• The tendency for people to tend to cluster in areas with people similar to
themselves.
25 It does this by examining the relationship between the residential location patterns
described in the previous study and various features of local areas including:
• Population size and density
• Population composition of the neighbourhood and surrounding areas
• Accessibility to different types of amenities
• Land prices.
Method
26 The research uses spatial econometric techniques to model patterns of revealed
household location preferences. It focuses exclusively on the location choices of new
entrants to the Auckland Urban Area between 1996 and 2006. These new entrants
accounted for around half of all people in the Auckland Urban Area who changed
address over this period. As with the previous study, the analysis was conducted at
the ‘city block’ level of geographic disaggregation.
27 The modelling approach is limited in its ability to estimate the relative importance of
specific locational factors because:
• Valued amenities tend to attract wealthier households who in turn attract other
amenities. The problem is compounded when the average wealth or income of
the neighbourhood is considered a desirable locational feature in its own right
• It is difficult to disentangle the independent influence of particular factors because
desirable areas may be desirable on several dimensions that are correlated
• Not all amenities that may determine desirability and land values are observable.
When relevant amenities are unobserved, prices and demand will be positively
correlated, making interpretation of the results difficult
• The attractiveness of amenities is measured according to accessibility (i.e.,
presence of the amenity) rather than other quality dimensions (e.g., school
quality, traffic congestion etc).

Commercial In Confidence
Main findings
Characteristics of entrants into the Auckland Urban Area
28 Compared with the usually resident population, new entrants to the Auckland Urban
Areas are, on average, more highly qualified, younger, less likely to be full-time
employed, more likely to be renting, more likely to be single without dependents, and
tend to have slightly lower household incomes. These characteristics are typical of
mobile populations.
29 Notwithstanding these general tendencies, there is considerable diversity amongst
entrants. Differences in entrant characteristics by ethnicity, qualification, income and
country of birth tend to mirror overall population differences by these sub-groupings.
30 Compared with other ethnicities, entrants of Māori or Pacific ethnicity had lower
qualifications, a younger age structure, lower household income, and higher
probability of living in a rented dwelling. A relatively large share of Māori entrants
were in households with a single adult, either with dependents (45%) or without (14%).
Entrants of Pacific ethnicity were more likely to be in ‘couple with dependent’
households, and have somewhat lower median incomes than Māori entrants. Asian
entrants had, on average, higher qualification levels, a relatively young age structure,
lower rates of full-time employment and lower median household incomes, and were
more likely than other entities to be in couple households.
31 Entrant characteristics also vary by qualifications and household incomes, with similar
patterns for high-income and high-qualification groups, and for low-income and low-
qualification groups. Entrants with no qualifications tended to be older, whereas those
with low incomes were disproportionately younger.
32 In terms of country of birth, entrants from Australia, the UK and South Africa, and
returning New Zealanders had the highest incomes, reflecting in part their older age
structure and higher qualifications. Incomes for Indian entrants were significantly
lower, despite having the highest proportion of graduates and a relatively high share of
31-50 year olds. Entrants from Samoa and Tonga had the lowest qualification
structure and were relatively young. Entrants from China and South Korea had the
lowest median household incomes despite having moderately high qualifications.
Attraction to amenities
33 The research finds some evidence to suggest entrants were attracted to (i.e., willing to
pay more to live in) areas with generally high amenities, while simultaneously being
deterred by high land prices. While tentative, the conclusions suggest the attraction of
amenities was strongest for returning New Zealanders compared with other ethnic
groups. Closer inspection suggests this primarily reflects the relatively high household
incomes and qualifications of returning New Zealanders, suggesting that the higher

Commercial In Confidence
Improving our understanding of Auckland's competitiveness 17
valuation of amenities may reflect ability to pay. By contrast, there is little evidence
that other migrant groups and those with low household incomes and qualifications,
valued amenities.2
34 The study failed to find significant evidence that specific amenities influenced location
decisions, although new entrants overall had a higher propensity to locate:
• Near the CBD and away from the airport
• In areas with a low proportion of detached dwellings
• In neighbourhoods with relatively high employment
• In neighbourhoods where the migrant presence is high (except for returning New
Zealanders, who were more likely to locate in areas with a high proportion of New
Zealand born residents)
• In areas with a relatively young population.
Attraction to own group
35 The study found strong evidence of attraction to ‘own group’. Specifically, it found a
clear distinction between low and high income entrants, and between low and high
qualification entrants, with each group being attracted to neighbourhoods with high
own group concentrations.
36 Own group attraction was strongest when examined by ethnicity and country-of-birth.
Māori, Asian and Pacific entrants were more likely to locate in areas with a high
proportion of their own group. Pacific entrants also located in areas with a high
proportion of Māori residents. South African, UK and Australian entrants were
attracted to neighbourhoods where their compatriots resided but, unlike Māori, Asian
and Pacific peoples, not necessarily in areas with a disproportionately high share of
their own groups.
Conclusions and Recommendations
37 The major conclusion of the research is that people entering the Auckland Urban Area
have a strong tendency to locate in neighbourhoods with people similar to themselves.
In other words, the findings suggest residential sorting along social lines. The
research shows that this primarily reflects attraction to ‘own group’ rather than group
members having common preferences for local amenities. The population
characteristics of an area have an important influence on location choices, perhaps
more so than local amenities. This strongly implies that future spatial patterns of
population distribution in Auckland will depend on who enters Auckland.
2 Care is needed in interpreting these results because some of the regression results appear mis-specified.

Commercial In Confidence
38 While the research suggests that location amenities are valued, the findings do not
shed light on the relative importance of specific amenities. Instead, areas are
attractive because they offer a more attractive portfolio of amenities. It follows that
changes to any specific amenity in isolation will not necessarily lead to a significant
change in either land prices or attractiveness. Since higher land prices deter entrants,
residents choose areas that offer a package of amenities that best suit their needs and
budget. This implies that the provision of infrastructure, amenities and planning for
Auckland’s future residential development needs to take an integrated view of the
various dimensions of local area attractiveness, including not only the desirability of
facilities, but also the willingness and ability of different groups to pay for them.
The Determinants of Tenure and Location Choices of 20-40 year old Households in the Auckland Region
Beacon Pathway Ltd
Scope and Purpose
39 Housing consumption patterns have changed significantly over the last two decades,
particularly for young households. In particular, the rate of home ownership has
declined, more young people are staying in the rental market for longer, and there is
increased consumption amongst the young of semi-detached and multi-unit dwellings.
This study sought to improve our understanding of the changing housing needs and
demand of younger people (aged 20-40 years) in the Auckland region. The findings
are intended to inform central and local government officials about the challenges the
young face in satisfying their housing needs.
Method
40 The research combines a number of approaches to shed light on the housing demand
of the young cohort in Auckland:
• Census data was used to profile patterns of housing consumption
• A Recent Mover Survey was conducted to better understand the characteristics
of movers, their reasons for moving, their current housing situation, travel modes,
place attachment and intentions to move
• Focus groups were conducted with younger households to explore attitudes to
housing supply and alignment of demand with housing needs and aspirations
• Workshops were undertaken with housing service providers, developers and
planning and policy agencies to explore issues of supply and emerging patterns
of consumption.
Commercial In Confidence
Improving our understanding of Auckland's competitiveness 19
41 The study focuses on younger households because that group:
• has been disproportionately affected by declining home ownership rates
• represents the future productive base of the Auckland economy, both directly and
through their offspring
• are highly mobile and face choices about where they live, with the potential for
significant numbers of people to leave Auckland if they cannot satisfy their
housing and other aspirations.
42 The study did not undertake housing supply analysis and called for additional research
in this area, particularly in relation to rental accommodation.
Main findings
Housing consumption determinants of younger households
43 Key findings relating to the determinants of housing consumption include:
• For a considerable proportion of recent mover households, housing consumption
changes are driven by external factors not changes in tastes or preferences. For
example, 18 percent of non-owner recent movers moved not out of choice but
because their dwelling was no longer available.
• Younger householders (except those in Waitakere and North Shore) tend to
initially search for dwellings near to their current dwelling but are more likely to
move to another Housing Market Area than other households if their preferences
cannot be satisfied locally.
• Location is an important driver of preferred location, especially access to schools
and connection to family and friends. Employment change is not strongly
associated with housing change.
• Access to public transport is seen as desirable. Dwelling size is a strong demand
factor. Desire to exit a multi-unit and acquire a detached dwelling is a strong
demand factor.
• Reducing housing costs is a driver of housing demand among a small proportion
of households.
Housing consumption versus preferences
44 The main findings in relation to housing consumption and preferences include:
• Elevated house prices are reducing the ability to pay for home ownership,
although it is an ongoing preference among younger households.
• Considerable proportions of 20-40 year old households cannot access home
ownership in areas that meet their locational needs or rental housing that
provides a durable housing solution in those places.
Commercial In Confidence
• There is an unwillingness to pay for multi-units among many younger households.
• The desire for home ownership reflects not simply an abstract desire for home
ownership but a real concern among younger households that the rental market
fails to meet their needs. Home ownership is viewed as providing use value that
cannot easily be purchased on the rental market.
• Residential movement for some young households represents churning in the
housing market without any clearly beneficial housing outcomes.
• Younger households want dwellings in places that are located in places to which
they are attached, can accommodate their needs for adequate space, privacy
and warmth, are well connected, in safe neighbourhoods and available at a price
that allows them to manage other living costs. However, they see their housing
preferences as unobtainable and have modified their expectations.
Future patterns of housing consumption
45 The study predicts the following housing consumption trends are likely to continue for
younger households in the Auckland market:
• Increasing reliance on the rental market
• Increasing consumption of semi-detached and multi-units
• Significant churning within the rental market and owner occupation market
respectively, and little movement from rental to home ownership
• Strong housing demand in Waitakere, North Shore and Manukau
• On-going trade-offs between housing performance and price in both the home
ownership and rental sectors.
46 The study notes the following potential implications arising from these consumption
patterns:
• Pressure on spatial form and the costs of infrastructure
• The need for provision of amenities and services in appropriate places to
maintain urban quality of life
• Increased pressure on those younger households that are least resilient and least
resourced to manage their housing needs
• Increased pressure on neighbourhoods that are close to major transport corridors
and which enhance household’s ability to choose alternative transport modes.

Commercial In Confidence
Improving our understanding of Auckland's competitiveness 21
47 Possible negative outcomes associated with likely future housing consumption
patterns include:
• Negative health and productivity associated with inadequate house performance
• Higher costs (for households and for Auckland) associated with living in low
density, non mixed use suburbs
• Attenuated and costly city infrastructure.
Conclusions and Recommendations
48 The study concludes that the problems experienced by younger households in
Auckland reflect persistent and prevalent failures in the housing market’s ability to
meet the needs of its residents. Those problems include under supply, unaffordable
housing prices for rental and owner occupation, insecurity of rental tenure, and
problems in house performance. Those problems have been exacerbated by: the
leaky building problem; inadequacies in the operation of corporate bodies; poor design
of multi-unit dwellings; and poor design and implementation of residential
intensification.
49 While the demand for detached dwellings and home ownership is strong, and partly
reflects deeply embedded cultural expectations, the study concludes that it also
reflects:
• The failure of the rental market to deliver secure housing in the locations that
households need to be to carry out all aspects of their everyday lives
• Profound dissatisfaction of younger households with the design of multi-units,
their titles, and the spaces in which they are sited. This has the potential to
frustrate strategies for urban containment and intensification.
50 The authors argue that any solutions must be multi-pronged and require a focus not
only on dwellings but the neighbourhoods in which they are situated and the
connectivity of those neighbourhoods to city amenities, services, workplaces and
networks of family and friends. In short, housing requirements do not simply reflect
what a household requires or has a taste for in a particular dwelling, but reflects wider
needs of the city, how household participate in the city economy, and how they are
attached to the city.
51 Four key priorities are proposed:
• Establishing a resilient urban structure, which the authors characterise as one in
which housing, work, services and amenities are better connected, with housing
new developments (and redevelopments) that provide for price and typology-
diversity across the city

Commercial In Confidence
• Transformation of the rental market to an effective service industry delivering
stock with diversity in rental prices, locations, and dwelling types, as well as
security of occupation
• Prioritising retro-fitting of existing housing stock recognises that housing is a key
part of city infrastructure
• Expanding the housing stock in areas well served by city systems to meet the
needs of low and moderate income younger households.
Firm location patterns and determinants
Patterns of business location in Auckland
Coleman and Maré, Motu Economic and Public Policy Research
Scope and Purpose
52 Developing a good understanding of the determinants of business location choices is
important if local and/or central government wishes to influence the spatial
development of the city-region. Information is needed on the spatial pattern of
changing demand for industrial and commercial land in order to manage the
availability of supporting infrastructure and facilities, and to inform zoning decisions.
53 This study aimed to describe distinct business location patterns across industries and
to identify the key spatial determinants of those location choices. In particular, it
sought to examine the absolute and relative strength of influences on business
location choices of land prices, accessibility to selected local amenities3, localisation
(i.e., own industry concentration), industrial diversity and industrial density. The study
also tested whether these same area characteristics could explain levels of firm-level
productivity.
Method
54 The research used spatial statistical and econometric techniques to describe and
model the determinants of industrial location patterns for 24 industry groupings. The
analysis was conducted over 300 local area units within the Auckland Urban Area.
55 Limitations of the approach include:
• It is difficult to disentangle the independent influence of particular factors because
desirable areas may be desirable on several dimensions that are correlated
3 Specific amenities were measured as follows: distance to transport infrastructure (motorway ramps, railway stations,
airport, seaport), distance to local service centres (supermarkets, banks), distance to landfills, distance to
consumption amenities (schools, coast), distance to CBD.
Commercial In Confidence
Improving our understanding of Auckland's competitiveness 23
• Not all amenities that may determine desirability and land values are observable.
When relevant amenities are unobserved, prices and demand will be positively
correlated, making interpretation of the results difficult
• The attractiveness of amenities is measured according to accessibility (i.e.,
presence of the amenity) rather than other quality dimensions (e.g., school
quality, traffic congestion etc)
• The coarse level of industrial aggregation (i.e., 24 industries) means that
evidence of spatial clustering at finer levels of granularity (e.g., clustering of boat
building firms) may be missed by the analysis
• The spatial scale used (i.e., 300 area units; 5km radius for employment
composition and density measures) may not identify agglomeration and other
effects operating across different spatial scales
• The modelling approach, which is based on neoclassical assumptions, will not
pick up behavioural and institutional factors which the literature suggests may
influence location decisions.
Main findings
56 The study found distinct business location patterns for three broad industry groupings:
• Central industries, which are mostly services industries with concentrations of
employment in central areas of Auckland. The specific industries included:
business services, finance, communications, insurance and services to finance,
print manufacturing, government administration, accommodation, restaurants and
hotels, and cultural and recreational services. Together these industries
accounted for around one third of total employment in the Auckland Urban Area.
• Ring industries, which are mostly manufacturing industries with the highest
concentrations of employment in areas surrounding central Auckland. The
specific industries included: wholesale trade, and metal, furniture, petrochemical,
paper, textile, equipment and food manufacturing. Together these industries
accounted for around one-fifth of total employment in the Auckland Urban Area.
• Dispersed industries, which are other industries including transport, agriculture,
retail trade, personal services, property and equipment hire, health and
community services, construction and education. These industries tend to have
less pronounced patterns of geographic concentration, with the exception of
agriculture at the periphery of the Auckland Urban Area and transport near the
Airport. These industries accounted for around 45 percent of employment.

Commercial In Confidence
57 The study was unable to identify the key determinants of industrial location patterns,
with a small number of specific exceptions:
• Localisation - four industry groups (business services, furniture manufacturing,
agriculture and construction) were significantly more likely to locate in areas with
a high proportion of own-industry employment
• Proximity to output industries4 – was a significant influence on location choice for
communications and print manufacturing industries
• Proximity to the airport was a significant determinant of location choice for
transport firms.
58 The study found some evidence of a positive association between certain area
characteristics and productivity for some industries:
• Productivity was found to be significantly higher for firms in the retail industry with
close proximity to output industries
• Shorter distances to motorways were positively correlated with higher productivity
in the retail and accommodation industries
• Shorter distances to the seaport were positively correlated with higher
productivity of firms in business services and the wholesale industry, although
this is likely to reflect proximity to the CBD for business services
• Greater industrial diversity of local employment was positively correlated with
higher productivity of firms in the finance, transport and retail industries.
Conclusions and Recommendations
59 The modelling results yield little new insight into firm location patterns and the
determinants of business location within Auckland. Little evidence is found of
attraction to specific amenities for firms, and suggests a weak role for proximity to
transport infrastructure for most industries. The lack of evidence of an association
between firm productivity and specific area characteristics such as density and
localisation contrasts with prior work in Auckland suggesting significant agglomeration
economies.
4 Proximity to input industries was not a significant influence of location choice for any industry.

Commercial In Confidence
Improving our understanding of Auckland's competitiveness 25
Planning for industrial activities in Auckland
Canler and Davies, Sapere research group
Scope, Purpose and Method
60 This study drew on the body of recent business land planning work for the Auckland
region to summarise key points and generate insights into how information on
business land should be used to inform the Auckland Spatial Plan and the Economic
Development Strategy for Auckland.
Main findings
61 The study concluded that:
• Evidence points to a potential shortage of business land in the Auckland region
by 2021, particularly for industrial activities
• Research highlights that industrial land is being encroached by both residential
and commercial activities. Competition has been particularly strong from large
format retail activities
• Industrial activities have particular demands for land (i.e., large, relatively cheap
vacant sites with good access to transport networks, located away from
residential areas). Previous work suggests that industrial activities are unable to
easily intensify their land use or redevelop Brownfield land, implying that new
Greenfield sites located outside the existing Metropolitan Urban Limit are likely to
be required given the scarcity of suitably sized, undeveloped sites.
Conclusions and Recommendations
62 Sapere conclude that the special role for industrial activities in employment creation,
coupled with the unique land requirements for industrial activities, mean that specific
zoning or planning arrangements (to the exclusion of other uses) are likely to be
required to ensure a sufficient supply of land for manufacturing, transport and storage,
construction and wholesale industries.
63 The report notes that, while there is a role for competition among different uses in
determining the optimal spatial allocation of economic activity (with price operating as
a mechanism for achieving allocative efficiency and efficient land use), there are
multiple failures in the market for land which mean some form of intervention is
appropriate.5
5 For example, land prices do not fully internalise the costs of infrastructure and facilities provision.
Commercial In Confidence
64 However, choosing the appropriate form of intervention is controversial. In particular,
there is a tension between allowing sufficient land supply (to encourage land
development and business investment) and maintaining constrained land supply to
limit adverse environmental effects and defer (or avoid) costly infrastructure provision.
Finding the right balance is especially difficult given international competition for
capital and labour, and the potential for lower land prices in other locations to attract
these factors of production.
65 Sapere conclude that the relation between land constraints and land prices, and its
effects on business location decisions, needs to be better understood in support of
evidence based planning processes in Auckland.
Drivers of firm location, firm success and industry success in the Auckland Region
Ascari, Strateg.Ease and PricewaterhouseCoopers
Scope and Purpose
66 This study aimed to identify the key factors that determine firm location decisions and
industry success in the Auckland region. In particular, it aimed to shed light on:
• The location factors that led to the establishment, growth and continued success
of certain fast-growing industries, including the role played by skills availability,
research centres, universities and other educational institutions in industry
development
• The factors responsible for the failure of firms within negative growth sectors
• The positive and negative factors that impact on firms choosing to locate in the
Auckland6 region
• The locational factors important for public policy, and the specific actions that are
required to improve agglomeration economies.
6 This contrasts with the Coleman and Maré (2011) study, which sought to explain where in Auckland industries
chose to locate.
Commercial In Confidence
Improving our understanding of Auckland's competitiveness 27
Method
67 The method included a literature review on firm location and industry success factors,
an online survey of firms, and seven case studies of successful and declining industry
sectors7 based on 59 semi-structured interviews with firms and sector stakeholders.
The mainly qualitative approach was intended to complement and inform the more
quantitative approach to modelling business location determinants.
68 Limitations of the approach include:
• The survey response rate (39 completed responses out of 550 firms) means no
reliable findings can be drawn from the survey information
• Relatively small numbers of interviews were conducted within each sector,
limiting the level of richness of the industry case studies.
Main findings
Drivers of firm location
69 While clear findings were hampered by the low survey response rate, the study
reported the following key reasons that firms gave for locating in Auckland included:
• Labour supply – deep and specialised labour markets, including a greater ability
to attract and retain highly skilled staff
• Access to domestic market – Auckland’s large population base translates into a
large potential market for most industries
• Access to international markets and supply chains – Auckland is relatively better
connected to international markets via its air and sea port links than other New
Zealand locations
• International business visitors – for firms with international business dealings,
Auckland offers greater potential because of the ease with which international
visitors can do business in Auckland
• Non-business motivations – for example, because the owner has a personal
preference for locating the business in Auckland.
7 The case study sectors included: fast growth sectors (medical and surgical equipment manufacturing, electronic
equipment manufacturing, scientific research, consultant engineer services, and services to agriculture); and
declining sectors (automotive component manufacturing and agricultural machinery manufacturing) . Fast growth
sectors were selected on the basis that they were sectors with high employment growth between 2000 and 2008
and had minimum employment in 2008 of 1,000. Declining sectors were chosen on the basis that they had
experienced significant declines in employment over the period 2000 to 2008.

Commercial In Confidence
70 Firms also note several negative factors associated with locating in Auckland:
• Costs of dealing with local authority regulations (zoning and consents)
• Traffic congestion
• Higher costs of doing business, for example higher employee salary expectations
and higher costs of living.
71 The study reported that biotech firms saw the benefits of clustering but, for the other
sectors included in the study, firms were too competitive to see the benefits of
collaboration and co-location.
Industry and firm success and failure
72 Locational factors were seen as important determinants of success in a number of
industries. For example:
• Auckland’s significant population growth had driven demand in the consulting
engineering and medical technology sectors
• Within New Zealand, Auckland is perceived to offer better access to capital
(particularly private equity) than other New Zealand locations, which was seen as
an advantage for scientific research and biotechnology firms in particular.
However, the report noted that better access to capital overseas might still lure
these firms offshore in future
• Service providers to the agricultural sector were drawn to the concentration of
rural activities on the periphery of Auckland
• Proximity to universities was seen as important for scientific research institutes
but for other sectors these institutions were seen as irrelevant, or in some cases,
a blockage to development.
73 Several factors were reported as being behind the failure of firms within the studied
sectors:
• Fierce international competition and lower costs of production had contributed to
the decline of firms in the specialised manufacturing sector
• The collapse of the property development market had contributed to a decline of
consulting engineering firms
• A lack of ability or the capital to commercialise new innovations, including
complementary capabilities in marketing, branding and distribution, had
contributed to failure of some scientific research firms.
Commercial In Confidence
Improving our understanding of Auckland's competitiveness 29
74 The study noted that firm specific characteristics were also behind the success of
certain sectors, with growth performance within high growth sectors found to be
uneven. In a number of cases, a small number of highly successful firms dragged up
the overall performance of the sector.
75 Government intervention was not found to be a significant factor in relation to industry
success. However, government expenditures on health and infrastructure in Auckland
had contributed directly to the performance of some sectors.
Conclusions and Recommendations
76 The study concluded that the primary benefits that firms derive from locating in
Auckland are associated with its scale, which affords firms direct access to a larger
customer base and a deeper pool of skilled labour. The study noted that, while firms
do not appear to value amenity directly, they do consider access to labour to be highly
important and, since employees value amenities, firms indirectly value amenities that
make Auckland a more attractive place to live and work.
77 The paper also concluded that investment in infrastructure is needed to enhance
Auckland’s connectivity to other regions, both nationally and internationally, as well as
infrastructure oriented within the region. It recommended prioritising infrastructure
that:
• Improves the access of workers to key economic centres
• Manages or constrains the growth of traffic congestion
• Makes Auckland a more affordable place for workers to live
• Improves transport networks between Waikato, Bay of Plenty and Northland.
78 In terms of actions to improve agglomeration effects, the study did not reveal any new
or ground breaking insights but its conclusions lend support for interventions that aim
to remove or limit constraints to further concentration of economic activity through
improved accessibility and central amenities. The report recommended further
research into industry competitiveness for a broader set of industries.

Commercial In Confidence
Economic linkages between cities
Economic linkages between New Zealand Cities
Ascari, Richard Paling Consulting and Berl economics
Scope and Purpose
79 In certain overseas countries, strong interconnections between neighbouring cities
have been found to be important contributors to economic development within major
urban centres. This raises questions about the degree of Auckland’s inter-linkages
with other New Zealand cities, and the extent to which Auckland’s economic
performance is dependent on strengthening ties with these neighbouring cities.
80 Auckland, Hamilton and Tauranga are three neighbouring cities with high rates of
population and economic growth. In 2009, collectively the regions of Auckland,
Waikato and the Bay of Plenty served by these cities comprise 38 percent of New
Zealand’s population. Excluding the rural hinterland, the three cities accounted for 37
percent of New Zealand’s employees and 41 percent of GDP.
81 The purpose of this study was to examine the extent of economic inter-linkages
between Auckland, Hamilton and Tauranga and to test for the emergence of a city-
system. Specifically, the research sought to determine whether the relatively close
proximity of the three cities leads to higher than expected levels of economic
integration, via labour markets, flows of goods and services, and knowledge
exchange, and whether these economic connections, in turn, raise economic growth.
Related questions explored in the study include:
• Will Hamilton and Tauranga’s growth contribute positively to Auckland’s growth,
or will growth in these cities occur at the expense of Auckland?
• Conversely, does the scale of Auckland act to reduce the size of some industries
in Hamilton and Tauranga?
• Over what distances might positive external agglomeration effects operate?
Method
82 The study combines transport data, census data, and industry financial data to
describe the degree of economic linkages between Auckland, Hamilton and Tauranga
in terms of the movements of people, the movements of goods, and the extent of firm
and inter-industry linkages. The descriptive statistical analysis is supplemented with
interviews to shed further light on the extent of economic linkages. Comparisons are
made with patterns observed for other parts of New Zealand to identify particular
patterns of connectivity and differences in economic structure between the three cities.
The main limitation of the study is that some economically important linkages may go
unmeasured, and therefore be overlooked by the study.

Commercial In Confidence
Improving our understanding of Auckland's competitiveness 31
Main findings
Movements of people
83 The study finds that the three cities have relatively independent labour markets with
low levels of inter-city commuting, relatively low levels of face-to-face business
activity, and relatively low rates of inter-censual migration between the cities.
Indications from interviews suggest that the lack of inter-city mobility may reflect the
considerable travel times between the cities.
Freight movements
84 There are high freight flows between Auckland and Waikato and between Waikato and
Bay of Plenty. However, these flows are dominated by basic commodities, which are
typically sourced away from the cities. For many of these cities, access to a port –
whether Auckland or Tauranga – is very important. For higher value commodities,
typically generated or consumed in cities, Auckland is the major market and also the
key distribution centre for the country. The two sea ports and Auckland airport play
key roles in facilitating the distribution of goods in the three regions.
Inter-industry linkages
85 The three cities seem to operate as relatively independent economies. For example,
levels of employment in business services (a sector that Auckland dominates
nationally) were similar in Hamilton and Tauranga to other provincial centres, and did
not seem to have been affected by proximity to Auckland. Specialisation is evident in
Auckland in the finance and insurance sectors, with some gravitation of financial
services to Auckland from Tauranga. While complex transformation of primary
produce largely takes place in urban areas, notably Auckland, there is little evidence
of significant flows of input materials from Hamilton or Tauranga into Auckland for
further processing.
Economic structure
86 The three cities have fundamentally different economic foundations, in part reflecting
their different histories which strongly influence the current economic structure:
• Auckland is dominated by business services and the finance sector, and
dominates Hamilton and Tauranga (and nationally) in distribution services.
Auckland also has a relatively high share of processing and manufacturing
compared with the country as a whole, possibly reflecting the large market,
proximity to sea and air port, and possible benefits of clustering.
• Hamilton traditionally fulfilled a service centre role for the surrounding rural
hinterland. It has leveraged this to develop into more specialised, but connected,
industries including agri-science, advanced engineering, metals manufacturing,
and research and development for the dairy sector.
Commercial In Confidence
• Tauranga has weaker economic foundations with its recent economic growth
largely attributable to its attractiveness as a lifestyle location.
Conclusions and Recommendations
87 The research did not find a strong case for the emergence of a city-system between
the three cities. From a labour market and employment structure perspective, the
inter-relationships between the three cities are relatively weak. However, the freight
linkages between the three cities are relatively strong. Economic activity in Auckland
plays a role in supporting the Hamilton and Tauranga economies, but economic
influence in the opposite direction is limited.
88 It is important to note that even between the closest AHT city pairs, distances and
travel times are considerable. Internationally, even relatively close proximity between
city-regions does not guarantee any significant economic interaction.
89 There is little significant evidence to suggest that the scale of Auckland is effecting the
size or scale of industries in the other two cities as each city-region fulfils quite distinct
functions.8 In terms of policy implications, the authors suggest that:
• There needs to be support for initiatives that increase scale, economic diversity
and reduce isolation (internationally) of Auckland (particularly the central parts of
Auckland) compared with initiatives that attract economic activity away from
Auckland
• Regional employment should be concentrated in Tauranga and Hamilton to
generate a wider set of value-added activities and to support specialisation of
niche activities in those areas e.g., metals manufacturing and agri-science
• Accessibility between cities should be encouraged
• More importantly, accessibility within cities should be improved as intra-urban
movements have been shown to generate higher productivity returns compared
with inter-urban links
• Additional road and rail capacity needs to be developed for likely increases in
freight transfer between Auckland and Tauranga
• There is a need for better tertiary level educational opportunities in Tauranga, and
a strengthening of those available in Hamilton. These should be aligned with the
economic opportunities in these areas.
8 One possible exception is in the area of cultural services like the arts, sport and recreation, where the size of this
sector in Auckland may be suppressing a little its size in Hamilton and Tauranga. In other words, the AHT triangle
appears to some extent to function as a single entity for this industry.

Commercial In Confidence
Improving our understanding of Auckland's competitiveness 33
Auckland’s competitiveness and distinctiveness
Auckland’s Competitiveness, Distinctiveness and Sources of Competitive Advantage
Market Economics
Scope and Purpose
90 City-region competitiveness, and how to foster it, has emerged as an important focus
for urban economic development. While there is no commonly accepted definition of
competitiveness, and the underpinning sources of economic distinctiveness and
industrial competitive advantage that underpin it, there is significant policy interest in
the identification of the drivers of competitiveness so that strategies and policies for
improving city competitiveness may be developed.
91 This study aims to explore Auckland’s comparative performance on a wide range of
measures of competitiveness, distinctiveness and sources of competitive advantage,
with a view to identifying:
• The factors that are distinctive about the Auckland economy
• The sources of Auckland’s competitiveness
• The particular sectors that contribute to and underpin Auckland’s competitive
advantage
• The links between city-region distinctiveness and competitive economic
outcomes.9
Method
92 The approach involved the development of an overarching conceptual framework of
competitiveness, distinctiveness and competitive advantage10
, informed by a literature
review. This framework provided the basis for identifying and compiling comparative
data on specific indicators for each element of the framework. Where possible, data
was reported for Auckland and six comparator cities (Brisbane, Melbourne, Adelaide,
Seattle, Vancouver and Copenhagen). The report drew conclusions about Auckland’s
competitiveness based on a synthesised view of the indicators.
9 While a stated objective of the research, the study did not formally explore these links. 10 The study defined these terms as follows: competitiveness, more appropriately termed ‘comparative economic
performance’, is fundamentally about the standards of living, income levels and productivity of a city-region
compared with other city-regions; distinctiveness refers to the specific attributes of a city-region that are important
sources of difference from other city-regions and are not easily replicated; and competitive advantage is the
persistent industrial strengths of a city-region, which may reflect access to certain sources, particular capabilities
and resources.

Commercial In Confidence
93 The main limitations of the study are:
• The lack of a commonly agreed framework for measuring city competitiveness,
combined with a wide ranging literature, generated a somewhat wide ranging set
of indicators with little means of identifying what is most important
• Significant data constraints at the regional level limited analysis of a number of
elements, with national data used in some instances. The lack of official regional
GDP and productivity data, and data on industry sources of disadvantage, were
identified as particular constraints.
Main findings
94 Due to the broad ranging nature of the indicators covered, it is not possible to
summarise all the findings here. The main points, as they relate to the specific
objectives of the study, are:
Economic performance outcomes
95 Auckland performs well compared to the other New Zealand cities and regions and the
overall national average in terms of economic performance measures, including GDP
per capita, wage premiums and the proportion of employees in high wage industries
96 When compared internationally, however, Auckland ranked only 84th out of 116
metropolitan regions on GDP per capita, and 6th out of the seven comparator cities.
Auckland’s household incomes are lower than all the comparator city-regions, with the
exception of Adelaide. Auckland had higher unemployment rate than other cities, with
youth unemployment singled out as a ‘significant problem’ in Auckland, as are ethnic
differences in Auckland’s labour market participation rates.
Distinctiveness
97 The report noted the following positive distinctive features, namely that Auckland:
• rates highly on quality of life indicators
• is rated as the fourth best city in the world to live
• has low crime rates relative to the comparator cities
• has distinctive and attractive natural amenities and the highest levels of access to
public spaces/parks of all the comparator cities
• has good air quality (in comparison to comparator cities)
• has a high concentration of creative industry employment
• is perceived by New Zealanders as unique, dynamic, progressive, energetic, fun,
stylish and social
• is a young city, with a high percentage of the population born overseas (of the
comparator cities, only Vancouver has higher).

Commercial In Confidence
Improving our understanding of Auckland's competitiveness 35
98 The report considers that Auckland provides ‘the basics’ in terms of being an
international city, but does not stand out in terms of brand image. The study highlights
a number of negative distinctive features which may detract from its image, including
substantial gaps in literacy and numeracy amongst adults (44 percent and 51 percent
of adults had low levels respectively), comparatively high population density and high
levels of private car use. The Auckland housing market is the least affordable in NZ
and has worse affordability than most comparator cities.
Factor endowments
99 Auckland generally performs well on indicators of factor endowments, such as land
availability, water use and quality, energy supply, labour supply, foreign direct
investment and entrepreneurship. For example, Aucklanders have good access to
residential land, water, and energy supplies. A key asset is Auckland’s large labour
market and its related role as the entry point for new migrants. More than half of New
Zealand’s FDI between 2003 and 2009 was located in Auckland. One international
study found that Auckland is one of the most entrepreneurial cities in the world,
although some evidence suggests Auckland entrepreneurs’ lack ambition to grow
businesses beyond a certain modest size.
Competitive advantage
100 The study reported that Auckland’s industry sectors with competitive advantage are:
business services; marine; food; metals and metal products; health; transport
services; electronics and electrical equipment; tourism; paper products; machinery;
and technical services. These sectors capture almost a quarter of Auckland’s jobs.
Most of these sectors outperformed the wider economy on a range of dimensions
including employment, value added, exports and value added per employee.
101 Most of Auckland’s key sectors have grown their exports but relatively little is known
about demand conditions, particularly in offshore markets. The study also suggests
there is evidence that general management capability is improving but there is
weakness in the area of commercialising technology. Most innovation and R&D is
concentrated in larger firms, with R&D expenditure generally below the level in other
countries.
102 The study concluded that more thorough sector-specific research is required to better
understand industry competitive advantage.
Commercial In Confidence
Conclusions and Recommendations
103 The general conclusions noted in the study were:
• Auckland is sliding down the economic performance rankings for OECD cities
• Growth in labour unit costs is a concern in New Zealand as it has not been
accompanied by corresponding growth in productivity
• Growing levels of inequality in Auckland could lead to polarisation of
communities, undermining relatively positive social factors at present
• The workers that Auckland requires for productivity improvement are mobile and
operate in a global marketplace. Auckland has a number of attractive features
but also higher opportunity (i.e., lower incomes) and other costs (e.g., housing
costs) compared with some international cities. It therefore risks losing skilled
labour to other international cities
• Auckland’s key economic sectors are dominated by small firms, reinforcing the
notion that businesses aspire to fulfil local demands rather than overseas
markets.
Knowledge-intensive economic activities
Auckland’s Knowledge Economy: Australasian and European Comparisons
Grimes, Le Vaillant and McCann
Scope and Purpose
104 A feature of urban development trends over the last two decades is that high value,
knowledge intensive economic activities are becoming increasingly concentrated in
larger cities (agglomeration). Given this trend, Auckland’s relative ranking in relation
to knowledge intensive economic activities, and changes in that ranking over time,
may shed light on the extent to which these agglomeration factors are at play within
New Zealand, Australasia and globally.
Method
105 This study examines comparative trends in knowledge intensive economic activities
using detailed industry and occupation data for five New Zealand cities, five Australian
cities and eight like European cities.11
Comparable industry data is obtained for
medium/high-tech manufacturing (HTM) and knowledge intensive services, which are
based on EU and OECD classifications. Comparable occupational data is for
knowledge workers, based on a Statistics Canada classification. The paper is mainly
descriptive in nature.
11 The cities included in the study are: Auckland, Hamilton, Wellington, Christchurch, Dunedin, Sydney, Melbourne,
Brisbane, Adelaide, Perth, Linz, Vienna, Helsinki, Athens, Dublin, Sibon, Barcelona and Valencia.

Commercial In Confidence
Improving our understanding of Auckland's competitiveness 37
Main findings
106 The study’s main findings can be summarised as follows:
• In 1991, Auckland was the lowest ranked New Zealand city in terms of knowledge
intensity.12
Since then, the share of Auckland’s employment within knowledge
intensive sectors has grown more rapidly than any of the Australasian cities. By
2006, Auckland was the primary knowledge intensive city within New Zealand
(excluding Wellington). Relative to European comparators, Auckland’s intensity
in each of HTM and KIS fell between 1996 and 2006, despite performing
relatively strongly in these sectors in an Australasian (and especially New
Zealand) context.
• Auckland is the leading city in Australasia for KIS – it has increased intensity in
high-tech and finance KIS, has high intensity in market KIS but lags in health,
education, culture and recreation KIS.13
Compared with European cities,
Auckland increased its relative share in Market KIS and Finance KIS. These
sectors have clustered in Auckland from other New Zealand locations, and within
Europe are moving towards core cities.
• Auckland, like all Australasian cities except Hamilton, has lost share in HTM, but
the decline in Auckland has been greatest. Within New Zealand, Auckland had
the highest employment intensity in HTM in 1991 but the lowest intensity
(excluding Wellington) by 2006. Within Australasia, the greatest falls in HTM
intensity were in Auckland, Wellington, Sydney and Melbourne, with these trends
being explained by city-specific factors rather than broader agglomeration factors.
Auckland’s HTM intensity was lower than all European comparators in 2006.
• The above trends are broadly mirrored when measuring knowledge intensity
using occupational data. Auckland compares favourable on knowledge worker
intensity measures within Australasia, although strong net outflows to Australia of
knowledge intensive workers have also been observed in recent years. Indeed,
outward migration of knowledge workers exceeded inward migration by a factor
of two between 2006 and 2008.
12 As proxied by the share of employment within knowledge intensive sectors (i.e., HTM & KIS combined). 13 HTM includes transport equipment (incl. aerospace, motor vehicles) and machinery (electrical and non-electrical,
chemicals incl. pharmaceuticals) industries; High-tech KIS includes communications, computing, R&D; financial KIS
includes finance and insurance; market KIS includes real estate, renting, business services, transport; and other KIS
includes health, education, culture, recreation industries.

Commercial In Confidence
Conclusions and Recommendations
107 The research concludes that Auckland is undoubtedly the core city within New
Zealand for knowledge intensive economic activities, but is peripheral on a global
scale. The economic forces favouring the agglomeration of non-routine activities have
led to considerable strengthening of Auckland’s relative position within New Zealand.
In recent times, these within New Zealand agglomerating forces acting have offset the
same forces which act to carry some knowledge intensive economic activity away
from New Zealand to the core Australian cities.
108 Despite its relatively small scale in an Australasian context, Auckland has maintained
a major KIS role within the region. In contrast, Auckland’s HTM intensity has suffered
a sharp decline. Of particular concern is the relative under-performance of Auckland
in engineering and health within New Zealand, where Christchurch and Dunedin
appear to have greater intensity, despite Auckland’s apparent advantages in both
areas.
109 The study concludes that while New Zealand has a high share of knowledge workers
relative to Australian cities, Australia’s cities generally have a higher share of
knowledge intensive industries generally means New Zealand cities (including
Auckland) are at risk of losing talented workforces to Australia.
110 Opportunities for further development of Auckland’s knowledge intensive economic
activities may arise from the city’s strengths in medical, science, engineering,
education and research. However, the experience of the last two decades suggests
an explicit strategy (involving partnership between central and local government,
tertiary and research institutions, and private firms) may be required to take advantage
of these potential strengths.
Transport infrastructure investments
Bridge to Somewhere: The Value of Auckland’s Northern Motorway Extensions
Grimes and Liang
Scope and Purpose
111 Understanding how major transport projects contribute to economic development has
been of long standing interest for policymakers. Major roading projects are required to
generate an ex ante benefit:cost ratio of at least 4:1 before the investment can
proceed. This study estimates the ex post economic benefits and costs of
investments to extend the Auckland region’s northern motorway, particularly the
section from Tristram Avenue through to Orewa.

Commercial In Confidence
Improving our understanding of Auckland's competitiveness 39
Method
112 The study uses spatial econometric techniques to relate trends in land values over
time for given neighbourhoods to changes in population, employment and income
growth. The method estimates the net economic value derived as a result of the
motorway extensions by measuring changes in land values in certain ‘treatment’
areas, after controlling for other factors. A ‘treatment area’ is defined as a location
within a 7 kilometre radius of a new motorway exit. Results are reported separately
for North Shore (inner (within 3 km) and outer (3-7 km)), Orewa/Whangaparoa,
Warkworth and nearby beaches, and Wellsford.
113 The calculations of net benefit take account of losses in land value in localities near
the northern motorway network but not for any loss in land value in other areas of the
city. The estimated economic value excludes potential benefits that may have arisen
from increases in commercial land value in the CBD or other parts of the city owing to
better access to a wider labour pool.
Main findings
114 The study estimates the net economic value of the northern motorway extension to be
at least $2.3 billion in 2004 dollars compared with an estimated cost of $366 million,
resulting in a benefit:cost ratio of at least 6:1. This is a relatively conservative
estimate and is at the lower end of the range estimated in the report.
115 The rates of growth of land values, population and employment growth in localities
along the path of the motorway rose at faster rates than for the region generally. Real
household income also grew faster than average in areas near the motorway, with the
exception of the Inner North Shore, which could reflect either a tendency for lower
income households to locate near motorway exits (e.g., to take advantage of
employment opportunities, or to commute more easily); or lower attractiveness
associated with living close to a motorway (e.g., pollution) and/or the possibility that
this may have led higher income households to move further away from motorway
exits. The same changes and associated economic growth have not been realised in
Wellsford, indicating that even with the motorway extension this area is effectively
distant from Auckland.
Conclusions and Recommendations
116 The northern motorway extension enabled a significant increase in population and
employment growth in areas near and to the north of the motorway exits. Increases in
land value and employment are indicative of increased production opportunities, which
encouraged firms to locate near to the motorway exits. However, firms did not pay
higher relative wages possibly because of their ability to draw upon a wider labour
pool and/or because of the inward shift of population, probably reflecting an overall
improvement of the perceived attractiveness of these areas.

Commercial In Confidence
Anticipatory Effects of Rail Upgrades: Auckland’s Western Line
Grimes and Young, Motu Economic and Public Policy Research
Scope and Purpose
117 International experience indicates that the anticipated benefits of infrastructure
upgrades should be factored into people’s location and pricing decisions upon
announcement. In mid-2005, planned urban passenger rail upgrades to Auckland’s
Western Line were announced. These upgrades include double tracking to the
outskirts of Auckland’s urban area enabling a more frequent train service, station
redevelopment, and related urban renewal projects.
118 This study analyses the economic effects of the planned rail upgrades. Specifically,
the study tests whether Auckland residents, who do not have a strong history of rail
usage, react positively to the prospect of improved rail services as implied by changes
in land values. The results are used to assess anticipated net benefits of the upgrade
project. The study also tests whether proximity to a Western Line station has become
more highly valued over time as the line has been upgraded.
Method
119 The analysis uses spatial econometric techniques to compare developments near
Western Line stations situated in the former Waitakere City with developments
elsewhere in Waitakere City. After controlling for wider regional and macroeconomic
impacts, the authors estimate the changing impact over time of station proximity on
property values. Changing property values indicate the benefits attributable to rail
upgrades, since prospective buyers bid up the price of a property to include the
present discounted value of all net benefits.
Main findings
120 The results indicate that houses adjacent to a Western Line rail station rose in price on
announcement of the upgrades in mid-2005, and that the magnitudes of the rises were
sensitive to which station the houses were located nearest. Houses more distant from
the rail track also rose, but by decreasing amounts up to a distance of around 8
kilometres from the station where no rise was apparent.
121 Applying the estimates of land price rise attributable to the announcement effect to all
parts of Waikatere City within 8 kilometres of a rail station results in an estimated
aggregate rise in land value of between $610 and $670 million upon announcement.
These benefits are broadly comparable to Waitakere City’s share of the costs of the
Western Line upgrades. However, two points need to be noted:

Commercial In Confidence
Improving our understanding of Auckland's competitiveness 41
• The estimated benefits relate solely to properties within Waitakere City and do
not reflect any benefits that accrue along the Western Line within Auckland City
or in Rodney District. The latter area may benefit to the extent that rail travel to
the area is improved through double tracking and other upgrades. Further, they
do not include any benefits to businesses outside Waitakere City that may arise,
for example, through improved access to a wider pool of labour.
• The estimated benefits reflect announcement effects and, given Auckland
residents’ lack a strong history of commuter train travel, it is possible that actual
benefits will be higher than initially anticipated. In other words, the full benefits
may only become apparent after the new higher frequency rail services are in
place.
Conclusions and Recommendations
122 The results suggest that the rail upgrades have been valued positively by local
residents, and the estimated anticipated benefits are broadly comparable with
budgeted costs. Further work would be required to determine whether the benefits
improve with actual experience of the network.
Innovation
Innovation and the City: Review of the Auckland Regional Innovation System
EeMun Chen, Ministry of Economic Development
Scope and Purpose
123 The application of new ideas in a commercial environment is a key determinant of
productivity growth. Innovation is stimulated and influenced by many factors and
actors that are internal and external to a firm. Cities are viewed as important hubs of
innovative activity because they provide proximity, density and variety which enable
the sharing of knowledge and ideas, and combination of complementary skills.
124 This study reviews the local institutional and environmental context that influences the
nature of relationships, resources and information flows that underpin innovation in the
city-region. To inform the identification of actions that would improve Auckland’s
innovation system and accelerate economic growth, the study assesses the:
• Strengths in the innovation system that should be maintained or further
developed
• Weaknesses in the Auckland’s innovation system that need to be addressed
• Linkages between organisations and institutions that influence innovation.

Commercial In Confidence
Method
125 The review draws together a wide range of information on the current state of the
Auckland regional innovation system and contrasts that with the desirable features of
a well-performing innovation system. The main sources of information include:
• Literature review, which informed the development of the regional innovation
system framework and the assessment of innovation in the Auckland region
• Descriptive analysis of innovation indicators
• Sector studies, involving interviews and focus groups with firms and supporting
organisations to explore awareness, perceptions and knowledge of local
innovations, linkages with other actors, and perceptions of how the environment
for regional innovation could be improved.14
126 The main limitations of the study are:
• Innovation data availability at the regional level is partial
• The study was conducted during a time of significant turbulence in global financial
markets and when the New Zealand economy was entering recession. The
author believes that these conditions did not affect the findings
• To the extent that relevant actors and factors vary significantly across industries,
the results may not be generalisable beyond the selected sectors.
Main findings
127 The main findings from the study can be summarised as follows:
• Evidence suggests that Auckland firms undertake more innovative activity than
firms in other regions. Auckland’s size confers agglomeration benefits, higher
productivity and the region has considerable infrastructure to support innovation
compared to other parts of New Zealand (e.g., financial institutions, universities,
industry clusters etc).
• International comparisons suggest, however, that Auckland is a low- to moderate
performer. Auckland’s patenting rate sits at the lower end of an international
comparison of metropolitan regions.
• In most businesses interviewed, innovation was found to be often hidden and
informal, and relied largely on internal resources. Most firms did not work with
suppliers and customers in a coordinated or systematic way, and competition was
seen as a barrier to collaboration with competitors.
14 More than 80 businesses and 40 industry, education and government organisations took part across five sectors:
advanced materials, marine, digital content, food and beverage, and finance and insurance services.

Commercial In Confidence
Improving our understanding of Auckland's competitiveness 43
• There are real strengths in the work of universities, Crown research institutes,
and other education and research organisations in the region. However there is a
lack of connectedness between firms and these organisations, and this is
perceived by firms to be the greatest weakness in the regional innovation system
(only a few companies have strong relationships with individuals in research
organisations). Barriers to stronger connectedness include different timeframes,
public funding requirements, intellectual property protection, and financial costs.
• The collaboration and linkages that would be expected in a well performing
regional innovation system are largely absent, and this constrains business
innovation. A minority of firms engage in firm-to-firm collaboration for innovation.
Collaboration and cooperative arrangements with universities and research
institutes are even less common.
• The sector studies revealed a lack of clearly articulated strategies for growth and
innovation at a sectoral level, and many businesses lacked such strategies as
well. Without these strategies, there is no vision of where the industries are
heading, what is required to achieve growth, and therefore a lack of coordination
in organising their resources. Little thought is given to identifying the collective
growth needs of industries at a regional level, such as infrastructure, skills and
R&D, which often required coordinated investment.
• Strong leadership and management skills are generally held to be critical to
innovation and business growth, however the study found a general lack of strong
management capability in Auckland.
• Businesses generally report good access to skilled trades people and unskilled
labour, however all firms and sectors commented that there were skill shortages,
and that recruitment of highly skilled people from overseas can be difficult. While
it is easier to recruit scientists, engineers, and mathematicians in Auckland
compared with other parts of New Zealand, the overall supply of such graduates
appears insufficient. For some large, fast growing companies, difficulties finding
skilled staff is a major constraint to growth. Relevant experience of
internationalisation and commercialisation at scale is particularly scarce.
• A further constraint on innovation and growth relates to owners and managers
who lack the drive and ambition to grow firms into larger businesses.
Interviewees indicated that New Zealanders tend to be more reactive in business
and focus on securing short-term opportunities rather than a base for longer-term
growth; these approaches to strategy and leadership constrain innovation.
Commercial In Confidence
• The picture regarding availability of capital and funding for innovation was mixed.
Few firms turn to equity to fund innovation, with the large majority relying on their
own internal sources and bank debt. At a regional level, the lack of equity capital
has been cited many times as an inhibitor of growth and innovation by firms.
However the shallowness of the market is in part due to the reluctance of firms to
use equity, the lack of experienced investors, and a perceived lack of attractive
investments.
Conclusions and Recommendations
128 The study concludes that, while Auckland has all the raw ingredients of a well-
functioning regional innovation system, the “ingredients” appear to be working in
isolation of one another. The author rates Auckland as a weak to moderate performer
in terms of innovation compared with other similar international cities.
129 The study makes several suggestions to improve Auckland’s innovation system
including:
• Strengthening linkages between firms and education and research organisations,
for example by focusing on good regional-level implementation of technology
vouchers
• Tackling industry-specific barriers to innovation, such as specific infrastructure
constraints (e.g., flexible and cost-effective commercial scale food and beverage
pilot facilities)
• Countering the risk of complacency associated with the perception that Auckland
is generally perceived to be an innovative city, through initiatives to promote
innovation more actively and publicly
• Strategies that target known problems in relation to skills supply, particularly in
relation to scarce skills in areas such as science, technology and engineering,
problems of low functional literacy and numeracy. The development of
management capability, in particular commercialisation and internationalisation
skills, should also be seen as a priority.

Commercial In Confidence
Improving our understanding of Auckland's competitiveness 45
Access to tertiary education
The Auckland Study: An assessment of tertiary education needs of school leavers in the Auckland region
Tertiary Education Commission
Scope and Purpose
130 Recent OECD analysis has shown that Auckland’s share of the working age
population with a tertiary education qualification is low compared with comparator
cities. With Auckland’s population projected to grow at a faster pace than the rest of
New Zealand, to account for almost 40 percent of the population by 2031, a skilled
and well qualified workforce is central to Auckland’s success.
131 The purpose of this study is to identify tertiary education access needs of Auckland’s
growing and diverse population. In doing so it aims to inform future investment into
tertiary education across the region.
Method
132 The study represents a descriptive analysis of student access to tertiary education in
the Auckland region, based on an analysis of population trends, various indicators of
accessibility (e.g., socio-economic status, area characteristics etc) and tertiary
participation and achievement. The study focuses particularly on tertiary education
access for secondary school students in Auckland because this group of students is
most susceptible to participation barriers and more likely to be negatively impacted by
inequitable access. Data is drawn from the census, school and tertiary participation
datasets, and a range of other education data sets (including a secondary to tertiary
transitions data set).
133 The study draws conclusions about the relationship between accessibility and tertiary
participation and success on the basis of common patterns identified in the data. No
formal modelling is undertaken, meaning observed relationships may not be causal.
Main findings
134 The main findings with respect to tertiary education access and participation can be
summarised as follows:
• Concentration of low decile schools – In 2008 the Auckland region accounted for
40 percent of New Zealand’s school students from low socio-economic
communities (decile 1 to 3 schools). Across the region, Auckland City and
Manukau City had the highest shares of low decile schools in the region (47
percent and 29 percent respectively) and the largest volume of New Zealand
students within low decile schools (24 percent and 8 percent respectively). In
Manukau City and Papakura district, 58 percent and 40 percent of the local area’s

Commercial In Confidence
students respectively attended low decile schools. Across the ethnicities,
students of Pacific ethnicity are over-represented amongst those attending low
decile schools.
• Secondary school achievement – While Auckland school students perform above
the national average overall, there is significant variation within the region and
across particular population groups. Areas with large proportions of school
leavers achieving less than NCEA level 3 are concentrated in areas that also
have high concentrations of students attending low decile schools. There are
also significant variations in school achievement by ethnicity, with 70 percent of
Māori students leaving school with at least NCEA level 1 compared with 88
percent of Europeans. Underachievement by Māori students is more marked in
Papakura and Rodney, where Māori rates of attainment of NCEA level 1 were 60
percent and 62 percent respectively. High concentrations of Asian school
students mask lower achievement by other ethnic groups in Auckland City and
Manukau City.
• Secondary to tertiary progression – Auckland has tended to follow the national
trend of increased direct progression of school leavers into tertiary education.
However, school leavers that take gap year(s) are mostly concentrated in lower
decile communities. Within these lower socio-economic communities, a larger
proportion of low decile school students are not engaging in tertiary study post-
secondary school.
• Tertiary participation – Within the region, a lower share of students from low
socio-economic communities participate in tertiary education post-secondary
school, with the proportion rising with socio-economic status. Additionally, the
difference between participation and no participation is most marked for people
from low socio-economic backgrounds.15
Socio-economic status is also reflected
in the type of tertiary participation, with a larger proportion of low decile school
leavers studying through industry training and school-based vocational education
programmes, in contrast with high decile school leavers who are more likely to
engage in provider-based tertiary study. Similarly, the majority of students from
low socio-economic backgrounds were engaged in level 1 to 3 qualifications (76
percent), while students from higher socio-economic backgrounds were mainly
studying qualifications at level 4 and above (73 percent).
• Availability - Students from low socio-economic communities were more likely to
access locally available tertiary education than other groups, highlighting the
importance of accessible provision for these communities. While Auckland is well
served as a region by tertiary education16
, the range and type of provision
available is limited for the former territorial authority areas of Franklin, Papakura,
15 However, the effect of school achievement is not disentangled from the effect of socio-economic status. 16 The region has five universities, seven TIPs, two Wananga and 91 PTEs. ITOs are also active in the region.

Commercial In Confidence
Improving our understanding of Auckland's competitiveness 47
Rodney and Waitakere. Participation rates are reflective of the geographic
location of education delivery.17
Areas that have limited local access to TEO
campus sites have proportionately less participation by the local population.
Evidence from other studies shows that the geographic location of tertiary
participation is a key determinant in the travel needs for those wishing to
participate in tertiary education (Ussher, 2006), implying areas that are more
isolated from tertiary provision will present greater access barriers.
Conclusions and Recommendations
135 The study concludes that:
• In line with previous studies, there is evidence that socio-economic factors impact
significantly on tertiary education participation
• Access to provision is limited in the most deprived and remote areas
• There appears to be under-investment in tertiary education provision in Auckland
on the basis of current funding levels and anticipated growth in the population.
136 The study calls for:
• Targeted vocational and foundation level training opportunities to assist and
encourage those with no formal qualifications to re-engage with the tertiary
system, especially in high deprivation areas of Waitakere City, Manukau City and
Papakura District
• Collaborative contribution between local providers in the region to form a
cohesive and pathway focussed programme of delivery that encourage and
engages local students
• TEOs to take a stakeholder focussed approach to identifying and addressing the
needs of communities, learners, industry and other stakeholders
• Initiatives that facilitate access, engagement and success of all students in the
tertiary environment, especially those from socially deprived backgrounds and
those most disengaged with tertiary education.
17 The paper notes that population base participation rate has limited applicability as it does not account for student
mobility.
Commercial In Confidence
3. Integrated analysis
137 This part presents an integrated perspective of the research, drawing out the common
themes and identifying what it tells us about the city-region’s economic performance
and the key issues affecting Auckland’s competitiveness.
138 The broad nature of the studies reviewed represents a challenge for identifying
common findings across the studies. Where relevant, we supplement the discussion
with references to other relevant data and research not within the scope of the studies
considered in part 2.
Auckland’s economic performance and drivers
139 Across the suite of research papers, there is a large quantity of information on
Auckland’s comparative economic performance, including benchmarking of its
performance on key drivers of economic performance and city competitiveness.
140 Auckland generally compares favourably in terms of economic performance when
compared with the rest of New Zealand. Recent data shows that Auckland has
significantly higher GDP per capita and real wages than other New Zealand locations,
and a higher share of employees in high value-added industries.
141 The difference in productivity between Auckland and New Zealand as a whole – the
Auckland premium – is in the middle of a sample of OECD metropolitan regions,
suggesting Auckland is contributing as might be expected to New Zealand’s
productivity.18
142 Reflecting Auckland’s attractiveness and competitiveness, the region’s population has
grown strongly relative to the rest of New Zealand and at relatively high rates by
international standards. Much of this growth has come from net international
migration.
143 The research shows that Auckland has cemented its role as New Zealand’s core city
over the last two decades, playing several key national roles:
• International gateway for air travel
• National goods distribution centre
• Hub for knowledge-intensive and specialised business services.
18 Ministry of Economic Development, The Treasury, Statistics New Zealand (2011).

Commercial In Confidence
Improving our understanding of Auckland's competitiveness 49
144 From a domestic perspective, Auckland’s relative economic progress has been strong
although there are some concerning developments, notably its relative decline in
medium- and high-tech goods manufacturing. While this trend is consistent with a
broader (relative) decline in manufacturing across Australasia, it has been particularly
marked in Auckland. By contrast, other smaller regional centres (in particular
Christchurch and Hamilton) appear to have maintained their shares of medium- and
high tech manufacturing. Of course, an alternative interpretation is that Auckland has
grown its manufacturing base in absolute terms, but its growth in other industrial
segments – particularly services – has been stronger.
145 In terms of international competitiveness, Auckland compares favourably on quality of
life but only moderately on key economic performance and competitiveness
measures. The key findings of the research include:
• Auckland’s level of GDP per capita is slightly lower than most of the international
comparator cities chosen, but substantially lower than the (predominantly large)
cities with the highest GDP per capita. For example, Auckland ranked 84th out of
116 metropolitan regions on GDP per capita.19
• Auckland offers a high quality of living by international standards. For example,
Auckland was fourth equal out of 221 cities, and higher than all of the comparator
cities other than Vancouver, in the Mercer Worldwide Quality of Living Survey.
• Auckland’s recent population growth has been relatively high by OECD
standards, driven in part by high levels of inward international migration.
• Auckland is New Zealand’s core city but is peripheral relative to
Sydney/Melbourne, large Asian cities and other major global cities.
• Auckland’s share of employment in knowledge-intensive services is in the middle
of a group of similar European cities, and above Australian and most New
Zealand cities, but its share of employment in medium- and high-tech
manufacturing is relatively low.
• Auckland is the dominant New Zealand location for new overseas direct
investment, although its overall level of FDI is comparable with other small
regional economies internationally.20
19 Economic Development Indicators 2011 report, as reported in Market Economics (2010). 20 Knowledge Matrix Asia Pacific Ltd, with BERL, IMSED and PricewaterhouseCoopers (2009).
Commercial In Confidence
City-region sources of advantage
146 A core objective of a number of the studies in the research programme was to shed
light on possible drivers and factors underpinning Auckland’s current and future
competitiveness. Looking across the suite of studies and other recent research, the
key findings in relation to Auckland’s sources of economic advantage21
are as follows:
• Deep, specialised labour markets and relatively greater ability to attract and retain
higher skilled staff compared with other New Zealand city-regions
• Large population base, which represents a large potential market for most
industries
• Major international gateway for goods, services and people. Approximately 61
percent of the nation’s imports and 32 percent of its exports are processed
through these ports
• Major processing and distribution centre for the top-half of the North Island and
the place where much of New Zealand’s raw produce is processed into value-
added goods, packaged and marketed
• New Zealand’s major commercial hub, with nationwide strengths in certain
knowledge-intensive and specialised business services. Auckland is home to
more than 2/3 of the country’s top 200 companies
• Economic specialisations in key value-adding industrial segments:
– food and beverage processing
– niche manufacturing (e.g., health technologies, electronic and electrical
equipment, boat building etc)
– high value services (e.g., finance, property and business services, goods
distribution, screen production and creative industries, tourism and export
education).
• Centre of New Zealand’s capital market activity and home to most financial
institutions and investment banks
• New Zealand’s largest and most specialised education and research centre.
Downtown Auckland’s CBD Learning Quarter hosts a significant proportion of
New Zealand’s university students
• High quality educational and research institutions that house some of the
country’s most valuable intellectual property and innovation infrastructure
• One of the most diverse populations of any international city, which represents a
significant potential asset
21 Many of the sources of advantage are particularly relevant in relation to domestic comparisons. Some, particularly
scale related advantages, are less clearly advantages relative to international comparators.

Commercial In Confidence
Improving our understanding of Auckland's competitiveness 51
• Auckland’s scale means it has the potential to offer world-class facilities (e.g.,
stadia, arts and cultural facilities, cruise ship terminal, unique waterfront etc)
• Auckland’s core infrastructure generally compares favourably with domestic and
international comparators, although there is significant need for ongoing
investment in transport, broadband and some challenges associated with ageing
council services
• Ample geographical scope for future growth, although challenges in terms of
achieving the right mix of conventional density and intensive development, and in
avoiding land constraints from further driving up house prices and constraining
expansion of industrial activities
• Strong creative sector, with relative strengths in television, film and video, design
and publishing, and digital media
• Outstanding natural amenity, particularly its harbours and regional parks, offering
significant tourism potential
• High quality of life and reputation as a safe and accepting place for migrants
• Relatively low traffic congestion, although this increasing and is estimated to cost
the region between $750 and $900 million per annum22
• City-region sources of disadvantage.
147 The research also highlighted a number of issues or relative weaknesses in
Auckland’s competitiveness:
• An innovation system that is not functioning as well as it could, in particular in
terms of its ability to commercialise new technology and ideas at scale
• Lack of progress in achieving residential intensification and constrained land
supply for both residential and industrial uses
• Some specific infrastructure constraints, particularly in relation to water services,
broadband and transport
• Social disparity - In 2006, 32 percent of the regional population lived in areas
rated deciles 8, 9 and 10 (most ‘deprived’). Deprivation is concentrated in
specific areas, mostly in the west and south of the region. Deprived areas
represent inter-generational concentrations of poverty, poor skills and a raft of
other issues (e.g., poor health, high crime) that lead to underutilisation of human
capability and acts as a brake on productivity growth and living standards.
22 Ministry of Economic Development (2010) Economic Development Imperatives.

Commercial In Confidence
• Low export intensity - The importance of exports to the Auckland economy is low
relative to the rest of New Zealand, and declined from 11 percent of GDP in 2001
to 9 percent in 2008.23
In addition, despite hosting almost 70 percent of all
international visitor arrivals, the region’s share of commercial accommodation
guest nights is less than 20 percent.24
• Distance from major markets – Auckland’s distance from major international
markets is a disadvantage for firms on a range of levels, including representing
an obstacle to exporting and innovation, as well as making it more difficult to
attract scarce labour and capital.
• City-branding – while Auckland compares relatively favourably on a global stage,
ranked at 19th out of 40 cities according to the 2007 Anholt City Brand Index,
research criticised a lack of presence, exposure and attraction power associated
with Auckland’s city brand.
• Literacy and numeracy– Previous research has identified problems with
foundational skills, including poor literacy and numeracy, which are a major
obstacle to upgrading workforce skills. Over 40 percent of Auckland adults have
low literacy and just over 50 percent have low numeracy.25
Poor literacy and
numeracy are more prevalent in Auckland’s Māori and Pacific communities and in
deprived neighbourhoods. This is a significant constraint on productivity in some
sectors.26
• Tertiary education attainment – Although the workforce as a whole is marginally
better qualified than the rest of the country, available international comparative
data suggests Auckland had a low share of population with a tertiary qualification
compared with comparator cities although this may have changed in recent years
with significant growth in the proportion of the working age population who are
tertiary qualified.27
Attainment levels vary widely across the region and
attainment levels, with Māori and Pacific school leavers in particular under-
23 Market Economics (2010) Understanding Auckland’s Role in New Zealand’s Global Engagement: Exports of
Merchandise Trade and Services. 24 Auckland Tourism, Events and Economic Development Ltd, International Visitor Arrivals Monitor and Commercial
Accommodation Monitor, downloaded from http://news.aucklandnz.com/ on 28 March 2011. Data is for year to
December 2010. 25 COMET (2010) 26 MartinJenkins (2008) reports that senior construction sector leaders consider low literacy and numeracy as one of
the single biggest factors influencing productivity in the industry. Estimates of rework in the building industry range
between 3-5% of the total value of construction work, much of which is attributed to a lack of basic education and
training. 27 The most recently available international comparative data on tertiary attainment for Auckland against comparator
cities was reported in the 2007 Economic Development Indicators report. The 2011 Economic Development
Indicators report shows that the proportion of New Zealanders with a tertiary qualification has grown over the last
decade, particularly the sub-group with degree and post-graduate qualifications. For New Zealand overall, the
percentage of the population aged 25-64 with a bachelor’s degree or higher was above the OECD mean in 2008.
Commercial In Confidence
Improving our understanding of Auckland's competitiveness 53
achieving in parts of Auckland.28
Tertiary participation is negatively influenced by
socio-economic factors and access to provision is limited in the most deprived
and remote areas of Auckland.
• Issues with housing supply and the performance of the housing market represent
a threat to the city’s competitiveness and attractiveness to new migrants. This is
explored further below.
• Shallow capital markets limiting access to capital, although this in part reflects a
lack of aspiration for growth and, therefore, low demand for risk capital from firms.
• Lack of global scale – while Auckland’s large scale relative to other New Zealand
cities is an asset, by global standards it is small. According to Demographia,
Auckland is the 181st largest city in the world in terms of population size. The
lack of scale has a raft of implications, not least that it leads to a bigger step for
firms wishing to internationalise.
• Constrained land supply, both residential and business, as a result of zoning -
Several recent studies have shown that the supply of business land in Auckland
is constrained, particularly for industrial uses, and the mix of residential land
supply also raises concerns about adequacy of supply.29
While land supply
appears adequate when expressed in years to exhaustion, there is potential for
bottlenecks.
• Mobile population - Entrants into Auckland display characteristics of mobile
populations (e.g., young, more likely to rent, more highly qualified, less likely to
be full-time employed, more likely to be single without dependents). Further,
Auckland has a relatively young population and a large share of overseas born
residents. This represents a threat to Auckland if it fails to retain its
attractiveness and competitiveness.
Further evidence of agglomeration forces at work
148 A number of previous studies have attempted to assess the extent of agglomeration
externalities in Auckland and found evidence of positive agglomeration effects, albeit
modest in magnitude.30
The most recent work finds that average labour productivity is
30 percent to 50 percent higher in the Auckland region (compared with the rest of
New Zealand) while the central business district has a premium of 120 percent to 150
percent.31
On the basis of these estimates, Auckland’s growing population offers
further potential for labour productivity gains. Maré (2008) estimates that doubling the
28 The challenge of improving Māori and Pacific students’ educational attainments is a particular challenge for
Auckland, as Auckland is home to 66% of the Pacific Population (around 15% of Auckland’s population) and 1 in 10
Aucklanders is Māori (although just over 24% of New Zealand’s Māori resides in the Auckland region ). 29 See, for example, Harrison Grierson and Market Economics (2008) and Sapere (2011). 30 See, for example, Ascari Partners (2007), Maré and Timmins (2006), Lewis and Stillman (2005) and Maré (2008). 31 Maré (2008.

Commercial In Confidence
density of Auckland’s population would increase labour productivity by up to 8.6
percent.32
149 The studies considered in this research synthesis provide further evidence of
agglomeration benefits, although the results are somewhat weaker than expected in
light of previous research results for Auckland.33
For example:
• Studies of household and firm location confirm the tendency for land prices to
decline with distance from the central city, while noting that there remains
considerable heterogeneity in land values at any given distance from the city
centre
• Households in particular exhibit a strong willingness to pay a premium to be
located close to the CBD, with this effect strongest for high income/high
qualification (including returning New Zealanders) households, possibly reflecting
ability to pay
• While the evidence from the firm location determinants research generally fails to
find strong evidence of agglomeration benefits, there is some evidence of
industrial diversity and localisation benefits for a small number of specific
industries, and a CBD premium for the business services sector
• Qualitative evidence confirms the importance and value of Auckland’s scale, with
particular benefits associated with:
– Deep, specialised labour markets
– Large domestic market size.
150 The research into Auckland’s comparative performance on knowledge intensive
economic activities is of particular interest in terms of shedding light on the operation
of agglomeration forces at different scales. Broadly, at an international scale the
evidence generally suggests that the forces of agglomeration are leading to a shift of
high value activities (and associated labour and capital) away from New Zealand cities
(including Auckland) toward large Australian cities. Countering this, the dominant role
of Auckland in a New Zealand context means that the same forces are leading to
Auckland’s increasing dominance in New Zealand, and the shift of high value activities
(particularly services) away from other New Zealand city-regions towards Auckland.
32 Op Cit. 33 One possible reason for the relatively weak results is the coarse level of industry disaggregation (24 industries) that
was used in the business location work. As a result, the analysis may fail to pick up agglomeration benefits
associated with clustering that are specific to more detailed industries (e.g., marine). More finer grained analysis
may be unlikely to yield improved results however because of small sample sizes.

Commercial In Confidence
Improving our understanding of Auckland's competitiveness 55
Anticipating and influencing future patterns of spatial development
151 Auckland’s population has grown significantly over time and the patterns of
development have evolved in response to a range of factors within the constraints
posed by zoning and Auckland’s unique topography. Between 1956 and 2006,
Auckland’s population trebled from 400,000 to 1.2 million. Four-fifths of this growth
occurred outside of the central area of Auckland.
152 As a result of development patterns over many decades, the city has evolved from
mono-centric to poly-centric form, characterised by many subsidiary sub-centres.
Except for the central area of Auckland, where a relatively high proportion of workers
commute from outside the area, most Aucklanders work in the same part of the city in
which they live.
153 Various studies in part 2 have sought to understand what has influenced these
historical development patterns, in order to better inform our ability to anticipate and
influence future patterns of spatial development. In theory, at the level of the
individual household, the interplay of income, transport costs, locational convenience
(i.e., proximity to frequently used amenities) and other neighbourhood characteristics
all influence where individuals choose to live. The empirical challenge is in
disentangling the relative importance of these factors. While the studies discussed
below each aim to explore different aspects of spatial development patterns, and
adopt a variety of different methods, the results are broadly consistent.
Amenities
154 The research finds strong evidence that amenities matter for households location
decisions. Households are prepared to pay a premium to locate in areas with “good
amenities”. The evidence is strongest for those households with high incomes and
high qualifications, perhaps indicating ability to pay.
155 Unfortunately, the research fails to identify the specific amenities that matter most.
One of the reasons is that most parts of Auckland are relatively well served in relation
to the most frequently used amenities (e.g., schools, shops, motorways etc). It is only
in relation to relatively scarce amenities, such as stadia, the sea and air ports, and
views of the sea, that specific locations become significantly differentiated. In
addition, the studies considered in part 2 do not attempt to measure differences in the
quality of amenities, meaning the studies explore only crude measure of accessibility
and convenience (i.e., the distance to an amenity). A final complication, is that the
demand for and provision of amenities does not operate at an individual amenity level
but rather at a bundled level. This makes it difficult to isolate the attractiveness of any
given amenity. It also makes it harder for government to decide what specific
amenities to provide.

Commercial In Confidence
156 It is widely believed that investment in public amenities (e.g., public art galleries,
museums, performance venues, open/green spaces, sports stadia and the like) are
magnets for skilled labour and firms. Public amenities undoubtedly contribute to city
liveability but there is a long-bow between the provision of public amenities and
improvements in aggregate economic growth. International evidence has failed to
demonstrate consistent evidence of a positive association between public amenities
and economic growth, except in the largest global cities.34
157 One key insight from the research programme is that the distance to work, is not a
dominant (or even a particularly significant) factor in household location decisions.
This is because households are usually made up of more than one individual, with
different members typically having different employment locations, workforce statuses
and travel patterns. Much household travel is non-work related and is associated with
trips for shopping and personal business.35
While accessibility to transport networks
rates as significant in qualitative research, it does not necessarily imply that people
are naturally drawn to live close to where they work. These findings contrast with the
significant weight often attributed to this factor in arguments supporting public
transport, although the main constraint on the transport network is the morning peak
travel period, when the main trip purposes are travel to work and places of education.
158 As noted by Coleman and Maré (2010):
The results of the research emphasise that the quality or combination of local
amenities is likely to be much more important than the simple availability of
amenities. As a consequence, changes in any specific amenity in isolation will
not necessarily lead to a significant change in either land prices or attractiveness
of the location, (i.e., changes in the probability of people locating in the area).
Residents are attracted to areas that offer a package of amenities that best suit
their needs and budget. This suggests the provision of infrastructure,
coordination and planning of Auckland future residential development needs to be
based on an integrated view of the various dimensions of local area
attractiveness, including not only the desirability of facilities, but the willingness
and ability of different groups to pay for them.36
34 Hansen and Winther (2010). 35 Between 2006 and 2009, the average New Zealander spent 7-8 hours per week travelling, and travelled 230 km per
week (Ministry of Transport, 2010a, 2010b). Eighty percent of this travel was undertaken in cars, 10 – 15 percent as
a pedestrian, and 4 percent on public transport. Travelling to work accounted for approximately 16 percent of this
time, and travelling for an employer a further 10 percent. Most of the remaining three-quarters of the time spent
travelling was for shopping and personal business, social visits and recreation, or while accompanying someone
else somewhere, often a child. 36 Coleman, A and Maré, D. C. (2010).

Commercial In Confidence
Improving our understanding of Auckland's competitiveness 57
159 The empirical results suggest amenities are more important in determining location
choices of households than firms. However, firms do strongly value access to a deep
pool of labour. To the extent that amenities are a significant part of what draws people
to a city-region (alongside other factors such as employment opportunities, the climate
and natural landscape, living costs etc), then firms indirectly value the provision of
amenities and benefit from their provision.
Own-group Attraction
160 Perhaps the most interesting insight from the research into spatial patterns of
development is the strength of own-group attraction.
161 The research found significant clustering by ethnicity and country-of-birth, after
accounting for other socio-economic factors and controlling for potential differential
sub-group attraction to amenities. The clustering effects were strongest for Pacific
people, and to a lesser extent for people of Māori and Asian ethnicity. The results
strongly suggest that clustering is occurring along social lines.
162 While clustering is common across these groups, the patterns of clustering are quite
different, with implications for future patterns of development. In particular, the
population characteristics of an area have a significant influence on location choices,
perhaps more so than differences in local amenities. This strongly implies that future
spatial patterns of population distribution in Auckland will depend on the
characteristics of new entrants into Auckland.
163 At the same time, this finding makes it difficult to anticipate or predict future spatial
patterns because: it is difficult to anticipate the composition of migrants into Auckland;
and small differences in initial conditions (e.g., a random cluster of people with
particular characteristics) can lead to significantly different future spatial patterns.
164 Evidence suggests a relatively weak relationship between transport accessibility and
firm/household location decisions, although certain industries benefit from close
proximity to the motorway (e.g., retail and accommodation). Similarly, the transport
and distribution sector benefits from proximity to airport and seaport.
Housing needs and aspirations
165 Housing matters for economic performance because, for most households, housing
costs (and associated travel costs) represent a significant proportion of household
expenditure. Consequently, housing affordability is an important determinant of the
cost of living and, therefore, the relative attractiveness (competitiveness) of a region
for employment. The quality and mix of housing available are also factors that
households consider when choosing where to locate.

Commercial In Confidence
166 The Beacon Pathway study highlights a number of significant issues with Auckland’s
housing market including:
• an under-supply of housing generally, and entry-level housing in particular,
following the global financial crisis and the collapse of development finance
• the un-affordability of home ownership and increasing levels of rental stress and
crowding
• the insecurity of rental tenure and the poor condition of many properties in the
rental market
• widespread dissatisfaction with the design of multi-unit dwellings, their titles and
the spaces in which they are sited
• poorly designed and implemented residential intensification.
167 Related to the above, previous research has noted a degree of tension between
housing affordability and ambitions for a compact urban form.37
Among other things,
studies have highlighted concerns about the composition of Auckland’s residential
land supply, noting in particular the relatively low supply of conventional density land
inside the Metropolitan Urban Limit.38
168 However, a balanced approach to consideration of the role of urban limits needs to be
taken. On the one hand, the very purpose of an urban limit is to constrain land
availability, with consequential price rises performing a ‘signalling’ role in incentivising
alternative (more land intensive) housing choices. Further, urban limits can support
efficient and effective delivery of infrastructure. In addition, many factors other than
urban planning influence the cost and availability of housing so the contribution of
urban limits to rising housing costs needs to be kept in perspective.
169 On the other hand, there is a risk that rising house costs may encourage households
to locate elsewhere rather than encouraging intensive living. This may particularly be
the case if the market is not perceived as offering good quality intensive housing
solutions.
170 The research suggests that the Auckland Council needs to carefully consider the
nature and application of urban limits (alongside related instruments and strategies) in
support of desired patterns of urban growth.
37 Grimes and Liang (2007). 38 Harrison Grierson and Market Economics (2008).
Commercial In Confidence
Improving our understanding of Auckland's competitiveness 59
Transportation
171 While the most convincing evidence of the causal effect of transport infrastructure
investment on residential location patterns comes from historic studies of highway
development (Baum-Snow, 2007), many studies have established a correlation
between local land prices, population density and access to transport facilities.
Several of the studies in part 2 examine the role of access to transport networks in
determining spatial location patterns.
172 The studies examining the determinants of population location found little evidence of
a specific role for access to transport (i.e., proxied by distance to the nearest
motorway ramp, the nearest railway station, the sea and air ports). The authors find
this surprising given the commonly accepted importance of transport accessibility. It is
particularly surprising because of the very fine spatial scale of the analysis, which
should improve the chances of detecting the attractiveness of local amenities.
However, as noted above, the coarseness of the amenity measures (e.g., failing to
pick up transport congestion, or differences in frequency of public transportation) may
mask any significant effects. The study of housing preferences and needs of younger
Aucklanders suggests that access to public transport is a factor in housing choice, but
only one of many factors taken into account. In addition, it is common for the
individuals who make up households to have very different transport patterns, which
complicates analysis of household transport accessibility.
173 The studies of business location determinants find some evidence that transport
accessibility plays a role for some industries. In particular, proximity to the airport has
a significant influence on location choice for transport firms, proximity to the sea port
has a significant influence for the wholesale industry, and shorter distances to
motorways are positively associated with productivity in the retail and accommodation
industries.
174 A key question for Auckland is how and to what extent would transport infrastructure
investments shape Auckland’s future patterns of spatial development. Two studies
explore this by attempting to examine the impact on land prices of planned upgrades
to the rail network, as well as various extensions over time to the motorway network.
Both studies suggest that transport investments have generated significant gross
benefits. In the motorway case, the investments have also significantly influenced
patterns of spatial development in the Auckland region. It remains to be seen to what
extent the rail upgrade leads to similar magnitudes of benefit:cost.

Commercial In Confidence
Auckland and the upper half of the North Island
175 The studies provide useful insight into the importance of economic linkages between
Auckland and other major urban areas in the upper half of the North Island. Aside
from significant freight linkages (particularly between Auckland and Tauranga, the
research suggests that , the degree of economic inter-linkage between Auckland,
Hamilton and Tauranga is negligible (Ascari et al, 2010). Outside of the highly
specialised parts of financial and business service sectors, where Auckland serves a
wider (in some cases national area), the three city economies effectively operate as
independent economic centres.39
By the standards of international city-systems,
Auckland, Hamilton and Tauranga are economically distant.
176 The findings of the Auckland Research Programme are consistent with Covec (2008),
which reports that the causal linkages between the Auckland regional economy and
the rest of New Zealand are relatively weak, with little evidence of positive spin-offs
from Auckland to the rest of the country. Covec argues that the relatively weak inter-
dependence may be explained, in part, by the fact that New Zealand’s major goods
exports remain primary products. They also suggest that the weak linkages imply that
Auckland’s key economic strengths (e.g., its greater international connectivity, its
major air and sea ports, its pool of talent and its strengths in research and education)
are not being fully harnessed for the benefit of New Zealand.
177 While noting that additional road and rail capacity is likely to be required due to
projected increases in freight volumes between Auckland and Tauranga, the results
imply that improving accessibility within cities, particularly for Auckland, is likely to
have greater economic impact than improving accessibility between cities. The
modelling by Ascari et al (2010) suggests that, for a given level of economic
development investment, a focus on growing Auckland, rather than spreading
investment across Auckland, Hamilton and Tauranga, would be likely to generate the
greatest economic benefits.40
39 The primary economic role of Tauranga and Hamilton is in serving their regional hinterlands, although Hamilton has
developed some significant economic specialism’s. 40 The study did not explain the approach to modelling in detail so caution is suggested with the future forecast results.
Commercial In Confidence
Improving our understanding of Auckland's competitiveness 61
Unrealised innovation potential
178 Innovation is the ultimate source of sustainable increases in per capita incomes and is
the means by which firms and industries enhance their competitiveness, a key enabler
of labour productivity growth.
179 The research findings suggest that Auckland is a moderate performer compared with
other international city-regions. For example, the level of patent applications per
capita is relatively low by international standards (but high compared with other New
Zealand regions) and exports of knowledge intensive goods and services are also
relatively low.
180 The main diagnosis appears to be that ‘While Auckland essentially has the raw
ingredients of a well functioning regional innovation system, the ingredients are
working in isolation of one another.’41
Specific issues range from ineffective
mechanisms for commercialising research through to a relative lack of key supports,
such as industry-based science of business parks.
181 The research suggests that Auckland has considerable innovation strengths and
opportunities on which to build including:
• the significant innovation and entrepreneurship facilities provided by the city’s
tertiary education institutions, Crown research institutes, and other research and
commercialisation organisations
• Auckland is the home of New Zealand’s fledgling risk capital markets, including
most venture and angel investors
• the region has a number of specialisations in high-tech services and goods
manufacturing sectors that support and contribute to innovation (e.g., film, marine
etc)
• Auckland’s international connectivity and diverse population base gives it
significant potential to leverage knowledge of international markets.
182 Realising Auckland’s innovation potential relies on both competition and cooperation
between firms. Indeed, in firms focused on growing exports and internationalising
businesses rather than exploiting the domestic market arguably have more to gain
from cooperation than competition. Yet Ascari et al (2009) suggest that firms are
reluctant to engage in cooperative ventures.
41 Chen (2011).

Commercial In Confidence
183 A particularly useful contribution of the research is that it applies a sectoral lens as
well as a geographical one. This is important because different industries and sectors
have different models of innovation and, therefore, place-based innovation systems
are best considered at a sector specific level. Further sector-specific research is likely
to be needed in the future to better inform our understanding of innovation system
performance and opportunities for improving commercialisation. Action research with
a solutions focus might also be considered.
The elusive nature of specific insights into city competitiveness
184 The research considered in this synthesis has explored a wide range of factors that
influence city competitiveness. A key aim was to isolate the specific factors that
matter most. On that score, the research has largely failed to pin down the relative
importance of factors such as housing quality and affordability, amenities (public and
private), transport accessibility, climate and natural environment, the built
environment, employment opportunities etc.
185 The spatial econometric studies by Motu, while potentially powerful, were hampered
by a number of factors which may limit the benefit from such work in future unless
these issues can be resolved. Key challenges relate to the fact that:
• Amenities interact and are collinear making it difficult to isolate the effects of
specific locational attributes
• Data on amenity quality is not readily available.
186 The lack of policy relevant findings raises questions about how best to approach the
collection of evidence on these issues in the future.

Commercial In Confidence
Improving our understanding of Auckland's competitiveness 63
4. Implications and recommendations
187 We present the implications of the research in two main ways:
• First, we ask what this research tells us about how we should think about
Auckland’s competitiveness, including to what extent these conclusions apply to
other urban centres
• Second, we discuss the specific implications for policy, economic strategy and
spatial planning in the Auckland region that flow from the research and the
application of the framework for city competitiveness.
188 We conclude with suggested next steps and recommendations.
How should we think about Auckland’s competitiveness?
189 International evidence suggests that large, outward-facing, global cities are playing an
increasingly important role in driving economic development.42
With more mobile
populations, national economic fortunes increasingly depend on competition between
cities for highly talented people, innovative firms and investment. While in this sense
cities compete, there is a lack of consensus on what factors matter most for city
competitiveness.
190 At the commencement of the Auckland Research Programme, Grimes (2007)
reviewed the urban economics literature and identified the following characteristics
and experiences of successful cities.
42 OECD (2006) and Parkinson et al (2004).
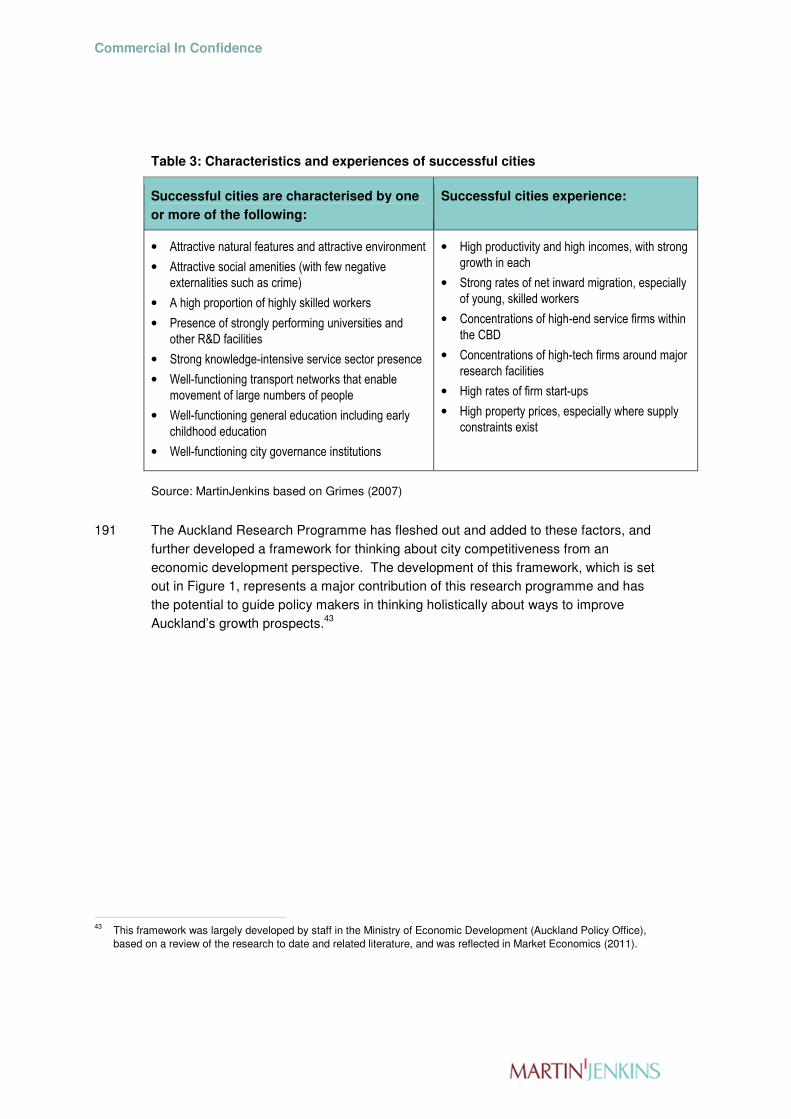
Commercial In Confidence
Table 3: Characteristics and experiences of successful cities
Successful cities are characterised by one
or more of the following:
Successful cities experience:
• Attractive natural features and attractive environment
• Attractive social amenities (with few negative
externalities such as crime)
• A high proportion of highly skilled workers
• Presence of strongly performing universities and
other R&D facilities
• Strong knowledge-intensive service sector presence
• Well-functioning transport networks that enable
movement of large numbers of people
• Well-functioning general education including early
childhood education
• Well-functioning city governance institutions
• High productivity and high incomes, with strong
growth in each
• Strong rates of net inward migration, especially
of young, skilled workers
• Concentrations of high-end service firms within
the CBD
• Concentrations of high-tech firms around major
research facilities
• High rates of firm start-ups
• High property prices, especially where supply
constraints exist
Source: MartinJenkins based on Grimes (2007)
191 The Auckland Research Programme has fleshed out and added to these factors, and
further developed a framework for thinking about city competitiveness from an
economic development perspective. The development of this framework, which is set
out in Figure 1, represents a major contribution of this research programme and has
the potential to guide policy makers in thinking holistically about ways to improve
Auckland’s growth prospects.43
43 This framework was largely developed by staff in the Ministry of Economic Development (Auckland Policy Office),
based on a review of the research to date and related literature, and was reflected in Market Economics (2011).
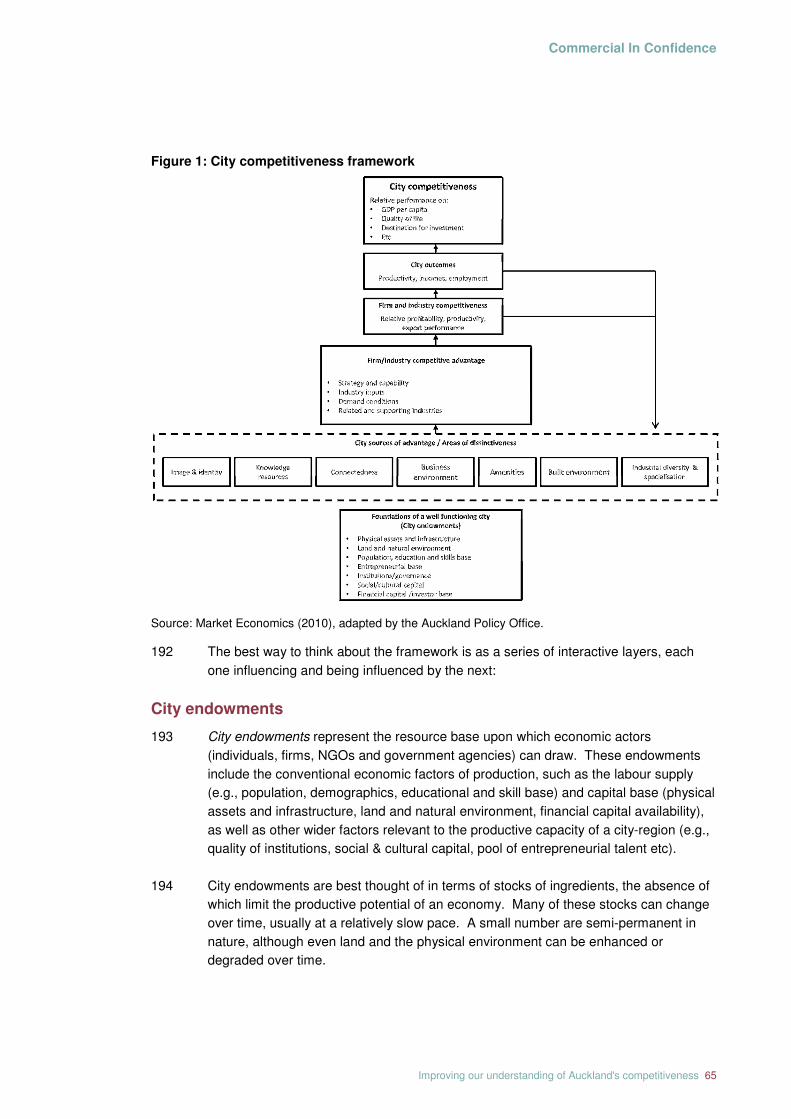
Commercial In Confidence
Improving our understanding of Auckland's competitiveness 65
Figure 1: City competitiveness framework
Source: Market Economics (2010), adapted by the Auckland Policy Office.
192 The best way to think about the framework is as a series of interactive layers, each
one influencing and being influenced by the next:
City endowments
193 City endowments represent the resource base upon which economic actors
(individuals, firms, NGOs and government agencies) can draw. These endowments
include the conventional economic factors of production, such as the labour supply
(e.g., population, demographics, educational and skill base) and capital base (physical
assets and infrastructure, land and natural environment, financial capital availability),
as well as other wider factors relevant to the productive capacity of a city-region (e.g.,
quality of institutions, social & cultural capital, pool of entrepreneurial talent etc).
194 City endowments are best thought of in terms of stocks of ingredients, the absence of
which limit the productive potential of an economy. Many of these stocks can change
over time, usually at a relatively slow pace. A small number are semi-permanent in
nature, although even land and the physical environment can be enhanced or
degraded over time.

Commercial In Confidence
195 Relative differences in the size, composition and ‘quality’ of these endowments can
lead to differences in economic performance over time.
City sources of advantage / Areas of Distinctiveness
196 City sources of advantage represent the intrinsic features of a city that help to define
its uniqueness or distinctiveness, and which form the basis for inter city-region
sources of competitive advantage (or disadvantage). The key elements, listed below,
have been identified and discussed in the literature, with principal contributions by
Turok (2004; 2007) and Lee (2007).
• Image & Identity – refers to the city-region’s reputation and perceived importance
as a place to live, work and do business. It is important for the enticing people
with skills, ideas and capital to the city. While public perceptions are influenced
by a range of factors, most city-regions deliberately attempt to manage or shape
particular images and brands. Often these draw on unique features of the city-
region’s identity, which in turn stem from the societal, environmental and cultural
features of the city-region.
• Knowledge resources – refers to the distinctive sources of knowledge within a
city, as embodied in people, their occupations and skills. It includes all aspects of
know how and know who, and includes both tacit and codified knowledge, skills
and experience. Distinctive characteristics at the city-region level may include
the level of skilled migration, the proportion of the workforce in knowledge
occupations, the proportion of the labour force with higher education
qualifications, the reputation and quality of higher education institutions and the
strength of linkages between researchers and business.
• Connectedness –refers to communication, trade and transportation links that
exist between a city-region and other places. There are at least three major
aspects including international connections, domestic connections with other city-
regions, and intra-regional connections.
• Industrial diversity and specialisation – agglomeration economies are a defining
feature of a city and encompass two key elements: concentration of industries
(i.e., clusters of businesses in the same industry) which generate ‘localisation
economies’ and industrial diversity, which generate ‘urbanisation economies’
resulting from a greater scope of interactions made possible due to large diverse
labour supply, range of suppliers and larger markets.
• Amenities –refers to a range of attributes that are important for the well-being of
residents and make a city-region a desirable place to work, visit and do business.
Amenities may include commercial facilities, educational, health, cultural and
sporting facilities, the natural environment and open spaces, and other publicly
provided facilities.
Commercial In Confidence
Improving our understanding of Auckland's competitiveness 67
• Built environment – the built environment encompasses all features of physical
space that are not naturally occurring, including urban form, land-use, and
commercial, residential and industrial structures. It also encompasses the
capacity and reliability of transport modes, congestion levels, broadband
availability, office and housing availability and perceptions of the quality of
architecture and urban design.
• Business environment – this refers to aspects of the city that contribute to the
ease of doing business, such as local bylaws, planning and resource
management, and building regulations and other local aspects of the institutional
environment that affect the conduct of commercial activities.
197 There are several points to note in relation to the ‘city sources of advantage’ layer of
the framework:
• Each element is significant and complex in its own right and, therefore, each
element should be seen as containing several more detailed elements (e.g., as
noted above, connectedness has at least three crucial sub-elements). It would
be possible to develop ‘higher definition’ versions of the diagram but this would
result in a loss of presentational clarity.
• While each element is shown separately in the framework, there are important
inter-linkages and relationships between them; they should not be interpreted as
unrelated. Nor are they necessarily distinct from the city endowments layer –
persistent differences in city endowments can be a source of advantage or
disadvantage (e.g., significant differences in the underlying population or skill
base of a city-region).
• The organisation of these elements do not necessarily lend themselves to the
diagnosis of policy problems in a straightforward way. For example, one policy
problem is Auckland’s relatively weak innovation performance. Analysis of the
reasons for this problem suggest weaknesses in relation to several elements of
the framework (e.g., image & identity, knowledge resources, connectedness,
industrial specialisation etc).
• The above limitations besides, this layer of the framework represents a key focus
for policy makers. That is, a key issue relates to the extent to which city sources
of advantage and areas of distinctiveness can be created and/or enhanced
through policy. We return to this question later in this section.

Commercial In Confidence
Firm/industry competitive advantage
198 Ultimately, it is firms that undertake economic production, and the industrial structure
and composition of an economy that determines aggregate output and economic
growth. Of relevance to this framework of city-competitiveness is that, while many of
the factors that determine and influence firm/industry competitive advantage are
idiosyncratic or unique to the firm, they are also underpinned by city endowments
(e.g., the depth of the labour market) and city sources of advantage (e.g., the
attractiveness of the city to highly skilled workers).
199 Drawing on Porter’s (1990) ‘diamond’ model of the competitive advantage of nations,
the framework identifies the following four sources of firm/industry competitive
advantage:
• Strategy and capability –firms’ strategies, management and business practices
and how firms are organised to compete in the marketplace
• Industry inputs –the quality and quantity of factor endowments available for
specific industries including physical resources, human resources, knowledge
resources and financial capital
• Demand conditions – the sophistication of local consumer and intermediate
demand, the degree to which the local market sets demand trends and strength
of the links with international customers
• Related and supporting industries – competitiveness of products and services is
dependent on presence of well-connected, competitive support industries.
200 From a policy perspective, this layer provides important policy context but is less
directly amenable to policy intervention. Possible exceptions include assistance to
exporting firms to better understand demand conditions in offshore markets, to build
their strategic capability, and to develop inter-industry linkages. A further possible role
for government is the facilitation of localisation-related agglomeration benefits.
Firm/industry competitiveness, city outcomes and city competitiveness
201 These layers of the framework all have in common the measurement of performance
outcomes, albeit at different levels.
202 At the level of firm and industry competitiveness, there are a wide range of indicators
of firm and industry performance (e.g., profitability, productivity, export sales,
innovation etc) which can be monitored and analysed to develop a rich understanding
of the competitiveness of firms and industries, how the industrial structure (and
industry competitiveness) changes over time, and the underlying reasons for that
performance.

Commercial In Confidence
Improving our understanding of Auckland's competitiveness 69
203 Performance measures at the level of the firm and industries, in turn, can be
aggregated into measures of city outcomes. At the level of city outcomes, we are
particularly interested in labour productivity, income levels and growth rates, trends in
employment, and the cost of living. It is these factors that underpin standards of living
and which influence city competitiveness.
204 At the highest level of the framework are relative measures of city performance (e.g.,
GDP per capita, quality of life, shares of knowledge intensive economic activities),
which attempt to capture different dimensions of city competitiveness and which can
be used as a yardstick for measuring how Auckland compares with other domestic
and international city-regions.
Importance of size, distance and spatial scale44
205 Size and distance are two other factors that are not shown in figure 1 but which have a
significant impact on all layers of the framework. Indeed, the new economic
geography has a significant role to play in understanding the inter-relationships
between different levels of the framework. While it is beyond the scope of this
research synthesis to reinterpret the research findings in light of the predictions of
modern theories of economic geography, it is worth making a couple of brief
observations here.
206 Conventional neo-classical thinking predicts that the outcome of the global competition
for resources is economic convergence. Provided countries have good policies, and
broadly similar stocks of knowledge and human capital, then countries (and, by
implication, cities) will converge towards similar levels of real income and long-run
rates of economic growth. In contrast, economic geography theory, increasingly
supported by empirical evidence, points to an increasingly uneven spatial distribution
of production and productivity levels, in particular an increasing concentration of high
value-added production in so-called core international cities, and a corresponding
reduction in the share of knowledge intensive economic activities in peripheral cities.
207 Underpinning this core-periphery dynamic is the changing nature and scale of spatial
transaction costs, which are in turn driven by changes in technology, industry structure
and other economic drivers (McCann, 2009). These changes affect different forms of
economic activity differently. On the one hand, the spatial transaction costs
associated with low knowledge intensive, low value-added, standardised and relatively
routine activities have fallen considerably over time, favouring dispersal of such
activities. At the same time, the spatial transaction costs associated with high
knowledge intensive, high value-added, non-routine and non-standardised activities
appears to have risen, potentially because of the increasing importance of timeliness,
44 This discussion draws heavily on the arguments made in McCann (2009).

Commercial In Confidence
speed, variety, customisation and service-quality for the production and delivery of
high knowledge-intensive forms of production and service delivery (McCann, 2009).
208 In the current era of globalisation, the agglomeration and clustering forces appear to
more than offset the forces encouraging the dispersion of economic activity. Quite
apart from the operation of these forces leading to increasing concentration of high-
value economic activities in large core cities, the increasing share of production that
such activities comprise has led to a general shifting of all economic activity, and
associated labour and capital, away from peripheral cities to core cities.
209 Why is this dynamic relevant to our framework of city competitiveness and what does
it mean for Auckland? To understand this, it is important to consider this question at
two different spatial scales: international; and national.
210 Beginning at the international scale, the implication is that Auckland faces an uphill
battle in its competition for scarce and highly-valued resources and that this will limit
its prospects for economic growth. This is because Auckland is relatively small and
isolated by comparison with most Australian state capital cities, particularly Sydney
and Melbourne, and by comparison to the large South-East Asian cities. If
agglomeration forces are the dominant forces at an international level, then these
other cities will be the magnets for high-value jobs and capital (and will offer the most
attractive economic opportunities). This dynamic can become (and probably is) self-
reinforcing, since scale begets scale until such point that the costs of being large (e.g.,
higher rents and land prices, congestion costs etc) outweigh the benefits.
211 Contrast this with the dynamic that we would expect to operate at the national scale.
The economic geography thinking predicts that Auckland, as the largest and most
urbanised city-region, ought to grow faster and have a higher share of high value-
added economic activity. These counter-acting predictions are broadly consistent with
what we observe in the research results.
212 The above dynamic, and its differential operation at differential spatial scales, makes
the analysis of city performance and competitiveness challenging. It also means that
it is important to consider the operation of policies at different spatial scales (e.g.,
super-regional, Australasian, inter-regional, intra-regional and micro-spatial).
Consistent with McCann (2009), policy has a role in trying (if possible) to counter
international agglomeration forces (essentially by reducing spatial transaction costs,
for example through increased global connectedness, internationalisation etc) while
simultaneously reinforcing agglomeration forces that operate at more micro scales.

Commercial In Confidence
Improving our understanding of Auckland's competitiveness 71
Implications for other urban centres
213 The above framework, and underlying concepts, is not specific to Auckland and is
applicable to any urban area or region. However, below a certain size threshold, both
the economic significance of applying the framework, and the resources available to
improve city-region competitiveness, are likely to be limited.
214 While the framework itself is generally applicable, the specific diagnosis of problems
and/or opportunities for enhancing competitiveness, and the relevant policies for
improving city-region competitiveness, may differ significantly. At one level, it would
be surprising if most local economic strategies and development plans did not contain
initiatives that aim to improve image & identity, knowledge resources, connectedness,
amenities, built environment, business environment and aim to harness the particular
strengths of the local industrial structure. At another level, precisely how and in what
ways policy should aim to improve city-region sources of advantage is likely to be
heavily shaped by the unique city endowments and the existing strengths and
weaknesses of the city or region.
Commercial In Confidence
Implications for policy, economic strategy and spatial planning
215 In this section we discuss the specific implications for policy, economic strategy and
spatial planning in the Auckland region that flow from the Auckland Research
programme. Applying the framework for city competitiveness that emerged from the
Auckland Research Programme, we discuss the specific implications for each of the
elements that comprise the city sources of advantage.
Image & Identity
216 The overall conclusion that can be drawn from the Auckland Research Programme is
that, while Auckland provides ‘the basics’ in terms of being an international city, it does
not have a strongly internationally recognisable brand image.
217 An implication of the research, and the emerging competitiveness framework, is that
Auckland needs to more deliberately attempt to foster and cultivate an image and
brand for the city-region that contributes not only to visitor and events attraction, but
also to investors and potential migrants to the city. Such a strategy needs to
specifically target an international rather than domestic audience.
218 Any such city branding strategy should align with, and support, the economic strategy
for the region and should be underpinned by unique and distinctive sources of
advantage for the city-region.
219 The research highlights a number of possible elements that could be captured within a
city-branding exercise including:
• High quality of life, encompassing a good standard of living, attractive natural
environment, and reputation for safety
• Outstanding natural amenity, especially the harbours, beaches, volcanoes and
forest parks, and its temperate climate
• Creativity, especially its strengths in the creative industries
• Cultural diversity, especially its strong Māori and Pacific roots, increasing
multiculturalism and youthful population
• Innovativeness, especially its strong educational and research institutions.
Knowledge resources
220 Knowledge resources encompass a wide range of city region attributes, including the
skills and experience of its workforce, the share of knowledge intensive workers, and
the strength of the relationships between education and research institutions and
business.
Commercial In Confidence
Improving our understanding of Auckland's competitiveness 73
221 In general, the Auckland Research Programme has shown Auckland to be a moderate
performer in relation to knowledge resources. While the Auckland workforce is
marginally better qualified than the rest of the country, there is significant under-
achievement among large segments of the population, particularly amongst Māori and
Pacific school leavers. Related to this, the research has also highlighted issues with
tertiary education access for disadvantaged groups. The research has also
highlighted problems with foundational skills, including poor literacy and numeracy,
which are a major obstacle to upgrading workforce skills. The trends are particularly
concerning given demographic trends that imply a growing share of new entrants into
the workforce will be drawn from sub-population groups with historically poor
education and training outcomes.
222 The research also highlights issues at the opposite end of the skills spectrum. While
Auckland has highly regarded tertiary education institutions, the research finds that it
is not harnessing its strengths in areas such as science, technology and engineering.
It has specific weaknesses in relation to management capability, particularly in relation
to the commercialisation of technology and business internationalisation strategies.
The connections between education and research institutions and businesses are
generally found to be weak.
223 The findings imply the need for multi-faceted strategies to improve the education and
skill levels of the Auckland population, including initiatives aimed at:
• Improving functional numeracy and literacy, with an emphasis on sectors where
this represents a significant constraint to lifting productivity
• Addressing low educational participation and underachievement by Māori and
Pacific groups
• Improving the management and internationalisation capability of firms, particularly
those with a strong export orientation
• Attracting and retaining the highly skilled, especially in areas of persistent skills
shortage
• Strengthening the connections between education and research institutions and
business.
Connectedness
224 A number of the studies in the research programme touched on aspects of Auckland’s
connectedness internationally, with other New Zealand city-regions, and within
Auckland.

Commercial In Confidence
225 In relation to international connectedness, the overall conclusion is that Auckland’s
international connections are not fully developed. While Auckland is one of the most
international cities in the world, attracts the majority of New Zealand’s foreign direct
investment, and is New Zealand’s major international gateway, it has not harnessed
these strengths. For example, the tourism sector has a low share of international
guest nights considering it hosts 70 percent of all international visitor arrivals. More
generally, the importance of exports to the Auckland economy is low relative to the
rest of New Zealand.
226 Given that successful cities are highly internationally engaged cities, a clear
implication is that Auckland needs to pursue strategies that strengthen its international
connections. While not directly suggested by the research, specific policies that could
be considered include:
• Initiatives to strengthen the city’s branding, so as to attract visitors, skilled
workers and investors to Auckland
• Specific initiatives to enhance the tourism marketing and visitor attraction
capability of the city-region
• Initiatives to improve the targeting and attraction of high quality foreign direct
investment
• Stronger alignment of immigration policies with the economic development
strategy for the region, to better target highly skilled migrants and investors
• Measures that aim to better harness existing international connections, including
sister-city relationships, Auckland’s resident migrant population etc.
227 In relation to inter-regional connectedness, the major finding to emerge from the
research is that Auckland is not part of an emerging city system with Hamilton and
Tauranga. Indeed, the three city-regions appear to have relatively weak economic
inter-dependence. The key implication is that improving accessibility within cities,
particularly for Auckland, is likely to have greater economic impact than improving
accessibility between cities. The modelling by Ascari et al (2010) suggests that, for a
given level of investment, a focus on Auckland rather than spreading investment
across Auckland, Hamilton and Tauranga, would be likely to generate the greatest
economic benefits.45
This conclusion does not necessarily imply that inter-regional
connectedness is not an important economic issue. Indeed, the research highlights
likely inter-regional freight capacity constraints which will need to be addressed.
Further, if Auckland is to further develop its role as a value-adding processing centre
for the food and beverage industry, then the strengthening of its supply chain linkages
with its rural hinterland is particularly important.
45 Further testing of the approach to modelling and the assumptions made is warranted before acting on this finding.

Commercial In Confidence
Improving our understanding of Auckland's competitiveness 75
228 The research also demonstrates that there are substantial economic benefits to be
had from infrastructure investments that expand and enhance the major transport
networks within Auckland. For the Northern Motorway extensions, the economic
analysis conservatively estimates the ex post benefit:cost ratio at 6:1. While the bulk
of the motorway network is approaching completion, and significant investment in
upgrading transport infrastructure continues in Auckland, projected population growth
implies a need to continue to focus on transport infrastructure investments that
enhance the efficiency of the network, reduce peak congestion rates, and improve
accessibility to the CBD and airports. The key challenge is in determining which parts
of the network can provide capacity for growth, with related challenges including how
to balance investment between different transport modes, the prioritisation of projects,
and the overall approach to funding and pricing.
Amenities
229 The research provides strong evidence that amenities are valued by households. In
practice, however, the most frequently used amenities are widespread (e.g., schools,
shops, motorways), such that these amenities have little practical influence over
household location decisions.
230 The research generally failed to find evidence in support of the provision of specific
amenities. Instead, it would appear that households choose between ‘bundles’ of
amenities. It is the quality and combination of local amenities that are important,
rather than simply availability of individual amenities.
231 The major implication of his finding is that an integrated and holistic view needs to be
taken in relation to the provision of amenities, including considering amenities within
the broader frame of spatial planning alongside other considerations including land-
use planning, urban design and the built environment.
232 Public amenities undoubtedly contribute to city liveability but there is a long bow
between the provision of public amenities and aggregate economic growth.
Arguments that specific amenities will lead to measurable benefits need to be viewed
with caution. Smart investments are those that seek not only to provide amenity, but
effectively target specific economic objectives such as tourism promotion and events
attraction. Examples could include exhibition and convention centres, signature
attractions on the waterfront, cruise ship infrastructure etc. Auckland’s CBD waterfront
has the potential to significantly improve amenity values in the central city, where
agglomeration benefits have the best chance of being harnessed.

Commercial In Confidence
233 A further implication of the research is that, while firms do not appear to value
amenities directly, they do strongly value access to a deep pool of labour. To the
extent that amenities are a significant part of what attracts people to a city, then firms
value and benefit from the provision of amenities and should share in the cost of their
provision.
Built environment
234 The decisions of the Auckland Council in relation to the built environment have the
potential to be some of the most economically significant, particularly in relation to
cumulative decisions over a long period of time. Key decisions regarding city form,
major regional initiatives, public transport and infrastructure decisions have the
potential, over the course of years, to have profound impacts on the shape and
economic performance of the city-region.
235 Key choices relate to: the appropriate city form to be provided for in the spatial plan
(e.g., how compact a city to pursue, the determination of future growth areas, the
associated infrastructure needs, and the tools to use for managing urban containment
and influencing where development occurs), and the related decisions about which
major city-shaping regional initiatives are the priorities for Auckland, and how
investment in them should be sequenced and funded.
236 Unfortunately, the Auckland Research Programme provides little specific guidance on
which strategies to pursue or investments to make. It does, however, suggest a need
to address land-related constraints to both residential and business growth, especially
for industrial activities. Affordable housing and an adequate supply of industrial land
are both important for the future economic growth of the city. Further, compact city
and broader housing goals may be compromised in the absence of effective strategies
for addressing wider housing issues including negative perceptions of more land-
intensive housing alternatives.
237 The research also highlights the importance of the CBD given the presence of
agglomeration economies, implying a need to focus both on initiatives that enhance
the accessibility and attractiveness of the downtown area for mixed use development.
Related to this, and given Auckland’s polycentric form, the research also highlights the
need for well connected, secondary town and city centres that offer opportunities for
local economic development.
Commercial In Confidence
Improving our understanding of Auckland's competitiveness 77
Business environment
238 While the research did not focus significantly on the business environment, or the
ease of doing business in Auckland, a number of specific issues did emerge in the
research:
• Spatial planning, and related zoning decisions, has an important role to play in
ensuring an adequate supply of business land. While the research suggests this
is particularly an issue for industrial activities, other sectors of the economy also
have specific land-use and infrastructure needs
• There is a need to strengthen linkages between education and research
institutions and businesses, so as to enhance the commercialisation of new
knowledge and ideas.
Industrial diversity and specialisation
239 The research highlighted Auckland’s comparative strength in Knowledge Intensive
Services but also its relative weakness in relation to high- and medium-technology
manufacturing. Further, the research programme did find evidence of ‘localisation
economies’ and ‘urbanisation economies’ in some specific sectors, although the
findings of agglomeration economies generally were weaker than previous studies.
240 The research also investigated industry specific sources of competitive advantage,
with particularly strong industrial specialisations in the areas of food and beverage
processing, niche manufacturing (e.g., health technologies, electronic and electrical
equipment, marine etc), and high value services (e.g., finance, property and business
services, goods distribution, screen production and creative industries, tourism and
export education).
241 The research also highlighted a number of specific industrial specialisations facing
specific infrastructure-related constraints. Chen (2011) reports that, for the marine
sector, infrastructure for clusters, coastal access, berthage and lack of heavy duty
haul-out facilities are particular concerns, while the film industry faces a need for
increased studio infrastructure. The innovation hubs proposed for the food &
beverage and health technologies sector represent, in part, a response to specific
industry infrastructure constraints.
242 Notwithstanding the above industry-specific issues identified in the research, in
general there is a lack of in-depth, high quality sector-specific research and analysis.
If policy-makers wish to pursue specific sector development policies, then further in-
depth research into sources of competitive advantage and barriers and impediments
to sector expansion is required.
Commercial In Confidence
243 There are limited specific policy implications from the research in this area, although
there is greater clarity regarding specific fast-growing, internationally competitive
sectors. The research also strongly confirms that Auckland is not immune from the
strong agglomeration forces acting at an international scale, which threaten to further
undermine its base in high-technology manufacturing and potentially erode its current
advantages in knowledge intensive services. Policies that reduce international
transaction costs, including direct and indirect trade barriers, transport and
communication costs may help to counteract other factors that encourage the shift of
mobile labour and businesses offshore.
Reflections on Auckland Unleashed
244 The Mayor of Auckland recently released Auckland Unleashed, the Auckland Plan
discussion document and which includes a detailed outline of the proposed strategic
approach to economic development for the Auckland city-region. Annex 1
summarises the key elements of this approach.
245 A key question following from the above discussion is to what extent the proposed
Auckland Plan, in particular its economic strategy components, aligns with the above
discussion of policy implications flowing from the Auckland Research Programme.
While a thorough assessment of Auckland Unleashed is not possible here, the
following observations can be made:
• In general there is a high alignment between the proposed strategic direction in
Auckland Unleashed and the specific policy implications identified above.
Specific aspects of the proposed strategic direction that are in alignment include:
– The focus given to the development of an Auckland brand, development of a
visitor-driven economy, a new approach to destination marketing and events
attraction, and improvements to tourism infrastructure
– The focus on the built environment and city form, including a focus on the
waterfront, CBD, provision of business land and the prioritisation of
investments in amenities and infrastructure that support economic objectives
– The focus on building the skills, education and learning of all Aucklanders,
but particularly youth
– Developing an internationally connected innovation system
– Provision of world-class economic infrastructure, and land use planning that
make proper provision for business and employment land
– A strategy for supporting internationally competitive sectors to succeed in
the international marketplace.

Commercial In Confidence
Improving our understanding of Auckland's competitiveness 79
• There is also strong alignment between the potential priority sectors and those
identified in the research as being internationally competitive: food and beverage,
health technologies, biotechnology, marine, screen stage and creative industries,
education, knowledge intensive industries, and advanced materials.
• The discussion document proposes an emphasis on strengthening connections
between Auckland and the top of the North Island. However, the Auckland
Research Programme indicates that it may be better for the Council to initially
focus on improving intra-regional connections, although improving freight flows
between Auckland and Tauranga will likely provide some benefits.
Recommendations
246 There are few specific policy recommendations that flow from this synthesis of the
Auckland Research Programme. However, the following recommendations can be
made to the Auckland Policy Office and the Auckland Council:
(i) The framework for city competitiveness described in part 3 of this report should
be used by agencies as a useful guide for the development of policies to
improve city competitiveness, both for Auckland and other city-regions
(ii) There should be ongoing monitoring of a refined set of indicators in relation to
city competitiveness, city outcomes, and firm/industry outcomes to enable
Auckland and other cities’ economic progress to be measured and reported on
(iii) There should be further targeted research in a number of areas to better inform
our understanding of Auckland’s competitiveness and, in particular, to inform
the development of policy. Specific areas for further research that flow from this
research synthesis include:
a. developing a better understanding of the relationship between land
constraints and land prices and its effects on residential and business
location decisions to inform Auckland spatial planning processes
b. in-depth, targeted sector-specific research for a broader set of industries
with a particular focus on improving our understanding of:
i. industry competitive advantage, including the sources of
competitiveness as well as barriers and constraints to growth
ii. the innovation performance of the sectors, and the underlying
performance of the regional innovation system as it applies those
sectors
c. further developing our knowledge in relation to the actual returns to
investment in transport infrastructure, based on the approaches taken by
Motu in the studies of the Northern Motorway Extension

Commercial In Confidence
(iv) Policymakers should further consider the opportunities to improve each element
of Auckland’s sources of advantage including:
a. Developing and cultivating a stronger image and brand for the city that
contributes to visitor and events attraction, and which also assists in
drawing investors and potential migrants to the city.
b. Further developing the knowledge resources of Auckland, including
initiatives that seek to address under-achievement among large segments
of the population, address problems with functional numeracy and literacy,
and address weaknesses in relation to management capability, particularly
as it relates to the commercialisation of technology and business
internationalisation strategies. Policy should also seek to strengthen
linkages between firms and education and research organisations and
target known problems in relation to skills supply, particularly in relation to
scarce skills in areas such as science, technology and engineering.
c. Strengthening international connections between Auckland and other
international cities, especially with a view to improving trade and
investment ties, better harnessing the international connections of
overseas born Aucklanders, and improving the internationalisation
capability of firms. To fully realise agglomeration benefits, improving
connectedness within the city (especially through improved transport
linkages and better broadband) is important, and may be economically
more important than strengthening connections between cities.
Nevertheless, if Auckland is to further develop its role as a value-adding
processing centre, then strengthening its supply chain linkages with other
cities and regions is important.
d. In relation to amenities, there are few specific conclusions that can be
drawn but a key finding is that bundles of amenities matter more than
individual amenities. Policymakers therefore need to take an integrated
and holistic approach to the provision of amenities. Importantly, amenities
are important to both households and firms (for different reasons) and both
should contribute financially to their provision.
e. Policymakers should reconsider existing regulatory settings in relation to
land-use, so that land-related constraints do not hinder residential or
business growth (especially for industrial activities). The Auckland Council
should carefully consider the nature and application of urban limits
(alongside related instruments and strategies) in support of desired
patterns of urban growth.
Commercial In Confidence
Improving our understanding of Auckland's competitiveness 81
References
Ascari, Strateg.Ease and PricewaterhouseCoopers (2011) Drivers of firm location, firm success
and industry success in the Auckland Region.
Ascari, Richard Paling Consulting and Berl economics (2010) Economic linkages between New
Zealand Cities.
Ascari Partners (2007) Assessing Agglomeration Impacts in Auckland: Linkages with Regional
Strategies.
Auckland Council (2011) Auckland Unleashed – The Auckland Plan Discussion Document.
Beacon Pathway Ltd (2010) The Determinants of Tenure and Location Choices of 20-40 year
old Households in the Auckland Region, Prepared for the Centre for Housing Research,
Aotearoa New Zealand.
Chen, EeMun (forthcoming) Innovation and the City: Review of the Auckland Regional
Innovation System, forthcoming Ministry of Economic Development Occasional Paper.
Coleman, A. and D. C. Maré (2011) Estimating the determinants of population location in
Auckland, Motu Economic and Public Policy Research.
Coleman, A. and D. C. Maré (2011) Patterns of business location in Auckland, Motu Economic
and Public Policy Research.
COMET (2010) Unlocking Auckland’s Potential: Adult Literacy and Numeracy Skills in the new
Auckland.
Grimes, A. (2007) Auckland’s Economic Transformation: Evidence to Underpin Action, Internal
Ministry of Economic Development discussion paper.
Grimes, A. and Y. Liang (2007) Spatial determinants of land prices in Auckland: Does the
Metropolitan Urban Limit have an effect?, Motu Working Paper 07-09, Motu Economic and
Public Policy Research.
Grimes, A. and Y. Liang (2008) Bridge to Somewhere: The Value of Auckland’s Northern
Motorway Extensions, Motu Working Paper 08-07, Motu Economic and Public Policy Research.
Grimes, A. and C. Young (2010) Anticipatory Effects of Rail Upgrades: Auckland’s Western
Line, Motu Working Paper 10-11, Motu Economic and Public Policy Research.

Commercial In Confidence
Grimes, A., J. Le Vaillant and P. McCann (2011) Auckland’s Knowledge Economy: Australasian
and European Comparisons, Ministry of Economic Development Occasional Paper 11/02.
Hansen and Winther (2010) Amenities and Urban and Regional Development: Critique of a New
Growth Paradigm.
Harrison Grierson and Market Economics (2008) Adequacy of the Auckland Region’s
Residential Land Supply, prepared for the Department of Building and Housing.
Knowledge Matrix Asia Pacific Ltd, with BERL, IMSED and PricewaterhouseCoopers (2009)
Understanding Auckland’s Role in New Zealand’s Global Engagement: Foreign Direct
Investment.
Lewis, G. and S. Stillman (2005) Regional economic performance in New Zealand: How does
Auckland compare? New Zealand Treasury Working Paper 05/08.
Maré, D. C (2008) Labour Productivity in Auckland Firms, Ministry of Economic Development
Occasional Paper 08/09.
Maré, D. C., Coleman, A., & Pinkerton, R. (2011) Patterns of population location in Auckland,
Motu Economic and Public Policy Research.
Maré, D. C and J. Timmins (2006) Geographic Concentration and Firm Productivity, Motu
Working Paper 06-08, Motu Economic and Public Policy Research.
Market Economics (2010) Understanding Auckland’s Role in New Zealand’s Global
Engagement: Exports of Merchandise Trade and Services.
Market Economics Ltd (2011) Auckland’s Competitiveness, Distinctiveness and Sources of
Competitive Advantage.
MartinJenkins (2008) Skills Issues in the Building and Construction Sector, for the Department
of Building and Housing.
MartinJenkins (2010) Briefing on Economic Well-Being, Prepared for the new Auckland Council.
McCann, P. (2009) Economic geography, globalisation and New Zealand's productivity paradox.
New Zealand Economic Papers, 43(3), 279-314.
Ministry of Economic Development (2010) Economic Imperatives for Auckland, Internal Working
Paper.

Commercial In Confidence
Improving our understanding of Auckland's competitiveness 83
Ministry of Economic Development, The Treasury and Statistics New Zealand (2011) Economic
Development Indicators Report 2011.
Ministry of Transport (2010a) Fact Sheet: Comparing Travel Modes, Available at
http://www.transport.govt.nz/research/Documents/Comparing-travel-modesv1.4.pdf
Ministry of Transport (2010b) Fact Sheet: Driver Travel,
http://www.transport.govt.nz/research/Documents/Driverstravel_2009_final.pdf
OECD (2006) OECD territorial reviews: Competitive cities in the global economy.
Parkinson, M., M. Hutchins, J. Simmie, G. Clark & H. Verdonk (2004) Competitive European
cities: Where do the core cities stand?, for the Office of the Deputy Prime Minister, London.
Sapere (2011) Planning for industrial activities in Auckland: Reflections on existing information.
Tertiary Education Commission (2010) The Auckland Study: An assessment of tertiary
education needs of school leavers in the Auckland region.
Commercial In Confidence
Appendix 1: Auckland Unleashed
The Mayor of Auckland recently released Auckland Unleashed, the Auckland Plan discussion
document which outlines high-level proposals for Auckland’s spatial future, as required by the
Local Government (Auckland Council) Act 2009. Included among the eight key goals that
underpin the Mayor’s vision for Auckland are for Auckland to become:
• An outward-looking global city with a productive, high value economy, supported by a world
class international city centre
• An open, welcoming place that is attractive to investors, skilled workers and tourists and
which encourages international events
• A place enabled by world-class infrastructure and supporting services.
The discussion document identifies three areas where the Mayor and Council see opportunities
to build on Auckland’s advantage and start the step change to lift Auckland’s economic
performance. These include:
• the International City Centre and fringe, which would be characterised by a cultural and
civic heart, the pre-eminent business centre in New Zealand, the main campus for
academic and research institutions, a centre where people can enjoy rich cultural and
natural amenities, a destination for visitors, connected to the rest of the city through an
exemplar network of rail, ferries, avenues and roads
• the Southern Opportunity Area, which would be a location for high value manufacturing, an
area of residential growth (including area transformations), an area where educational
institutions and networks would provide outstanding opportunities to future employees
within industry, and which would contain the international airport, which can help change
Auckland from a gateway to a destination
• the North Western Opportunity Area, which would be a capital innovation centre in New
Zealand, a base to enable Auckland’s marine and film sectors to be global scale industries,
an area where new types of Public Private Partnerships can be used to improve housing
supply, and where unique business opportunities that leverage of the beauty of the natural
landscape can be undertaken.
The document also proposed an investment in a step change in Auckland’s economic
performance, especially through exports and internationalisation. It proposed the following key
strategic priorities to achieve this:
• Having a ‘can do’ attitude, whereby the Council creates a business friendly and well-
functioning city, facilitating an environment where firms can get on and do business
• Developing a visitor-driven economy, which promotes Auckland as a destination and builds
on our natural and social capital

Commercial In Confidence
Improving our understanding of Auckland's competitiveness 85
• Developing Auckland’s economy so that it becomes the innovation capital of the Asia-
Pacific rim
• Creating an environment where science, research, technology and ideas are transformed
into internationally valuable products and services which can earn overseas exchange and
grow the Auckland and New Zealand economies
• Supporting internationally competitive sectors of the Auckland economy to flourish and
upscale to succeed in the international marketplace, and working with central government
to strengthen existing national networks for these sectors to take a whole of New Zealand
approach towards exports and internationalisation
• Building the skills, education and learning of all Aucklanders, but particularly youth, so that
everybody can participate in the new innovation ecosystem through high-value, high-skill
and high-wage jobs and employment
• Connecting the Auckland economy into the New Zealand economy, especially in the upper
North Island with other major urban areas such as Hamilton, Tauranga and Whangarei.
The discussion document proposes five priority areas for driving internationally competitive
economic growth:
• Providing a business friendly and well-functioning city, with emphasis on:
– world class economic infrastructure, especially in terms of transport (including the
Ports of Auckland and the Auckland International Airport) and broadband
– the land use planning provisions of the Auckland Plan and the Unitary Plan making
proper provision for business and employment land to ensure there is capacity for
businesses to establish, grow and develop
– efficient and responsive Council planning and regulatory processes.
• Developing an internationally connected innovation system, including targeted initiatives
focused on supporting high value internationally competitive sectors46
, encouraging
exporting, enhancing internationalisation and connectivity, improving access to capital, and
accelerating research and development
• Growing Aucklanders’ skills, education and training, especially amongst youth, for example
by leading, coordinating and undertaking interventions to improve labour market
productivity, to accelerate early childhood learning programmes, to generate employment
pathways for school leavers, and to offer programmes to ensure skills shortages and
misalignments are met.
46 Potential priority sectors outlined in the discussion document include: food and beverage, health technologies,
biotechnology, marine, screen stage and creative industries, education, knowledge intensive industries, and
advanced materials.

Commercial In Confidence
• Creating a vibrant, creative world city attractive to visitors, for example through a new
approach to destination marketing to consumer and business audiences, development of a
national convention centre, improvements to tourism infrastructure (in particular, cruise
ship facilities) and a major events strategy and attraction programme amongst other
initiatives.
• Delivering a quality city in form and design, through spatial planning and urban design
initiatives, as well as the prioritisation of investments that provide not only amenity but also
contribute to economic objectives such as tourism promotion and events attraction,
including a particular focus on development of the waterfront and integrated planning for
retail and cultural services, access to public services, public transport, green and open
spaces, affordable housing and specific area initiatives that offer local economic
development opportunities, especially around town centres and business precincts.
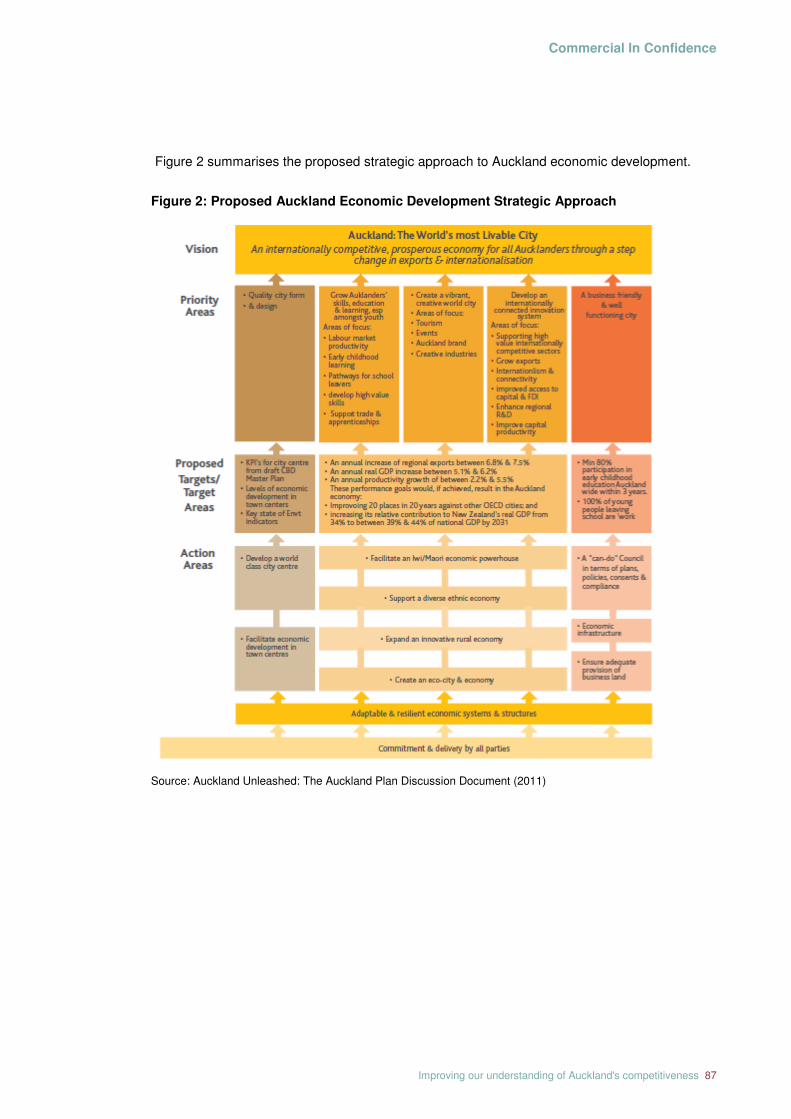
Commercial In Confidence
Improving our understanding of Auckland's competitiveness 87
Figure 2 summarises the proposed strategic approach to Auckland economic development.
Figure 2: Proposed Auckland Economic Development Strategic Approach
Source: Auckland Unleashed: The Auckland Plan Discussion Document (2011)


