17
IMPROVING PREDICTIVE MODELING THE WAY FOR PERSONAL CARRIER ADAM KARWAN, PHD 7 NOVEMBER 2017, WARSAW
IMPROVING PREDICTIVE MODELING THE WAY FOR PERSONAL CARRIER
ADAM KARWAN, PHD 7 NOVEMBER 2017, WARSAW
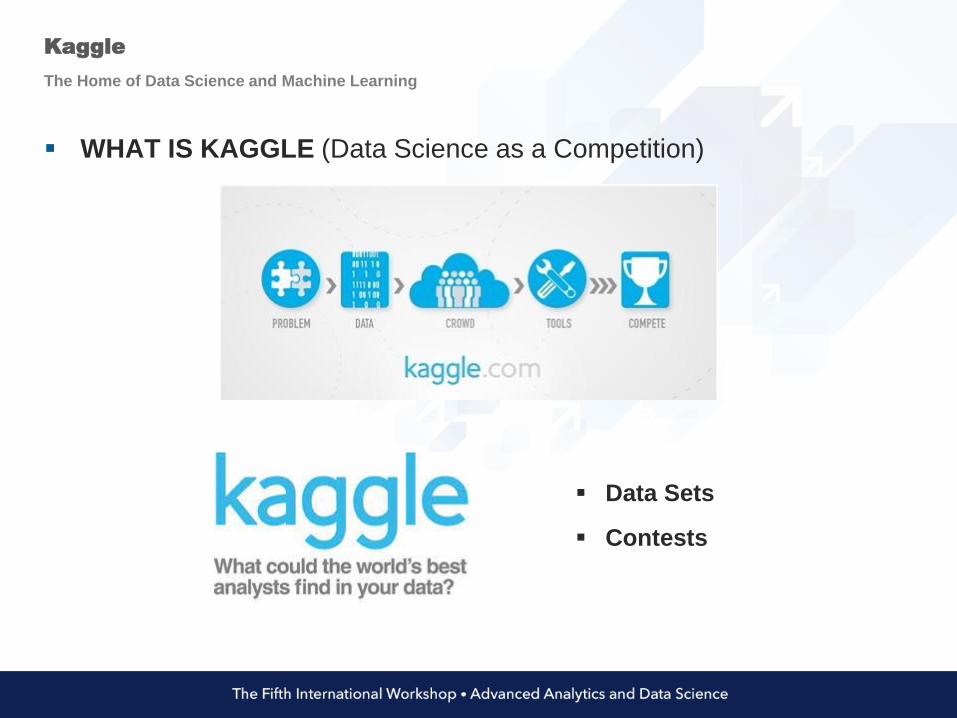
The Home of Data Science and Machine Learning
Kaggle
WHAT IS KAGGLE (Data Science as a Competition)
Data Sets
Contests
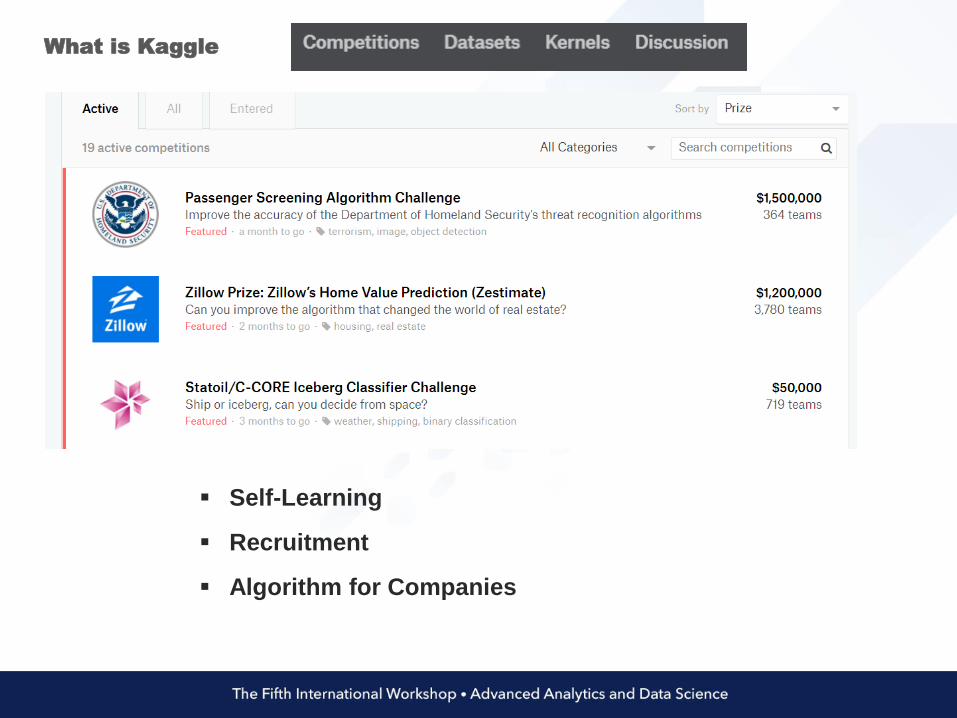
What is Kaggle
Self-Learning
Recruitment
Algorithm for Companies
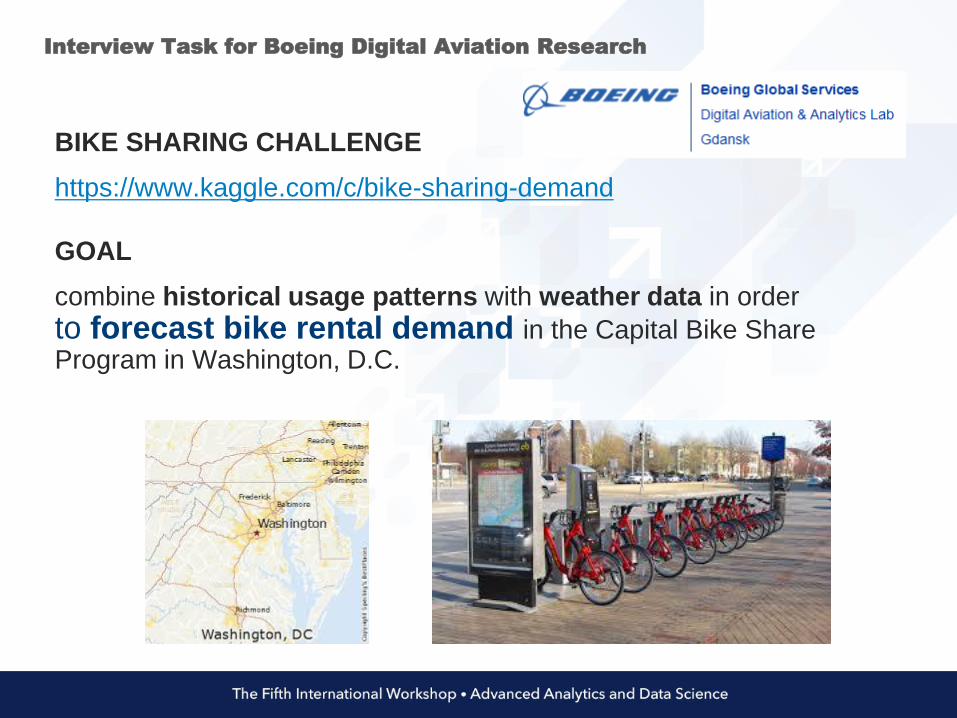
Interview Task for Boeing Digital Aviation Research
BIKE SHARING CHALLENGE
https://www.kaggle.com/c/bike-sharing-demand
GOAL
combine historical usage patterns with weather data in order
to forecast bike rental demand in the Capital Bike Share Program in Washington, D.C.
BIKE SHARING CHALLENGE
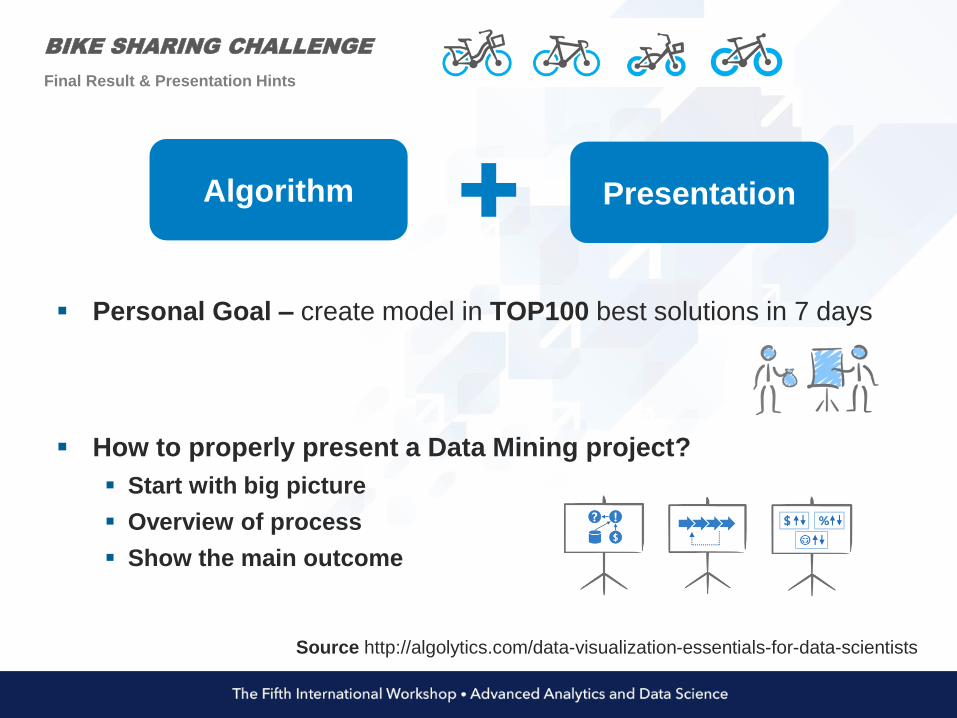
Personal Goal – create model in TOP100 best solutions in 7 days
How to properly present a Data Mining project?
Start with big picture
Overview of process
Show the main outcome
Source http://algolytics.com/data-visualization-essentials-for-data-scientists
Final Result & Presentation Hints
Algorithm Presentation
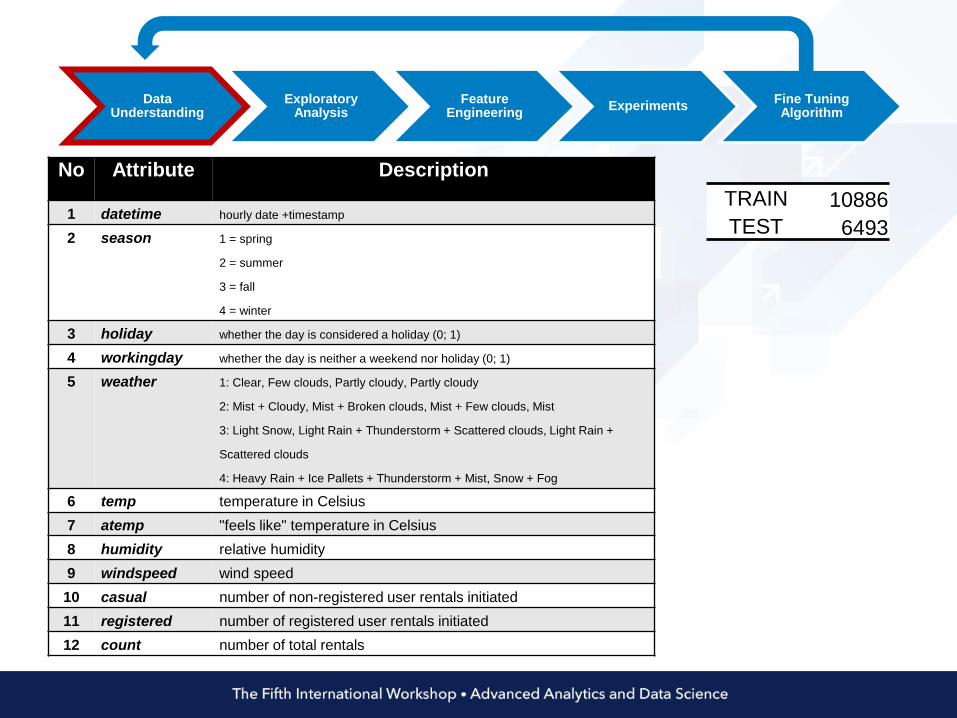
No Attribute Description
1 datetime hourly date +timestamp
2 season 1 = spring
2 = summer
3 = fall
4 = winter
3 holiday whether the day is considered a holiday (0; 1)
4 workingday whether the day is neither a weekend nor holiday (0; 1)
5 weather 1: Clear, Few clouds, Partly cloudy, Partly cloudy
2: Mist + Cloudy, Mist + Broken clouds, Mist + Few clouds, Mist
3: Light Snow, Light Rain + Thunderstorm + Scattered clouds, Light Rain +
Scattered clouds
4: Heavy Rain + Ice Pallets + Thunderstorm + Mist, Snow + Fog
6 temp temperature in Celsius
7 atemp "feels like" temperature in Celsius
8 humidity relative humidity
9 windspeed wind speed
10 casual number of non-registered user rentals initiated
11 registered number of registered user rentals initiated
12 count number of total rentals
TRAIN 10886
TEST 6493
Data Understanding
Exploratory Analysis
Feature Engineering
ExperimentsFine Tuning Algorithm
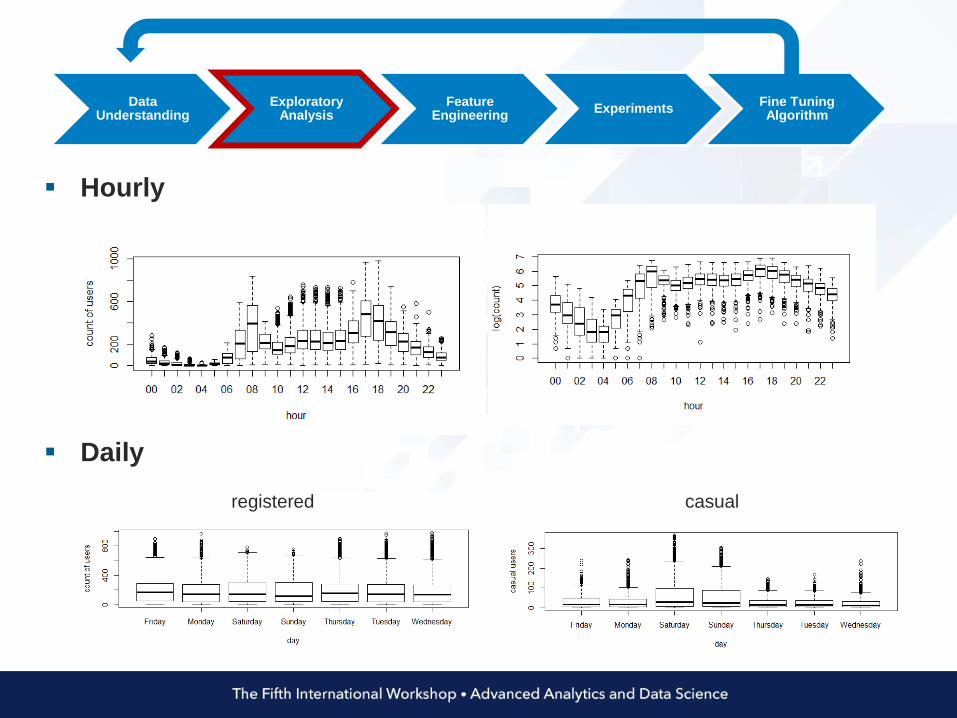
Hourly
Daily
casualregistered
Data Understanding
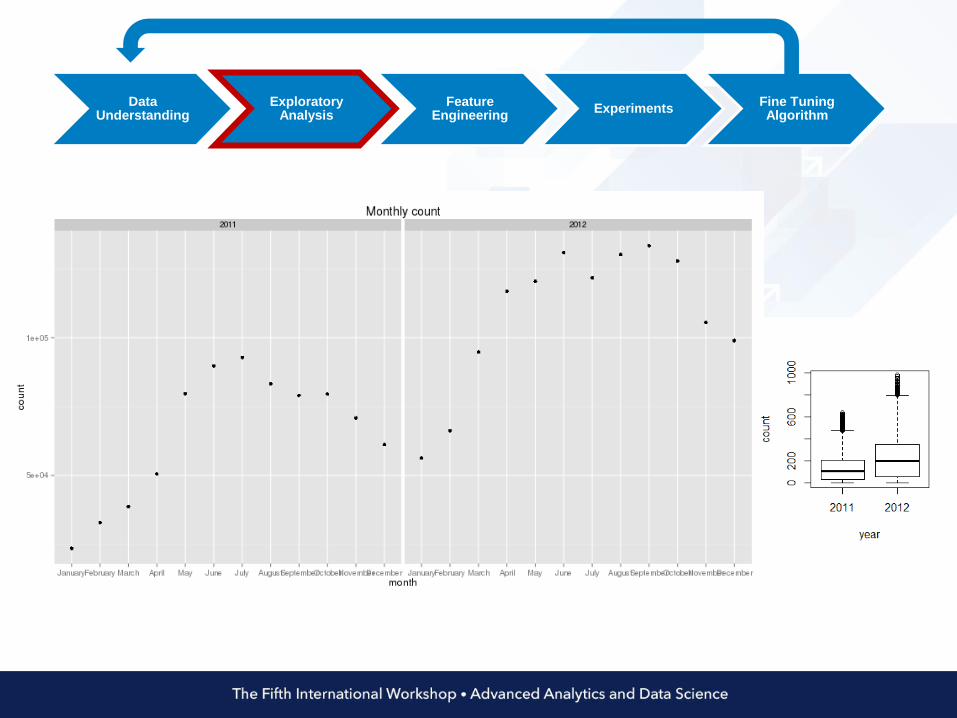
Exploratory Analysis
Feature Engineering
ExperimentsFine Tuning Algorithm
Data Understanding
Exploratory Analysis
Feature Engineering
ExperimentsFine Tuning Algorithm
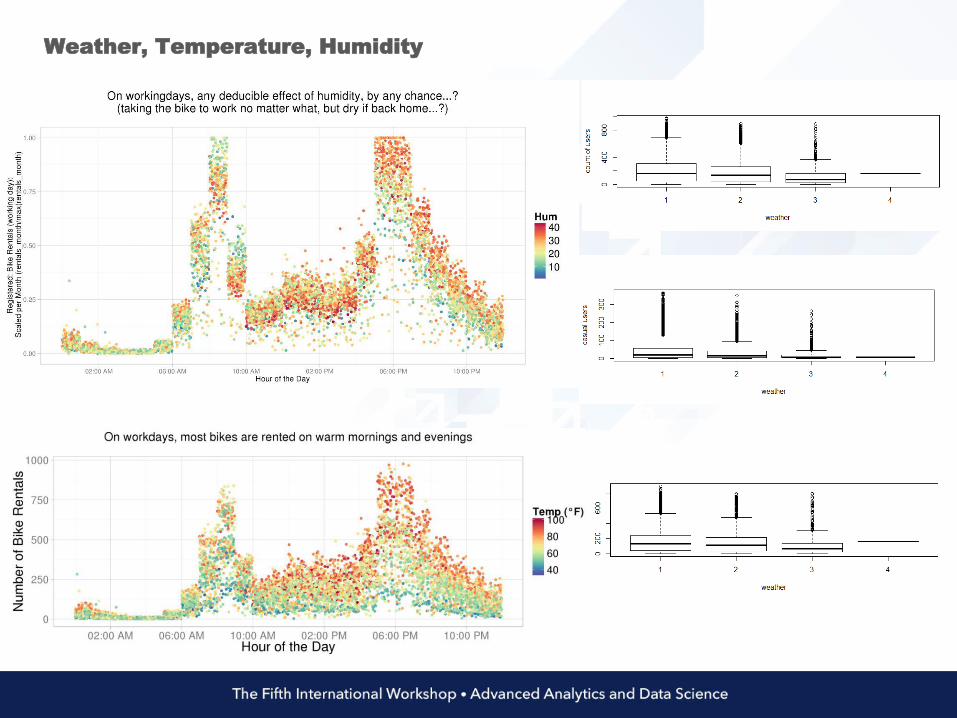
Weather, Temperature, Humidity
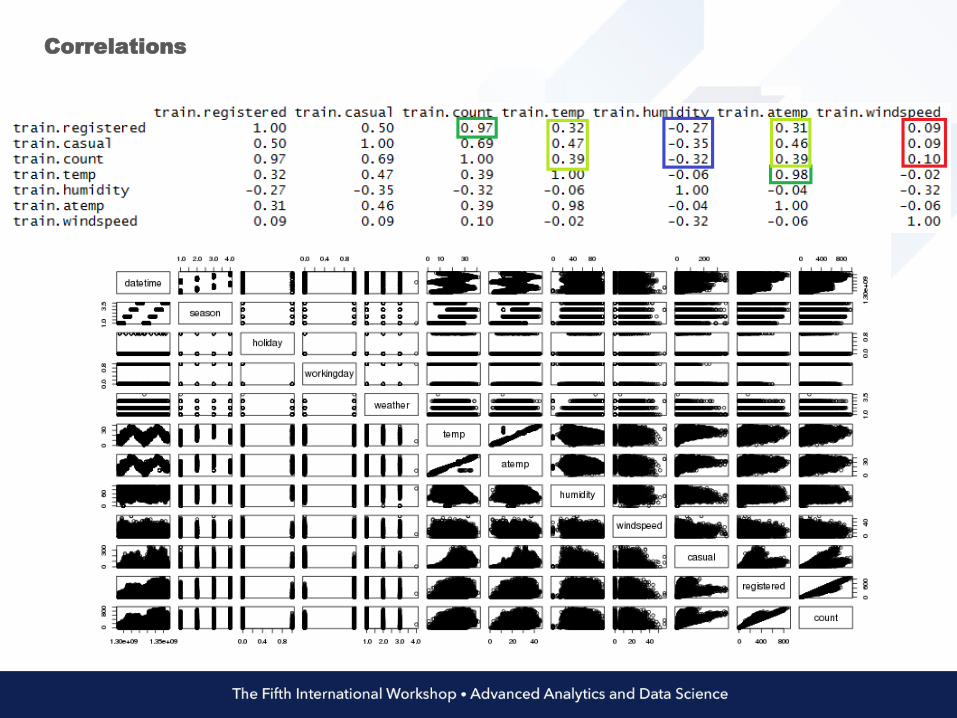
Correlations
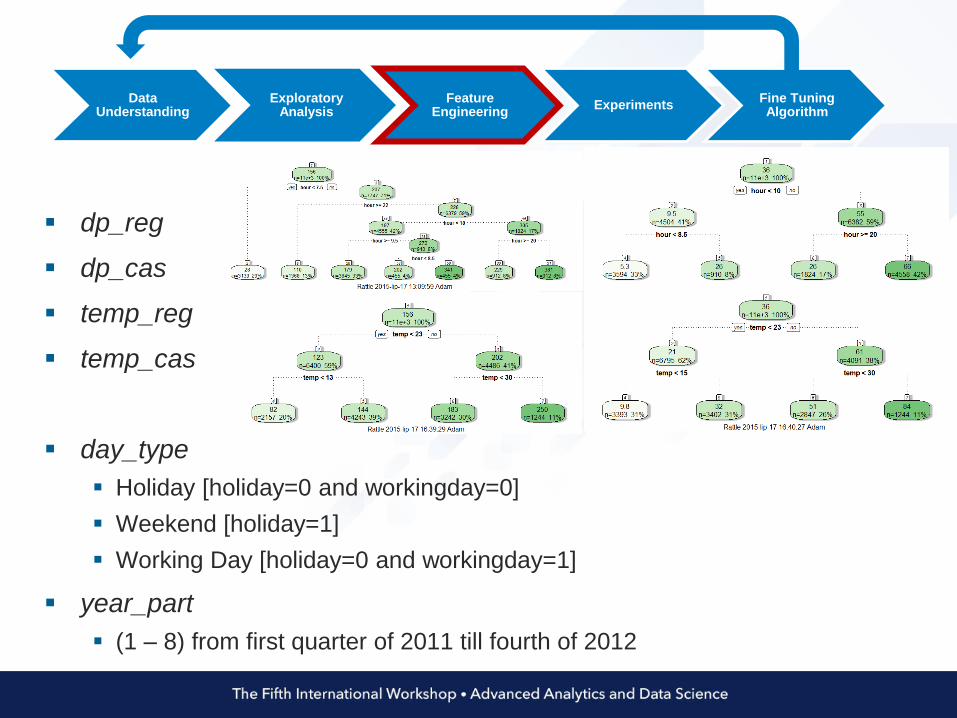
dp_reg
dp_cas
temp_reg
temp_cas
day_type
Holiday [holiday=0 and workingday=0]
Weekend [holiday=1]
Working Day [holiday=0 and workingday=1]
year_part
(1 – 8) from first quarter of 2011 till fourth of 2012
DataUnderstanding
Exploratory Analysis
Feature Engineering
ExperimentsFine Tuning Algorithm
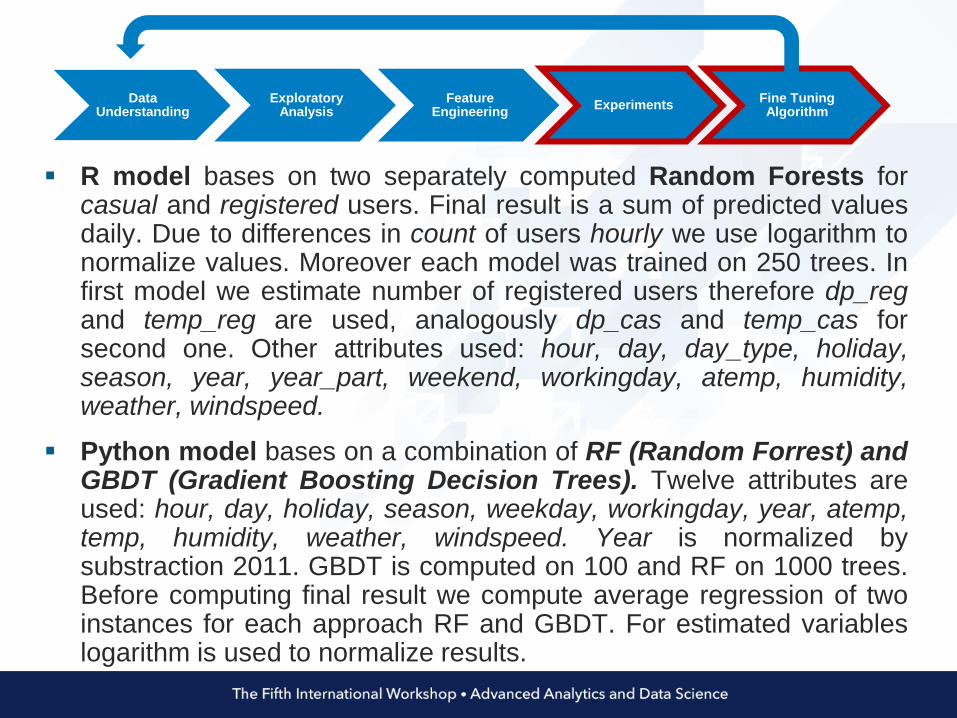
R model bases on two separately computed Random Forests forcasual and registered users. Final result is a sum of predicted valuesdaily. Due to differences in count of users hourly we use logarithm tonormalize values. Moreover each model was trained on 250 trees. Infirst model we estimate number of registered users therefore dp_regand temp_reg are used, analogously dp_cas and temp_cas forsecond one. Other attributes used: hour, day, day_type, holiday,season, year, year_part, weekend, workingday, atemp, humidity,weather, windspeed.
Python model bases on a combination of RF (Random Forrest) andGBDT (Gradient Boosting Decision Trees). Twelve attributes areused: hour, day, holiday, season, weekday, workingday, year, atemp,temp, humidity, weather, windspeed. Year is normalized bysubstraction 2011. GBDT is computed on 100 and RF on 1000 trees.Before computing final result we compute average regression of twoinstances for each approach RF and GBDT. For estimated variableslogarithm is used to normalize results.
Data Understanding
Exploratory Analysis
Feature Engineering
ExperimentsFine Tuning Algorithm
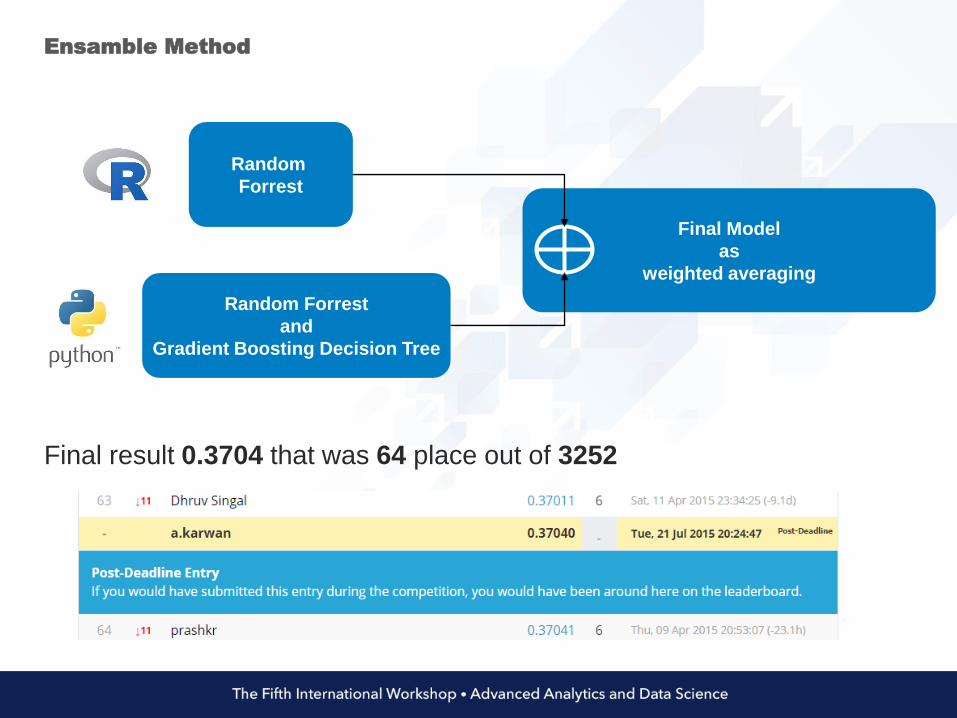
Final Model
as
weighted averaging
Ensamble Method
Final result 0.3704 that was 64 place out of 3252
Random
Forrest
Random Forrest
and
Gradient Boosting Decision Tree

DATA SCIENCE in AVIATION INDUSTRY
PREDICTIVE MX
POST FLIGHT ANALYTICS
REAL TIME MACHINE LEARNING
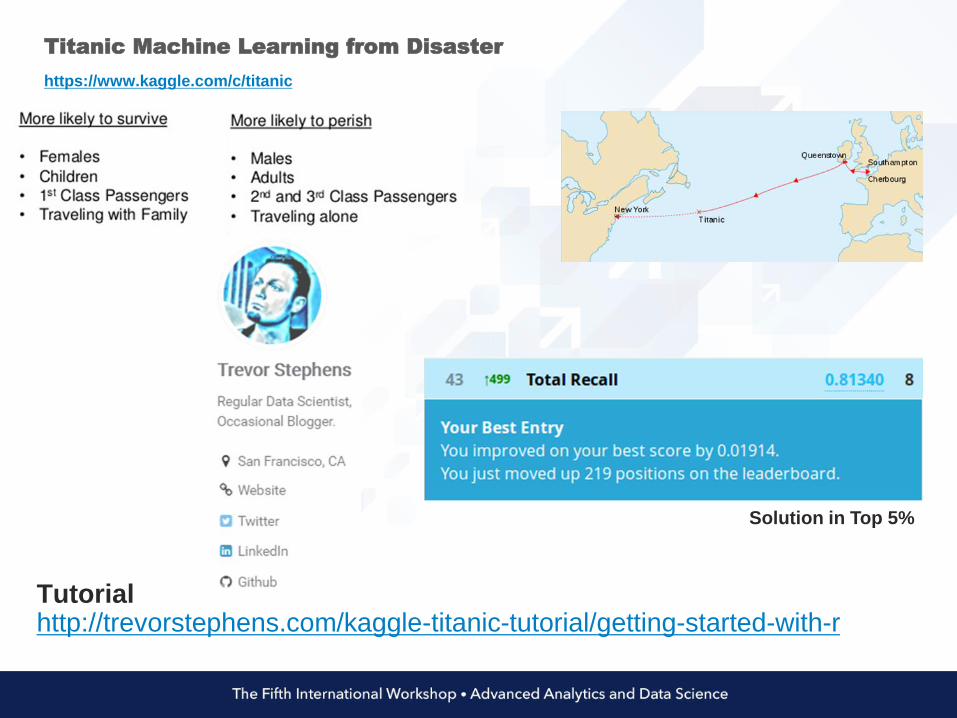
https://www.kaggle.com/c/titanic
Titanic Machine Learning from Disaster
Tutorialhttp://trevorstephens.com/kaggle-titanic-tutorial/getting-started-with-r
Solution in Top 5%

R Studio, Python Anaconda, Jupyter
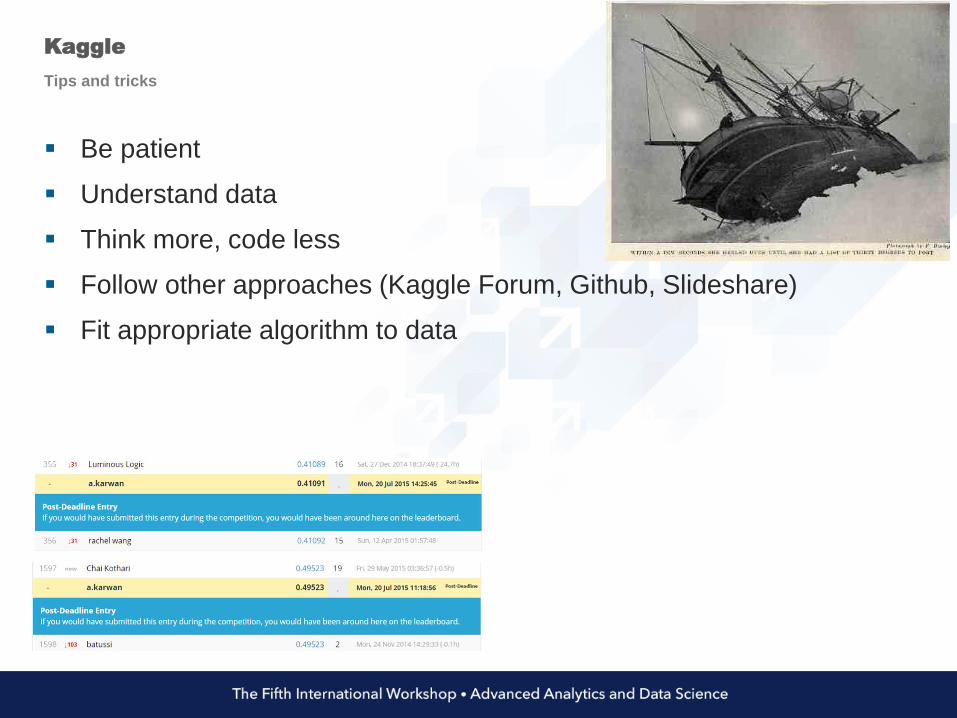
Tips and tricks
Kaggle
Be patient
Understand data
Think more, code less
Follow other approaches (Kaggle Forum, Github, Slideshare)
Fit appropriate algorithm to data


