Improving Public Health in France. The Local Political Mobilization in the Nineteenth Century Patrice Bourdelais ith hindsight one of the achievements of the rich countries has been to reconcile tremendous social changes with remarkable improvements in health. For instance, the life-expectancy for French women has increased from 35 years to 83 years since the eve of the French Revolution (Appendix table 1). Despite industrialisation, urbanisation and rural de-population, which have changed the conditions of living, the environment and the economic origin of the family means, the improvement has been incredible. But this does not imply that there has been a smooth evolutionary improvement for the whole population. On the contrary, during several decades, the first industrialization led to increases in mortality (and probably increasing morbidity) among the workers and the urban poor population, especially the children. In fact, to appreciate the links between social change and health, scholars have to pay attention to different analysis scales. 1 The chronological scale first, because the social change effects on health improvement have not been immediate, regular or constant – an increase of the mortality can even be the first consequence of a social change. The geographical scale is also important because the economic and social change occurred first at a local level, and surveys at a national or regional scale can immerse these changes. Taking into account the social scale is fundamental because specific categories, new industrial workers or women or children have been more exposed than the others, and were, at least during a first phase, the main losers of the evolution. The three dimensions, the three scales, have to be connected to each other. I propose here, after a global perspective on life-expectancies, to focus first, at a local level, on an example of the consequences for mortality and health of the 19 th century industrialization. The ways in which the industrial and urban penalties have 1 Jacques Revel, Jeux d’échelle, la micro-analyse à l’expérience (Gallimard-Le Seuil, Paris, 1996). W
Transcript
Improving Public Health in France.The Local Political Mobilization in
the Nineteenth Century
Patrice Bourdelais
ith hindsight one of the achievements of the rich countries has been toreconcile tremendous social changes with remarkable improvements inhealth. For instance, the life-expectancy for French women has
increased from 35 years to 83 years since the eve of the French Revolution(Appendix table 1). Despite industrialisation, urbanisation and rural de-population,which have changed the conditions of living, the environment and the economicorigin of the family means, the improvement has been incredible. But this does notimply that there has been a smooth evolutionary improvement for the wholepopulation. On the contrary, during several decades, the first industrialization ledto increases in mortality (and probably increasing morbidity) among the workersand the urban poor population, especially the children.
In fact, to appreciate the links between social change and health, scholars have topay attention to different analysis scales.1 The chronological scale first, because thesocial change effects on health improvement have not been immediate, regular orconstant – an increase of the mortality can even be the first consequence of a socialchange. The geographical scale is also important because the economic and socialchange occurred first at a local level, and surveys at a national or regional scale canimmerse these changes. Taking into account the social scale is fundamental becausespecific categories, new industrial workers or women or children have been moreexposed than the others, and were, at least during a first phase, the main losers ofthe evolution. The three dimensions, the three scales, have to be connected to eachother.
I propose here, after a global perspective on life-expectancies, to focus first, at alocal level, on an example of the consequences for mortality and health of the 19th
century industrialization. The ways in which the industrial and urban penalties have
1 Jacques Revel, Jeux d’échelle, la micro-analyse à l’expérience (Gallimard-Le Seuil, Paris,
1996).
W
230
been solved lead me to pay more attention to the local policies and municipalinitiatives. In the third part of this paper I will emphasize on a French specificity:the importance of municipal, state and public institutions in the field of PublicHealth and assistance. In other words, who were the main victims of the mortality-increase in the industrial cities? What was the influence of employer’s policies-specific to industrial towns-in reducing level of mortality? More generally, how havethe policies to improve public health developed? What scale? What political leaders?What ideas?
The Global Evolution
At the national level, life expectancy curves indicate that the crisis have been firstlinked to the wars periods, striking mostly men: the end of the first Empire (1812–1814), the First and Second World Wars (figure 1). When life expectancy forwomen decreased, it is the result of a surge of epidemics, smallpox, measles,dysentery in 1871, and Spanish influenza in 1918–1919. At the national level, theconsequences of the industrialization process or of the urbanization are not veryobvious, except during the decades 1840–1850 when the trend stagnated. What isinteresting is the differential increase of the expectancy for each sex since the late19th Century with a growing gap until the 1950s. It is also clear that the curvescontinue their progression after the wars.2
In spite of a tremendous social change over the 19th Century, life-expectancybegan to increase, especially in the last third when important policies to fightagainst infant mortality were implemented and when the main industrial centrescompleted their rapid growth period. But men were more vulnerable than women,with working conditions, professional illnesses, consumption of alcohol andtobacco supposedly explaining the differences. Since the Second World War thecross-sectional values of life tables are more regular than before, emphasising thatthe sanitary situation and the epidemics are under control. To examine moreprecisely the links between social change and health the local scale is necessary.
2 Many thanks to France Meslé and Jacques Vallin for having open us their annual
reconstitution of the French Life expectancy.
231
Figure 1. Life expectancy. France 1806–2001.
0,0
10,0
20,0
30,0
40,0
50,0
60,0
70,0
80,0
90,0
1806
1816
1826
1836
1846
1856
1866
1876
1886
1896
1906
1916
1926
1936
1946
1956
1966
1976
1986
1996
Years
Men
Women
Source: see note 2.
The Health Effects of Industrialization and Urbanization
The consequences of the new economic conditions, the large industries (textile firstand then, mines and metal plants) on the health of the workers in both Englandand France, have been the centre of the political debate for several decades. Thedanger for children’s health has been emphasised on the both sides of the Channel,from the beginning of the 19th century. The new economy was accused of usingchildren as slaves and to cause weakness, malformations, severe illnesses, and veryoften to anticipate their death.3 On the other side, the industrialists advocated thatindustry was the cause for a new prosperity and better health.4 On the both sides ofthe Channel the first sociological surveys were organized.5 In France, several surveysto analyse what were the new conditions of living of industrial workers and urban
3 Christopher Hamlin, Public Health and Social Justice in the Age of Chadwick, Britain,
1800–1854 (Cambridge University Press, 1998).4 Andrew Ure, The Philosophy of manufactures; or an Exposition of the scientific, moral and
commercial economy of the factory system of Great-Britain (London, Charles Knight, 1835).5 Edward Palmer Thompson, The Making of the English Working Class (London, Victor
Gollancz, 1963).
232
population and the origins of the dysfunction’s were done in the 1830’s.6 In themost famous, Villermé tried to show that the situation was bad, and worse in theindustrial cities. At the end of his own work he reconsidered the results given by M.Ure who had found the cotton industries to protect children from cholera and thedevelopment of scrofula. The heat in the industrial buildings, the quality of foodand of clothes allowed by high wages were benefit for them. Ure even insinuatedthat the rural population has a worse health that the manufacture’s one. Villerméemphasised that these assertions were probably a response to Michael Saddler’scontradictory thesis. In contrast, Villermé tries to maintain a critical position infront of all the studies. It is the reason why he chose statistics published by theHouses of Communes, giving some indications on mortality and average life forcounties and districts. The data are all the more relevant as they have not beenorganized to answer to that specific question. Splitting the industrial counties anddistricts from the agricultural ones, he finds strong evidences that the mortality washigher in the former compared to the latter. He calculated that of 10 000 childrenborn, 4 457 reach 40 in the agricultural area, 4 124 in the districts partlyagricultural, partly industrial, and 3 541 in the manufacture districts. He also showsthat the mortality between 0 and 10 years old and the mortality from 10 to 40 wereranked similarly.7 It was not really a surprise for him, because some data collectedfor Mulhouse, the large textile centre in Alsace region, gave more or less the sameresults. Life expectancy had declined from 25 years in 1812 to 21 in 1827, duringthe industrial growth (but he also emphasised that this was still a betterperformance than Leeds). Villermé emphasised that even if mortality is not thedirect consequence of the industrial work but the result of the living conditionsnear the factories, of the housing conditions, industrialisation was still responsiblefor the deterioration.
As for the increase of the urban population, Villermé was the first to conduct anextensive study of the mortality differences among the Parisians during the 1820’s.His papers published by the new Annales d’hygiène contributed to the emergence ofa new paradigm. Traditionally, in these decades, the neo-Hippocratic thesisdominated medicine and the explanations for mortality differences were seen in thelevel of hygrometry, direction of the wind, orientation of the streets and of the flat’swindows, or the distance to the Seine river, or the altitude etc. With the censusesdata and vital registration for each “arrondissement”, Villermé was able to showthat mortality was not linked to these environmental factors but mainly to thedegree of the individual wealth of the arrondissements. It was a total break from the
6 Kate Lynch, Family, Class, and Ideology in Early Industrial France (The University of
Wisconsin Press, 1988).7 Louis-René Villermé, Tableau de l’état moral et physique des ouvriers employés dan sles
manufactures de coton, laine et de soie (1840, reprint EDI, Paris, 1989), 513–518.
233
Table 1. Mortality rates among young children, 1847–1857 (per thousand).Infant mortality Mortality in ages 1–4 Mortality in ages 5–9
Sources: Lyon; Samuel Preston and Etienne Van de Walle, ‘Urban French Mortality in theNineteenth Century’, Population Studies, 32,2 (1978), 275–297. Le Creusot; Bourdelais andDemonet, (2000). Mâcon; Research to be published by Patrice Bourdelais and Michel Demonet,on the French urban mortality (1861). Seraing: Suzy Pasleau, La formation d’un prolétariatindustriel, Seraing 1846–1914, (Thèse de l’Université de Liège, 1990); Michel Oris, ‘Mortalité,industrialisation et urbanisation au XIXe siècle’, Pp 252–281, in Dix essais sur la démographieurbaine de la Wallonie au XIXe siècle, édité par Desama (Claude et Michel Oris, 1995).
traditional view, it oriented the mortality analysis towards a social perspective in theanalysis.8
In the Parisian case, social changes led directly to the degradation of health forthe new population. In the context of the then dominant paternalist policyparadigm, these numerous surveys and the debates around the negativeconsequences of industrialisation and urbanization had a major influence especiallywith respect to employers’ obligation towards the workforce. We could follow theMulhouse case studied by Florence Ott9, but it is not the only example. Anotherone is offered by the metal industrial city of Le Creusot in which the mortality hasbeen systematically reconstructed.10 It is clear here that the increase of the city leadto a big decline of the life-expectancy.
We propose first to place the mortality of Le Creusot in its geographical context,in relation to other towns in the same department (Saône-et-Loire), to theneighbouring city of Lyon, to France as a whole and to another industrial town,Seraing. All of our previous studies have shown the importance of mortality up to
8 Ann La Berge, Mission and Method. The Early Nineteenth Century French Public Health
Movement (Cambridge University Press, 1992); Patrice Bourdelais, Les épidémies terrassées. Unehistoire de pays riches (Editions de La Martinière, Paris, 2003).
9 Florence Ott, La Société Industrielle de Mulhouse, 1826–1876, ses membres, son action, sesréseaux (Presses universitaires de Strasbourg, 1999).
10 Patrice Bourdelais and Michel Demonet, ‘Demographic Changes in EuropeanIndustrializing Towns. Examples and Elements for Comparison’, The History of the Family. AnInternational Quarterly, 5, 4 (2000), 363–372.
234
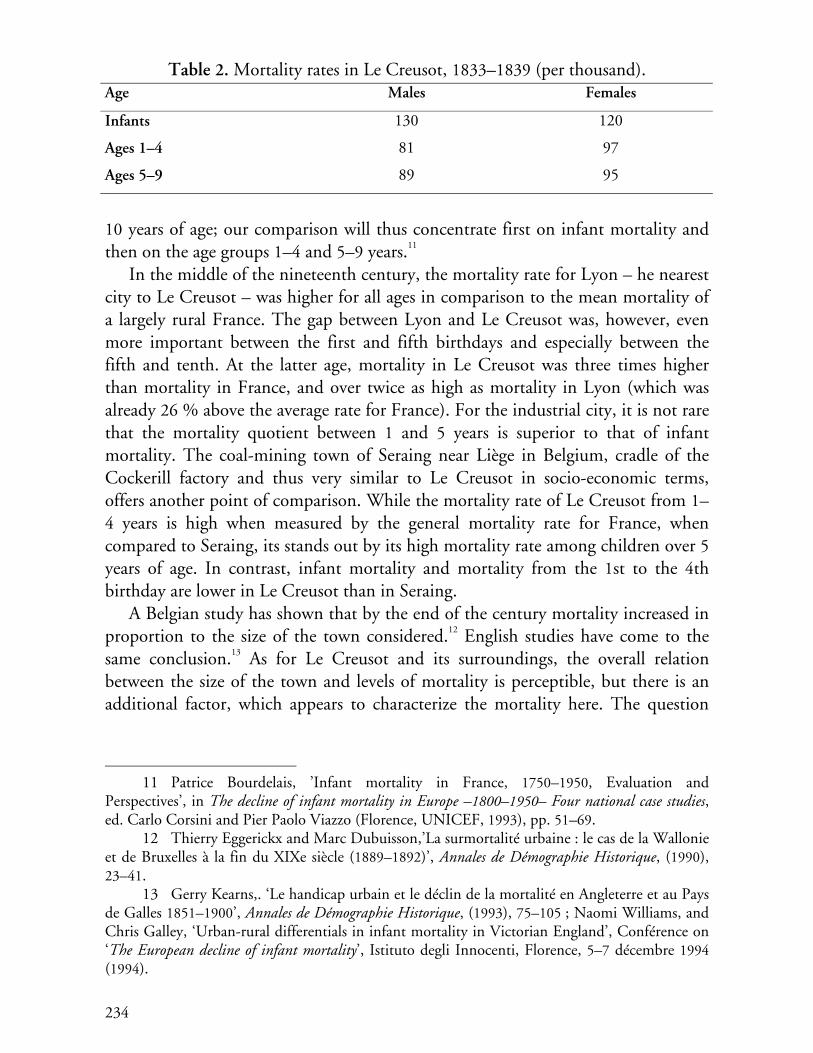
Table 2. Mortality rates in Le Creusot, 1833–1839 (per thousand).Age Males Females
Infants 130 120
Ages 1–4 81 97
Ages 5–9 89 95
10 years of age; our comparison will thus concentrate first on infant mortality andthen on the age groups 1–4 and 5–9 years.11
In the middle of the nineteenth century, the mortality rate for Lyon – he nearestcity to Le Creusot – was higher for all ages in comparison to the mean mortality ofa largely rural France. The gap between Lyon and Le Creusot was, however, evenmore important between the first and fifth birthdays and especially between thefifth and tenth. At the latter age, mortality in Le Creusot was three times higherthan mortality in France, and over twice as high as mortality in Lyon (which wasalready 26 % above the average rate for France). For the industrial city, it is not rarethat the mortality quotient between 1 and 5 years is superior to that of infantmortality. The coal-mining town of Seraing near Liège in Belgium, cradle of theCockerill factory and thus very similar to Le Creusot in socio-economic terms,offers another point of comparison. While the mortality rate of Le Creusot from 1–4 years is high when measured by the general mortality rate for France, whencompared to Seraing, its stands out by its high mortality rate among children over 5years of age. In contrast, infant mortality and mortality from the 1st to the 4thbirthday are lower in Le Creusot than in Seraing.
A Belgian study has shown that by the end of the century mortality increased inproportion to the size of the town considered.12 English studies have come to thesame conclusion.13 As for Le Creusot and its surroundings, the overall relationbetween the size of the town and levels of mortality is perceptible, but there is anadditional factor, which appears to characterize the mortality here. The question
11 Patrice Bourdelais, ’Infant mortality in France, 1750–1950, Evaluation and
Perspectives’, in The decline of infant mortality in Europe –1800–1950– Four national case studies,ed. Carlo Corsini and Pier Paolo Viazzo (Florence, UNICEF, 1993), pp. 51–69.
12 Thierry Eggerickx and Marc Dubuisson,’La surmortalité urbaine : le cas de la Wallonieet de Bruxelles à la fin du XIXe siècle (1889–1892)’, Annales de Démographie Historique, (1990),23–41.
13 Gerry Kearns,. ‘Le handicap urbain et le déclin de la mortalité en Angleterre et au Paysde Galles 1851–1900’, Annales de Démographie Historique, (1993), 75–105 ; Naomi Williams, andChris Galley, ‘Urban-rural differentials in infant mortality in Victorian England’, Conférence on‘The European decline of infant mortality’, Istituto degli Innocenti, Florence, 5–7 décembre 1994(1994).
235
Table 3. Life expectancy at birth, at 5 and at 10 (in years).
therefore arises as to whether it is as a result of industrialization or rather the rapidpopulation growth, which followed that industrialization and made it possible?
The chronology is important to understand what happened. In the case of LeCreusot, the years 1846–1866 constituted the heart of the phase of paroxysmalgrowth, with annual rates reaching 10 %. Can, therefore, the increase in mortalitybe traced back to the town’s demographic surge and industrialization?
In 1836, when Schneider bought the Creusot factories, the site – with some 2300 inhabitants – was neither a town nor an industrial centre faced with an influxof large workforce, but a village, with some little forges and one cristallerie, whichhad more or less vegetated since the French revolution. Life tables calculated for theyears 1833–1839, give a proxy for the mortality in Le Creusot before its massivegrowth. Although the limited numbers surveyed and the probable modificationswith the population structure between 1833 and 1839 prevent one fromcommenting on small disparities, the results are spectacular:
Mortality was still fairly low, even if the level for 5–9 years old was already highcompared with that of the two previous age groups. Life expectancy at birth at thetime was 36.9 years for men and 42 years for women, owing to a net excess-mortality among men of 15–35 years during the median period of professionalactivity. But twenty years later, life expectancy was only 31.1 years for men and 31.6for women. The years of massive industrialization and rapid population growththus correspond to a loss of over 6 years of life expectancy for men and over 10years for women.
Women were the main losers of these changes. Is one to suppose that in anindustrial town deprived of wage-earning activities for women, girls were lessbrought up with care than boys? Yet in Seraing, which had the same employmentsituation, excess-mortality among girls was not perceptible; it was, however, in 1861
236
in Elbeuf, where textile works provided plenty of possibilities for the feminineworkforce. No conclusion can therefore be drawn on this point as long as resultsappear to contradict the hypotheses when various towns or industrial centres arecompared. Nevertheless, the effects of industrialization and the influx of workforceon the mortality rate of a given site appear to be undeniable.
But for young adults, their mortality increased, in particular among youngwomen. We have shown that the age of marriage decreased markedly between 1836and 1856, thus rendering the proportions of those at risk through childbirth greaterat the end of the period in question. Given such a hypothesis, it would seem thatthe sanitary conditions in which women gave birth had also worsened.
An Excess-Mortality Among Immigrants?
Lately, one of the most debated questions has been whether the increase inmortality was due to recent immigrants who had a hard time adapting to newsurroundings or rather to those individuals who had already lived in the town for aperiod of time and been worn out by hard work and a awful environment? Byreconstituting the population of Le Creusot and linking the longitudinal data, it ispossible to measure the mortality of both sub-populations. Recent immigrantwomen appear to have died more frequently than those already installed in thetown for the age groups 5–9 and 30–34 years.
If one now compares the evolution of mortality in Le Creusot with that of thewhole of the French population between 1836 and 1876, one detects certainparticularities for Le Creusot, but also very many resemblances, in particular in theevolution from one census to the next one. Whatever the date examined, excess-mortality in Le Creusot for 1 to 4 and especially for 5 to 9 years old is indisputable.When one compares the evolution of mortality quotients over the twenty years forLe Creusot and for France as a whole, one is struck by a very strong resemblance,although the divergences are larger in Le Creusot particularly amongst women in1876. In both cases, the evolution is not regular, but follows a series of advances andretreats. This is rather surprising, but may point to the importance of conjunctureof the epidemiological context.
There are also notable differences between men and women. Whether forFrance in general or for the town of Le Creusot, life expectancy varied much moreamong men than among women. In both cases, the years 1861–1876 werefavourable to women of almost all ages, except perhaps for elderly women; on theother hand, life expectancy dropped fairly quickly for men after their 10th birthday.It should finally be noted that variations among men were particularly prevalentbetween the fifth and twentieth birthdays; afterwards, they tended to diminish for
237
France, while remaining rather important in Le Creusot. Overall, if one considersglobally the period 1846–1876, women of all ages and in both cases – albeit muchmore massively in Le Creusot – gained in number of years left for them to live.Their life expectancy rose back up to 42.5 years, close to that they had known in1836 (42.1 years). For men, however, this bonus disappeared by the 20th birthdayfor France in general, and turning into a deficit by the 25th birthday in Le Creusot,
One further element is worthy of note: the growing gap between men andwomen in Le Creusot in 1876. From the age group of 10–14 years upwards, women– especially until the ages of 35–39 years – died in far fewer numbers than theirmasculine counterparts. And yet on the national scale – except, to a certain extent,for the age group of 20–24 years – one would have to wait 40 years for femininemortality to become slightly inferior to that of men. Could this be explained by theeffects of poor working conditions – fatal accidents and injury?
Arduous working conditions, mining or factory accidents account for the highlevel of masculine mortality compared to that of young women of the same age(15–35 years). This is especially during the initial industrialisation phased in 1836.Later on, masculine mortality fell at a time when feminine mortality was on therise, so that the gap diminished. Industralization does not seem thus to have directlyincurred over-mortality, especially as women in Le Creusot participated only verymarginally to production.
As to the middle – and long-term effects of pollution (often described asspectacular) on the health of the population, they are impossible to verify, althoughthere is no dearth of written accounts. In the 1870's, the pollution was so intense inthe poorly ventilated valley where the waste from the mine and factory hovered overthe town, that the Director of the factory works, Emile Cheysson, left the townabruptly in order to preserve the health of his wife, who did not tolerate well thesmoggy environment. The number of cases of chronic bronchitis, so weakening tothe organism, must therefore have been very high.
In conclusion, it would appear as if public health measures, the development ofindividual housing, water supply, garbage disposal, a hospital, consultancies andfree treatment, as well as the acquisition of the principles of individual and familyhygiene were indispensable in compensating for the negative effects linked topopulation growth. The life expectancy at birth among inhabitants of le Creusot in1836 was thus attained once more in 1876, after forty years of worsening living andenvironmental conditions. The paroxysmic phase would appear to be that of veryhigh mortality rates, whereas the consolidation of the phase signalled the return tolevels of mortality preceding the surge in population growth.
238
The City: The First Scale for Public Health Intervention:
The Le Creusot Example
The experience of Le Creusot in France or Seraing in Belgium illustrate thechallenges major companies faced in organising accommodation for their growingworkforce. Initially this was of no concern to them, but the inability of the privatemarket to provide enough houses and flats led them to play an increasing role in theorganisation of the city. Starting with little caserns they quickly moved buildinglittle houses with gardens as a bulwark against the rising threat of socialistradicalism. There was also a more direct utility for the industrialists in having aworkforce close to the factories.In the case of Le Creusot, it is possible to follow very precisely how the initiativesconverge to improve public health. The analysis of mortality has brought to lightcertain particularities which are worth considering. First of all, the surprisingmortality rate among children up to 10 years, especially between 5 and 10 years. Ithas been known for years that mortality among 1 to 4 years old is an excellentindicator of conditions of hygiene and healthiness in which young children live.This is much more true than for infant mortality, since infants benefit for a timefrom maternal immunity and from the mother's antibodies through breastfeeding.While infant mortality is generally high, it is not particularly so in Le Creusot,where young children died mostly in late summer and early fall, the usual time forgastro-enteritis and epidemics such as scarlet fever. According to Dr Cancal, theCreusot children, “frail and sickly scrofutous and syphilitic”, died in large numbers:out of “300 cases in 1857, 193 died of gastro-enteritis”. The measure lacks theprecision one would wish, but Dr Cancal indicated that between 1854 and 1858,out of a total of 3 482 births, 729 deaths from gastro-enteritis were recorded amongyoung children.14
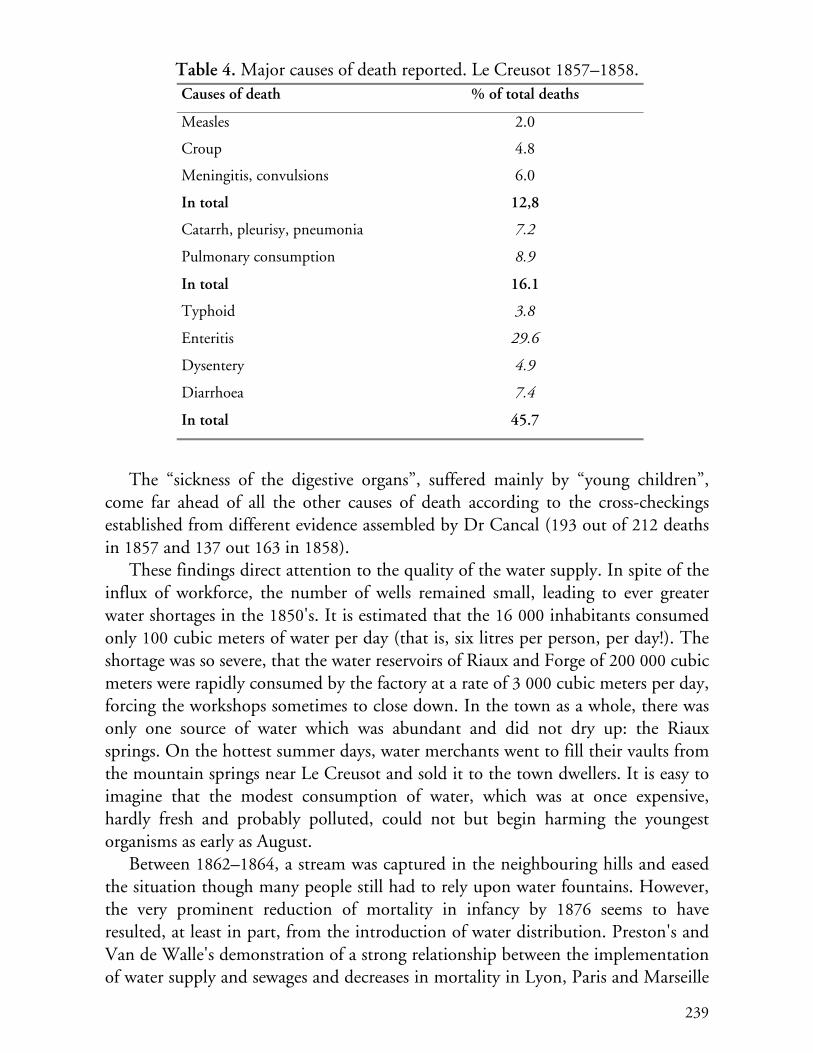
Lists of causes of death were kept with great care by physicians and havesurvived for the years 1857 and 1858. In Le Creusot, Dr Cancal appears to havemade a conscientious listing insofar as the columns headed “other causes”(including still-births) and “unknown causes” account for 13 % of the cases only,out of a total of 895 deaths. The principle causes of death, for the whole of thepopulation, were the following:
14 Dr. Cancal, ’Note à M. le Dr. Carion, médecin des épidémies de l’arrondissement
d’Autun’ (Académie François Bourdon, Le Creusot, March, 1859).
239
Table 4. Major causes of death reported. Le Creusot 1857–1858.Causes of death % of total deaths
Measles 2.0
Croup 4.8
Meningitis, convulsions 6.0
In total 12,8
Catarrh, pleurisy, pneumonia 7.2
Pulmonary consumption 8.9
In total 16.1
Typhoid 3.8
Enteritis 29.6
Dysentery 4.9
Diarrhoea 7.4
In total 45.7
The “sickness of the digestive organs”, suffered mainly by “young children”,come far ahead of all the other causes of death according to the cross-checkingsestablished from different evidence assembled by Dr Cancal (193 out of 212 deathsin 1857 and 137 out 163 in 1858).
These findings direct attention to the quality of the water supply. In spite of theinflux of workforce, the number of wells remained small, leading to ever greaterwater shortages in the 1850's. It is estimated that the 16 000 inhabitants consumedonly 100 cubic meters of water per day (that is, six litres per person, per day!). Theshortage was so severe, that the water reservoirs of Riaux and Forge of 200 000 cubicmeters were rapidly consumed by the factory at a rate of 3 000 cubic meters per day,forcing the workshops sometimes to close down. In the town as a whole, there wasonly one source of water which was abundant and did not dry up: the Riauxsprings. On the hottest summer days, water merchants went to fill their vaults fromthe mountain springs near Le Creusot and sold it to the town dwellers. It is easy toimagine that the modest consumption of water, which was at once expensive,hardly fresh and probably polluted, could not but begin harming the youngestorganisms as early as August.
Between 1862–1864, a stream was captured in the neighbouring hills and easedthe situation though many people still had to rely upon water fountains. However,the very prominent reduction of mortality in infancy by 1876 seems to haveresulted, at least in part, from the introduction of water distribution. Preston's andVan de Walle's demonstration of a strong relationship between the implementationof water supply and sewages and decreases in mortality in Lyon, Paris and Marseille
240
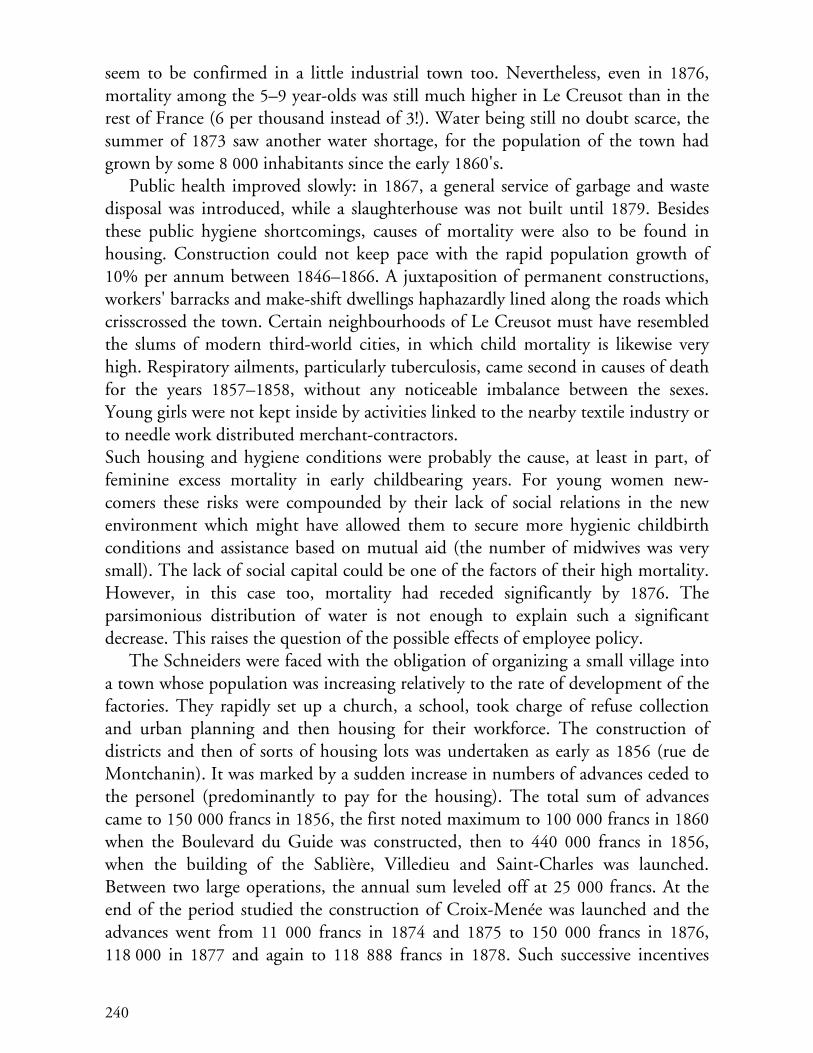
seem to be confirmed in a little industrial town too. Nevertheless, even in 1876,mortality among the 5–9 year-olds was still much higher in Le Creusot than in therest of France (6 per thousand instead of 3!). Water being still no doubt scarce, thesummer of 1873 saw another water shortage, for the population of the town hadgrown by some 8 000 inhabitants since the early 1860's.
Public health improved slowly: in 1867, a general service of garbage and wastedisposal was introduced, while a slaughterhouse was not built until 1879. Besidesthese public hygiene shortcomings, causes of mortality were also to be found inhousing. Construction could not keep pace with the rapid population growth of10% per annum between 1846–1866. A juxtaposition of permanent constructions,workers' barracks and make-shift dwellings haphazardly lined along the roads whichcrisscrossed the town. Certain neighbourhoods of Le Creusot must have resembledthe slums of modern third-world cities, in which child mortality is likewise veryhigh. Respiratory ailments, particularly tuberculosis, came second in causes of deathfor the years 1857–1858, without any noticeable imbalance between the sexes.Young girls were not kept inside by activities linked to the nearby textile industry orto needle work distributed merchant-contractors.Such housing and hygiene conditions were probably the cause, at least in part, offeminine excess mortality in early childbearing years. For young women new-comers these risks were compounded by their lack of social relations in the newenvironment which might have allowed them to secure more hygienic childbirthconditions and assistance based on mutual aid (the number of midwives was verysmall). The lack of social capital could be one of the factors of their high mortality.However, in this case too, mortality had receded significantly by 1876. Theparsimonious distribution of water is not enough to explain such a significantdecrease. This raises the question of the possible effects of employee policy.
The Schneiders were faced with the obligation of organizing a small village intoa town whose population was increasing relatively to the rate of development of thefactories. They rapidly set up a church, a school, took charge of refuse collectionand urban planning and then housing for their workforce. The construction ofdistricts and then of sorts of housing lots was undertaken as early as 1856 (rue deMontchanin). It was marked by a sudden increase in numbers of advances ceded tothe personel (predominantly to pay for the housing). The total sum of advancescame to 150 000 francs in 1856, the first noted maximum to 100 000 francs in 1860when the Boulevard du Guide was constructed, then to 440 000 francs in 1856,when the building of the Sablière, Villedieu and Saint-Charles was launched.Between two large operations, the annual sum leveled off at 25 000 francs. At theend of the period studied the construction of Croix-Menée was launched and theadvances went from 11 000 francs in 1874 and 1875 to 150 000 francs in 1876,118 000 in 1877 and again to 118 888 francs in 1878. Such successive incentives
241
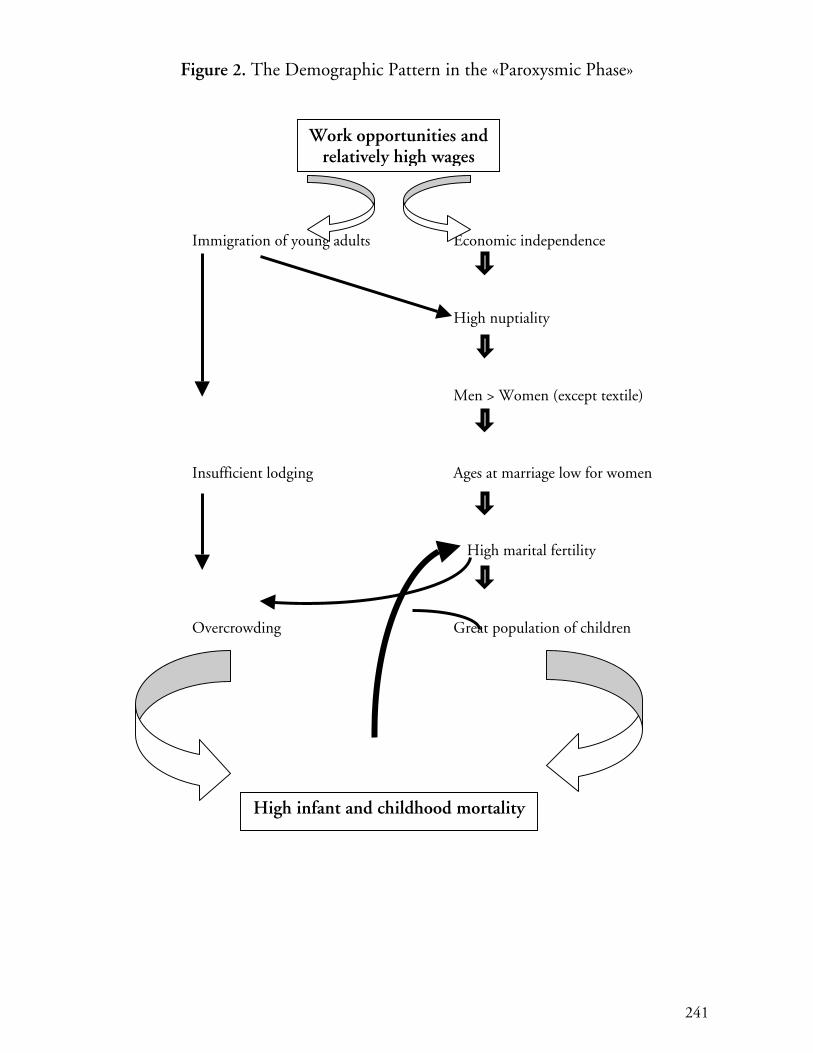
Figure 2. The Demographic Pattern in the «Paroxysmic Phase»
Immigration of young adults Economic independence
High nuptiality
Men > Women (except textile)
Insufficient lodging Ages at marriage low for women
High marital fertility
Overcrowding Great population of children
Work opportunities andrelatively high wages
High infant and childhood mortality
242
towards constructing small houses with gardens produced an unquestionableimprovement in housing conditions in the Creusot area (for example, 150 houseswere built in the sole operation of Villedieu).
Housing conditions improved all the more after 1870 with the considerabledecrease in the rate of population growth. In 1863, Schneider opened a hospital inwhich his workers and employees, their wives and children under 15 years weretreated without charge; three consultancies were created within it as well aspharmacies. The level of medical efficiency was certainly not very high, butelementary advice on hygiene could thus be given to mothers and an awareness ofhealth was allowed to develop. Nor can one neglect the consequences of freeschooling for boys and girls. Future mothers were able to acquire notions of familyhygiene which may have contributed to the aforementioned accelerated decrease inmortality.
The relatively lower mortality among young masculine immigrants in LeCreusot during the period which marked the greatest cramming and promiscuityrequires some explanation. One can argue that those who emigrated from thecountry to the town were the strongest peasants – a form of selection bias. In such ahypothesis, the selection would not have come into play for their wives, who simplyaccompanied their husbands, which would explain their high mortality ratecompared to local women. Finally, it is not impossible that the young men whoimmigrated to Le Creusot had become progressively used, thanks to their formertemporary migrations, to a new bacterial environment, while their wives had nothad such an opportunity before settling in Le Creusot. Both explanations are morecomplementary than antagonistic. And Le Creusot is not an exceptional case.
The Others Cities
The growth of industrial workforce is not the only explanation for the new localpolicies that appeared in several French cities during the first decade of the ThirdRepublic. The phenomenon of the high mortality in some poor urban districts wasclearly known and for the new local elite – republican – it was no longer possible tobe apathetic. At the same moment, the multiplication of international scientificconferences on Public Health highlighted the creation of Municipal Board of Healthin Brussels (created by Dr. Janssens in 1863) and Turin (1864).15
15 Anne Rasmussen, ’L’hygiène en congrès (1852–1912): circulation et configurations
internationales’ in P. Bourdelais, Les Hygiénistes, enjeux, modèles et pratiques (Belin, Paris, 2001),213–239 ; Serenella Nonnis Vigilante, ’Idéologie sanitaire et projet politique. Les congrèsinternationaux d’hygiène de Bruxelles, Paris et Turin (1876–1880)’, in P. Bourdelais, LesHygiénistes, enjeux, modèles et pratiques (Belin, Paris, 2001), 241–265.
243
Following these conferences men such as Dr. Gibert of Le Havre succeeded inconvincing the majority of the town council of the utility to create such a Board.But not without difficulty. Between the opposition of the doctors who fear the lossof potential customers and the city council men who do not want to engage in anyadditional expenditure, the way is narrow. In order to convince the local elites andpublic opinion, Dr. Gibert leaves on mission to Brussels and addresses five letters toa newspaper of Le Havre so that it publishes them.16 Even if the rhetoric of theseletters is that of a political operation of promotion and a setting in scene of themedical claims, it is also a vibrating plea in favour of medical progress.17 Afterstating his admiration for the whole of the organization, Dr. Gibert shares with hisreader the visit to the office of the director of the Board of hygiene, Dr. Janssens.“Here you find a chart of the town of Brussels, constellated with a quantity of smallred, green points, blue, etc. You approach, each coloured point is a head of a pin;each pin, according to its colour, represents a disease. Each day Dr. Janssens pricksthese pins; thus, the smallpox is represented by a blue head, the typhoid fever by ared head, etc. It does not insert the pin of the day, it leaves it left all its height.Then, this made work, the chart is carried the evening, each evening, in the Mayoroffice, who, after having examined the new cases of contagious diseases, inserts thepins.” Thus, it adds, the mayor seizes in a simple glance which are the epidemicdangers and what is the trail of the disease. Information is collected by the doctorswho, vis-à-vis a case of “smallpox, scarlet fever, measles, typhoid fever, typhus fever,Asian cholera, diphtheria, epidemic dysentery”, fill an avis sanitaire addressed to theBoard of Hygiene; they indicate on it the name, the age and the residence of thepatient while respecting the professional confidentiality thanks to the use of anumbered nomenclature of 116 causes of death. Each day, the municipaladministration thus knows the magnitude of all new epidemic and can takeadequate measurements. In the event of smallpox, for example, all the inhabitantsof the house and street concerned are vaccinated or revaccinated. All clothing andpieces of furniture of the patient are disinfected, and the patient isolated as far aspossible downtown, or at the hospital in a service specific to the contagiouspatients. The Board of Hygiene also organizes daily and free vaccinations;moreover, all the pupils of the schools are revaccinated. If it is about the typhoidfever, as soon as a case is announced, the Office of Hygiene makes make an accuratecheck of the roadway system of the district, and particularly of the sealing of thesewers and water pipelines.
On the question of the unhealthy flats, very sensitive since the law of 1850, Dr.Gibert stresses that in Brussels, the commission of the unhealthy flats is joined
16 Bourdelais, (2003).17 Dr. Gibert, Une visite au Bureau d’hygiène de Bruxelles (Imprimerie F. Santallier, Le
Havre, 1878a).
244
together at the Board of Hygiene, so that “the municipal administration has anyauthority to make carry out by the owners the improvements which the Board ofHygiene will have asked for”, it is a also judge of the conformity of workcompleted. It describes finally the organization of medicine in the Brussels schools.Each school is visited once per week, which make it possible to the doctor toidentify the children with any contagious disease of the eyes, skin, scalp and toexclude them until their cure. He must give a brief lecture also there on this diseaseobserved at one of the pupils or on another epidemic. Gibert underlines the doubleutility of these lectures because “the children admirably retains all that one says tothem, and will repeat on at home these precepts of hygiene which penetrate moreeasily in the families in this manner than by the book or the journal.”
He completes his last letter by tackling the budgetary matters, to which the citycouncil men are necessarily very attentive. “Thanks to a weak sacrifice, theadministration saves many human lives, and it can be proud justifiably to havegiven to all Europe a similar example to follow.” Nevertheless, by mentioning thelevel of the wages of the doctors of the Board of Hygiene of Brussels, he insists onthe need for also remunerating them by Le Havre: “Pay your doctors well,otherwise you will not have anything. If you do not want to pay well, do not doanything. That is worth better.” These words are more poignant coming from adoctor who established the first dispensary for children in France, on his owncapital stocks, in Le Havre in 1875, and which gave free consultations everymorning! Like all the medical hygienists, he is convinced that this prevention policywill result in substantial savings on the budget of the hospital and that of themedical care.
In the creation of a Board of Hygiene in Le Havre, presented in front of thetown council of the city, Gibert insists on the eminent place that medicine mustoccupy in the management of the city.18 He succinctly captures the thoughts of themedical ambitions and hygienists of the time. “If the social life did not profit yetfrom all the progress made by medicine in our century, the fault is especially withthe routine which did not make it possible to the Doctors to up to now take in thesocial body the place to which they have right, and to be made the popularizers ofthe scientific conquests that they only can know and make.” A Board of Hygienewould fill four principal gaps of the existing systems: the timely monitoring ofepidemics; the roadway system and initially sewers and drainings (always thequestion of the sealing of the sewers, the use of the mobile tubs and the conditionsof removals of the refuses); the unhealthy houses (the law exists but is not applied,the Board of Hygiene would centralize the complaints, would supervise thecompletions of the work prescribed by the Commission of the unhealthy houses);
18 Dr Gibert, Fauvel and Lafaurie, Création d’un Bureau d’hygiène municipal (ImprimerieAlphée Brindeau et Cie, Le Havre, 1878b).
245
medical care (organization of the helps in residence, of means of bandage andtreatment distributed by districts, in order to prevent that the hospital becoming“the rendez-vous of all the wrecks of the social life”). The Board of Hygiene mustalso deal with the protection of the infants, of the ergonomics of the schoolfurniture as well as of the infectious diseases present in the schools, as well asorganization of baths for children.
Gibert by insisting on the relevance of the municipal scale of the Board ofHygiene, because “the municipalities, generally, do not listen or listen onlyimperfectly and almost never seriously into practice do not put the opinions of theCouncils of hygiene, departmental and of arrondissement.” Lastly, typical of theFrench elites, it does not fail to locate the efforts requested from the point of viewof the demographic safeguard of France: “A stronger reason the country will have itthe right to be applauded to have granted to hygiene its true place in the social life,if each year a more considerable number healthy and robust defenders is preservedfor the army, if a more crowd of arms is preserved at her workshops of all kinds,and if a greater number of girls are prepared, by a salutary education, with their roleof mothers... we are not the first in the production of the human life, now be thefirst in the economy and the saving of this treasure incomparable.”
Demographic fear and particularly the spectacle of the catastrophic mortalitywhich accompanies the urban growth at the end of the Second Empire are also atthe origin of the pleas in favour of the creation of Board of Hygiene in Nancy,Rheims or Grenoble. In the latter, Dr. Berlioz presents at his project of creation ofBoard of Hygiene at the end of the 1880’s and highlights on the high level ofmortality in his town compared to other comparable cities. He also highlights theextent of the fall recorded in the cities, which obtained this device and quotes theexample of Glasgow. Lastly, insofar as the Board mainly make it possible to fightagainst the epidemic mortality, which accounts for 20% of the whole of mortalityin Grenoble, its effectiveness would be significant.19
The first Board of Hygiene is created, after a year of committee work, by themunicipality of Le Havre in March 1879. It soon is followed by Nancy the sameyear, then by others towns: Rheims (1881), Saint-Etienne (1884), Amiens (1884),Pau (1885), Bordeaux (1890), Grenoble (1889); a new system is set up in Rouen atthe middle of 1880’s. Finally, if the debates in Parliament find hardly legislativeoutlets in the field of the public health, the cities multiply the initiatives. In aboutfifteen years, more than twenty French cities created this new municipal service inparticular.
One of the first effects of the existence of such Boards is the reinforcement ofthe control of the smallpox re-vaccinations and the attempt to determine the
19 Lucie Paquy, Santé publique et pouvoirs locaux. Le département de l’Isère et la loi du 15février 1902. History thesis (Université Lyon 2, 2001).
246
characteristics of the epidemics by their cartography. To this end, “sanitary registersof houses” (casiers sanitaires des maisons) are set up, in Le Havre (a la Brussels) andalso in other cities like Bordeaux, Nantes, Nancy or Saint- Etienne. The survey ofhouses or blocks and the comparison of numbers, which the renowned socialengineer Emile Cheysson recommends highly, constitute a prototype of the crossingof the administrative organization (hierarchical) with the empirical hypotheticaldeductive approach. In Le Havre, statistics of death by phthisis, typhoid, diarrhoeaenteritis as well as seasonal curves and charts by street are published regularly.
Paris launches out in its turn in the adventure of the constitution of sanitaryregister of houses of the capital in the last years of the 19th century. Tuberculosisand cancer are particularly tracked: the unhealthy small islands are representedstarting from a concentration of “cases” located with the address (number and nameof the way). But this innovation is not only technical: it rather translates as the willto “treat” the small islands. Cartography is one of the principal means ofvisualization and consolidates the territorialisation of the public action byidentifying infected places or environment: buildings, streets, small islands,subdistricts. The teaching aspect of many presentations leads to the publication ofdirectories, or of booklets, which as many become familiar tools for the localmunicipal officers and elected representatives. Issued from the comparison ofadministrative files concerned with two different sectors, the technical and thesocial one, the statistics made it possible to identify factors starting from simplecomparisons between the causes of death and the climate, the medicalinfrastructures, the characteristics of the residences etc. There is no more oppositionbetween the importance of the environment, in the neo-hippocratic sense, and therecent discoveries of bacteriology, because it from now on is empirically shown thatthe bacillus of Koch for example survives and multiplies more easily safe from thelight and in a humid atmosphere.
On the eve of the 1902 law, the first great general law of public health, whichimposes at the cities of more than 20 000 inhabitants to create an Office ofHygiene, many large French cities had already created such structures entirely ontheir municipal budget. Some had already moved onto the constitution of a sanitaryregister (casier sanitaire). The volume of the correspondence exchanged between theFrench cities, on technical subjects (organization of the night medical service,surveillance of the markets, organization of the Board of Hygiene, but alsoconstruction of the sewers) testifies these advances.
247
Institutionalisation, Professionalism.A Revenge of Non-Catholic Élite?
With the 3d Republic, a new group of politicians emerged: less conservative, moreoften non-catholic. It is amazing to have a list in each big city and to verify thispoint. In Le Havre, Jules Siegfried, belonging to the well-known protestant familyof industrialists in Mulhouse has been elected mayor. Dr. Gibert, protestant fromSwitzerland has married one of the daughters of another protestant Mulhouse’sfamily: the Dollfus. In Nancy, during the 1870’s, Charles Nathan-Picard, fromjewish religion, begins to advocate for more municipal credits for the officialmunicipal charitable Board.20 Some years later, the radical reorganization of themunicipal charitable system is from Léopold Lallement, lawyer and protestant. InRouen, Louis Ricard, republican and protestant, built the “Rouennais system” inthe 1880’s, and some other personalities of the reform in Rouen were freemason, aswas the first director of the Municipal Board of Health in Grenoble.
These men proposed to organize, under the municipal responsibility, newBoards of Health, new dispensaries, new systems to help poor people. Pushing awayall the catholic volunteers and religious nurses they proposed finally aninstitutionalisation, a municipalisation and a professionalisation of the peopleworking in charitable activities. These changes didn’t occur without any conflicts.Two examples illustrate the difficulties.
In Nancy, during the 1870’s, Charles Nathan-Picard proposed to makepermanent, non exceptional as it was usually, the relief to elderly people, widows,and ill people. For such a purpose, he asked for municipal funds. But the privatecatholic charitable organizations protested because they would loose their role andalso their social importance.
In Rouen, in 1879–1880, Ricard worked for a fusion between the social andsanitary administration of the city.21 For instance, the members of the fifteen boardsof the dispensaries are exclusively the catholic elite. So he designates somepersonalities from Jewish milieu and from protestant organizations. But a lot ofclashes occurred. Very explicitly, one of the previous catholic administrators writesthat in the Town Hall, behind the mayor, is the representation of the Republic withits claims for human rights, these he cannot recognize because he only abides byduties taught by the Christ. Guillou was dismissed for postponing the distributionof meat cards for poor to celebrate the 14th July (the anniversary of the Frenchrevolution) to the 17th, to “discredit the Republic”. Some months later a new clash
20 Sanford Elvitt, The Third Republic Defended: Bourgeois Reform in France, 1880–1914
(Louisiana State University Press, Baton Rouge, 1986).21 Yannick Marec, Bienfaisance communale et protection sociale à Rouen (1796–1927), La
Documentation française (Paris, 2002).
248
occurs between the new administration and two catholic nurses in charge of thepoor relief. They were opposed to the new reforms and refused to give card reliefjust to the poor regularly registered and even organized a demonstration of pooragainst the new administrator. It is in such a situation that the dismissal of thecatholic nurses was sought and that the municipality planned to employ municipalservants for each dispensary. Salaries were not the only cost. The buildings in whichthe dispensaries were organized belonged to the catholic orders or to the bishop.And so, a big municipal program to think what could be the new dispensaries andhow it would be possible to build it very quickly was launched.
But in Nancy, as in Rouen, the main concern of the new elite was thedistribution of relief to poor people without rules, just if they were “good poor”,belonging to the catholic influence networks and so on. In Rouen for instance, thecatholic nurses kept the relief cards of the dead and gave it to some poor peoplethey knew.
In such context, the municipalization of the Public Health and assistance systemseemed to republicans the only way to prevent favouritism, discrimination, and toimplement social justice in the relief distribution. For that, they had to propose newprocedures for the targeting of the poor. Voluntary workers (catholic) were pushedaway and replaced by new municipal servants who were more and moreprofessionalized. Criterions were produced: First, the person has to be an inhabitantof the city for one year at least. Second were the economic criteria – the person hasto have less than 1 franc per day from her work or be unable to work. For thefamilies, tables were established. The threshold to receive relief was fixed to 9 francseach week for a two persons family, 12 for a three persons family, 15 for a 4 personsfamily… Reliefs for elderly people are limited to those over 70. For each poorperson or family, a dossier had to be opened. The poor had to ask for relief on aform, supply a certificate for his address (given by the police officer), a receipt forhis flat rent, a marriage certificate, a birth certificate for children and unmarriedpeople, a vaccination certificate for each person in the family, a certificate from thedispensary’s physician indicating infirmities of the family members and a certificatefor school attendance (just after the laws on free primary schools, secularized andcompulsory). After receiving the dossier, the municipal employee (the ancestor ofour social workers) has to do an investigation at the family address, to verify theinformation given and to verify also if the situation of the family has changed sincethe opening of the dossier. For each district a position of verification officer wasopened and another one existed to the central level of the municipality. So, theinformation on individuals and families were verified and crossed before relief! Thetransparency was the prerequisite for social justice; but it has also opened the doorsto the interpretations in terms of social control.
249
Each step of the process means to invent printed forms, cards, alphabeticalsystems to cross the information between all the relief districts. A realprofessionalism emerged and improved very quickly.
In the 1880’s, another new direction was the linking of social assistance tomedical care. For instance, in Rouen all the new dispensaries built had a specialroom for medical examination. This was the case in Le Havre since the 1870’s, buton a private basis of private and individual beneficence (Dr. Gibert personaldispensary). Physicians were appointed to the dispensaries and their role was totreat minor illnesses before it worsened and required hospitalisation. So, aneconomic purpose was also behind this policy of preventive medicine : the choicewas to invest more money in Municipal Board of Health, in dispensaries, to try todiminish strongly the very high hospital budgets.
Conclusion
Around the middle of the 19th century, in France, industrialization leads tourbanization of old market town or countryside places as well as the development ofworkers areas in larger cities. In the first case, all the European studies, in thisinstance in Le Creusot, show how the consequences of the unregulated growth ofthe industrial city had tremendous consequences on the decline of the expectancy oflife and on the high level of childhood mortality. A paternalistic policy improves thelocal environment and sanitary situation to mitigate the penalty of growth. Thenew liberal economy was not able to provide people regular work and wages makingfamilies vulnerable to pauperisation because of illness of the father or because of theeconomic situation. In a lot of large cities, poverty lead to a high mortality and toepidemics. The first policy against the mortality and the epidemics, to improvePublic health occurred at the local level. As early as the 1870s a variety of localinitiatives have been initiated. But it is clear that the change of political regime hasalso been decisive. The new local political elite increasingly came from Protestant orJewish origins and freemasons became more influential. In that context, it ispossible to analyse why and how the assistance system and public health structureshave been municipalized. For the Republican, often non active catholic elite or notat all catholic, the social justice in attribution of relief was linked to transparency ofprocedures. That led to a reflection about the objectiveness of the criterion chosento decide who will be relieved. New methods, new forms, new investigation followand a professionalisation of what will become the “social” work, as a guarantee forrational choice between people to help. Introduced to compensate the uncertaintyof workers revenues, the system was rapidly linked to health perspective and
250
medical cares, even to preventive medicine. The question of the regulation of socialchanges and of consequently vulnerability is still addressed to our societies.
Patrice Bourdelais is Professor and Head of the Interdisciplinary researchprogramme “Medicine, Health and Social Sciences” at Ecole des hautes etudes ensciences socials, 75006 Paris, France.
251
References
Bourdelais, Patrice, Les épidémies terrassées. Une histoire de pays riches (Editions de LaMartinière, Paris, 2003).
Bourdelais, Patrice and Michel Demonet, ‘Demographic Changes in EuropeanIndustrializing Towns. Examples and Elements for Comparison’, The Historyof the Family. An International Quarterly, 5, 4, (2000), 363–372.
Bourdelais Patrice, ‘Infant mortality in France, 1750–1950, Evaluation andPerspectives’, in The decline of infant mortality in Europe –1800–1950– Fournational case studies, ed. Carlo Corsini and Pier Paolo Viazzo (Florence,UNICEF, 1993, 51–69).
Cancal Dr., ‘Note à M. le Dr. Carion, médecin des épidémies de l’arrondissementd’Autun’ (Académie François Bourdon, Le Creusot, March, 1859).
Eggerickx, Thierry, and Marc Dubuisson, ‘La surmortalité urbaine : le cas de laWallonie et de Bruxelles à la fin du XIXe siècle (1889–1892)’, Annales deDémographie Historique (1990), 23–41.
Elvitt, Sanford, The Third Republic Defended: Bourgeois Reform in France, 1880–1914 (Louisiana State University Press, Baton Rouge, 1986).
Fijalkow, Yankel, La construction des îlots insalubres, Paris 1850–1945(L’Harmattan, Paris, 1998).
Gibert Dr., Une visite au Bureau d’hygiène de Bruxelles (Imprimerie F. Santallier, LeHavre, 1878a).
Gibert Dr., Fauvel and Lafaurie, Création d’un Bureau d’hygiène municipal(Imprimerie Alphée Brindeau et Cie, Le Havre, 1878 b).
Hamlin, Christopher, Public Health and Social Justice in the Age of Chadwick,Britain, 1800–1854 (Cambridge University Press, 1998).
Kearns, Gerry, ‘Le handicap urbain et le déclin de la mortalité en Angleterre et auPays de Galles 1851–1900’, Annales de Démographie Historique (1993), 75–105.
La Berge, Ann, Mission and Method. The Early Nineteenth Century French PublicHealth Movement (Cambridge University Press, 1992).
Lynch, Kate, Family, Class, and Ideology in Early Industrial France (The Universityof Wisconsin Press, 1988).
Marec, Yannick, Bienfaisance communale et protection sociale à Rouen (1796–1927). La Documentation française (Paris, 2002).
Nonnis Vigilante, Serenella, ‘Idéologie sanitaire et projet politique. Les congrèsinternationaux d’hygiène de Bruxelles, Paris et Turin (1876–1880)’, in P.Bourdelais, Les Hygiénistes, enjeux, modèles et pratiques (Belin, Paris, 2001),241–265.
252
Ott, Florence, La Société Industrielle de Mulhouse, 1826–1876, ses membres, sonaction, ses réseaux (Presses universitaires de Strasbourg, 1999).
Paquy, Lucie, Santé publique et pouvoirs locaux. Le département de l’Isère et la loidu 15 février 1902. History thesis (Université Lyon 2, 2001).
Preston, Samuel, and Etienne Van de Walle, ‘Urban French Mortality in theNineteenth Century’, Population Studies, 32,2 (1978), 275–297.
Quincy-Lefebvre, Pascale, ‘Naissance et affirmation d’un service public dans lemonde de la charité’, in André Gueslin and Pierre Guillaume, De la charitémédiévale à la sécurité sociale (Les éditions ouvrières, Paris, 1992), 91–106.
Rasmussen, Anne, ‘L’hygiène en congrès (1852–1912): circulation et configurationsinternationales’, in P. Bourdelais, Les Hygiénistes, enjeux, modèles et pratiques(Belin, Paris, 2001), 213–239.
Revel, Jacques, Jeux d’échelle, la micro-analyse à l’expérience (Gallimard-Le Seuil,Paris, 1996).
Thompson, Edward Palmer, The Making of the English Working Class (London,Victor Gollancz, 1963).
Ure, Andrew, The Philosophy of manufactures; or an Exposition of the scientific,moral and commercial economy of the factory system of Great-Britain(London, Charles Knight, 1835).
Villermé, Louis-René, Tableau de l’état moral et physique des ouvriers employésdan sles manufactures de coton, laine et de soie (1840, reprint EDI, Paris,1989).
Williams, Naomi, and Chris Galley, ‘Urban-rural differentials in infant mortality inVictorian England’, Conférence on ‘The European decline of infant mortality’,Istituto degli Innocenti, Florence, 5–7 décembre 1994 (1994).
253
Table
Table 5. Life expectancy at birth. France 1806–2001.Year Men Women Year Men Women Year Men Women Year Men Women