Mr Mathieu Verougstraete Economic Affairs Officer UNESCAP – Financing For Development Improving public investment efficiency for infrastructure development Hanoi, 3 October 2017 National Workshop on Infrastructure Financing Strategies for Sustainable Development in Viet Nam
Transcript
Mr Mathieu Verougstraete
Economic Affairs Officer
UNESCAP – Financing For Development
Improving public investment efficiency for infrastructure development
Hanoi, 3 October 2017
National Workshop on Infrastructure Financing Strategiesfor Sustainable Development in Viet Nam
Current Situation
▪ Infrastructure Needs in Vietnam
= approx. $20 billion per year (i.e. around 10% of GDP)
↗ by around 2% of GDP
▪ Tight fiscal constraints
Need to prioritize investment / Maximize value-for-money
• Poor project selection (e.g. based on political considerations)
• Delays in design and completion of projects
• Corrupt procurement practices
• Cost over-runs / Incomplete projects
• Failure to operate and maintain assets effectively
▪ Typical issues with infrastructure projects
Viet Nam’s StrategySocio-Economic Development Plan (2016-2020)
✓ Infrastructure Components
• Fairer and more transparent procurement, minimizing pre-assigned contractors and using land of high commercial value;
• Strengthened inspection and monitoring of investment projects;
• Improvement of the quality and effectiveness of public investments;
• Reduction of corruption
• Promotion of market for public services and prioritization of PPPs;
• Greater transparency, stability and fairness to encourage business to invest in infrastructure projects;
• Support for renewable energy sources;
• Construction of urban and infrastructure systems with priority on projects responding to climate change;
• Commitment to integrate SDGs in the socio-economic programs and plans;
Project CycleImproving efficiency throughout the project cycle
Planning -Prioritization
Delivery –Procurement
Operation and
Maintenance
Some countries achieve the same level of infrastructure quality with less investment
Efficiency Gap estimated to 10% (South-East Asia)
Potential savings ~ $16 billion per year
Boosting productivity can reduce infrastructure spending by 40% according to McKinsey
Agenda
✓ Strengthening Planning and Prioritization
✓ Streamlining infrastructure project delivery
✓ Making the most of infrastructure assets
Strengthening Planning and Prioritization
Infrastructure Plan
✓ Does the country have a National or Sub-National Infrastructure Plan?
• Provide a long-term vision (infrastructure assets can last 50 years)
• Assess infrastructure deficiencies
• Coordinate different infrastructure sectors
• Identify the possibility of charging users No
50%Yes50%
• Highlight policy reforms required (e.g. tariff)
Source: GIH Compass based on 48 countries
• Align investment with countries priorities / development objectives (e.g. SDG)
• Develop in consultation with stakeholders
✓ Sector Strategies/Master Plans (transport, energy,…) and SEDP at the national level: are there issues to address in planning? Better alignment of infrastructure projects with strategy (SEDP)? Annual budgeting vs. Medium-Term Expenditure Framework? Coordination vs. decentralization in budget implementation? Public Investment Law?
Strengthening Planning and PrioritizationAppraisal Guidelines
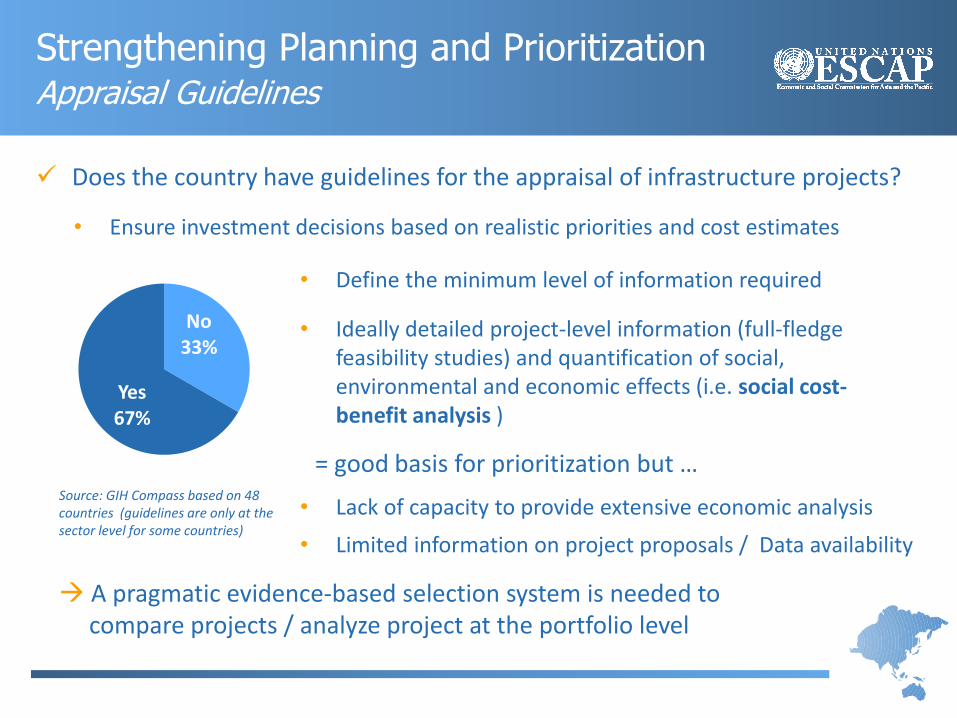
✓ Does the country have guidelines for the appraisal of infrastructure projects?
Source: GIH Compass based on 48 countries (guidelines are only at the sector level for some countries)
• Ideally detailed project-level information (full-fledge feasibility studies) and quantification of social, environmental and economic effects (i.e. social cost-benefit analysis )
• Ensure investment decisions based on realistic priorities and cost estimates
• Define the minimum level of information required
• Lack of capacity to provide extensive economic analysis
• Limited information on project proposals / Data availability
= good basis for prioritization but …
A pragmatic evidence-based selection system is needed to compare projects / analyze project at the portfolio level
No33%
Yes67%
Strengthening Planning and PrioritizationMulti-criteria approach
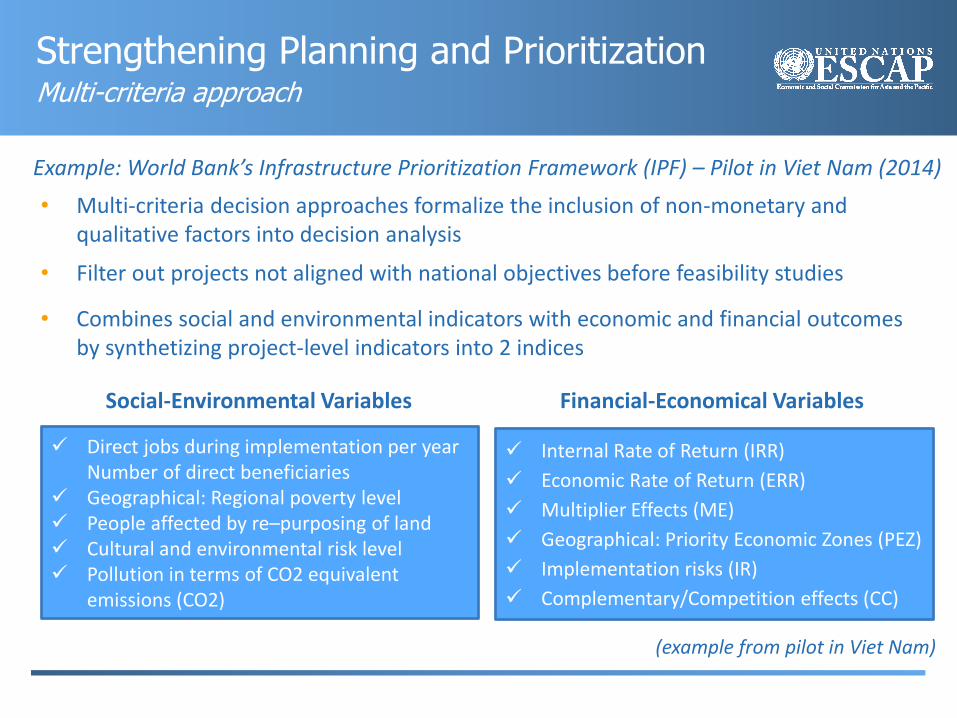
Example: World Bank’s Infrastructure Prioritization Framework (IPF) – Pilot in Viet Nam (2014)
• Multi-criteria decision approaches formalize the inclusion of non-monetary and qualitative factors into decision analysis
• Combines social and environmental indicators with economic and financial outcomes by synthetizing project-level indicators into 2 indices
✓ Direct jobs during implementation per year Number of direct beneficiaries
✓ Geographical: Regional poverty level ✓ People affected by re–purposing of land✓ Cultural and environmental risk level✓ Pollution in terms of CO2 equivalent
emissions (CO2)
Social-Environmental Variables
✓ Internal Rate of Return (IRR)
✓ Economic Rate of Return (ERR)
✓ Multiplier Effects (ME)
✓ Geographical: Priority Economic Zones (PEZ)
✓ Implementation risks (IR)
✓ Complementary/Competition effects (CC)
• Filter out projects not aligned with national objectives before feasibility studies
Financial-Economical Variables
(example from pilot in Viet Nam)
Strengthening Planning and PrioritizationWorld Bank’s Infrastructure Prioritization Framework (IPF)
✓ No need to monetize all benefits and costs
✓ Designed for application within only one sector
Strengthening Planning and PrioritizationGender Considerations
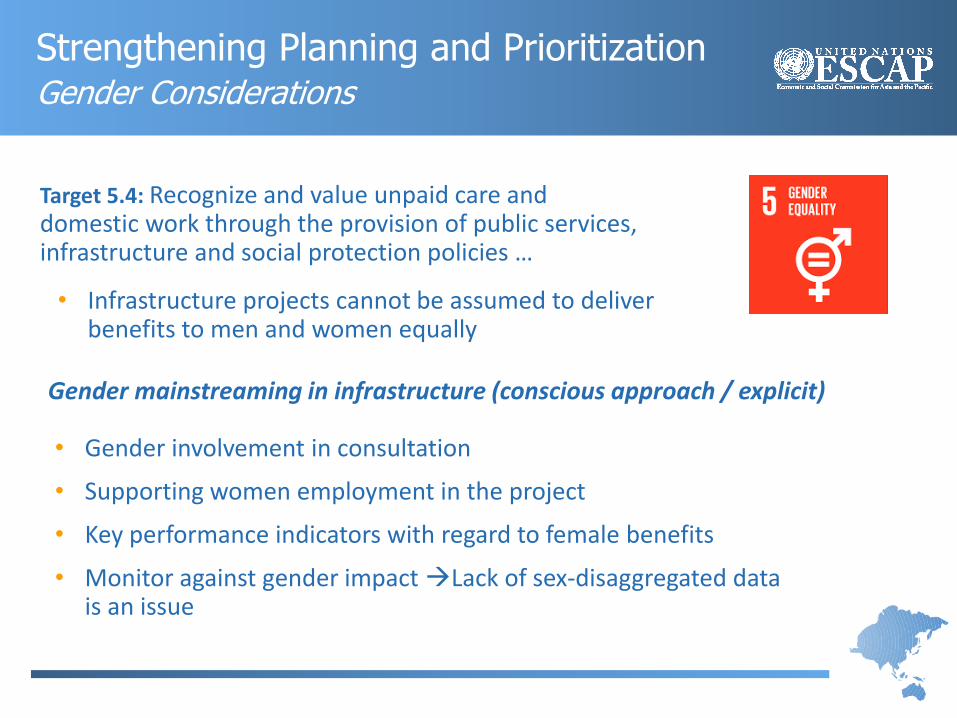
Target 5.4: Recognize and value unpaid care and domestic work through the provision of public services, infrastructure and social protection policies …
• Infrastructure projects cannot be assumed to deliver benefits to men and women equally
Gender mainstreaming in infrastructure (conscious approach / explicit)
• Gender involvement in consultation
• Supporting women employment in the project
• Key performance indicators with regard to female benefits
• Monitor against gender impact Lack of sex-disaggregated data is an issue
Agenda
✓ Strengthening Planning and Prioritization
✓ Streamlining infrastructure project delivery
✓ Making the most of infrastructure assets
Streamlining infrastructure project deliveryAccelerating permit approvals and land acquisition
In India, 70 to 90% of road projects suffer a 15 to 20% delay due to challenges in land acquisition
Construction Permits Quality of the land administration index (0-30)
Source: World Bank Doing Business
✓ “one-stop-shop” permitting and clear allocation of responsibilities
✓ Quick dispute resolution mechanisms, and land titles register
86 % of public infrastructure projects are above budgetSource: Flyvpjerg et al. / data: 258 Infra Projects over 1910-2000 (Europe / USA / Japan)
Source: Kenny, C. (2006). WB Working Paper 4099
Estimated globally at between 5 to 20 per cent of construction costs
✓ Internal controls / Audits
Possible measures: Income and asset declaration of government officials (financial disclosure and conflicts of interests)
0 20 40 60 80 100
CambodiaMyanmar
Timor-LesteIndonesia
VietnamPhilippines
ThailandMalaysia
Singapore
Perceived Control of Corruption in SEA (Percentile Rank – 2015)
Source: World Bank
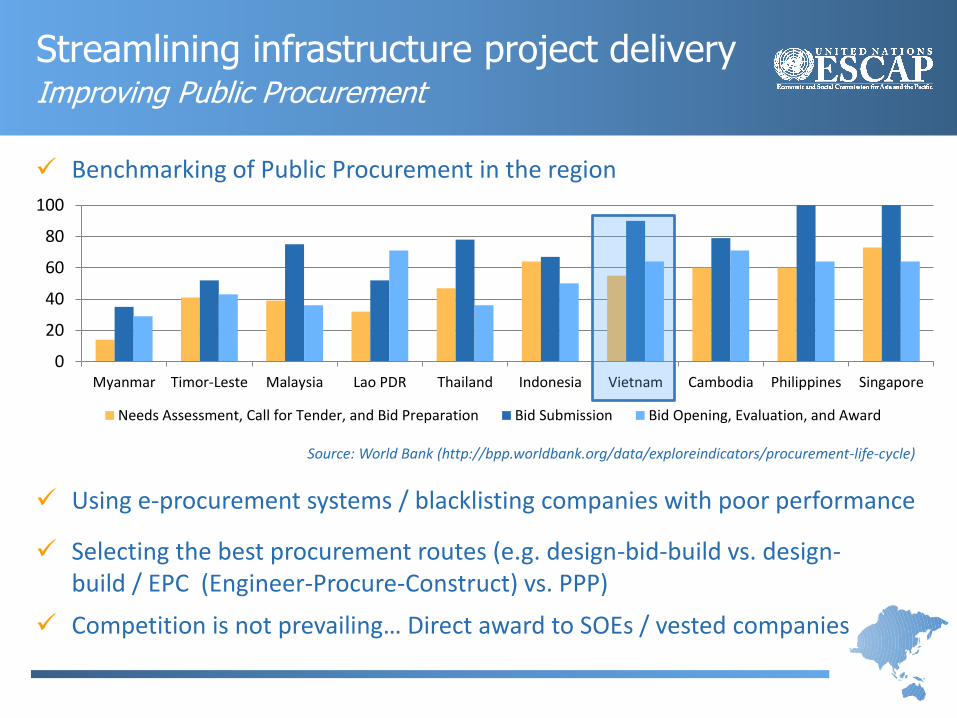
Streamlining infrastructure project deliveryImproving Public Procurement
✓ Benchmarking of Public Procurement in the region
Source: World Bank (http://bpp.worldbank.org/data/exploreindicators/procurement-life-cycle)
✓ Selecting the best procurement routes (e.g. design-bid-build vs. design-build / EPC (Engineer-Procure-Construct) vs. PPP)
✓ Using e-procurement systems / blacklisting companies with poor performance
0
20
40
60
80
100
Myanmar Timor-Leste Malaysia Lao PDR Thailand Indonesia Vietnam Cambodia Philippines Singapore
Needs Assessment, Call for Tender, and Bid Preparation Bid Submission Bid Opening, Evaluation, and Award
✓ Competition is not prevailing… Direct award to SOEs / vested companies
Agenda
✓ Strengthening Planning and Prioritization
✓ Streamlining infrastructure project delivery
✓ Making the most of infrastructure assets
Making the most of infrastructure assetsMoving away from Build, Neglect, and Rebuild paradigm
Every dollar spent on regular road maintenance can save more than $5 on refurbishing and rebuilding of road…
✓ Set aside funds for maintenance
✓ Decisions take into account immediate capital + future operation and maintenance costs
✓ Regularly assess and catalog the condition of infrastructure
Modern maintenance techniques such as remote asset inspection , feedback systems from users, etc.
Maintenance budgets often cut (no immediate consequences)
Dedicated funds (from user taxes and user charges) decouple maintenance resources from annual appropriation discussion
✓ Extend asset life by integrating resilience considerations
Resilient design codes – protective barriers
Sector Medium-Term Plan
Making the most of infrastructure assetsAvoiding political bias towards new infrastructure projects
✓ Demand management techniques to reduce the need for additional infrastructure by smoothing the demand and shifting load off-peak
✓ Reducing transmission and distribution losses in water and power
Need to realize the magnitude of the issue and address it (e.g. performance incentives)
(e.g. congestion charges, energy efficiency standards, peak pricing, water education programme)
often costs less than 3% of adding the equivalent in new production capacity + faster
23.420.5
9.4 9.4 9.26.4 6.1 5.8
2.0
0
5
10
15
20
25
Electric power transmission and distribution losses(% of output - 2014)
Non-Revenue Water (NRW) is about 25% in urban areas
Making the most of infrastructure assetsOptimizing usage
✓ Maximizing asset utilization
Intelligent transport systems can reduce headways between vehicles (e.g. airport and port capacity can double or triple for a fraction of the cost) and address specific bottlenecks (e.g. road e-tolling)
Measure to encourage users to use the full capacity (e.g. high-occupancy lanes)
✓ Leveraging additional source of revenues
Some airports realize more than 50% of their revenues from retails, hotels, etc.
Conclusion
▪ Improving project selection and introducing sustainability as well as gender considerations
Significant savings can be achieved by
▪ Streamlining infrastructure project delivery, improving governance and allocating sufficient funding to maintenance
▪ Maximizing the use of existing assets by managing demand and leveraging additional sources of revenues