81
IMPROVING RESOURCE EFFICIENCY IN AN ICE CREAM FACTORY BASED ON MATERIAL FLOW COST ACCOUNTING METHOD MOHAMMAD AMIN AMERI FACULTY OF SCIENCE UNIVERSITY OF MALAYA KUALA LUMPUR 2017

IMPROVING RESOURCE EFFICIENCY IN AN ICE CREAM FACTORY BASED ON MATERIAL FLOW COST ACCOUNTING METHOD
MOHAMMAD AMIN AMERI
FACULTY OF SCIENCE UNIVERSITY OF MALAYA
KUALA LUMPUR
2017

ii
IMPROVING RESOURCE EFFICIENCY IN AN ICE CREAM FACTORY BASED ON MATERIAL FLOW COST ACCOUNTING METHOD
MOHAMMAD AMIN AMERI
DISSERTATION SUBMITTED IN FULFILLMENT OF THE REQUIREMENTS
FOR THE DEGREE OF MASTER OF TECHNOLOGY (ENVIRONMENTAL
MANAGEMENT)
INSTITUTE OF BIOLOGICAL SCIENCES FACULTY OF SCIENCE
UNIVERSITY OF MALAYA KUALA LUMPUR
2017
2017

iii
UNIVERSITY OF MALAYA
ORIGINAL LITERARY WORK DECLARATION
Name of Candidate: Mohammad Amin Ameri I.C/Passport No: H95659908 Registration/Matric No: SGH100004
Name of Degree: Master of Technology
Title of Project Paper/Research Report/Dissertation/ Thesis (‘’this Work’’):
Improving Resource Efficiency in an ice-cream factory based on Material Flow Cost Accounting Method
Field of Study: Environmental Management
I do solemnly and sincerely declare that:
(1) I am the sole author/writer of this Work;
(2) This Work is original;
(3) Any use of any work in which copyright exists was done by way of fair dealing and for permitted purposes and any excerpt or extract from, or reference to or reproduction of any copyright work has been disclosed expressly and sufficiently and the title of the Work and its authorship has been acknowledged in this Work;
(4) I do not have any actual knowledge nor do I ought reasonably to know that the making of this work constitutes an infringement of any copyright work;
(5) I hereby assign all and every rights in the copyright to this Work to the University of Malaya (‘’UM’’), who henceforth shall be owner of the copyright in this Work and that any reproduction or use in any form or by any means whatsoever is prohibited without the written consent of UM having been first had and obtained;
(6) I am fully aware that if in the course of making this Work I have infringed any copyright whether intentionally or otherwise, I may be subject to legal action or any other action as may be determined by UM.
iv
Candidate’s Signature: Date:
Subscribed and solemnly declared before,
Witness’s Signature Date:
Name
Designation
v
ABSTRACT
Due to the anthropogenic activities for the last 300 years, the earth has had so many changes.
Human’s first conflict with nature started after the industrial revolution in 18th centuries,
when factories were being built one after another. Among all these industries, food industry
like many others generate wastes but the attention to this industry has always been less as the
waste characteristics is non-hazardous and biodegradable. The main challenges for food
industry when it comes to waste are: packaging, processing wastes and their influence over
municipal solid waste. For waste reduction, there has been many tools and approaches in
which Material Flow Cost Accounting (MFCA) is the latest. MFCA was applied for the first
time in Malaysia in an SME and an Ice Cream factory in Ipoh. Based on the MFCA approach,
one product with highest amount of production was picked. Next step was to study the
product’s process flow, data collection, data analysis with STAN software and
countermeasure to reduce the cost and increase the profit. The result was interesting as waste
generation regardless of its measurement unit becomes more expensive as the process moves
forward. Therefore, after identifying the source of waste, the main efforts was to reduce waste
and costs at the later stages. Even though the cost reduction might not be significant but by
considering the number of SMEs in Malaysia, even small amount of saving from wastes
could have a positive impact on country’s economy and environment.
vi
ABSTRAK
Akibat aktiviti antropogenik yang berlaku sejak 300 tahun yang lepas, bumi telah melalui
banyak perubahan. Konflik pertama manusia dengan alam semula jadi bermula selepas
revolusi perindustrian pada abad ke-18 iaitu apabila kilang telah dibina satu demi satu. Di
kebanyakkan industri makanan terutamanya yang menjana sisa mendapat perhatian kerana
cirinya yang tidak membahayakan serta mesra alam. Cabaran utama bagi industri makanan
yang menjana sisa ialah: pembungkusan, pemprosesan sisa dan pengaruh terhadap sisa
pepejal perbandaran. Dari segi pengurangan sisa, pendekatan terbaru dan terdekat yang
digunakan ialah Kos Aliran Bahan Perakaunan (MFCA). MFCA telah digunakan buat kali
pertama di Malaysia dalam industri kecil dan kilang Ais Krim di Negeri Ipoh. Berdasarkan
pendekatan MFCA, satu produk dengan nilai tertinggi dalam pengeluaran telah dipilih.
Langkah seterusnya adalah untuk mengkaji aliran proses produk, pengumpulan data, analisis
data menggunakan perisian STAN serta balas untuk mengurangkan kos dan meningkatkan
hasil keuntungan. Keputusan yang diperoleh menunjukkan bahawa penjanaan sisa tanpa unit
adalah lebih mahal di peringkat terakhir proses. Oleh sebab itu, setelah mengenal pasti
sumber sisa, langkah utama adalah bagi mengurangkan sisa dan kos pada peringkat yang
seterusnya. Walaupun pengurangan kos mungkin tidak signifikan, tetapi setelah
mempertimbangkan jumlah kilang di bawah industri kecil di Malaysia, maka penjimatan
yang minimum daripada sisa boleh memberi kesan positif terhadap ekonomi negara dan alam
sekitar.
vii
ACKNOWLEDGEMENT
First and foremost, I wish to thank God for being with me throughout the entire journey in
completing my dissertation successfully. My heartfelt gratitude to my supervisors Dr. Noor
Zalina Binti Mahmood and Dr. Abdul Halim Bin Sulaiman, for their guidance and support.
My gratitude towards my parents, family and friends who were always there to support
without fail in completing my project. My appreciation towards those who guided me in
providing fruitful information and knowledge in the field of my research.
Special thanks to my lecturers. MTech mates, ISB, IPS, UM and the Dean of the Institute of
Postgraduate Studies and Research for the funding of this study. It wouldn’t have been
completed despite the challenges faced without all of them.
My sincere appreciations to my dear friends Mehdi Almasi and Theepa for their kind
assistance in preparation of this dissertation and for being very patient with me during this
time. And finally, I would like to dedicate this dissertation to my beloved nieces Maryam and
Sophie and my young nephews Youssef and Abbas who I wish them to grow in communities
with wise consumption, greener practices and cleaner earth. As wise men have always said
that we have not inherited earth from our ancestors but have borrowed it from our children.
I sincerely hope this humble dissertation would be a stepping stone for a better future for
everyone on this planet.
THANK YOU

viii
Contents ABSTRACT.......................................................................................................................................v
ABSTRAK........................................................................................................................................vi
ACKNOWLEDGEMENT..............................................................................................................vii
LIST OF FIGURES..........................................................................................................................x
LIST OF TABLES...........................................................................................................................xi
CHAPTER ONE: INTRODUCTION..............................................................................................1
1. Introduction...........................................................................................................................1
1.1. Scope and research objectives....................................................................................3
CHAPTER TWO: LITERATURE REVIEW................................................................................4
2. Food Industry in Malaysia....................................................................................................4
2.1. Sub - Sectors of Food Industry.......................................................................................4
2.1.1. Livestock and Dairy.....................................................................................................5
2.1.2. Nature of Involvement by the Dairy Industry...........................................................5
2.2. Overview of Dairy Processing Industry.........................................................................6
2.2.1. Introduction.....................................................................................................................6
2.3. Trends in the Dairy Industry..........................................................................................8
2.3.1. Dairy Processing Plant Schemes....................................................................................9
2.3.1.1 Introduction...........................................................................................................9
2.3.1.2. Processing Operations..............................................................................................9
2.4. Wastewater Characterization of Dairy Plant....................................................................11
2.4.1. Introduction..................................................................................................................11
2.4.2. Dairy Industry Wastewater-Pollution/pollutant........................................................12
2.4.3. Environmental Impacts of Dairy Processing Plant/ Dairy products........................14
2.5. Water Consumption in Dairy Processing Industry..........................................................16
2.5.1. Effluent discharge in dairy processing plant..............................................................18
2.6. Overview of Dairy Processing Plant Worldwide..............................................................19
2.7. Ice Cream Production.........................................................................................................20
2.7.1. Science of Ice Cream....................................................................................................20
2.7.2. Producing ice cream with a high overrun..................................................................23
2.7.3. The effects of emulsifiers..............................................................................................23
2.7.4. Types of emulsifiers......................................................................................................24
2.7.5. The effect of stabilizers in an ice cream with high overrun......................................25
ix
2.7.6. Manufacturing ice cream with 150 to 185% overrun................................................26
2.7.7. The importance of air in ice-cream.............................................................................26
2.8. Cleaner Production...................................................................................................27
2.8.1. Cleaner Production in Dairy Processing Industry.................................................27
2.8.2. Cleaner Production Opportunities..........................................................................29
2.8.3. Material Flow Cost Accounting (MFCA)...............................................................31
2.8.3.1. ISO 14051: Standard approach for Material Flow Cost Accounting..........33
2.8.3.2. Practical Examples of MFCA Application.....................................................33
2.8.3.3. Difference between material flow cost accounting and conventional costs accounting...........................................................................................................................34
CHAPTER THREE: MATERIALS AND METHODS..............................................................38
3. Introduction............................................................................................................................38
3.1. Research methodology qualitative approach................................................................39
3.2. Research methodology quantitative approach.......................................................41
3.3. Research methodology data analysis, discussion and repeat................................42
CHAPTER FOUR: RESULTS AND DISCUSSION...................................................................46
4.1. Process Flow..............................................................................................................46
4.2. Identifying the Quantity Centres.............................................................................50
4.3. Quantity Centre 1 (Preparation and mixing).........................................................51
4.4. Quantity Centre 2 (Filling & Nuts).........................................................................53
4.5. Quantity Centre 3 (Packing)....................................................................................57
4.6. Data analysis on all quantity centres.......................................................................61
CHAPTER FIVE: CONCLUSION AND RECOMMENDATIONS.........................................64
REFERENCES...............................................................................................................................66
SUPPLEMENTARY......................................................................................................................70

x
LIST OF FIGURES
Figure 2.1 Diagram of Dairy Processing Plant 8
Figure 2.2 E471 25
Figure 2.3 E472b 25
Figure 2.4 Typical water uses and effluent sources in a dairy 29
Figure 2.5 Material input and total costs for a product 32
Figure 3.1 Research Boundary is inside the factory and production line 38
Figure 3.2 Factory’s layout and products and selected product for the study 40
Figure 3.3 Scope of the study and processes which can be measured 41
Figure 4.1
Figure 4.2
An example of a sticky note with all their inputs and outputs
Process flow for Crunchy Chocolate Cone ice cream
46
47
Figure 4.3 Quantity Centres 1, 2 and 3 51
Figure 4.4 Quantity Centres 1 and its inputs and outputs 52
Figure 4.5 Quantity Centres 1 and its inputs and outputs 53
Figure 4.6 Quantity Centres 1 and its inputs and outputs 57

xi
LIST OF TABLES
Table 3.1 Example of a material flow cost matrix for a quantity centre 44
Table 4.1 Inputs and outputs of Quantity Centre 52
Table 4.2 Number of produced CCC ice creams for 6 months since August 2013 54
Table 4.3 Number of defected CCC ice creams in the filling process starting
August 2013
54
Table 4.4 Cost of defected ice creams in the filling process starting August 2013
(RM)
55
Table 4.5 Data on 0.5 and 1.5 litre ice cream from same batch as CCC ice cream 56
Table 4.6 Quantities of packing process 58
Table 4.7 Products and wastes packing and hardening 59
Table 4.8 Number of defected CCC in packing process starting August 2013 60
Table 4.9 Cost of defected ice creams in the packing process starting August 2013
(RM)
61
Table 4.10 Ratio between number of defects in filling and packing processes 62
Table 4.11 Ratio between cost of product defects in both filling and packing
processes
62
1
CHAPTER ONE: INTRODUCTION
1. Introduction
Due to the anthropogenic activities for the last 300 years, the earth has had so many changes.
Human has invented so many things to make his life easier and to satisfy his ego. However,
not all human’s innovations have been sustainable and in favour of the environment.
Human’s first conflict with nature started after the industrial revolution in 18th centuries,
when factories were being built one after another. The economy growth was rapid and the
hunger for consumption and production was unlashed and that has caused so many
disturbance and stress to the ecosystem due to the high volume of contaminants emission
(Eco-Issues, 2011). Ever since, human tried to mitigate this issue which in many ways has
direct relationship with its economy. Even United Nation Environment Program (UNEP) has
established the Sustainable Consumption and Production (SCP) Branch with its integrated
life-cycle approach towards achieving more sustainable consumption and production patterns
(UNEP Sustainable Consumption, 1998). Economic crisis in 2008 could be considered as a
turning point for the sixth wave of innovation (resource efficiency) as it has led many
industries to focus on another product (negative product or waste) in their processes (Moody
and Nogrady, 2010).
Food industries like many others generate wastes but the attention to this industry has always
been less as the waste characteristics is non-hazardous and biodegradable (Darlington et al,
2008). This industry faces three main challenges when it comes to waste: packaging,
processing wastes and their influence over municipal solid waste (DEFRA, 2009). However,
the main focus of this research is to focus on the waste minimization which stands on top of
the waste management hierarchy and in most cases is more efficient and economic than waste
2
treatment. There are many different approaches to deal with waste minimization which
among them, MFCA (Material Flow Cost Accounting) is the latest Environmental
Management Accounting (EMA) tool which has already proved its effectiveness in many
industries in Japan (Japanese Ministry of Economy, Trade and Industry, 2010) and since
2011 it has been published as a new ISO standard (ISO14051). The benefits of this new
method in terms of cost reduction, increasing profit and decreasing environmental impacts
are attracting more industries in different countries (MPC Creanova, 2010). In Malaysia,
MFCA has already been implemented in several industries such as automobile parts and
electrical cables manufactures. Unlike MFA (Material Flow Analysis) which its main focus
is on materials and substances, MFCA also studies energy as well as costs for machine and
labour. Even looking at wastes and costs associated with, is different as in MFCA waste is
considered as negative product which means material and energy have been consumed to
generate this product or waste (Jasch, 2009). Generated waste during the processes might
have the same characteristics but the costs of wastes in latter processes are much higher as it
is carrying all the costs (energy and labour) from the previous processes.
For the first time in Malaysia, MFCA is being implemented in an SME - a semi-automatic
ice cream factory established in 1977 in Ipoh, Perak. The factory produces over 300 types of
products, however, not all of them are produced daily and in this study, only “Chocolate
Crunchy Cone” (CCC) product is considered which has the highest sales and productions
among others. The factory already has a successful production and quality management
program, but due to the market change (clients now have environmental consideration),
wastewater treatment cost and more strict environmental laws, factory decided to implement
the MFCA in addition to increase its profit by waste reduction and step forward towards
sustainable development. Factory is generating three types of wastes which are wastewater

3
(result of washing the equipment and its characteristics are not in compliance with the
standard and therefore needs treatment), defect products (due to the machine malfunction or
during the packaging process) and excessive packaging.
1.1. Scope and research objectives
The scope of this study will be on production of Chocolate Crunchy Cone (CCC) ice cream
in the period of six months study on this specific product and the objectives of this research
are:
1. To ascertain the process flow and establish material flow balance;
2. To identify the types and sources of waste/emission;
3. To calculate/convert the physical unit of waste/emission to monetary unit;
4. To propose improvement measures for selected ice cream product using MFCA
approach;

4
CHAPTER TWO: LITERATURE REVIEW
2. Food Industry in Malaysia
Malaysia’s food industry is rich in terms of tropical and agricultural resources reflecting
diverse cultures in Malaysian society consisting of Malay, Chinese and Indian (Abdul Manaf,
2008). The increasing awareness of consumer in nutrition value and food for healthcare has
created demand for healthy processed fresh food, organic food and natural food flavours from
seafood and plants. The Malaysian food market is becoming increasingly sophisticated and
supplied by both local and imported products (Malaysia, 2008). The strong economic growth
in the early 90's contributed towards major changes in consumer purchases and consumption
patterns (Abdul Manaf, 2008).
In Malaysia, 10% of the manufacturing sector is food-processing industry which is dominated
by small and medium scale companies. It has attracted to a total of RM1.972 billion in 69
projects which represents more than 80% of the total number of establishments in the
processed food segment (Malaysia Food Business Directory (MFBD), 2007). Although the
export performance of this sector has doubled over the last ten years (RM18 billion in 2015),
Malaysia continues to be a net importer of food products with an annual import of more than
RM36 billion in 2012 and processed foods of with an annual import of more than RM17.8
billion in 2015. The processing technology have widened the usage of local raw materials,
broadening the range of products increasing the investment capacity in the food industry.
2.1. Sub - Sectors of Food Industry
The sub sectors involved in food and beverage industry include fish and fish products,
livestock and livestock products, fruits and vegetables, and cocoa-based products (Porter ME,
5
2008). The beverage segment covers the manufacture of soft drinks and mineral water
(O’Brian, 2007). In the livestock sub-sector, Malaysia is self- sufficient in poultry, pork and
eggs, but imports about 80% of its beef requirements. Among the dairy products produced
are milk powder, sweetened condensed milk, pasteurized or sterilized liquid milk, ice cream,
yoghurt and other fermented milk (Malaysia, 2008).
2.1.1. Livestock and Dairy
Poultry processing constitutes 60% of the meat processing industry (Sungkar, 2008).
Although Malaysia is a net exporter of poultry meat, it is still a net importer of meat products,
particularly beef and mutton. Among the dairy products produce dare milk powder,
sweetened condensed milk, pasteurised or sterilized liquid milk, ice cream, yoghurt and other
fermented milk (Porter ME, 2008).
2.1.2. Nature of Involvement by the Dairy Industry
Waste load in the dairy industry is largely as a result of milk products which are inadvertently
lost to the sewer system (Malaysia, 2008). Subsequently, processors have had no need to
monitor loads or volumes. The reduction of water and waste in a dairy processing plant
requires the application of the best technology to achieve reduced product loss, reduced water
usage, and reduced ingredient loss. This is only true when the dairy industry could discharge
wastewater with little regard for treatment costs (Turban et al., 2007).

6
2.2.Overview of Dairy Processing Industry
The dairy industry is divided into two main areas:
1. The primary production of milk on farms—keeping of cows (and other animals such
as goats, sheep etc.) for production of milk for human consumption;
2. The milk processing which is achieved by (a) heat treatment in ensuring the milk is
safe for human consumption and extended quality, and (b) preparing a variety of dairy
products in a semi-dehydrated or dehydrated form (e.g. butter, hard cheese and milk
powders).
2.2.1. Introduction
The basic function of the dairy processing industry is the manufacture of foods based on milk
products (Envirowise, 2002). There are 20 basic types of milk products manufactured, such
as fruit juices, produced by the industry. Total milk production has increased by 32 percent.
Many plants engage in multiproduct production. In an effort, of establishing effluent
limitation guidelines and standards of performance by the EPA, the dairy industry was
subdivided into categories according to types of product manufactured (UNEP, 2000).
i) Standard Industrial Classification (SIC) Codes and Title - Group 202
2021 Creamery Butter
2022 Cheese, Natural and process
2023 Condensed and Evaporated Milk
2024 Ice Cream and Frozen Desserts
2026 Fluid Milk
ii) Subcategories for Effluent Guidelines
Receiving stations
Fluid products

7
Cultured products
Butter
Cottage cheese and cultured cream cheese
Natural cheese and processed cheese
Ice Cream, novelties and other frozen desserts
Ice cream mix
Condensed milk
Dry milk
Condensed whey
Dry Whey
i) Industry 2021 - Creamery Butter
Includes establishments primarily engaged in manufacturing of creamery butter. Specific
products are anhydrous milkfat, butter, creamery, and whey.
ii) Industry 2022 - Cheese, Natural and Processed
Comprises of producers that primarily manufacture natural cheese, processed cheese, cheese
foods and cheese spreads. Specific products include cheese (except cottage cheese) and
cheese spreads, pastes, and cheese like preparations.
iii) Industry 2023 - Condensed and Evaporated Milk
Industry includes establishments primarily engaged in manufacturing of condensed and
evaporated milk and related products. Specific products include baby formula; concentrated,
condensed, dried, evaporated, and powdered buttermilk, milk, whey, and etc.

8
iv) Industry 2024 - Ice Cream and Frozen Desserts
This industry depends on the manufacture of ice cream and other frozen desserts. Specific
products are custard, ice cream, ice milk, ices, and mellorine-type products.
v) Industry 2026 - Fluid Milk
Includes the processing and distribution of fluid milk, cream and related products (cottage
cheese). Specific products include: buttermilk, cultured; cheese, cottage; milk and cream
products; and yoghurt.
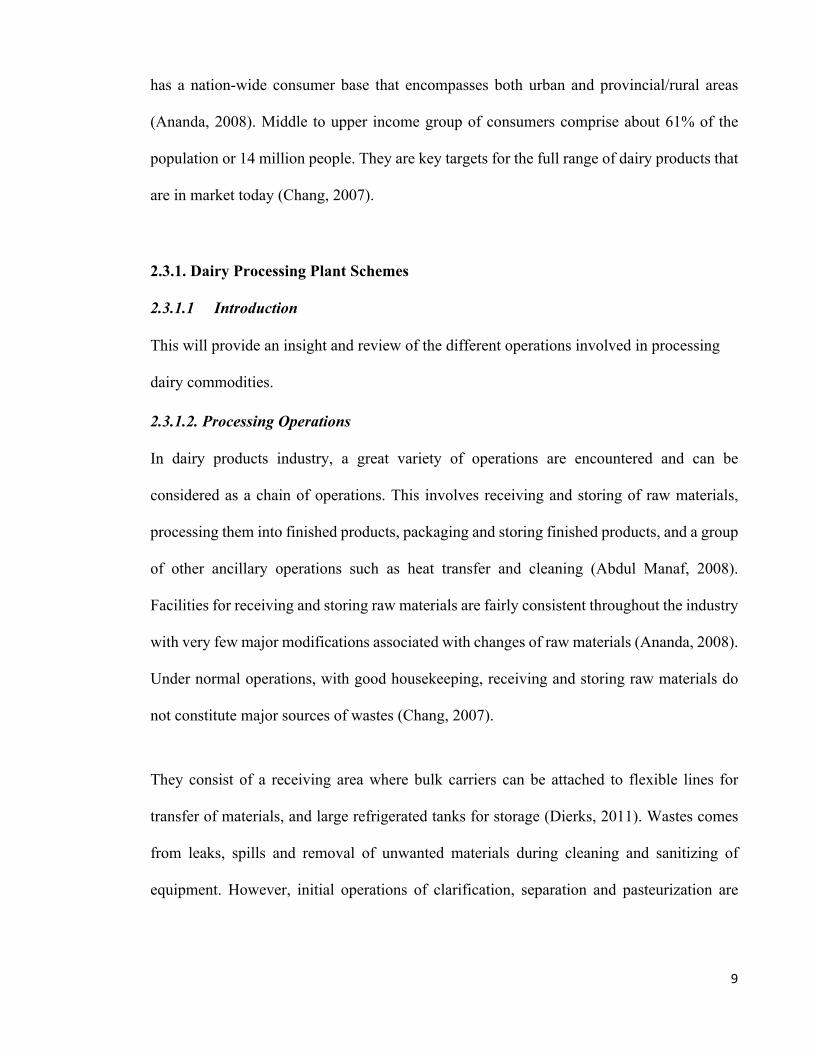
Figure 2.1: Diagram of Dairy Processing Plant (Source: Dagang Asia Net, 2011)
2.3.Trends in the Dairy Industry
Malaysia has one of the most sophisticated consumer markets in South East Asia. Unlike the
other large Southeast Asian nations, e.g. Indonesia, Thailand and the Philippines, Malaysia
9
has a nation-wide consumer base that encompasses both urban and provincial/rural areas
(Ananda, 2008). Middle to upper income group of consumers comprise about 61% of the
population or 14 million people. They are key targets for the full range of dairy products that
are in market today (Chang, 2007).
2.3.1. Dairy Processing Plant Schemes
2.3.1.1 Introduction
This will provide an insight and review of the different operations involved in processing
dairy commodities.
2.3.1.2. Processing Operations
In dairy products industry, a great variety of operations are encountered and can be
considered as a chain of operations. This involves receiving and storing of raw materials,
processing them into finished products, packaging and storing finished products, and a group
of other ancillary operations such as heat transfer and cleaning (Abdul Manaf, 2008).
Facilities for receiving and storing raw materials are fairly consistent throughout the industry
with very few major modifications associated with changes of raw materials (Ananda, 2008).
Under normal operations, with good housekeeping, receiving and storing raw materials do
not constitute major sources of wastes (Chang, 2007).
They consist of a receiving area where bulk carriers can be attached to flexible lines for
transfer of materials, and large refrigerated tanks for storage (Dierks, 2011). Wastes comes
from leaks, spills and removal of unwanted materials during cleaning and sanitizing of
equipment. However, initial operations of clarification, separation and pasteurization are

10
common to most products (Dierks, 2011). Removal of suspended matter, cream, or milk are
determined by using large centrifuges of special design (Chang, 2007).
The operation of clarification and separation are usually carried out in separate units
(Malaysia, 2008). A single unit is required to discharge the sludge that could be sanitized
easily. Some may also use inline filters to remove suspended matter (HDC, 2008).
Following clarification and separation process, the materials which are subjected for further
processing within the plant are pasteurized (O’ Brian, 2007). Pasteurization requires heating
the material for a fairly long period of time in a vat pasteurization. For this purpose, heating
is required at a high temperature within a short time (Dagang Asia Net, 2011). After the initial
operations mentioned above, the processes and equipment become highly dependent on the
product. Types of equipment encountered are tanks and vats for mixing ingredients and
culturing products, enclosed high-pressure spray units, evaporators and various driers for
removal of water, and freezer (Envirowise, 2002).
The finished products are packaged, cased and sent to storage for subsequent shipment (Janis,
2004). The product fill lines employed in dairy processing products industry are typical
liquids and solids packing units, with only minor modifications to the products and
containers. The storage temperature ranges from below zero to above freezing (O’Brian,
2007).

11
2.4. Wastewater Characterization of Dairy Plant
2.4.1. Introduction
The quantity of this processing wastewater that is generated and its general quality (i.e.,
pollutant strength, nature of constituents) has both economic and environmental
consequences with respect to its treatability and disposal (Dierks, 2011).
By considering that the wastewater contains substances and materials from the product (or
loss of the product) therefore, the economics and the value of the wastewater would depend
on the amount of product loss from the cost of treatment and processing operations of this
waste material (MFBD, 2007). In another word, richer the wastewater is in terms of the
product ingredients, the higher cost of treatment it would have. Therefore, the cost of treating
the wastewater would depend on the specific characteristics of the pollutant in the
wastewater. Other factors for the cost of wastewater treatment would be the daily volume of
discharge and relative strength of the wastewater (Dierks, 2011).
If treated wastewater were to be discharged into a stream or river, an eutrophic condition
would develop within the aquatic environment. This is due to the discharge of biodegradable
and oxygen consuming compounds (Porter, 2008). If this situation was sustained for a
sufficient amount of time, the ecological balance of the receiving stream, river or lake (i.e.,
aquatic microflora, plants and animals) would be affected (Evans, 2003). Moreover,
continued depletion-of the oxygen in these water systems would result in development of
unsightly scum and odours (Malaysia, 2008).

12
2.4.2. Dairy Industry Wastewater-Pollution/pollutant
The major pollutant of dairy plant is organic material. The organic material is decomposed
by micro-organisms in the water, when dumped untreated into a stream or river (Evans,
2003). The micro-organisms consume oxygen in the water by breaking down the organic
pollution and this will degrade the water quality by depleting its oxygen content (Janis, 2004).
Oxygen depletion leads to impact towards fish, plants and other aquatic animals which needs
dissolved oxygen to survive. When oxygen in the water body is used up, the decay of organic
matter continues without oxygen and that evidently would lead to noxious gases such as
hydrogen sulphide and methane are produced (Chang, 2007).
Another type of major pollutant produced in dairy plant is suspended solid waste. This
include constituents such as coagulated milk, particles of cheese curd, and in ice cream plants,
pieces of fruits and nuts (O’ Brian, 2007). The measurement of this pollutant is called "total
suspended solids," or TSS. These TTS discharge their colours and cause the water to become
slurry. In addition to that, TTS and their organic characteristics would settle on the bottom
of the stream and impair photosynthesis in aquatic plants. As dairy wastes do, the bottom
deposits become sludge beds that can further deplete the water's oxygen content (Porter,
2008). This gives off gases that are toxic to aquatic life and cause odour problems, as the
sludge decomposes (Malaysian Institute of Economic Research, 2005).
Suspended solids in water from streams used by the dairy industry can interrupt with many
industrial processes. They cause foaming in boilers, damage equipment, and impose high
purification costs on industries that need clean water (Cole, 2008). An example of it would

13
be the pharmaceutical industry which would require high amount of clean water to make their
products (Malaysia, 2008).
Raw wastes from dairy plants contain excessive amounts of organic materials and suspended
solids. These wastes must be treated before they are discharged into a water body and the
major dairy industry water pollutants such as organic material and suspended solids can be
treated effectively (Turban et al., 2007).
Other identified pollutants in dairy plant wastes are phosphorus, nitrogen, chlorides, and heat.
In general, treating dairy wastes to reduce the amount of organic material and suspended
solids will keep other pollutants at satisfactory levels. In some cases, some of the minor
pollutants may need special treatment (Nguyen et al., 2004). Another consideration is the
acid or alkali content of liquid wastes. The pH of many individual wastes within a dairy plant
fall outside the range for direct steam discharge. Therefore, the wastes are neutralized when
they are mixed within a plant or during the treatment process and pH can be easily adjusted
(Cole, 2008).
Wastes from most dairy plants can be successfully treated by municipal treatment plants and
pose no threat to the municipal plants. However, in some situations, a by-product cheese-
manufacturing whey may create problems in some municipal treatment plants. Typically,
whey creates problem when it is a large portion of the flow to a treatment plant which is
greater than 10%. A pre-treatment may be required in this situation by the municipality
(Ananda, 2008).

14
2.4.3. Environmental Impacts of Dairy Processing Plant/ Dairy products
The environmental impacts associated with dairy processing activities are the high
consumption of water, discharge of effluent with high organic loads and consumption of
energy. Noise, odour and solid wastes may also be other contributing factors as well
(Sungkar, 2008). Dairy processing requires large amount of fresh water which is used
primarily for cleaning process equipment and work areas to maintain hygiene standards
(Turban et al., 2007).
The major environmental problem caused by dairy processing is the discharge of large
quantities of liquid effluent (Sungkar, 2008). Dairy processing effluents generally exhibit the
following properties such as:
a) high organic load due to presence of milk components;
b) fluctuations in pH due to presence of acidic cleaning agents and other chemicals;
c) high levels of nitrogen and phosphorus;
d) fluctuations in temperature.
Source: (Abdul Manaf, 2008)
If whey from the cheese-making process is not used as a by-product and discharged along
with other wastewaters, the organic load is increased, resulting in environmental problems.
Milk is a complex fluid that consists of water, milk fat, few numbers of proteins (both in
suspension and solution), milk sugar (lactose) and mineral salts (OECD, 2008).
Dairy products, depending on the nature, type of product and method of manufacturing, may
also contain sugar, salts (e.g. sodium chloride), flavours, emulsifiers and stabilizers in the
milk constituents (UNIDO, 2008).
15
For some municipalities, the effluent from local dairy processing plants represents a
significant load on sewage treatment plants. In extreme cases, the organic load of waste milk
solids entering a sewage system may exceed that of the township’s domestic waste,
overloading the system (OECD, 2008). In rural areas, dairy processing effluent may be
irrigated to land which could affect soil structure and salinity. In some locations, effluent
may be discharged directly into water bodies (HDC, 2008).
Dairy products such as milk, cream and yogurt are typically packed in plastic-lined
paperboard cartons, plastic bottles and cups, plastic bags or reusable glass bottles. Other
products, such as butter and cheese, are wrapped in foil, plastic film or small plastic
containers. Milk powders are packed in multi-layer kraft paper sacs or tinned steel cans, and
some other products, such as condensed milks, are packed in cans. The packaging materials
are usually discarded and improper packaging could be returned for reprocessing (OECD,
2008).
Emissions to air from dairy processing plants are caused by high levels of energy
consumption necessary for production. Steam, used for heat treatment processes
(pasteurisation, sterilisation, drying etc.) is produced in on-site boilers. Electricity used for
cooling and equipment operation is purchased from the grid (UNIDO, 2008).
Air pollutants, including oxides of nitrogen, sulphur and suspended particulate matter, are
formed from the combustion of fossil fuels, which are used to produce both these energy
sources. In addition, discharges of milk powder from the exhausts of spray drying equipment
can be deposited on surrounding surfaces (Envirowise, 2002).
16
The use of steam injection for heat treatment of milk and creation of reduced pressure in
evaporation processes causes high noise levels. A substantial traffic load within the
immediate vicinity of a dairy plant is generally unavoidable due to the regular delivery of
milk (which may be on a 24-hour basis) (Dess, et al., 2005). This include deliveries of
packaging and regular shipment of products. Noise problems should be taken into
consideration in determining the plant location (Evans, 2003).
Hazardous wastes consist of oily sludge from gearboxes of moving machines, laboratory
waste, cooling agents, oily paper filters, batteries, paint cans and etc (OECD, 2008). At
present, in Western Europe, some of these materials are collected by waste companies, while
some are sent for incineration. The remaining would be easily disposed (Dagang Asia Net,
2011).
2.5. Water Consumption in Dairy Processing Industry
Water is principally used for cleaning equipment and work areas to maintain hygienic
conditions. Rates of water consumption vary greatly depending on the scale of the plant, age
and type of processing, either batch or continuous processes. A typical range for water
consumption in reasonably efficient plants is 1.3 to 2.5 litres water/kg of milk intake (Dess,
2005).
In most parts of the world, the cost of water is increasing as the true environmental costs of
its supply are taken into consideration (Malaysia, 2008). Water is an increasing commodity
and its efficient use is becoming more important (O’ Brian, 2007). Strategies in reducing
water consumption may include technological solutions or equipment upgrade. Some of the
key strategies in reducing water consumption are listed below and the use of these techniques
would indicate best practice for the industry. Therefore, water consumption can be reduced

17
to 0.8–1.0 litres water/kg of milk intake (Dierks, 2011). According to Porter (2008), some of
the water consumption reduction strategies are:
a) using continuous processes to reduce frequency of cleaning; An example of it would
be a container which constantly gets filled with mixture of ingredients for ice cream
or any other product. So instead of having a repetitive production for 12 hours and
then washing, it would be continuous production of 24 hours and one round of
washing so it would reduce the water consumption.
b) using automated cleaning-in-place (CIP) systems for control and optimization of
water use; This technique has been around for 50 years and include the use of mixture
of chemical, heat and water to clean machinery, vessels or pipe without dismantling
plant.
c) installing fixtures that control the flow of water for manual cleaning processes;
d) using high pressure rather than high volume for cleaning surfaces; This strategy has
been used in carwashes for a long time. Even though it significantly reduces the water
consumption but it requires equipment such as compressor which could end up in
more energy consumption.
e) installing meters on heavy equipment to monitor consumption;
f) using compressed air instead of water where appropriate; This technique can only be
used for equipment which could be cleaned by air and do not require water for this
purpose. Similar to high pressure rather than high volume water, this technique also
requires electricity and evidently would result in higher energy consumption.
g) reporting and fix leaks promptly; Perhaps this is the oldest approach in reducing the
water consumption and it is a continuous effort for constant checking and fixing but

18
the outcome is less water consumption, less water bill and higher environmental
practice.
2.5.1. Effluent discharge in dairy processing plant
Most water consumed at dairy plants becomes effluent. Dairy plant effluent is treated on site
and then discharged to municipal sewerage systems. Dairy processing effluent contains milk
and milk products which have been lost from the process, as well as detergents. Milk loss
can be as high as 3 to 4%, with the main source being residues which remain on the internal
surfaces of vessels and pipes or accidental spills during tank activities (Porter, 2008).
A typical figure for the COD load in dairy plant effluent is about 8 kg/m3 milk intake (Turban
et al., 2007). Strategies in reducing the organic load of dairy effluents focus on minimising
the amount of product lost to the effluent stream. Based on SME Annual Report, 2007, some
strategies to reduce the organic load in the effluent are listed below:
a) ensuring the vessels and pipes are drained completely and using pipes and plugs to
remove product residues before cleaning; Some of the approach would be to design
the pipes from one tank to another in a way that the gravity helps maximum drainage
of the fluid containing organics.
b) using level controls and automatic shut-off systems to avoid spills from vessels and
tanker emptying;
c) collecting spills of solid materials (cheese curd and powders) for reprocessing, instead
of washing it down; Some of the spilled materials and ingredients under the correct
circumstance can get back to the production line which means less organic as waste.
d) fitting drains with screens and/or traps to prevent solid materials entering the effluent
system; Some filter layers can capture and hold the solid organic from entering the
effluent.
19
e) installing in-line optical sensors and diverters to distinguish between product and
water;
f) installing and maintaining level controls and automatic shut-off systems on tanks;
g) using dry cleaning techniques where possible, by scraping vessels before cleaning or
pre-cleaning using air guns;
h) using starch plugs or pigs to recover product from pipes.
2.6. Overview of Dairy Processing Plant Worldwide
Dairy processing occurs world-wide. The structure however, varies from one country to
another. In less developed countries, milk is generally sold to the public, directly. In major
milk producing countries most milk is sold on a wholesale basis (Dess et al., 2005). In Ireland
and Australia, for example, many of the large-scale processors are owned by the farmers as
co-operatives. In the United States, individual contracts are agreed between farmers and
processors (Laudon, Laudon (2007) Management Information Systems. McGraw-Hill, New
York).
Dairy industries in major dairy producing countries have undergone rationalisation, with a
trend towards less but larger plants operated by fewer people (Janiz, 2004). As a result, in
the United States, Europe, Australia and New Zealand most dairy processing plants are quite
large. Plants producing market milk and products with short life span, such as yoghurts,
creams and soft cheeses, tend to be located on the fringe of urban centres close to consumer
markets (Cole, 2008) while plants manufacturing items with longer life span, such as butter,
milk powders, cheese and whey powders, tend to be located in rural areas closer to the milk
supply. The general tendency world-wide, is towards the large processing plants specialising
in a limited range of products (Nguyen et al., 2004). However, in Eastern Europe for example,

20
due to supply-driven concept of the market, it is very common for ‘city’ processing plants to
be a large multi-product plant producing a wide range of products (Evans, 2003).
This general trend has provided companies with the opportunity to acquire bigger, automated
and more efficient equipment. This development has increased the environmental loadings
in some areas for long-distance distribution (Nguyen et al., 2004).
In the past decade, basic dairy processes have changed a little. Specialised processes such as
ultrafiltration (UF), and modern drying processes, have increased the opportunity for the
recovery of milk solids that were formerly discharged (OECD, 2008). In addition, all
processes have become much more energy efficient and the use of electronic control systems
has allowed improved processing and cost savings (Ananda, 2008).
2.7. Ice Cream Production
Ice cream production involves traditional chemical engineering, product design, and
multiscale analysis. The components of this design are briefly summarized below, followed
by an executive summary of the results generated for this design (Functions of Gums in Food
Systems, 2005).
2.7.1. Science of Ice Cream
Ice cream is a very common and loved dessert and snack around the world. Eating ice cream
is perceived as a pleasure and a luxury treat. However, the pleasure of eating ice cream
requires a creamy and smooth product throughout the entire life cycle (Malaysia, 2008). The
recipe and processing parameters influence the product quality as experienced by the
consumers. During transportation and storage of ice cream, from the factory via shop to the
consumer, there is a high risk of quality loss of product (Porter, 2008). Ice cream is a complex
21
system which contains a gas (air) dispersed as small cells in a partially frozen continuous
phase. In this phase, fat is used as an inner phase in an emulsion, where the milk solids and
stabilizers are in a colloidal solution. The sugar and salts form a true solution (Ramli, 2006).
There are total of three categories of ingredients in the ice cream mix which include dairy,
sweeteners, and additives. Milk, cream, and non-fat milk solids make up the dairy portion
of ice cream while Sucrose or Splenda® is used to sweeten the mix. Stabilizers and
emulsifiers are mixed to give the ice cream the desired feel (Ramli, 2006). Also present in
finished ice cream is air. Standard ice cream contains an equal volume of mix and air, or an
over-run of 100%. Premium ice cream, however, has an over-run of only 80%. This to give
a rich creamy texture (OECD, 2008). Milk is a colloidal suspension of water, fat, and milk
solids in which fat particles in suspension range in size from 0.8 to 20 µm. Another present
substance in milk is the sugar lactose at a concentration of about 4.9%. In lactose free ice
creams, the milk is treated with enzyme lactase, which breaks the lactose down into simpler
sugars glucose and galactose (Sungkar, 2008).
Regular table sugar, or sucrose, is used as a sweetener in ice cream mixes except low carb
ice cream. Splenda®, or sucralose, is used to sweeten the low carb ice cream because it is
indigestible but sweetens the mix (Malaysia, 2008). Stabilizers and emulsifiers are essential
in the production of ice cream as these two components help to give the ice cream smooth
body to improve the overall texture of the ice cream. Stabilizers work by reducing the amount
of free water in the ice cream mixture. This affects the growth of ice crystal during storage
which also provides resistance to melting which goes through two mechanisms, depending
on the type of gum (OECD, 2008).

22
Charged gums, including carrageenan, help to reduce the amount of free water by introducing
partial charges into the mixture. These charges interact with the partial charges of water and
help to restrict the movement of water molecules within the mixture (Porter, 2008). Branched
gums, including guar gum, provide the same ability to reduce free water within the system,
by introducing many branched side chains into the mixture (Sungkar, 2008). Both types of
gums limit the amount of hydrogen bonding, thereby giving the ice cream the desired
properties.
Likewise, emulsifiers help to reduce fat globule coalescence by decreasing the interfacial
tension between fat and matrix within the ice cream mixture (MFBD, 2007). Common types
of stabilizers used for ice cream production include guar gum, carrageenan and gelatine
(Turban et al., 2007). Mono and diglycerides are the most common emulsifying agents.
Addition of stabilizers and emulsifiers are essential for ice cream base mixes lower in fat
content. This is the result of milk and milk proteins containing natural stabilizing and
emulsifying materials. Therefore, premium ice cream will need minimal amounts, if any, of
additional stabilizers or emulsifiers (Malaysian Institute of Economic Research, 2005).
As water begins to freeze in the mix, the concentration of dissolved solids in the liquid phase
increases due to freezing point depression. Good mixing is essential for finished ice cream
in terms of taste and texture (Ananda, 2008). Large fat globules increase the viscosity of mix
beyond what is desirable. Typical ice cream viscosities range from 50-300 cP. The
viscosities of low carb ice cream were found to be greater than that of regular or premium
ice cream. It was thought that these high viscosities were the result of increased fat content
as well as increased additive content (Abdul Manaf, 2008).

23
2.7.2. Producing ice cream with a high overrun
Production of ice cream with high overrun is an interesting tool for cost saving. However,
the perceived quality by the consumer must be kept in mind (Cole, 2008). The sensory
attributes such as creaminess and smoothness as well as resistance towards shrinkage and
melting cannot be compromised as these properties are very closely linked to consumer
preferences (Dess et al., 2005). Creaminess as well as melting resistance is related to the
distribution of air cells in the product. A more uniform air cell distribution in the ice cream
results in a creamier and slower melting ice cream. Emulsifiers like mono and diglycerides
are well known for their positive influence (Sungkar, 2008).
2.7.3. The effects of emulsifiers
Production of ice cream with high overrun means, other things are being equal, the cell walls
around the air cells are thinner and weaker. Therefore, it is at high risk of overrun in
production of ice cream (MFBD, 2007). However, by choosing the right emulsifiers and
stabilizers it is possible to manufacture an ice cream with high overrun which is still
perceived as a high-quality ice cream. Emulsifiers are surface active ingredients due to their
hydrophilic-lipophilic properties and they play an important role (Dagang Asia Net, 2011).
Consequently, they place themselves in the interfacial layer between the fat/protein and
water. The main functionality of emulsifiers in ice is to destabilize the fat globule membrane
covering globules formed during homogenization of the ice cream mix (MFBD, 2007).
During ageing, proteins covering the fat globule are replaced by emulsifiers. Therefore,
agglomeration of the fat globules is facilitated. This is important for the formation of structure
and air cell distribution during whipping and freezing process. Further, emulsifiers are
important for the stability of the formed air cells such as strength of the air cell walls (Dierks,
2011).
24
In short term, based on Source: HDC, 2008, the functionality of emulsifier in ice cream are
a) improved fat emulsification in the mix;
b) controlled fat agglomeration and coalescence;
c) facilitated air incorporation;
d) improved dryness on extrusion;
e) improved melting resistance;
f) improved heat-shock stability;
g) improved smoothness and creaminess.
2.7.4. Types of emulsifiers
Mono- and diglycerides of fatty acids (E471) are the most commonly used emulsifier in ice-
cream. Mono- and diglycerides of fatty acids are produced by interesterification of glycerol
and fat. The selection of fat determines the functional properties of emulsifier. The mono-
and diglycerides can further be esterified with organic acids. For example, lactic acid is used
for formation of E472b lactic acid esters of mono- and diglycerides of fatty acids, so called
lactic acid esters (Dierks, 2011).
Compared to mono-and diglycerides, lactic acid esters are more hydrophilic. Lactic acid
esters are not commonly used in ice cream production. However, it has been found that lactic
acid ester has a great influence on foam stability and texture. Specifically, when it is used in
combination with mono and diglycerides. This fact can be utilised in production of ice cream
with high overrun (Dagang Asia Net, 2011).

25
Figure 2.2: E471
Figure 2.3: E472b
2.7.5. The effect of stabilizers in an ice cream with high overrun
The emulsifiers for high overrun in ice cream were used together with stabilizers. The
stabilizers were hydrated and dispersed in water reducing the amount of free water in the ice
cream mix. The stabilizers bind the water by means of hydrogen bonds and trap the water in
a three-dimensional network reducing mobility of water resulting in an increased viscosity
(Cole, 2008).
Base on (MFBD, 2007) study, the main functions of the stabilizers are to:
a) increase the mix viscosity
b) prevent whey separation (syneresis)
c) improve the whipping properties
d) improve the texture

26
e) prevent ice crystal growth (during storage)
f) improve the melting resistance
g) regulate sensory properties
The options when choosing stabilizers were far greater than in the case of emulsifiers. Most
countries allow the use of a wide range of stabilizers (OECD, 2008). The most commonly
used stabilizers in ice cream according to Ananda, 2008 are guar gum (E412), locust bean,
gum (E410), cellulose gum (E466), alginate (E401) and carrageenan (E407).
2.7.6. Manufacturing ice cream with 150 to 185% overrun
Palsgaard recently carried out a project with the aim of creating a solution for production of
ice cream with overrun as high as 150 to 185% (Ananda, 2008). The quality in terms of
sensory attributes, melt-down properties and storage stability should be comparable to
standard ice cream. Ice creams with fat level from 6 to 10% were included in the trials
(Dierkss, 2011). Vegetable fat was used as fat source and whey powder and/or skim milk
powder was used as milk solid which is non- fat. The use of whey powder showed that the
protein level was low in some of the trials (Abdul Manaf, 2008).
The ice cream was produced in Palsgaard’s pilot plant by means of HTST unit combined
with a continuous freezer (Chang, 2007). After hardening, the ice creams were transferred to
a storage freezer at -18°C. For evaluation of the storage stability, heat-shock tests were
carried out by increasing the temperature to -10°C for 4 days after which the ice creams were
then transferred back into the storage freezer (Abdul Manaf, 2008).
2.7.7. The importance of air in ice-cream
Air is an important component in ice cream affecting the physical and sensory properties as
well as the storage stability (Chang, 2007). Ice cream has around 100% overrun meaning that
27
the air makes up 50% of the ice cream volume. The amount of air incorporated in the mix,
influences the sensory attributes of the ice cream. If a lower amount of air is applied, the
resulting ice cream is dense, heavy and colder. If a higher amount is used, the texture is
lighter, creamier and warmer for eating (Dagang Asia Net, 2011).
2.8. Cleaner Production
Cleaner Production is defined as the continuous application of an integrated preventive
environmental strategy applied to products, processes, and services to increase overall
efficiency and reduce risks towards humans and environment. According to Malaysia, 2008,
Cleaner production can be used in production processes, product development and design
and service industries.
a) Production processes: Cleaner Production involves conservation of raw materials and
energy, elimination of toxic raw materials, and reduction in quantities and toxicity of
wastes and emissions.
b) Product development and design: Cleaner Production involves reduction of negative
impacts throughout life cycle of the product: from raw material extraction to ultimate
disposal.
c) Service industries: Cleaner Production involves incorporation of environmental
considerations into design and delivery of services.
2.8.1. Cleaner Production in Dairy Processing Industry
In dairy processing industry, Cleaner production is a tool which offers new opportunities for
optimization in business by complying with the environmental regulations and this is in
support of sustainable development (FAO, 2005). Cleaner production techniques and
28
technologies use raw materials, energy and other material inputs compared to conventional
end-of-pipe approaches.
The approach produce less waste, facilitate recycling and reusing resources and handle
residual wastes in a more acceptable manner. These methods have significant advantages in
terms of financial and economic as well as environmental benefits at both local and global
level (Ananda, 2008).
As mentioned earlier, even though dairy processing occurs world-wide but the structure of
the industry varies from one country to another. Organic materials, suspended solid waste
such as coagulated milk, particles of cheese curd, in ice-cream plants pieces of fruits and nuts
and other substances and materials such as phosphorus, nitrogen, chlorides, heat and acid or
alkali content of liquid wastes happens to be the major pollutants in the dairy processing
wastewater (Dierks, 2011). These pollutants come from the wasted materials, which are
basically milk and milk products, lubricants (soap and silicone based) used in certain
handling equipment, sanitary and domestic sewage, non-diary and milk by products such as
whey and sometimes buttermilk (HDC, 2008). Typical water uses and sources of effluent in
a dairy are given in Figure 2.4.

29
Figure 2.4. Typical water uses and effluent sources in a dairy (UNIDO, 2008)
2.8.2. Cleaner Production Opportunities
There are several opportunities for the market when it comes to then milk-related production
and products.
Clean water recycles: Excess water service used for the clarifier and separator for keeping
the equipment clean. The steam condensate has good water quality and are being discharged
to channel. These sources may be recycled for sludge liquidification in clarifier and separator
operations or used in cleaning operations (OECD, 2008).
30
GHK/repair: Repairing of valves of clarifier, HTST pasteurizer fittings, cooling water line in
deodorization and changing of the damaged hose in homogenization will eliminate discharge
of 2,037.3 kg/day of service water (Porter, 2008).
Off-site reuse/milk sludge: In terms of organic load, the issue with clarification and
separation, is the milk sludge discharged to sewer. It is a valuable source as animal feed due
to its nutritional value. AOC is a large facility that also feeds cattle so the sludge can be used
in their feeding or it may be used in fodder industry, some of which are found in the vicinity
of Ankara. To this purpose, collected sludge may be kept in refrigerated storage for weekly
transfer of it to fodder industry (Porter, 2008).
Off-site reuse/milky water: The water from the first rinsing can be collected in a tank and
used for watering cattle similar to the case with milk sludge. Due to the content of milk,
animal fed with this source will have higher milk production efficiency (OECD, 2008). In
this approach, to prevent milk spill on floor, raw milk storage tanks can be connected to a
single pipe, which will be connected to pasteurization and flow from three tanks which is
manually controllable. By this system, milk spill to ground and first rinse wastewater of this
tanks could be collected at the end of new pipe.
GHK/ small equipment change/water & milk: During operation of separator, excess of water
used for liquidification of sludge overflows from the tank and disposed to channel. If a level
control is affixed to the tank in which service water is stored for separator sludge, this
discharge which in this case study is about 2,100 kg/day, could be eliminated. During filling,
the vessels to be sold as unpacked milk 45.2 kg/day of milk spills due to valve remained open

31
and overfilling. If the global valve used to control the milk pipe is replaced with a check
valve and if this is closed at every vessel change, this spill will be prevented (Sungkar, 2008).
GHK/operating Practices/milk: Milk due to defective packaging (carton or bottle) and
remaining in the pipe is already collected in vessels and send to the starting of each process.
If defective packaging is minimized, amount of milk returned will be reduced that will
prevent use of chemicals, energy and water once again for the same amount of milk (OECD,
2008).
2.8.3. Material Flow Cost Accounting (MFCA)
Material flow cost accounting or in short MFCA, is a management tool that assists
organizations in better understand the potential environmental and financial consequences of
their material and energy practices and seeks to improve them via changes in those practices
(Fink, 2013). It does so by assessing the physical material flows in a company or a supply
chain and assign adequate associated costs to these flows. The method was developed
in Germany in the 1980s and is related to approaches such as eco balances, flow cost
accounting and “Reststoffkostenrechnung” (Wagner et al., 2010).
The method became a huge success in Japan in the 2000s. By the year 2010 up to 300
companies had applied the MFCA approach, which was highly supported by the Japanese
government. In 2011, the International Organization for Standardization (ISO) published a
norm on MFCA (i.e. EN ISO 14051:2011). The aim of MFCA is to enhance both economic
and environmental performance through improved material and energy use (M.v, Hauff et
al., 2012). Since 2011 a general framework for MFCA has been provided by the ISO
14051 norm. In order to improve material and energy efficiency MFCA aims to increase

32
transparency regarding material and energy flows and the respective costs in supporting
organizational decisions in areas such as process engineering, production planning, quality
control, product design and supply chain management. Next is to improve coordination and
communication on material and energy use within organizations (Fink. 2013).
Many manufacturing companies are not always clear about their real production costs. Often,
costs for material losses are only associated with the direct disposal costs. However, further
costs need to be assigned to rejected or disposed materials to obtain the total financial impact
of material losses. There are the material direct costs on the one hand and further costs in
upstream processes caused by transportation, energy, auxiliaries, etc. on the other hand which
all need to be taken into account. Against this background material flow cost accounting aims
at calculating hidden costs as they can highly influence the economic relevance of material
losses. After all, this concept is used to improve the efficient use of material and energy.
Figure 2.5: Material input and total costs for a product

33
2.8.3.1. ISO 14051: Standard approach for Material Flow Cost Accounting
The International Organization for Standardization (ISO) published the ISO 14051:2011 to
offer a general framework for Material Flow Cost Accounting (MFCA).
The standard assists companies with the implementation steps of MFCA including the
development of a material and energy flow model for the quantification of material, energy,
system and waste management costs, the communication of the MFCA results and the
identification of improvement opportunities.
While companies are still collecting experience with ISO 14051, the planned ISO 14052
standard 'Guidance for practical implementation in a supply chain' will be describing how to
do a Material Flow Cost Accounting (MFCA) along the supply chain.
2.8.3.2. Practical Examples of MFCA Application
Internationally the material flow cost accounting has primarily been disseminated in Japan
where more than 300 manufacturing companies already applied the concept, though the
method was originally developed in Germany. Small and medium sized enterprises have
started using the material flow cost accounting to assess their product systems and to render
them more efficient.
Here are some examples of application of MFCA:
A small furniture manufacturing company in the Czech Republic has been producing
furniture mainly made of chipboards. The production model for the MFCA comprises five
main process steps. All processes have material losses that sum up to 9.22% of input raw
material and nearly 11% of the total production costs. The accumulated material losses cost
the company 25793 CZK (1,377 USD) per month.

34
A large metal processing company in Germany produces flexible metal components and had
sales of more than 500 million Euros in 2013. An MFCA revealed that in total they have 36%
material losses compared to the input material. The entire production consists of eight process
steps. The second process step has material losses of more than 75 kg whereas the sixth
process step has the second highest amount of material loss with about 35 kg. Surprisingly,
the total cost for the loss of the sixth process step is twice as much as the total cost for the
material loss of the second process. This clearly shows the importance to consider the
embedded cost due to additional system and waste management costs.
The Mitsubishi Tanabe Pharma Corporation manufactures medical products in Japan. The
MFCA identified total material losses worth 1,372 billion JPY (12.7 billion USD) annually,
nearly 50% of the total production costs.
2.8.3.3. Difference between material flow cost accounting and conventional costs accounting
MFCA represents a different way of management accounting. In conventional cost
accounting, the data are used to determine whether the incurred costs are recovered from
sales. It does not require determining whether material is transformed into products, or
disposed of as waste. In conventional cost accounting, even if waste is recognized in terms
of quantity, the costs to produce “material losses” are included as part of the total output cost.
On the other hand, MFCA, as explained before, focuses on identifying and differentiating
between the costs associated with “products” and “material losses.” In this way material loss
is evaluated as an economic loss, which encourages the management to search for ways to
reduce material losses and improve business efficiency.
The differences between MFCA and conventional cost accounting do not mean that MFCA
cannot be applied to any organization that uses materials and energy. In other words, MFCA

35
does not demand any specific requirement in regards to the type of product, service, size,
structure, or location. In addition, MFCA can be expanded to multiple organizations
belonging to the supply chain. This will enable the organizations to identify even more
opportunities for material reduction as well as higher energy efficiency. Wider MFCA scope
than that for a single entity is especially helpful because waste generation in an organization
is occasionally derived from materials provided by a supplier or demanded by
customers/consumers.
Material flow is constituted by three main elements:
1. Material
2. Flow
3. Cost accounting
1. Material
Material refers to any raw material, auxiliary material, component, catalyzer, or part that is
used to manufacture a product. Any material that does not become part of the final product
is considered material loss. In any process, waste and resource loss occur in different steps
of the process, including:
a) Material loss during processing, defective products, impurities
b) Materials remaining in manufacturing equipment following set-ups
c) Auxiliary materials such as solvents, detergents to wash equipment, water
d) Raw material that becomes unusable
36
2. Flow
MFCA traces all input materials that flow through production processes and measures
products and material loss (waste) in physical units using the following equation:
Input = Products + Material loss (waste)
The starting point of MFCA is to measure the amount of material losses based on mass
balance. Decision-making in organizations typically involves financial considerations.
MFCA supports this point by assigning a monetary value to material losses. In detail, MFCA
allows organizations to see material losses as “products” rather than “waste” even though
they are not marketable. This indicates that costs for both products and material losses are
calculated in an equivalent manner. Therefore, all costs caused by and/or associated with the
material flows entering and leaving a quantity center must be quantified and assigned or
allocated to those material flows (Clauses 3.14, 3.16, 5.2, ISO 14051:2011).
3. Cost Accounting
Under MFCA, the flows and stocks of materials within an organization are traced and
quantified in physical units (e.g., mass, volume) and assigned an associated cost. Under
MFCA, four types of costs are quantified: material costs, system costs, energy costs, and
waste management costs. Each cost is defined as follows:
a) Material cost: cost for a substance that goes through a quantity center (measurement
unit of input and output for MFCA analysis). Typically, the purchase cost is used as
the material cost.
37
b) Energy cost: cost for energy sources such as electricity, fuels, steam, heat,
compressed air.
c) System cost: cost incurred in the course of in-house handling of the material flows,
excluding material cost, energy cost, and waste management cost.
d) Waste management cost: cost for handling material losses
Following identification of a physical unit for material flow data, material costs, energy costs,
and system costs are subsequently assigned or allocated to quantity center outputs (i.e.,
products and material losses) based on the proportion of the material input that flows into
product and material loss. The resulting cost of the material loss can become an incentive for
organizations and managers to reduce operation costs by reducing material losses. Therefore,
it can be said that MFCA can help organizations simultaneously achieve financial benefits
and control of material losses (i.e., more effective resource use) (Clause 5.3, ISO
14051:2011).

38
CHAPTER THREE: MATERIALS AND METHODS
3. Introduction
In order to fulfil the objectives of this research, scope of the study was set to factory border
and production as shown in figure below.
Figure 3.1: Research Boundary is inside the factory and production line
As explained in previous chapter, when it comes to the cleaner production, the process flow
of the operation was the most important element that needed to be totally understood. So,
after setting the boundary, based on process flow, massive data collection on raw materials,
products, wastes energy and stocks needed to be done in which both MFCA and LCA were
used.
As MFCA was relatively new method (just became ISO 14051 standard on September 2011),
there were not many academic literature on the topic. Therefore, the same approach that the
previous cases which had improved their environmental and operational efficiency by MFCA
would be assigned as examples. In addition to that, ISO14051 Guideline on Environmental
Management- Material Flow Cost Accounting- General Framework was the main reference
for fulfilment of second and third objectives. Data needed to be collected according to the
input and output material and required energy for each process. In addition to that, data on
production, labour cost, machine, utilities were essential. ISO9001 had already been certified
to the factory and as a result, it was expected to have data on its production. If there was a

39
data gap, or no data available, the process of data collection could be collected by interviews.
After data collection, data analysis was done based on the objectives and possible scenarios
were proposed and results of them were considered. Functional Unit for LCA study was also
set to 1 tonne of Chocolate Crunchy Cone (CCC) ice cream.
3.1. Research methodology qualitative approach
There were four objectives identified for this research and to fulfil them all, different
approaches recommended by MFCA took place. The first objective was to ascertain the
process flow and establish material flow balance. As mentioned earlier, this is the most
important step in MFCA. Identifying the process flow based on the boundary of the study is
the first stepping stone for completing a research based on MFCA method. In order to obtain
and understand the process flow, intensive interviews were conducted with the factory
management and those in charge of factory production line. The main reason this interview
had to be done was to identify the areas that MFCA needed to be applied, to identify the
scope of the study and to draw the boundary of the factory and after that find out the people
and machines to collect data from. The selected area should not be too big so massive data
collection would be required and not too small so the collection of data would be mere and
no significant results could be concluded by the study. The main questions were asked during
the first step were as below (Jaroslava Hyršlová et al., 2011).
a) How many types of ice cream did they produce?
b) Which ones did they produce the most?
c) What were their ingredients?
d) How did they keep the ingredients?
e) Who were the people in charge and how did they handle the ingredients?
f) How did they handle the wastes from their raw materials, packaging and wastewater?
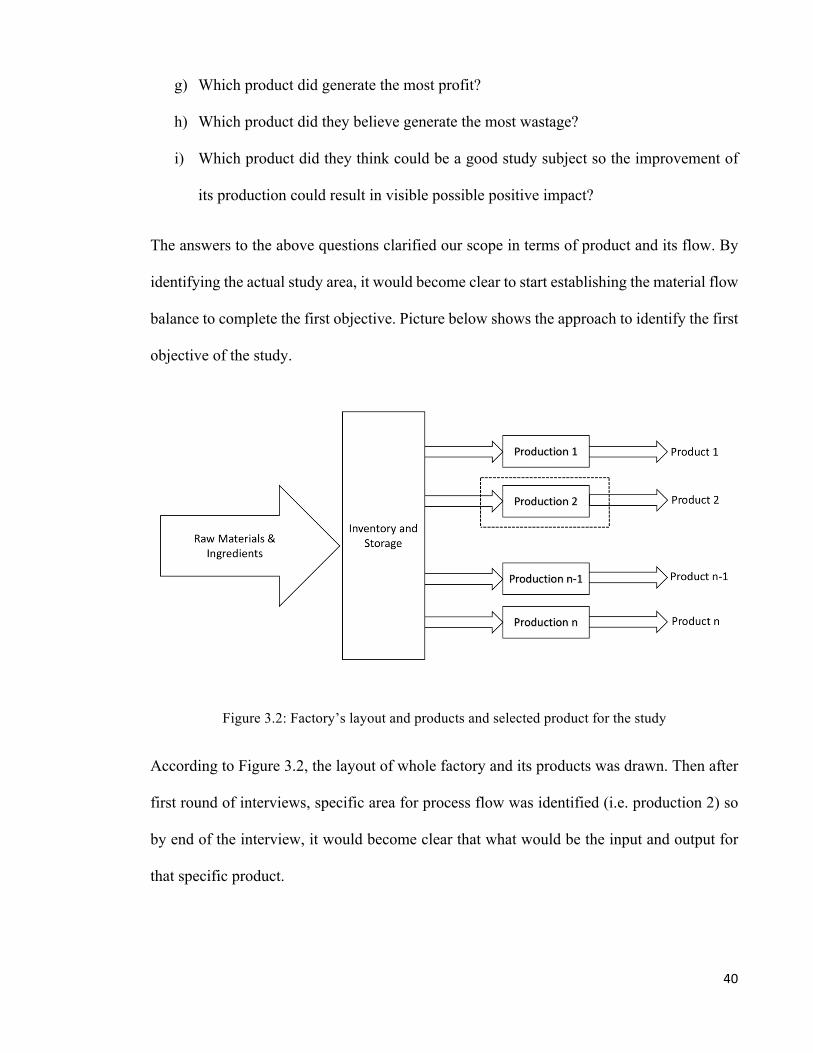
40
g) Which product did generate the most profit?
h) Which product did they believe generate the most wastage?
i) Which product did they think could be a good study subject so the improvement of
its production could result in visible possible positive impact?
The answers to the above questions clarified our scope in terms of product and its flow. By
identifying the actual study area, it would become clear to start establishing the material flow
balance to complete the first objective. Picture below shows the approach to identify the first
objective of the study.
Figure 3.2: Factory’s layout and products and selected product for the study
According to Figure 3.2, the layout of whole factory and its products was drawn. Then after
first round of interviews, specific area for process flow was identified (i.e. production 2) so
by end of the interview, it would become clear that what would be the input and output for
that specific product.

41
3.2. Research methodology quantitative approach
The second objective of the study was to identify the types and sources of wastes. To do so,
it was required to understand the whole process flow in more details. In another word, every
single material from the first step of the process had to be measured and registered and
followed to the next steps. Some of the processes were from one container to another
container and therefore measuring the input and output of the material would not be possible.
However, it was suggested that we could study the wastewater from washing the containers
to identify the possible residue in those containers as discussed in the literature review,
however it was decided to leave that part out of this study as the factory did not have a proper
wastewater collection and treatment. So to fulfil the second objective, an excel file was
prepared to register the input of raw material, waste type and their amount. This data was
later used for the calculation of the waste in monetary units. Figure below shows how this
data collection was conducted (Schmidt et al., 2013).
Figure 3.3: Scope of the study and processes which can be measured
As it be seen in figure 3.3, the data before and after process 1 was collected however,
processes 2,3,4 and 5 were from one container/tank to another and therefore did not have any
way to measure input and output. The related data for processes 6 and 7 were collected
accordingly. This step was crucial for the third objective of this study which was converting
42
all the collecting data from the processes into the monetary unit. The approach for this stage
was a simple calculation. However, as MFCA has indicated, the waste in further processes
even if their materials were identical to the first stages, but the cost would be higher as more
resources and energy were used to produce them (Kasemset et al., 2016). As mentioned in
previous chapter, in MFCA wastes were addresses as negative products which would mean
the same amount of energy and resources were used to produce them.
3.3. Research methodology data analysis, discussion and repeat
The last item of the study would be the proposal on improvement measure on the specific
product based on MFCA approach. By considering that by the end of third objectives, all the
data were collected and carefully analysed therefore all the positive and negative aspects of
the production were identified. So to address this issue, there were couple of interview
sessions with the management and people in charge of the production lines (only related to
the specific product of the study) and the results were shared and discussed. The points were
most expensive wastes were created were identified and countermeasures were
recommended. Some of the recommendations were applied and after that the second round
of data collection was done to find out if the recommendation were effective. The comparison
would be based on the previous data from the same process and unit so it would be known if
the generated waste or negative product was less (Chang et al., 2015).
In summary, the methodology started as qualitative data collection in forms of interviews
with those in charge and then quantitative data collection from different processes was
conducted and analysed. Some data in this stage could not be collected due to the lack of
access (closed flow) but it was suggested to calculate the waste based on the residue in the
wastewater from the washing processes (as discusses in previous chapter) which collection

43
of the data was not possible. And finally, another qualitative data was done which resulted in
recommendation according to MFCA guidelines.
The physical and monetary quantification of the material flow can be summarized in a format
that is suitable for further interpretation, for example, in a material flow cost matrix. The data
should first be summarized for each quantity centre separately and then other inputs such as
energy and system and waste management to be calculated as well. An example of it would
be table 3.1 of the summary of the MFCA data for one quantity centre. The table is just an
example as there was no data in energy, system and waste management for this research.
After the MFCA analysis is completed, the results should be communicated to all relevant
stakeholders. In addition, management can use MFCA information to support many different
types of decisions aimed at improving both environmental and financial performance.
Communicating the results to the organization’s employees can be useful in explaining any
process or organizational changes and gain full commitment from all members of the
organization (Clauses 6.9, 6.10, ISO 14051:2011).

44
Table 3.1: Example of a material flow cost matrix for a quantity centre.
Cost Material Energy System Waste
Management
Total
Product Example
amount
(85%)
Example
amount
(75%)
Example
amount
(60%)
N/A Total
product
(example)
(78%)
Material
loss
Example
amount
(15%)
Example
amount
(25%)
Example
Amount
(40%)
Example
amount
(100%)
Total
material
Loss
(example)
(22%)
Total
Amount
(100%)
Amount
(100%)
Amount
(100%)
Amount
(100%)
Total
(100%)
In general, the review and interpretation of summarized data would allow the organization to
identify quantity centres with material losses that have a significant environmental or
financial impact. These quantity centres could be analysed in detailed form. Data from
individual quantity centres can also be aggregated for the entire target process being
analysed.
45
Any form of Cleaner Production practice would require collection of data, analysis, identify
issues, propose and apply solutions and then observe the changes by collecting data and
analysing them. In another word, it would be continuous effort. MFCA would not be
exception from this common practice so repetitive data collection and analysis would also be
required.

46
CHAPTER FOUR: RESULTS AND DISCUSSION
The first objective of this research was to ascertain the process flow and establish material
flow balance. To do so, the best approach to get the results was qualitative data collection
based on the interviews. As it was already discussed in the introduction, the factory produces
more than 300 types of ice cream and each one has its own process flow. So after intensive
interviews with the factory management and those in production line, it was decided to study
production of Chocolate Crunchy Cone (CCC) as it was the most produced and sold product
of all. After selecting the product, the whole process from the beginning (receiving & storage
of raw materials) till the end (delivery) was observed and notes were taken. While observing
the whole process, interviews were conducted with those in charge of different processes
such as forklift driver in storage process and operators in preparation and weighing of the
ingredients.
4.1. Process Flow
Based on the previous observation of MFCA cases, it was a common practice to write down
each process and their input and output on sticky notes, put them all together in a wagon
shape format and then discuss them one by one in the details with those involved in each
process to be certain that the whole process flow and their inputs and outputs are totally
understood correctly and nothing is omitted. Figure 4.1 shows how a sticky note in MFCA
approach considers all the input (materials, energy, labour) and outputs (product and waste).
Figure 4.1: An example of a sticky note with all their inputs and outputs

47
After putting all the sticky notes together, the process flow of the product in a whole picture
was drawn and discussed in more details. Diagram below depicts the process flow of CCC
ice cream and explanation of each process which was obtained by questioning the operators
of each process.
Figure 4.2: Process flow for Crunchy Chocolate Cone ice cream
Receiving and storage: Two types of forklifts (diesel and electric) were active in the area.
Preparation and weighting: Raw materials required for the product were taken out, weighed
and would be sent to the mixing tank. Each time (each batch) raw material was collected as
one tonne. But from the mixing tank it would for different products. What was learned at this
stage was that how much raw materials had gone in and how many different products had
come out.
Mixing and pasteurization: Both processes were done in a same tank. All raw materials
would be mixed with warm water from 40 degree increasing up to 80 degree. Water was
filtered (filter would be changed annually) and heating process was done by a boiler and
steam. Boiler used diesel and the rest of the steam was wasted. However, new boiler was

48
being replaced which could recycle the steam back into the boiler. This process would take
45 minutes which 10 minutes of it was allocated for pasteurization (holding).
Filtration: This process was done to ensure there would be no external contaminants or
unsolved raw material. Filter would get cleaned after every batch (1 tonne).
Homogenization: Would break down the fat and other molecules. This process was not
holding but on-going.
Cooling: was done through the heat exchange. Cold water in the pipes would exchange its
heat with the mixture. Temperature would drop down to 10 or even lower and the water
would go back to the cooling tower.
Homogenization and cooling processes would take 1.5 hours for each batch.
Aging: There were nine aging tanks in the factory which each product would go to a separate
tank. This process was done for at least 4 hours. Temperature would drop down to 4-9 degree
and it was done for the texture of the ice cream.
Freezing: Air would get injected during the freezing process so as a result it would make the
ice cream ready for filling. There was no filtering process for air.
Filling: This process was done by machine and labour. Filling process was also in charge of
the lidding and sealing. At this stage, some samples would be taken out to be weighed.
Hardening: Ice creams would get frozen and kept in a room with -25 degree for at least 4
hours.
Packaging: In this process, coding for expiry date and bath numbers and the whole packaging
were done by manual labour.
Storage: Ready products would be kept cool in the storage room with temperature of -18
degree.
Delivery: Trucks would deliver the products to the customers.
49
So, in more details and based on the process flow described above, first the raw materials
were received from suppliers and stored. At the beginning of each production, raw materials
(ingredients) were picked and weighed. After that warm water would be added to them and
was mixed with the ingredients (using steam from a diesel boiler to heat the water). Usually
the ratio of water and ingredients were about 70-30 in which is 700 kg would be water.
Mixing and pasteurization was done in the same tank for about 45 minutes in which 10
minutes would be holding for pasteurization. Next step was filtration to be sure no external
contaminants and unsolved ingredients could pass through and the filter itself was cleaned at
the end of each batch which as mentioned would be 1 tonnes of mixture. After mixtures was
filtered, it would be the time for homogenization which would be an on-going process and
was used to break down the fat and other molecules and make the ice cream in one shape.
Next step was cooling process which would cool down the mixture to 10 Celsius degree or
lower. Homogenization and cooling together would take 1.5 hours. When ice cream mixture
was cooled down enough, it would go for aging process which basically would take up to 4
hours with temperature of 4 to 9 Celsius degree. Next step was called freezing which air
would be getting injected into the ice cream mixture while temperature slowly would come
down. Injecting air would give fluffy texture to the ice cream and would make it to what we
would know as an ice cream. After freezing process, ice cream would be ready for filling
process which was simply injecting the ice cream mixture into cones and then would add
chocolate chunks and nuts and then would put a lid on top of it. After filling, all ice cream
would be sent for hardening process in a room with temperature of -25 Celsius degree for 4
hours. After that it would go for packing, storage and delivery. From the mixing process till
freezing, all processes would be done from one tank to another and in a closed loop.
50
Therefore, apart from very tiny leakage, there would no waste of material. However, part of
these materials stay inside the machines as stock and residue which would be known after
material balance study was done or as mentioned in the chapter 2 could be calculated by
analysing the wastewater from the washing process.
Filling and adding chocolate and nuts process would use machine and labour. In this process,
preliminary data collection showed up to 4% loss due to the machine jam at the beginning of
the operation or in the middle.
Data collection which was started after understanding the process flow had its own challenges
as each batch of ice cream (1 tonne) is used not only for CCC ice cream but for other products
(including cups and buckets). Therefore, material balance of CCC ice cream required
material balance of other products which share the same batch. Another issue was with the
weight of the product as during the freezing process, air is injected which would add more
weight to the mixture. Amount of injected air is unknown and that have caused some issues
in the numbers.
4.2. Identifying the Quantity Centres
In order to fulfil the second and third objectives of this research, quantitative data collection
was required. Based on MFCA guidelines, three different Quantity Centres (QC) were
identified. Each quantity centre would have an input and output so the material balance could
be done as a comparison of the input and output (waste, product and stock). As figure 4.3
depicts, the quantity centres were identified as Preparation and Mixing with warm water,
Filling and nuts and the last one as packing.

51
Figure 4.3: Quantity Centres 1, 2 and 3
a) QC1 (Preparation and Mixing): input would be all ingredients and water and output
would be ice cream ready mixture and any difference in input and output would be
the amount of stocks and residue in the tanks;
b) QC2 (Filling & Nuts): which would have ice cream, cone, nuts, chocolate and lid as
input and their weight were calculated;
c) QC3 (Packaging): which calculation of weight of cardboard, tape and products was
done.
4.3. Quantity Centre 1 (Preparation and mixing)
As explained in section 4.1, QC1 would be on preparation (weighing) and mixing with warm
water. As it can be seen in Figure 4.4, there were five different inputs including the output
from previous process (receiving & storage), raw materials (choosing the right ingredients
for this product), water, diesel for the boiler to heat up the water and labour. The outputs for
this QC were the mixture of the ingredients which would go for the filtration process and
waste.

52
Figure 4.4: Quantity Centres 1 and its inputs and outputs
As explained earlier, the mixture was usually ratio of 70% water and 30% ingredients so
equivalently the input would be 700kg of water and 300kg of raw materials. The amount of
diesel could not be calculated as there was no logged data on its fuel consumption. The
generated wastes for QC1 were identified as spillage of water and ingredients during the
preparation process, and steam from the boiler which was emitted. Table 4.1, gives the
summary of QC1 including its inputs and outputs.
Table 4.1: Inputs and outputs of Quantity Centre 1
Input Water (kg) Ingredients (kg) Diesel (litre)
Amount 700 300 N/A
Output Mixture of ingredients (kg) Spillage Steam
Amount 1,000 Negligible N/A
There were basically only negligible wastes from water and ingredient spillage which could
be totally ignored. The boiler steam however, is being emitted and that could have negative
environmental impact. The amount of the emitted steam was not collected due to the existing
plan to change the boiler into a new closed-loop boiler so the emitted steam could be used
for the heat exchange with the water going into the mixing tank.

53
4.4. Quantity Centre 2 (Filling & Nuts)
After QC 1, all the mixture would go through different processes which were all closed loops
from one tank to another. After the freezing process was done the ice cream would be ready
to be filled inside the cones. Figure 4.5 depicts the inputs and outputs of this quantity centres.
Figure 4.5: Quantity Centres 1 and its inputs and outputs
Filling process was done by both machine and labour. Labours would put the cones on a tray
and then the machine would automatically fill the ice cream mixture into the cones, would
add chocolate and nuts and then press the lid on top of the cone. Then another labour would
take the cones on another tray for transferring them for the hardening process. Every few
batch, some of the ice creams would be taken for weighing to ensure that the quality of the
ice creams would comply with the rules and regulations.
The waste in this QC was identified as spillage of ice cream, spillage of chocolate and nuts
as well as waste of cones and lids. In this process by considering that the wastage of each of
the mentioned substances would be small therefore, slightest slippage in any of them would
cause a defect in the whole ice cream and as a result, the whole product would be considered
as waste. So in this quantity centre, instead of collecting data on each substance, the total
number of produced ice cream as well as the total number of defected ice cream were

54
calculated and analysed. Table below shows the number of produced ice cream for 6 months,
starting from August 2013.
Table 4.2: Number of produced CCC ice creams for 6 months since August 2013
Aug Sep Oct Nov Dec Jan
21,089 12,734 32,275 58,575 7,925 11,297
According to the table 4.2, factory by average, produced 23,983 CCC ice cream per month.
The data for defected ice cream were also collected for the same period which is shown in
table 4.3.
Table 4.3: Number of defected CCC ice creams in the filling process starting August 2013
Aug Sep Oct Nov Dec Jan
Filling 526 269 304 912 76 65
After data collection on the defected products in filling process was done, another round of
interview with the filling machine operators was conducted to find out the main reasons for
the defects in the product. The main reasons were listed as:
a) Jammed filling machine (particularly at the first hours of the operations)
b) Jammed chocolate and nuts crusher machine (particularly at the first hours of the
operations)
c) Broken or defected cones (either from the supplier or mishandled by the operators)
d) Mishandling the product while transferring them for the hardening process
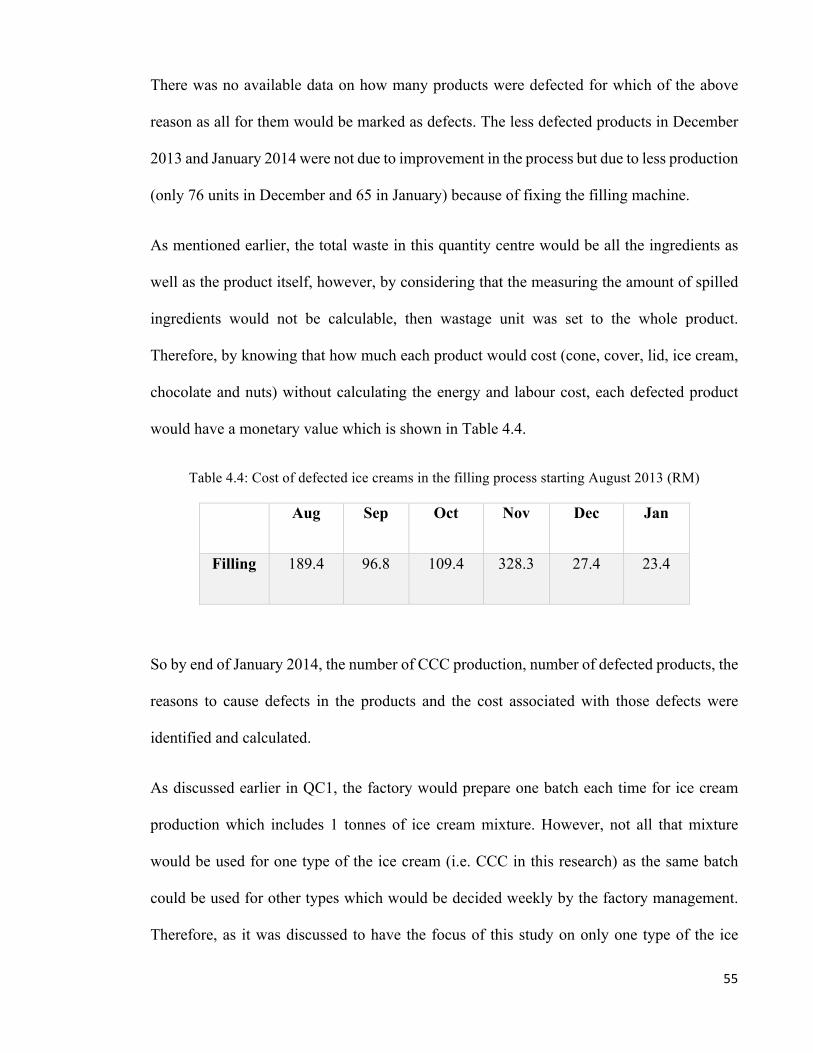
55
There was no available data on how many products were defected for which of the above
reason as all for them would be marked as defects. The less defected products in December
2013 and January 2014 were not due to improvement in the process but due to less production
(only 76 units in December and 65 in January) because of fixing the filling machine.
As mentioned earlier, the total waste in this quantity centre would be all the ingredients as
well as the product itself, however, by considering that the measuring the amount of spilled
ingredients would not be calculable, then wastage unit was set to the whole product.
Therefore, by knowing that how much each product would cost (cone, cover, lid, ice cream,
chocolate and nuts) without calculating the energy and labour cost, each defected product
would have a monetary value which is shown in Table 4.4.
Table 4.4: Cost of defected ice creams in the filling process starting August 2013 (RM)
Aug Sep Oct Nov Dec Jan
Filling 189.4 96.8 109.4 328.3 27.4 23.4
So by end of January 2014, the number of CCC production, number of defected products, the
reasons to cause defects in the products and the cost associated with those defects were
identified and calculated.
As discussed earlier in QC1, the factory would prepare one batch each time for ice cream
production which includes 1 tonnes of ice cream mixture. However, not all that mixture
would be used for one type of the ice cream (i.e. CCC in this research) as the same batch
could be used for other types which would be decided weekly by the factory management.
Therefore, as it was discussed to have the focus of this study on only one type of the ice

56
cream but to be sure that data was collected from one batch of data would be analysed
corrected, it was decided to also observe and collect the data from the same 1 tonne batch
which would go into other types of the ice cream. The other ice creams which were usually
produced besides the CCC ice cream from the same batch were identified as 0.5 litre and 15
litre tub ice creams and their data is listen in table 4.5.
Table 4.5: Data on 0.5 and 1.5 litre ice cream from same batch as CCC ice cream
The collected results from the table 4.5 showed that the production of this type of ice cream
(0.5 and 1.5 litre tub) which used the same ice cream mixture as CCC ice cream had not waste
in any form. The reasons were due to the different way of handling and filling this type of
Production of 0.5 and 1.5 litre ice cream
Total input Number Weight (kg)
Product 0.5L 200tubs 55
Product 1.5L 336tubs 277.2
Tub and lids 0.5L ice cream 200 pcs 7.2
Tub and lids 1.5L ice cream 336 pcs 28.056
Sticker 0.5L ice cream 200 pcs 0.36
Sticker 1.5L ice cream 336 pcs 1.344
Plastic 0.5L ice cream 200 pcs 0.7
Plastic 1.5L ice cream 336 pcs 3.528
Total output
Product 0.5L 63.26
Product 1.5L 310.128

57
product. In addition to that, unlike delegate and fragile cones, the containers of this ice cream
were hard plastic which were much stronger.
4.5.Quantity Centre 3 (Packing)
The next quantity centre to analyse was Packing which was done after the hardening process
(keeping the ice cream in the cold room for 4 hours) and it was the last process before the
delivery. In this process, products were picked by operators and piled up in the cardboard
boxes to be ready for delivery. Figure 4.6 depicts the inputs and outputs of this quantity
centres.
Figure 4.6: Quantity Centres 1 and its inputs and outputs
In packing process, the input would be the ready ice cream, boxes, tapes to seal the box and
plastics to keep the boxes sealed so the whole package would not get contaminated during
the delivery process.
The waste in this QC was identified as product itself, boxes, plastics, tapes, PPE (Persona
Protective Equipment) and wooden pallets. The data from input and output were analysed
however, the focus remained on the product defects so the comparison on the same waste
type could be done from two different quantity centres. Table 4.6 shows the total input into
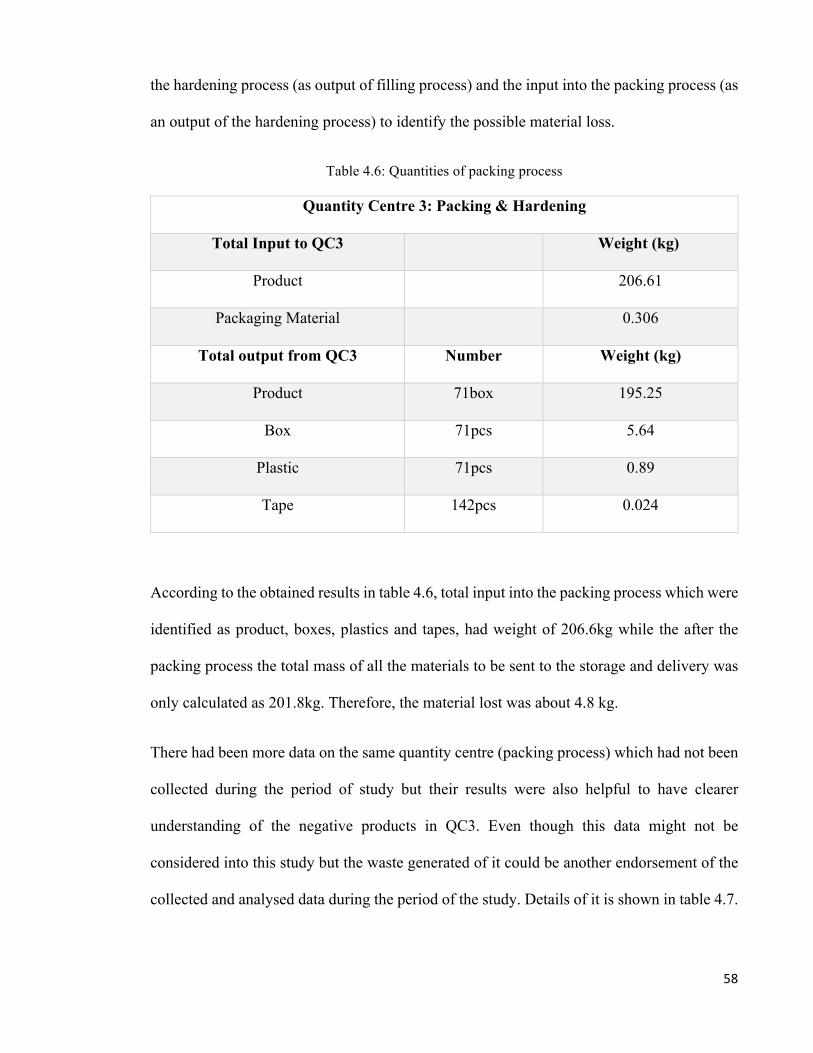
58
the hardening process (as output of filling process) and the input into the packing process (as
an output of the hardening process) to identify the possible material loss.
Table 4.6: Quantities of packing process
Quantity Centre 3: Packing & Hardening
Total Input to QC3 Weight (kg)
Product 206.61
Packaging Material 0.306
Total output from QC3 Number Weight (kg)
Product 71box 195.25
Box 71pcs 5.64
Plastic 71pcs 0.89
Tape 142pcs 0.024
According to the obtained results in table 4.6, total input into the packing process which were
identified as product, boxes, plastics and tapes, had weight of 206.6kg while the after the
packing process the total mass of all the materials to be sent to the storage and delivery was
only calculated as 201.8kg. Therefore, the material lost was about 4.8 kg.
There had been more data on the same quantity centre (packing process) which had not been
collected during the period of study but their results were also helpful to have clearer
understanding of the negative products in QC3. Even though this data might not be
considered into this study but the waste generated of it could be another endorsement of the
collected and analysed data during the period of the study. Details of it is shown in table 4.7.
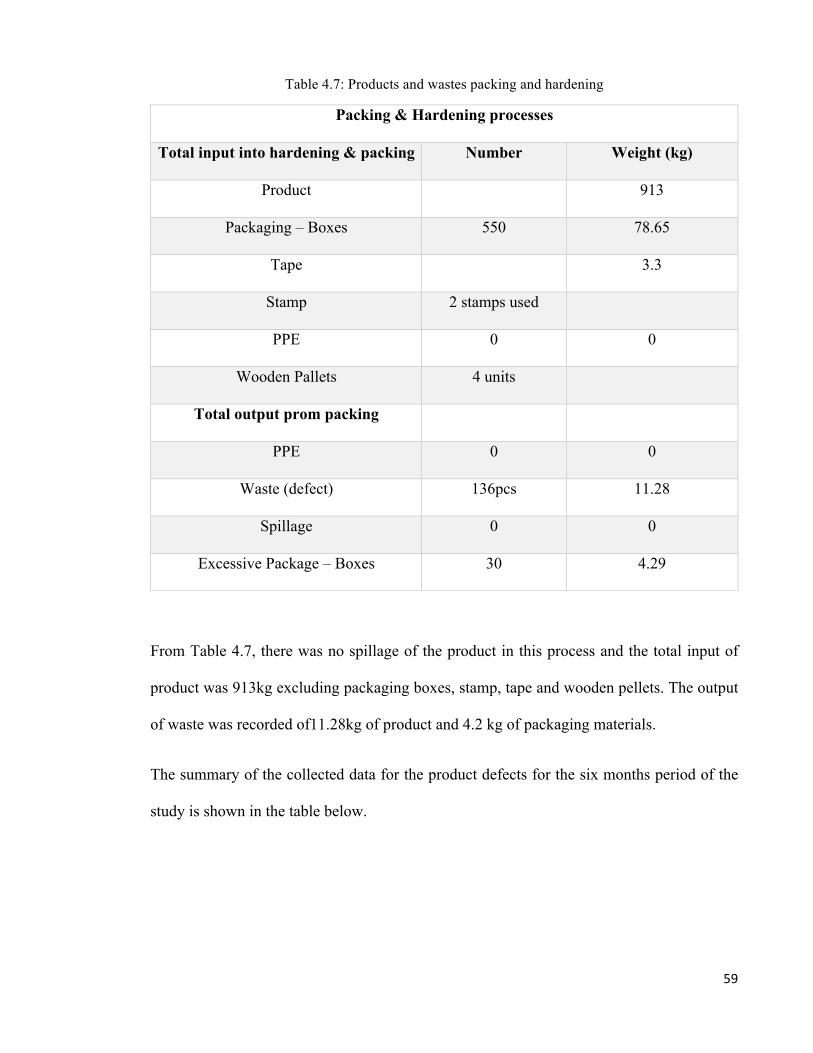
59
Table 4.7: Products and wastes packing and hardening
From Table 4.7, there was no spillage of the product in this process and the total input of
product was 913kg excluding packaging boxes, stamp, tape and wooden pellets. The output
of waste was recorded of11.28kg of product and 4.2 kg of packaging materials.
The summary of the collected data for the product defects for the six months period of the
study is shown in the table below.
Packing & Hardening processes
Total input into hardening & packing Number Weight (kg)
Product 913
Packaging – Boxes 550 78.65
Tape 3.3
Stamp 2 stamps used
PPE 0 0
Wooden Pallets 4 units
Total output prom packing
PPE 0 0
Waste (defect) 136pcs 11.28
Spillage 0 0
Excessive Package – Boxes 30 4.29
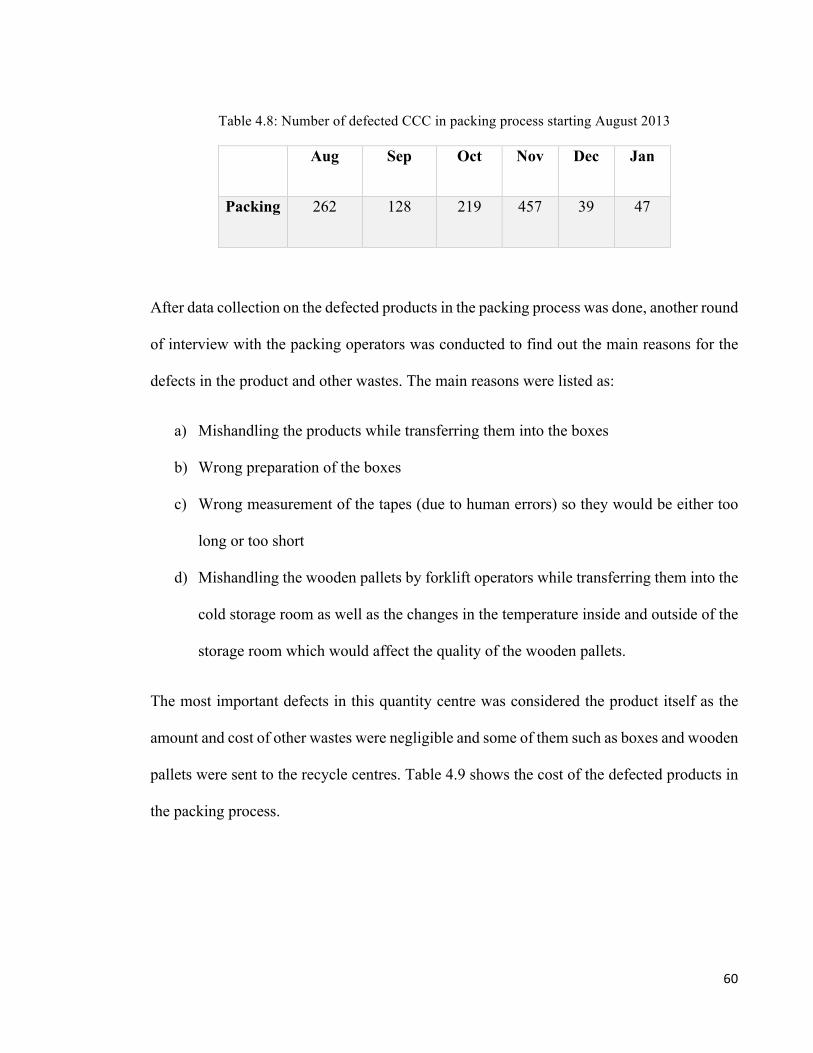
60
Table 4.8: Number of defected CCC in packing process starting August 2013
Aug Sep Oct Nov Dec Jan
Packing 262 128 219 457 39 47
After data collection on the defected products in the packing process was done, another round
of interview with the packing operators was conducted to find out the main reasons for the
defects in the product and other wastes. The main reasons were listed as:
a) Mishandling the products while transferring them into the boxes
b) Wrong preparation of the boxes
c) Wrong measurement of the tapes (due to human errors) so they would be either too
long or too short
d) Mishandling the wooden pallets by forklift operators while transferring them into the
cold storage room as well as the changes in the temperature inside and outside of the
storage room which would affect the quality of the wooden pallets.
The most important defects in this quantity centre was considered the product itself as the
amount and cost of other wastes were negligible and some of them such as boxes and wooden
pallets were sent to the recycle centres. Table 4.9 shows the cost of the defected products in
the packing process.

61
Table 4.9: Cost of defected ice creams in the packing process starting August 2013 (RM)
Aug Sep Oct Nov Dec Jan
Packing 116.3 56.8 97.25 202.95 17.35 20.85
So by end of January 2014, the number of defected products, the reasons to cause defects in
products and the cost associated with those defects in packing process were identified and
calculated. In addition to that, part of the hardening process was included into the data
collection as the output of the hardening process was the input of the packing process.
4.6. Data analysis on all quantity centres
In previous sections, the data from each quantity centre was collected and analysed
separately. In the first QC, the waste was negligible and the waste generation could be
mitigated by more care and proper handling of the materials as well as a more efficient boiler
to send back the steam into the system for heat exchange. The data on residues in the tanks
could not be collected due to lack of facilities for wastewater in the factory. However, as
discussed in the literature review section, by existing a wastewater treatment plant inside the
factory, it would be possible to collect the wastewater from the tanks (while being washed)
and then analyse the organic substances in it and calculate the amount of it in the tanks
(Dierks, 2011).
Tables 4.3 and 4.8 showed that there were more defected products in the filling process than
in the packing process. The ratio between number of product defects of these two processes

62
is shown in table 4.10. The ratio was calculated based on the total number of defects in both
filling and packing process over number of defects on each process.
Table 4.10: Ratio between number of defects in filling and packing processes
Total Defects (pcs) Defect Ratio (%)
Filling 2,152 65.13
Packing 1,152 34.87
The ratio between cost of product defects of these two processes was also calculated and is
shown in table 4.11. The ratio was calculated based on the total cost of defects in both filling
and packing process over cost of defects on each process.
Table 4.11: Ratio between cost of product defects in both filling and packing processes
Total Cost (MYR) Ratio Cost (%)
Filling 774.7 60.13
Packing 511.5 39.87
In conventional material flow analysis methods, the cost would be directly to the amount of
wastes. Therefore, it was expected that the ratio between the number of product defects and
cost of them in both processes would be same. However, result showed that even though the
ratio for product defects in filling process was slightly more than 65%, but the cost of the

63
defects in the same process was not 65% but 60%. The difference could be explained in
MFCA method as further a product would go from one process to another, the cost of
production (either actual product or negative product or waste) would go higher (Jaroslava
Hyršlová et al., 2011) (Schmidt et al., 2013) (Kasemset et al., 2016). So in conventional
methods of material flow analysis, the countermeasure to tackle the waste problem would
have been on the filling process as it had 65% of the defect products and to find solutions to
mitigate the waste generation and reduce product defects inside the process. However, in
MFCA approach, by understanding that the product defects in the packing process was not
only would waste the ice cream itself but also the materials and energy carried out with the
product from filling process to hardening and finally to the packing processes. And that could
explain the reason why the ratio of product defect in filling process would not match with the
ratio of the cost for the same process. Of course, to understand this in more details, would
require calculating the energy and labour costs for these processes and engage Life Cycle
Analysis (LCA) and cost assessment into this study as in environmental accounting research,
there are a few studies that focus on the active role of environmental accounting (Kitada, et
al., 2012).
After sharing the findings with the factory management, the decision was made to mitigate
the waste generation at the filling process only. Even though MFCA approach clarified that
the ratio of cost might be slightly higher in packing process, but the environmental impact
would be negligible as the defect product would not be thrown away but consumed internally.
The defect from the filling process would be treated as a solid waste while the defect product
of the packing process would be still edible but not suitable for sales. Therefore, MFCA also
played an important role for making an environmental/economic decision (Chang et al.,
2015).

64
CHAPTER FIVE: CONCLUSION AND RECOMMENDATIONS
MFCA implementation provides information such as material loss throughout the process,
the use of materials that do not become products (also known as negative product), overall
costs and the energy associated with the material loss. Managers who are aware of the costs
associated with material losses can then identify opportunities to increase efficiency in
material use and improve business performance and reduce environmental impacts. Through
the identification of MFCA issues that lead to material losses, organizations have a chance
to identify the resulting economic loss.
Once MFCA analysis has assisted an organization to understand the magnitude,
consequences, and drivers of material use and loss, the organization may review the MFCA
data and seek opportunities to improve environmental and financial performance. The
measures taken to achieve these improvements can include substitution of materials,
modification of processes, production lines, or products and intensified research and
development activities related to material and energy efficiency.
By applying MFCA, financial costs such as processing and material losses are identified. In
many cases, the scale of the identified costs is more significant than previously assumed. At
the same time, MFCA presents an ultimate target for engineers: “the zero-material loss cost”
which can encourage the organization to make a breakthrough in the recognition of the
necessity for improvement. The typical losses identified by MFCA include the following:
a) Waste treatment cost for material loss;
b) Procurement cost for material losses sold to external recycling contractors;
c) System cost for material losses (labour, depreciation, fuel, utility and other costs);

65
d) System cost required for internal recycling of materials; and
e) Material and system costs for in-stock products, work-in-progress materials,
materials that were disposed of due to a switch to a newer model, deterioration of
quality, or for aging stock.
Furthermore, companies are often unaware of losses associated with recyclable waste
because such waste is reused as resources and sometimes sold as valuable material to external
recyclers.
MFCA increases the transparency of material flow, which is a key to successful problem-
solving and improvement. By solving problems, organizations can increase their resource
productivity and reduce costs at the same time. While most organizations monitor the yield,
rate associated with the materials used in the process, the general scope of such monitoring
only covers the main materials, processes, or losses in many cases. In such cases, MFCA
helps organizations highlight uncontrolled material losses.
The last but not least, all the objectives of this research were fulfilled in terms of
understanding the process flow of the picked product, defining the correct quantity centres,
establishing the material balance and identifying input and output materials and other
substances such as energy and labour into each quantity centre, converting the material loss
into the monetary equivalent and finally highlighted all the findings to the management and
propose a countermeasure for better efficiency in business performances and less
environmental impacts.

66
REFERENCES
1. Abdul Manaf Bohari (2008). Management Information System. Asia e-University
Publication, Kuala Lumpur.
2. Agriculture Information Network (GAIN) Report, MY7021.
3. Ananda S (2008) Global Halal Presence. Business Today June 8 (6), Reach
Publishing.
4. Chang J (2007) Malaysia Market Development Reports World Halal Forum and
Malaysia's Role. Global.
5. Chang, S. H., Chiu, A., Chu, C. L., Wang, T. S., & Hsieh, T. I. (2015). Material Flow
Cost Accounting System for Decision Making: The Case of Taiwan SME in the Metal
Processing Industry. Asian Journal of Finance & Accounting, 7(1), 117-134.
6. Cole Ehmke, MS (2008) Strategies for competitive advantage. Department of
Agricultural and Applied Economics, University of Wyoming.
7. Dagang Asia Net (2011) The Emerging of Global Halal Market. [cited May 11, 2011].
8. Darlington R., Staikos T. and Rahimifard S. (2008),Analytical methods for waste
minimisation in the convenience food industry, Waste Management 29 (2009) 1274–
1281
9. DEFRA, 2005. Draft food industry sustainability strategy (FISS), Department for
Environment, Food and Rural Affairs (DEFRA), UK., Available:
http://www.defra.gov.uk/corporate/consult/fiss/draft-fiss.pdf [accessed 15 January
2013]
10. Dess GG, Lumpkin GT, Taylor ML (2005) Strategic Management (2 ed). McGraw-
Hill Irwin, New York.
67
11. Dierks (2011) Market Watch 2010 – The Food Industry. Malaysian-German Chamber
of Commerce & Industry enterprise. MacGraw Hill Irwin, New York.
12. Envirowise, 2002. Waste Minimisation for Managers. In: Good Practice Guides
(GG367), vol; 24. Envirowise, Oxford, UK.
13. Evans N (2003). The needs for enterprise innovation. [cited May 24, 2010].
14. Fink, Julian (2013). "Assessing the material flows in the production process of the
electronic industry – A case study at Europe’s largest producer of printed circuit
boards -master thesis-". University of Graz.
15. Functions of Gums in Food Systems, Powerpoint, 20 Jan 2005,
16. HDC (2008) HDC will be pro-business. The Halal Journal. [cited 25 June, 2008].
Available: http://www.dagangasia.net/articles [accesses 15 March 2013]
17. Higashida, A., Kokubu, K., & Shinohara, A. (2013, July). Introducing material flow
cost accounting and creating visibility–analyzing MFCA in practice based on a
longitudinal case study. In Proceedings of the seventh asia pacific interdisciplinary
research in accounting conference (pp. 26-28).
18. Hyrslová, J., Vágner, M., & Palásek, J. (2011). Material flow cost accounting
(MFCA)-tool for the optimization of corporate production processes. Business,
Management and Education, 9(1), 5.
19. ISO/FDIS, 14051 Environmental Management – Material Flow Cost Accounting –
General Framework
20. Janis MZ (2004) Malaysian Standard MS1500. Standards & Quality News 11 (4)
21. Jasch C. (2009), Material Flow Cost Accounting-Principles and Procedures, Springer
June 2006. [cited 21 May, 2006]. Available from:
http://www.skrine.com/get.php. Kuala Lumpur.

68
22. Kasemset, C., Boonmee, C., & Khuntaporn, P. Application of MFCA and ECRS in
Waste Reduction: A Case Study of Electronic Parts Factory.
23. M.v. Hauff, R. Isenmann and G. Müller-Christ (2012). Industrial Ecology
Management
– Nachhaltige Entwicklung durch Unternehmensverbünde. Wiesbaden: Springer
Gabler. pp. 241–255.
24. Malaysia (2008). The Global Halal Hub. New Straits Times. July 12
25. Malaysia Food Business Directory (MFBD) (2007). Food industry in Malaysia: An
overview. [cited 2 May 2007]. Available:
http://www.foodbizmalaysia.com/ttd_bizenterprise [accessed 15 March 2013]
26. Malaysian Institute of Economic Research (2005). Halal food industry deserves
more attention. MIER,Kuala Lumpur.
27. Material Flow Cost Accounting, MFCA Case Examples, Environmental Industries
Office, Industrial Science and Technology Policy and Environment Bureau,
Ministry of Economy, Trade and Industry, Japan,March 2010
28. Moody, J.B and Nogrady, B. (2010), Sixth Wave, 1st Ed, Random House Australia
29. Nguyen, M.H., Durham, R.J., 2004. Status and prospects for cleaner production in
the dairy food industry. Australian Journal of Dairy Technology 59, 171-173.
30. O’Brian JA (2007) Management Information Systems: Managing information
technology in the business.
31. OECD, 2008. Evaluation of Development Assistance: Summary of Key Norms and
Standards, vol. 28. Organisation for Economic Cooperation and Development;
Paris (France).
32. Porter ME (2008) The five competitive forces that shape strategy. Harvard Business
69
Review.
33. Ramli N (2006) Halal - The new global market force. Legal Insights A Skrine
Newsletter, Issue 2/2006,
34. Schmidt, A., Hache, B., Herold, F., & Götze, U. (2013). Material flow cost
accounting with umberto. In Paper on Workshop of the cross-sectional group (Vol.
35. SME Annual Report 2006 (2007) Potential growth areas for SMEs. National SME
Development Council.
36. Sungkar I (2008) The global trends and halal trade issue. The Halal Journal,
May/June 2008.
37. Turban E, McLean E, Wetherbe J (2007) Information technology for management:
Making connection for strategic advantages (2nd ed). John Wiley & Sons, New
York.
38. UNEP, changing production patterns – learning from the experience of
National cleaner production centres, United Nations Environment Programme
(UNEP). Division of Technology, Industry, and Economics (DTIE), Paris (2002).
39. UNEP, Danish Environmental Protection Agency, Danish Ministry of Environment
and Energy. Cleaner production assessment in meat processing 2000.
40. UNIDO, 2008. Independent Evaluation of the UNIDO-UNEP Cleaner Production
Programme, vol 28. United Nations Industrial Development Organisation,
Vienna, Austria.
41. Wagner, B., Nakajima, M., & Prox, M. (2010). "Materialflusskostenrechnung – die
internationale Karriere einer Methode zu Identifikation von Ineffizienzen in
Produktionssystemen". uwf UmweltWirtschaftsForum 18: 197–202.
70
SUPPLEMENTARY
1. List of Publications and Papers Presented
1.1. MFCA Implementation in Small and Medium Enterprises (SME) in Malaysia: A
Case Study of an Ice Cream Factory
Paper which is published in the Eco Balance 2012, the 10th International Conference on
Eco Balance, Challenges and Solutions for Sustainable Society, November 2012 –
Yokohama, Japan


