Page 1
The world leader in serving science
Improving Single Use Bioreactor Design and Process Development: New Research Towards Intensifying Seed-Train and Scale-Up Methods Using 5:1 Turn-Down
Nephi Jones – Advanced Technology R&D Manager BioProduction—Single-Use Technologies
Interphex – NY, NY—March 2017
Page 2
2
Outline
Lab
Efficiency
Clinical Trial
Assurance
Bioprocessing
Productivity
Logistics &
Transparency
Safety &
Quality
• Thermo ScientificTM S.U.B.
capabilities
• Benefits and Challenges of low
turn-down (5:1) operation
• S.U.B. modifications for 5:1
operation
• Mass Transfer Review/Results
• Cell Culture Performance
• Conclusions
Page 3
3
Two S.U.B. Family Offerings
Open Architecture Thermo Scientific S.U.B.
Integrate with the control platform
of your choice
Turnkey Solutions Thermo Scientific
HyPerforma™ S.U.B. TK
State-of-the-art S.U.B. with integrated
control choices DeltaV or PLC options
Choice of leading controller platforms for Turnkey S.U.B.
Scalability from 50 to 2000 L
Page 4
4
Single-Use vs. Traditional Steel Systems
Single-Use Provides Lower Environmental Impact
An Environmental Lifecycle Assessment of Single-Use and Conventional Process Technology:
Comprehensive Environmental Impacts. M Pietrzykowski et al. BioPharm International. 27(3) 01 Mar 2014. *GE Affiliated Authors
Environmental Impact of Single-Use and Reusable Bioprocess Systems. Rawlings and Pora. BioProcess International.
February 2009. *Pall Affiliated Authors
Page 5
5
• Improved utilization of floor space Fewer required vessels for seed train
• Improved utilization of floor space Potential to increases capacity of facility
• Lower Risk Fewer liquid transfers and sterile line connections
• Fewer required vessels Fewer sizes More standardized parts & flexibility
• Fewer required single-use components Simplifies ordering & inventory
• Homogeneous mix through drain during harvest Robust scale-up
Advantages to 5:1
Page 6
6
5:1 Cell Culture Design Challenges
Primary Challenges
• CO2 Headspace Buildup
• Traditional overlay gassing ineffective
• Changes to Fluid Mixing
• Impeller oversized
• Impeller shaft position and adjustment
• Fluid deflection increases off reactor bottom
• Mixer shear zone proportionally larger
Secondary Challenges
• Existing Sparge Design
• Frit too tall in 50/100 L (removed in all vessel sizes)
• DHS as primary DO control
• Temperature Control
• Water jacket recommended
• Bottom jacket required
• Feed strategy implementation
• Probe and overlay locations
• Upper probe belt for overlay gas
• Sensors position on 50/100/250 L
• Film choice important • Surface area to volume ratio
• L&E
• Film platform
Page 7
7
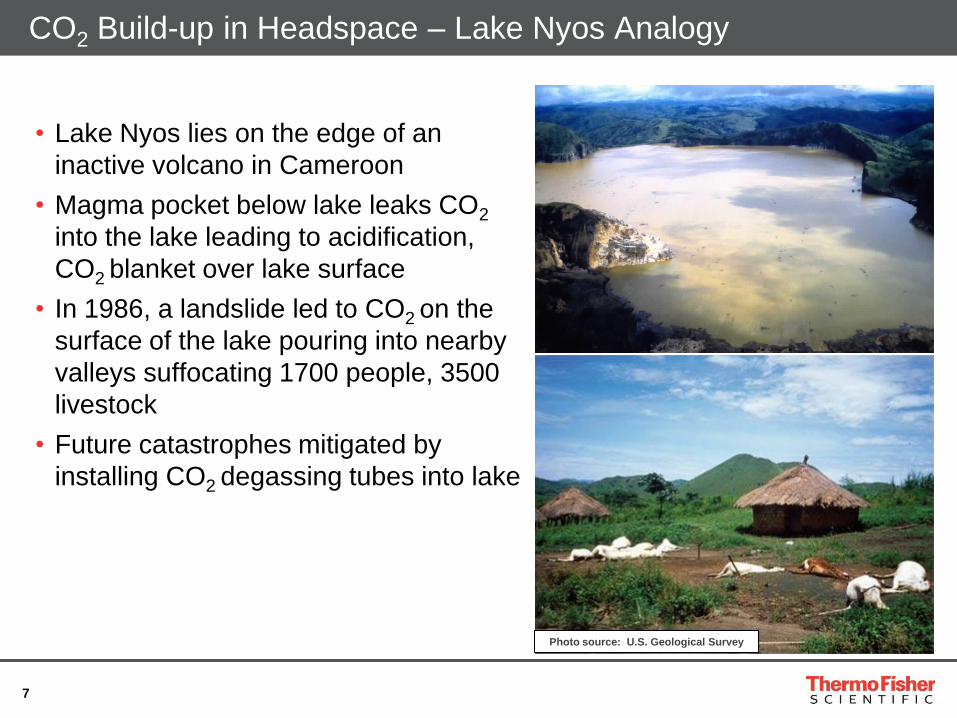
• Lake Nyos lies on the edge of an
inactive volcano in Cameroon
• Magma pocket below lake leaks CO2
into the lake leading to acidification,
CO2 blanket over lake surface
• In 1986, a landslide led to CO2 on the
surface of the lake pouring into nearby
valleys suffocating 1700 people, 3500
livestock
• Future catastrophes mitigated by
installing CO2 degassing tubes into lake
CO2 Build-up in Headspace – Lake Nyos Analogy
Photo source: U.S. Geological Survey
Page 8
8
• CO2 builds in the headspace, heavier CO2 blankets the liquid surface
• Increases dissolved CO2
• Dampens oxygen transfer, as headspace overlay gasses affect partial pressure of gas in solution
• Traditional top entry overlay sparger insufficient to mix headspace gas
• Gas velocity is too low at the liquid height
• Solution: Thermo Scientific patented Cross Flow Sparger
• Introduce gas just above the liquid height
• Improves mass transfer using headspace
• Use DHS to fine-tune DO and pH
• Run more like a rocking/stirred-tank reactor combo
• Reduces bubble sparging and associated foam damage to cells
Thermo Scientific Cross Flow Sparger
It is important to position the
overlay gas entry point in close
proximity to liquid surface when
at 20% rated working volume.
Page 9
9
Reactor Turndown Strategy – Retrofit Kit
• Design Space Parameters (5:1 Turn-down)
• Agitation angle 19.6°to 16.5°
• Bottom sparge location maintained
• 20% liquid volume covers top of impeller
• Side entry cross flow sparge ~12 lpm
• ≤500L SUB (50, 100, 250, 500L S.U.B.s)
• Motor mount angle lowered (3.1°less)
• Drive shaft length increased (6 -16 cm)
• ≥1000L SUB (1000, 2000L S.U.B.s)
• Pneumatic controlled agitator positioning
• Safety Interlocks (shaft loading, auto-locking
up & down positions, agitation PIV scaling)
• Simple design for cGMP – two pre-defined
motor positions fix the agitator location
• High – Standard impeller position
• Low – 5:1 cell culture seeding or harvest
2:1
250L
2,000L
5:1
5:1
250L
Page 10
10
• SUB scale-up strategy using DHS as
primary sparge
• Performance less dependent on agitation
• Uniform, consistent bubble size
independent of gas flow rate (0.1 VVM)
• Trivial gas entrance velocities
• Better bubble pre-distribution
• Less stable foam generation
• Target specific O2:CO2 mass transfer
rates (3:1)
• Flexible use of 4-gas strategy
• Provides oxygen delivery and effective CO2
stripping—both are important
Thermo Scientific Drilled Hole Sparger
Page 11
11
What is mass transfer and kLa?
Simplified Mass Transfer Diagram
• Comes from simplified gas liquid film theory equation:
• NL = kLa(CLi – CL )
• kL is the transfer coefficient (1/m2/hr)
• a is the area of flux (m2)
• CLi is the interface concentration (mg/L)
• CL is the liquid bulk concentration (mg/L)
• NL is the mass transfer rate (mg/L/hr)
• Driving factors
• Partial pressure difference (CLi – CL )
• Area available for transfer vs. volume (a)
• Gas bubble liquid film thickness (kL)
• Gas bubble liquid film resistivity (kL)
Page 12
12
Measuring O2 and CO2 Transfer
• Measure kLa via “Dynamic Method”
• Commonly used for measuring O2 delivery
performance
• Can assess CO2 stripping as well
• Repeatable, consistent, inexpensive
• Test solution
• 1 g/L Poloxamer 188
• 3.5 g/L HEPES buffer
• pH 7.25 at air saturation
• O2 vs. CO2 Considerations
• Solubility
• Operating partial pressure
0
20
40
60
80
100
81 83 85 87 89 91
O2
CO2
Reactor Dissolved
O2 Setpoint
CO2 Stripping partial O2 Delivery partial pressure delta Mass Ratio Dissolved Gas
pressure delta with air sparging with air sparging with O2 CO2 O2
30% air saturation 0.06 0.147 0.937 14.4 1
50% air saturation 0.06 0.11 0.89 8.5 1
Table 1. Driving Partial Pressure Delta Available to Strip CO2 and Add O2 in a Typical Animal Cell Culture Bioreactor
(in atm assuming 1 atm ambient pressure) & Corresponding Ratio of Dissolved Gas in DI H2O at 37ºC
CO2 Stripping Data Vertically Mirrored On O2 *
* Note: CO2 sensor limits exceeded causing signal saturation near 20%.
% g
as s
at.
Time
Page 13
13
0
0.5
1
1.5
2
2.5
3
3.5
4
4.5
0 5 10 15 20
kLa
(1
/hr)
Position above liquid surface (inches)
500 L S.U.B. CO2 stripping rates of cross flow sparger + 0.02 VVM frit
50 L/min
35 L/min
20 L/min
10 L/min
Cross Flow Sparger CO2 Stripping Performance
Page 14
14
0
1
2
3
4
5
6
7
8
9
10
0 0.02 0.04 0.06 0.08 0.1
kLa (
1/h
r)
DHS flow (VVM)
250 L 5:1, O2, 40 W/m3
250 L, No Overlay
Oxygen Transfer, 250L 5:1
0
1
2
3
4
5
6
7
8
9
10
0 0.02 0.04 0.06 0.08 0.1
kLa (
1/h
r)
DHS flow (VVM)
250 L 5:1, O2, 40 W/m3
250 L, CFS 250 L, Standard Overlay 250 L, No Overlay
Consistent O2 mass transfer
between standard overlay
and cross flow sparger
Overlay/CFS = 14 L/min air
Page 15
15
0
1
2
3
4
5
6
7
8
9
10
0 0.02 0.04 0.06 0.08 0.1
kLa (
1/h
r)
DHS flow (VVM)
250 L 5:1, CO2 stripping, 40 W/m3
250 L, No Overlay
0
1
2
3
4
5
6
7
8
9
10
0 0.02 0.04 0.06 0.08 0.1
kLa (
1/h
r)
DHS flow (VVM)
250 L 5:1, CO2 stripping, 40 W/m3
250 L, Standard Overlay 250 L, No Overlay
0
1
2
3
4
5
6
7
8
9
10
0 0.02 0.04 0.06 0.08 0.1
kLa (
1/h
r)
DHS flow (VVM)
250 L 5:1, CO2 stripping, 40 W/m3
250 L, CFS 250 L, Standard Overlay 250 L, No Overlay
CO2 Stripping Improvements
Large increase in CO2
stripping utilizing cross
flow sparger,
Overlay/CFS = 14 L/min air
Page 16
16
0
1
2
3
4
5
6
7
8
9
10
0 0.02 0.04 0.06 0.08 0.1
kLa (
1/h
r)
Gas flow (VVM)
5:1, CO2 stripping, 40 W/m3
50 L 100 L 250 L 500 L 1000 L 2000 L
System Scalability, CO2 Stripping
CFS at 50-70 L/m2/min air
Page 17
17
Cell Culture Studies
• GIBCOTM FreedomTM CHO-STM, mAb producer
• GIBCO DynamisTM AGTTM Medium
• Advanced Granulation TechnologyTM
• 0.1% GIBCO Anti-Clumping Agent
• Feeds
• EfficientFeedTM C+ AGT Supplement
• 2X concentration
• 15% constant feed (day 3-10)
• 45% Glucose constant feed as needed (<5 g/L)
Page 18
18
• 20 W/m3 agitation
• DHS as only sparger
• O2 as primary gas; CO2/N2 as needed
• CFS/Overlay ~50-70 L/m2/min
• Seed at 20% WV on D0
• Feed to 85% WV on D2-3 with standard
media
• Continue standard feed D5-12
• Variable pH control
• pH 7.2 at start
• CO2 stripping too high D0-D2/3
• No pH control after D2/3 (no base, no CO2)
• Maintains CO2 30-80 mmHg
• pH variable 6.8-7.2
S.U.B. Operation
Page 19
19
0
10
20
30
40
50
60
70
80
90
100
0
5
10
15
20
25
30
35
40
45
50
0 2 4 6 8 10 12 14 16 18
Via
bilit
y (
%)
VC
D (
E06 c
ells/m
L)
Time (Day)
50 L 100 L 250 L 500 L 1000 L 2000 L
Scalable Cell Culture Results
Feed to full volume:
100 L = D3
All others = D2
Page 20
20
Consistent Cell Culture Performance
0
10
20
30
40
50
60
70
80
90
100
0
5
10
15
20
25
30
35
40
45
50
0 2 4 6 8 10 12 14 16 18
Via
bilit
y (
%)
VC
D (
E06 c
ells/m
L)
Time (Day)
50 L seed 5:1 --> full vol 50 L seed 5:1 --> maintain 5:1
250 L seed 5:1 --> full vol 250 L seed full vol
Page 21
21
0.8
0.85
0.9
0.95
1
1.05
1.1
1.15
1.2
0 0.2 0.4 0.6 0.8 1 1.2 1.4 1.6 1.8
No
rmalized
Bio
mass
Time (hr)
50 L 250 L
Mix Through Drain, Harvested Bioreactor
• 50 L harvest at constant motor RPM through drain
• 250 L harvest included 1-time motor adjustment to reduce to 20 W/m3 at half
volume
• Motor stopped at 20% WV, biomass monitoring continued through harvest
• Maximum 10% cell density difference through harvest maintained
1-time motor speed
reduction in 250 L at
half volume to reflect
20 W/m3 power input
Page 22
22
Cell Culture Strategies
750 mL Flask
50 L at 5:1 Volume
50 L at Full Volume
2000 L at 5:1 Volume*
Option 1: Option 2: Option 3:
Optimized Floor
Space for Single
Production Run
Improved Seed
Train for Multiple
Production Vessels
Intensified Seed Train
for Reducing
Production Run Time
2000 L at Full Volume
750 mL Flask
50 L at 5:1 Volume,
then full volume
6 x 2000 L at Full
Volume
750 mL Flask
50 L at 5:1 Volume
50 L at Full Volume,
Initiate Perfusion to
50E06 cells/mL
1 x 2000 L at Full
Volume, 4X seed
concentration
1000 L at 5:1 Volume,
then full volume
Page 23
23
• Improved scale volume 10 L-2000 L WV
• Retrofit kits available for all HyPerforma S.U.B.s
• Bottom-jacketed for improved heat transfer
• Drilled hole sparger for superior mass transfer scale-up
• Cross flow sparger for CO2 stripping control
• Scalable mass transfer among vessel sizes
• Repeatable cell growth with no loss in performance
• Homogeneous mix through drain
Thermo Scientific HyPerforma 5.1 Single-Use Bioreactor
Page 24
24
Thank You
Questions?
Products for research use only. Not for use in diagnostic procedures.
© 2017 Thermo Fisher Scientific Inc. All rights reserved. All
trademarks are the property of Thermo Fisher Scientific and its
subsidiaries unless otherwise specified.