Improving solar power forecasting to reduce regulation Frequency Control Ancillary Services causer pay in the National Electricity Market Jing Huang a and Sam West b a CSIRO Oceans and Atmosphere, Black Mountain, ACT, Australia, b CSIRO Energy Technology, Newcastle, Australia Email: [email protected]Abstract: Driven by many factors including sharply declining costs and the pressing need for climate change mitigation, in particular the Large-scale Renewable Energy Target (LRET) in Australia, the installation of renewable energy generation such as wind and solar is rapidly increasing all over the world. Since 2015, more and more utility-scale (>30 MWp) solar farms are being commissioned and connected to Australia’s National Energy Market (NEM). However, the power generation from wind and solar resources relies on complex weather and climate processes and is inherently variable. Together with other uncertainties such as load forecasting errors, this could result in generation-load imbalance, which in turn causes fluctuations of AC frequencies in the grid. Since all electric equipment connected to the grid (e.g. household appliances and steam turbines) is designed to operate at or close to 50 Hz in Australia, frequency control is critically important to maintaining a secure and reliable power system. To address this issue, the Australian Energy Market Operator (AEMO) frequently corrects the generation-load imbalance via a 4-second market mechanism to restore system frequency back to the nominal 50 Hz through the procurement of regulating Frequency Control Ancillary Services (FCAS). Cost for this market are recovered under a mechanism known as ‘causer pays’, whereby a grid-connected solar farm is liable for the part of costs according to its estimated contribution to the need for regulating the grid frequency. However, although it is widely recognised that the quality of power forecasts of renewable generators relates to the need (hence the associated costs) for frequency regulation to some extent, a quantitative model of the relationship remains unavailable. In this study, we use high-temporal-resolution generation and forecast data published by the AEMO to reveal the functional relationship between causer-pay contribution factors which are proportional to actual payments assigned to individual solar farms and the quality of solar power forecasts issued by the Australian Solar Energy Forecasting System (ASEFS). We found that the contribution factors are largely due to the coincidence of a positive forecasting bias and a low system frequency. We then manage to effectively model the contribution factor of a solar farm using information only for that solar farm. Keywords: Solar forecasting, frequency control ancillary services, causer pays, regulation service, mean absolute error 23rd International Congress on Modelling and Simulation, Canberra, ACT, Australia, 1 to 6 December 2019 mssanz.org.au/modsim2019 582
Transcript
Improving solar power forecasting to reduce regulation Frequency Control Ancillary Services causer pay in the
National Electricity Market Jing Huang a and Sam West b
a CSIRO Oceans and Atmosphere, Black Mountain, ACT, Australia, b CSIRO Energy Technology, Newcastle, Australia
Abstract: Driven by many factors including sharply declining costs and the pressing need for climate change mitigation, in particular the Large-scale Renewable Energy Target (LRET) in Australia, the installation of renewable energy generation such as wind and solar is rapidly increasing all over the world. Since 2015, more and more utility-scale (>30 MWp) solar farms are being commissioned and connected to Australia’s National Energy Market (NEM). However, the power generation from wind and solar resources relies on complex weather and climate processes and is inherently variable. Together with other uncertainties such as load forecasting errors, this could result in generation-load imbalance, which in turn causes fluctuations of AC frequencies in the grid.
Since all electric equipment connected to the grid (e.g. household appliances and steam turbines) is designed to operate at or close to 50 Hz in Australia, frequency control is critically important to maintaining a secure and reliable power system. To address this issue, the Australian Energy Market Operator (AEMO) frequently corrects the generation-load imbalance via a 4-second market mechanism to restore system frequency back to the nominal 50 Hz through the procurement of regulating Frequency Control Ancillary Services (FCAS). Cost for this market are recovered under a mechanism known as ‘causer pays’, whereby a grid-connected solar farm is liable for the part of costs according to its estimated contribution to the need for regulating the grid frequency. However, although it is widely recognised that the quality of power forecasts of renewable generators relates to the need (hence the associated costs) for frequency regulation to some extent, a quantitative model of the relationship remains unavailable.
In this study, we use high-temporal-resolution generation and forecast data published by the AEMO to reveal the functional relationship between causer-pay contribution factors which are proportional to actual payments assigned to individual solar farms and the quality of solar power forecasts issued by the Australian Solar Energy Forecasting System (ASEFS). We found that the contribution factors are largely due to the coincidence of a positive forecasting bias and a low system frequency. We then manage to effectively model the contribution factor of a solar farm using information only for that solar farm.
Keywords: Solar forecasting, frequency control ancillary services, causer pays, regulation service, mean absolute error
23rd International Congress on Modelling and Simulation, Canberra, ACT, Australia, 1 to 6 December 2019 mssanz.org.au/modsim2019
Huang and West, Improving solar power forecasting to reduce regulation FCAS causer pay in the NEM
NOMENCLATURE
Contribution Factor (CF) The proportion of the regulating FCAS costs spent for the whole
NEM over a 28-day period a generation or load unit is liable for. It’s scaled up to per 10,000 (‱) because of its small amount.
Relative CF (rCF), MW-1 CF normalized by the capacity of a solar farm. Frequency Indicator (FI), MW The power determined by AEMO which is required to adjust
system frequency back to 50 Hz for an instant. It’s positive for a regulating frequency raise service and negative for a regulating lower service.
Frequency Deviation (FD), Hz Frequency minus 50 Hz. Generation Deviation (GD), MW Actual generation minus a forecast value. Relative GD (rGD) GD normalized by the capacity of a solar farm. Performance Measure (PM), MW2 Generation deviation weighted by FI. Relative PM (rPM), MW PM normalized by the capacity of a solar farm. Mean Absolute Error (MAE), MW A standard error metric of forecasting. Relative MAE (rMAE) MAE normalized by the capacity of a solar farm. Overforecasted MAE (MAEO), MW Mean Absolute Error of the over-forecasted periods Relative MAEO (rMAEO) MAEO normalized by the capacity of a solar farm. Underforecasted MAE (MAEU), MW Mean Absolute Error of the under-forecasted periods
It follows: MAE = MAEO + MAEU Relative MAEU MAEU normalized by the capacity of a solar farm.
1. INTRODUCTION
Under the National Electricity Rules, the Australian Electricity Market Operator (AEMO) is required to maintain the system frequency of the National Energy Market (NEM) within the normal operating band ranging from 49.85 Hz to 50.15 Hz. This is achieved through the procurement of the Frequency Control Ancillary Services (FCAS). FCAS can be generally divided into two categories, i.e., contingency and regulation (AEMO, 2015a; Riesz et al., 2015). Operating within different responding timeframes, contingency frequency control deals with the generation-load imbalance due to major contingency events such as the loss of significant generating or load units and breakdown of major transmission infrastructure. On the other side, regulation frequency control intends to constantly correct the generation-load imbalance mainly due to the relatively minor deviations in forecasting individual generators and loads.
One factor which directly affects regulation FCAS is the integration of variable renewable energy generation such as wind and solar power into the NEM. Currently, the AEMO centrally and operationally forecasts the power generation of utility-scale (i.e., >30MWp) wind and solar photovoltaic (PV) farms using the Australian Wind Energy Forecasting System (AWEFS) and the Australian Solar Energy Forecasting System (ASEFS). However, in observation of the rapid growth of wind and solar energy intake in Australia and thus the increasing importance of wind and solar forecasting techniques, the AEMO is seeking to improve short-term wind and solar power forecasting through research initiatives funded by the Australian Renewable Energy Agency (ARENA). According to the Clean Energy Council (2019), the penetration of wind and solar PV combined has increased steadily from 9.6% in 2017 to 12.3% in 2018 across the country. And there are new wind and solar farms already under construction or financially committed with capacity totalling more than 10 GWp including the 1.5GWp Harlin Solar Farm.
The AEMO recovers the FCAS costs through a “causer pays” mechanism (AEMO, 2018b). What this implies for regulation FCAS is that the payments are assigned to all participating generators and customers in the NEM based on their corresponding forecasting errors in generation and energy consumption which contribute to the need for regulation FCAS in the first place.
In principle, errors on the forecasts of a utility-scale solar farm can both contribute to (e.g. overforecasting while the frequency is lower than 50 Hz, or vice versa) or mitigate (e.g. underforecasting while the frequency is lower than 50 Hz, or vice versa) this need. As such, if the magnitude of forecast errors in a given period are symmetrically distributed with respect to system frequency, the resulting regulation FCAS payments for the solar farm should be minimal as the mitigation component and the contribution component should be able to more or less cancel each other. However, in practice the forecasts of solar farms are made without the knowledge of system frequency. It is then one of the major goals of the ARENA research initiative to improve
583
Huang and West, Improving solar power forecasting to reduce regulation FCAS causer pay in the NEM
the accuracy of short-term solar power forecasting, thereby reducing the regulation FCAS payments for utility-scale solar farms in the NEM. In this study, we seek to quantify the relationship between the quality of solar power forecasts by the ASEFS and the resulting regulation FCAS payments under the current cost recovery mechanism using the online high-frequency data published by AEMO.
2. BACKGROUND
2.1. Historical trend
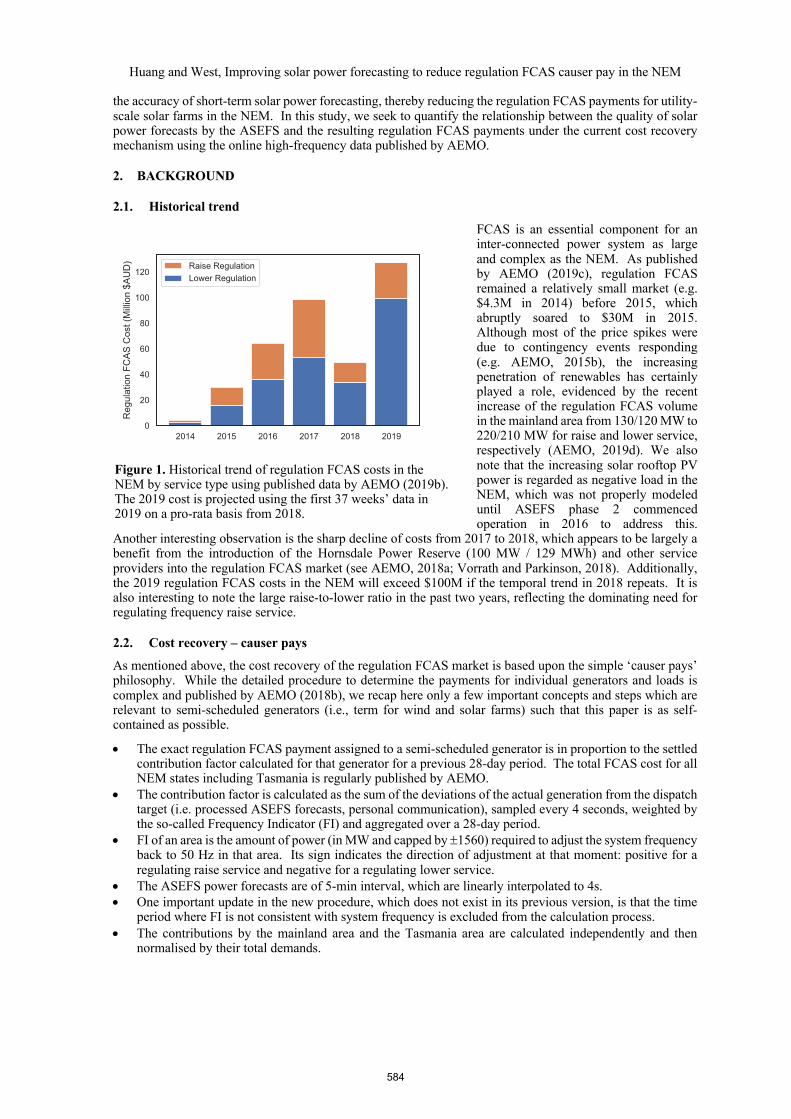
FCAS is an essential component for an inter-connected power system as large and complex as the NEM. As published by AEMO (2019c), regulation FCAS remained a relatively small market (e.g. $4.3M in 2014) before 2015, which abruptly soared to $30M in 2015. Although most of the price spikes were due to contingency events responding (e.g. AEMO, 2015b), the increasing penetration of renewables has certainly played a role, evidenced by the recent increase of the regulation FCAS volume in the mainland area from 130/120 MW to 220/210 MW for raise and lower service, respectively (AEMO, 2019d). We also note that the increasing solar rooftop PV power is regarded as negative load in the NEM, which was not properly modeled until ASEFS phase 2 commenced operation in 2016 to address this.
Another interesting observation is the sharp decline of costs from 2017 to 2018, which appears to be largely a benefit from the introduction of the Hornsdale Power Reserve (100 MW / 129 MWh) and other service providers into the regulation FCAS market (see AEMO, 2018a; Vorrath and Parkinson, 2018). Additionally, the 2019 regulation FCAS costs in the NEM will exceed $100M if the temporal trend in 2018 repeats. It is also interesting to note the large raise-to-lower ratio in the past two years, reflecting the dominating need for regulating frequency raise service.
2.2. Cost recovery – causer pays
As mentioned above, the cost recovery of the regulation FCAS market is based upon the simple ‘causer pays’ philosophy. While the detailed procedure to determine the payments for individual generators and loads is complex and published by AEMO (2018b), we recap here only a few important concepts and steps which are relevant to semi-scheduled generators (i.e., term for wind and solar farms) such that this paper is as self-contained as possible.
• The exact regulation FCAS payment assigned to a semi-scheduled generator is in proportion to the settled contribution factor calculated for that generator for a previous 28-day period. The total FCAS cost for all NEM states including Tasmania is regularly published by AEMO.
• The contribution factor is calculated as the sum of the deviations of the actual generation from the dispatch target (i.e. processed ASEFS forecasts, personal communication), sampled every 4 seconds, weighted by the so-called Frequency Indicator (FI) and aggregated over a 28-day period.
• FI of an area is the amount of power (in MW and capped by ±1560) required to adjust the system frequency back to 50 Hz in that area. Its sign indicates the direction of adjustment at that moment: positive for a regulating raise service and negative for a regulating lower service.
• The ASEFS power forecasts are of 5-min interval, which are linearly interpolated to 4s. • One important update in the new procedure, which does not exist in its previous version, is that the time
period where FI is not consistent with system frequency is excluded from the calculation process. • The contributions by the mainland area and the Tasmania area are calculated independently and then
normalised by their total demands.
Figure 1. Historical trend of regulation FCAS costs in the NEM by service type using published data by AEMO (2019b). The 2019 cost is projected using the first 37 weeks’ data in 2019 on a pro-rata basis from 2018.
584
Huang and West, Improving solar power forecasting to reduce regulation FCAS causer pay in the NEM
The original data for calculating the contribution factors are of 4s interval and only accessible to market participants lively via AEMO’s Market Management System (MMS). However, they are also published on AEMO’s data website with only two days’ delay (AEMO, 2019b).
2.3. Sample solar farms
We select 12 solar farms diversified by their location and capacity to model their respective contribution factors. Instead of using the official number, the nameplate capacity is determined as the 99 percentile of the actual generation because that a solar farm may be running only in its partial capacity due to practical reasons such as maintenance or electrical faults. We used the settlement factors issued by AEMO on 28/06/2019 which are based on 4s data sampled from 26/05/2019 to 23/06/2019 (AEMO, 2019a). The details of the selected solar farms are tableted as follows.
3. RESULTS
3.1. Preprocessing and quadrant analysis
Firstly, the night period where there is obviously no solar power generation, and thus zero deviation from forecasts, is excluded. In addition, as mentioned above, a new step of the current procedure for determining contribution factors of regulation FCAS is to exclude the period where FIs do not match actual errors of system
Table 1. The details of the 12 selected solar farms. The contribution factor is normalised to per 10,000. Name State Elem # Capacity
Whitsunday QLD 345 46 103 Tailem Bend SA 377 95 85
Figure 2. (left) Contour plot of mainland frequency deviation vs. mainland frequency indicator. The relative occurrence share of the four quadrants are (0.22, 0.24, 0.04, 0.50), respectively; (right) Contour plot of relative generation deviation vs. mainland frequency indicator for Clare Solar Farm from 26/05/2019 to 23/06/2019. The relative occurrence share of the four quadrants are (0.2, 0.1, 0.2, 0.5) , respectively. However, their relative contribution to the overall 4s performance measure are (-0.13, 0.06, -0.16, 1.23), respectively. Note that the difference in the distributions of mainland frequency indicator between the left plot and the right plot is caused by the exclusion of data from the 1st and 3rd quadrants of the left plot in calculating performance measure.
585
Huang and West, Improving solar power forecasting to reduce regulation FCAS causer pay in the NEM
frequency as well. The background and logic for this decision is also published by AEMO (AEMO, 2018c). As detailed in the procedure, this happens because of a number of reasons, including the necessary smoothing of sharp frequency deviations and the correction of accumulated time error. For the 28-day period we focus on in this study, there is only a moderate negative correlation between FI and the mainland frequency deviation from the nominal 50 Hz (Figure 2). About a half of time the need for regulating raise service (i.e. positive FIs) resonates with a low frequency. In implementing this step, 26% of daytime data is excluded.
The remaining data is used to calculate 4s performance measure, which is generation deviation (i.e., actual generation minus forecast) weighted by frequency indicator. Using Clare Solar Farm as an example, it can be seen from Figure 2 that the fourth quadrant contributes to the overall performance measure predominantly (123%), which indicates the importance and high probability of the co-occurrence of overforecasting and the need for regulating raise service. Theoretically, if the generation deviation is symmetrically distributed with respect to FI (e.g. gaussian), the overall performance measure should be minimal. However, the coincidence of overforecasting and low system frequency results in a high contribution factor for Clare solar farm. The quadrant analysis of other solar farms is similar to Clare. Given that the required volume of the mainland regulation FCAS is relatively small (220 MW for raise and 210 MW for lower as in June, see AEMO, 2019d), the systematic positive bias of ASEFS forecasts does have a significant impact on the deviations of system frequency.
3.2. Modelling CF
To obtain CFs of individual generators and loads for an area, their PMs need to be normalized by the sum of all generators and loads in that area (i.e., scheduled, non-scheduled, semi-scheduled and non-metered). And then, the area CFs are weighted by the load of the corresponding areas and normalized again to form the final or global CFs such that the final CFs of all generators and loads across the NEM sum up to 1. As such, the determination of CF for any generator or load involves scanning all NEM generators and loads. It is practically useful for solar farms and energy analysts to be able to simplify and model the process of calculating CF. This model is made possible by the statistical robustness and the size of the NEM. Although it is unrealistic to autoregressively predict CFs of individual solar farms without detailed information like actual generation and forecasts, we attempt to empirically model CF (and thus regulation FCAS payments) of a solar farm using information only from that solar farm such as PM and generic forecasting metrics.
Figure 3. Contribution Factor (CF) vs. Mainland Performance Measure (PM) aggregated over 28 days for the mainland and normalized by solar farm capacity. The addition of PM for Tasmania has almost no change in the performance of the model.
Figure 4. (left) Model of CF using only MAE; (right) Model of CF using the overforecasted component (MAEO) and the underforecasted component (MAEU) of MAE. Both models are normalized by the capacity of solar farms.
586
Huang and West, Improving solar power forecasting to reduce regulation FCAS causer pay in the NEM
The closest predictor to CF would be the 28-day aggregated PM. Although PM for both the mainland area and the Tasmania area are required to calculate CF. However, because of the correlation between FI of the two areas and the small portion of load in Tasmania compared to the mainland, there is an almost perfect linear relationship between CF and mainland PM (Figure 3), which are normalized by the capacity of solar farms. This model requires 4s data of generation, forecasts, system frequency and FI for the mainland area.
Furthermore, in absence of the 4s data, it would be desired to model CF with simpler and more accessible predictors. Hence, we build a model of CF with MAE, which is a common error metric for assessing the performance of solar power forecasting whilst noting that its suitability for future scenarios needs to be further studied (cf. Discussion). As shown in Figure 4, there is a strong correlation between CF and MAE. However, the performance of this model is largely improved when both its overforecasted (MAEO) and underforecasted (MAEU) components are known with an increased R2 from 0.80 to 0.96. As illustrated in Section 3.1, this is because the ASEFS forecasts of solar power (i.e. AEMO dispatch target) are systematically positively biased. And consequently, the overforecasts contribute to and the underforecasts mitigate the need for regulating raise service.
4. DISCUSSION
We are aware of several limitations of this study subject to data availability and time constraint.
• The AEMO procedure is not strictly followed in calculating the PM aggregate. For example, the occurrence of abnormal frequency island is not checked, which is supposed to be excluded. AEMO also publishes exclusion periods during the calculation of CF in addition to mismatching FI values, which are not accounted for in this study. This may be a reason for the imperfection of the model illustrated in Figure 3.
• Only one 28-day period is examined. With the current procedure made effective only since 12/2018, there is not much data available. Nevertheless, it would be interesting to assess the robustness of the models proposed in this study because the model parameters are subject to seasonal trends of system frequency, performance of solar power forecasting and increasing penetration of variable renewable energy generation, etc.
• rCF has a clear geographic pattern, which appears highest for solar farms in QLD and lowest in NSW. Since all selected solar farms are in the mainland area (thus sharing the same FIs), this is most likely caused by the forecasting performance of ASEFS in different climates. The forecasts of solar power are generally more accurate in mid-latitude inland areas which favour clear-sky weather than in tropical and coastal areas which tend to have more clouds.
• We haven’t discussed the consequences of a portfolio of semi-scheduled generation units (i.e., combining multiple solar or wind farms owned by one company). In principle, it is possible for one generation unit to mitigate and another one to contribute to the need for regulating service. Therefore, when combined as a single portfolio, it generally reduces the overall payments because the unit cost of FCAS is generally higher than that sold in the NEM to balance demand. However, all 12 solar farms investigated in this study contribute to the need for regulating service.
5. CONCLUSION
In response to more variable and renewable energy generation entering the NEM since 2015, the FCAS market is undergoing dramatic changes. In particular, the market of regulating FCAS services may exceed $100M in 2019 with a heavy and constant need for raising system frequency. It is under this background that the AEMO has initiated research efforts supported by the ARENA to improve short-term forecasting of utility-scale wind and solar power generation. Under the recently updated ‘causer pays’ rules, we have investigated regulating FCAS payments in the form of normalised contribution factors of 12 solar farms spanning the eastern mainland states. We have constructed empirical models of various complexity to effectively link contribution factors to ASEFS-issued solar power forecasts and mainland system frequency. Our main conclusions are as follows.
• Rather than randomly contributing to the need for regulating FCAS, the ASEFS-issued solar power forecasts suffer from a positive bias, which clashes with a high probability of low system frequency (and thus the need for regulating raise service). This can be largely alleviated by bias correction and improving the accuracy of solar power forecasting.
• The new step introduced in the newly published procedure to remove mismatching FIs eliminates about a quarter of daytime period, which should have caused significant changes in determining contribution factors for individual solar farms.
• The contribution factor of a solar farm can be effectively modelled using information only from that solar farm. With 4s solar power generation and forecasts available, the contribution factor can be estimated fairly accurately. The contribution factor is positively correlated to the MAE of solar power forecasting.
587
Huang and West, Improving solar power forecasting to reduce regulation FCAS causer pay in the NEM
However, it is advised to separate MAE into an overforecasted component and an underforecasted component to achieve an acceptable accuracy for modelling the contribution factor. Given the insights revealed above, longer-term trends need to be investigated to assure the robustness of these models.
ACKNOWLEDGMENTS
This work is funded by the Australian Renewable Energy Agency under the project ‘Solar Power Ensemble Forecaster’. The authors are grateful to the teams of System Performance and Commercial and Market Insights at AEMO for providing data and feedbacks, in particular to Akeelesh Kustrutsing, Shantha Ranatunga and Jonathan Myrtle.
REFERENCES
AEMO (2015a) Guide To Ancillary Services In the National Electricity Market. Available at: https://www.aemo.com.au/-/media/Files/PDF/Guide-to-Ancillary-Services-in-the-National-Electricity-Market.pdf.
AEMO (2015b) NEM – MARKET EVENT REPORT – HIGH FCAS PRICES IN SOUTH AUSTRALIA. AEMO (2018a) Quarterly Energy Dynamics Q1 2018. Available at: https://www.aemo.com.au/-
AEMO (2019a) ANCILLARY SERVICES CAUSER PAYS CONTRIBUTION FACTORS. AEMO (2019b) Ancillary Services Market Causer Pays Data – Australian Energy Market Operator. Available
at: https://www.aemo.com.au/Electricity/National-Electricity-Market-NEM/Data/Ancillary-Services/Ancillary-Services-Market-Causer-Pays-Data (Accessed: 27 July 2019).
AEMO (2019c) ANCILLARY SERVICES PAYMENTS AND RECOVERY. Available at: https://www.aemo.com.au/Electricity/National-Electricity-Market-NEM/Data/Ancillary-Services/Ancillary-Services-Payments-and-Recovery.
AEMO (2019d) Regulation FCAS changes– June update. Available at: https://www.aemo.com.au/-/media/Files/Electricity/NEM/Security_and_Reliability/Ancillary_Services/Frequency-and-time-error-reports/Regulation-FCAS-changes_June-update.pdf.
Clean Energy Council (2019) Clean Energy Australia Report 2019. Available at: https://assets.cleanenergycouncil.org.au/documents/resources/reports/clean-energy-australia/clean-energy-australia-report-2019.pdf.
Riesz, J., Gilmore, J. and MacGill, I. (2015) ‘Frequency control ancillary service market design: Insights from the australian national electricity market’, Electricity Journal, 28(3), pp. 86–99. doi: 10.1016/j.tej.2015.03.006.
Vorrath, S. and Parkinson, G. (2018) The stunning numbers behind success of Tesla big battery, Renew Economy. Available at: https://reneweconomy.com.au/the-stunning-numbers-behind-success-of-tesla-big-battery-63917/.