Page 1
Duy Anh Trinh
Improving Supply Chain Manage-ment at Unilever Vietnam
Metropolia University of Applied Sciences
Bachelor of Business Administration
International Business and Logistics
Thesis
24.9.2018
Page 2
Abstract
Author(s) Title
Duy Anh Trinh Improving Supply Chain Management at Unilever Vietnam
Number of Pages Date
46 pages + 1 appendix 24 September 2018
Degree Bachelor of Business Administration
Degree Programme International Business and Logistics
Specialisation option International Business and Logistics
Instructor(s) Kaija Haapasalo, Senior Lecturer
Vietnamese FMCG market is getting increasingly volatile because of the rapid economic
development of Vietnam. Unilever Vietnam therefore needs to improve its supply chain
operations to reduce the uncertainty of demand.
The objectives of this research are to review the current supply chain operations at Unilever
Vietnam South and to give the company development suggestions based on the analysis of
the current operations.
I acquired primary data from semi-structured interview with the planning manager at Unilever
Vietnam South along with direct observations from Unilever Vietnam’s planning department
where actual planning work happens. I researched relevant literatures to acquire secondary
data, which is used to formulate the basics of the thesis reasoning.
I reviewed supply chain operations in literature to formulate the theoretical background for
this thesis. I explained the supply chain management in Unilever then introduced real-life
business cases about supply chain operations I observed during my internship at the
company. I then analysed the cases to find short-comings and reviewed literature to find
development opportunities.
The implication of this thesis is that Unilever can implement RFID technology and vendor-
managed inventory initiative to improve found short-comings, however, more detailed
research and analysis with quantifiable data is needed to reach the ultimate conclusion.
Keywords RFID, vendor-managed inventory, supply chain, consumer goods
Page 3
1
Contents
Abstract
List of tables and figures
1 Introduction 3
1.1 Unilever Vietnam 4
1.2 Objective and scope 6
1.3 Data sources and methodology 7
1.4 Limitations 8
2 The current state of fast moving consumer goods market in Vietnam 8
3 Supply chain operations in general 13
3.1 Plan 14
3.2 Source 19
3.3 Make 20
3.4 Delivery 21
4 Developing supply chain operations 22
4.1 Vendor-managed inventory 22
4.2 Radio Frequency Identification 24
5 Supply chain operations at Unilever Vietnam 28
5.1 Overview of supply chain operations at Unilever Vietnam 28
5.2 Real-life business cases at Unilever Vietnam 33
6 Analyses of information collected 37
7 Conclusions and recommendations 39
Appendix 1. Interview questions
Page 4
2
List of figures and tables
Figure 1 Unilever Vietnam's categories (Unilever Vietnam’s internal training materials,
2017) ............................................................................................................................ 5
Figure 2. Unilever Vietnam's country facilities (Vietnamese Central Institute for
Economic Management, 2009) ..................................................................................... 6
Figure 3. FMCG e-commerce in 4 big cities in Vietnam (Kantar World, 2017) ............... 9
Figure 4. Growth rate of six main FMCG categories in Vietnam (Nielsen, 2017) ........... 9
Figure 5 Urban market growth compared to rural market (Nielsen, 2017) ................... 10
Figure 6. A typical family-owned miscellaneous store (Cafebiz, 2017) ........................ 12
Figure 7. A simplified supply chain (Grant, 2012) ........................................................ 14
Figure 8 Delay in inputs compared to actual requirements (Christopher, 2005) .......... 15
Figure 9. Inventory lumps must be built across the supply chain to handle risks
(Tradegeko, 2017) ...................................................................................................... 16
Figure 10 Independent decision making versus coordinated decision making
(Bookbinder, 2010). .................................................................................................... 23
Figure 11. Components in a RFID system (Sardroud, 2012) ....................................... 26
Figure 12. Unilever Vietnam's Supply Chain structures (Unilever’s internal training
materials, 2017) .......................................................................................................... 29
Figure 13. Unilever Vietnam's Planning function (Unilever’s internal training materials,
2017) .......................................................................................................................... 30
Figure 14 Unilever Vietnam's Supply Management process (Unilever’s internal training
materials, 2017) .......................................................................................................... 31
Figure 15 Unilever Vietnam's Inbound Logistics process (Unilever’s internal training
materials, 2017) .......................................................................................................... 32
Figure 16. Transportation network for OMO’s packaging materials (Unilever’s Planning
department, 2017) ...................................................................................................... 34
Figure 17. The relationship between UVN’s plants and packaging suppliers (Unilever’s
Planning department, 2017) ........................................................................................ 35
Page 5
3
1 Introduction
Vietnam has seen remarkable development during the past 30 years, transforming the
country from one of the poorest to a middle-income nation. In 2017, Vietnamese
economic performance has been outstanding, recording a GPD growth of 6.8 percent,
the fastest expansion from the last 10 years. Growth in the medium term is expected to
be robust, stabilizing around 6.5 percent with potential to surprise. Vietnam has a huge
population of 94,5 million with an emerging middle class accounted for 13 percent of the
population, but will increase to 26 percent by 2026 (World Bank, 2017). Therefore, there
is an expected increase in spending from Vietnamese consumers in the upcoming years,
who are now living healthier, more educated and wealthier. Fast moving consumer goods
(FMCG) is one of the sectors which benefit a lot from wealthier customers, as
Vietnamese not only consume more, but they also pay more attention to higher quality
products as well as brand reputation. Hence, there is a big potential waiting for FMCG
businesses to exploit (Brands Vietnam, 2017).
However, going along with better opportunity, there are also difficulties. Leading FMCG
companies in Vietnam have majority of their presence in urban market, where the
demand growth is slowing down due to the market reaching its saturation. On the other
hand, smaller companies, who were forced to develop their businesses in rural area, are
now in a better position due to a surge in demand growth on this market. There is a new
waves of modern distribution channels which are gradually replacing traditional
distribution channels, forcing FMCG companies to adapt. Higher demand also means
that the results of marketing campaigns are harder to predict. In Unilever Vietnam,
marketing campaigns have sometimes prove to be too successful, which has created a
surge in demand (Brands Vietnam, 2017).
I was working at Unilever Vietnam as an intern from February to August 2017. During
my time as a supply planner at UVN’s Cu Chi factory, I have the opportunity to observe
UVN’s supply chain operations. I have gotten interested in improving supply chain
management at UVN because I have studied the many supply chain management tools
at Metropolia so I was very eager to apply them.
All these factors require Unilever Vietnam to improve their supply chain in order to
capture as much value as possible from the upcoming opportunity. Therefore, each
components of the supply chain needs to be dissect and analyse in order to clarify the
Page 6
4
current situation of the supply chain operations in Vietnam and provide development
suggestions for further optimization. Information from literature therefore needs to be
collected and analysed in order to find optimization solutions and propose how to take
advantage of the opportunity at hand.
1.1 Unilever Vietnam
Unilever is an Anglo-Dutch consumer goods multinational company, which has
headquarters in the Netherlands and United Kingdom. Its product portfolio includes
homecare, personal care, food and beverage. Founded in 1930 by the merger of
Margarine Unie and Lever Brothers, Unilever is now a top contender in consumer goods
market, employing 169,000 workers and earning 53.7 billion Euro in revenue worldwide
in 2017 (Unilever Annual Result, 2017). As a transnational company, Unilever
emphasizes on expanding its business globally by capturing regional markets. The
founding of Unilever Vietnam in 1995 is one of said strategic investment (Vietnamese
Central Institute for Economic Management, 2009).
In 1995, Unilever and Vietnam National Chemical Corporation formed a joint venture to
create Unilever Vietnam Joint Venture Co., with Unilever represented 66.6% of the
shares, while Vietnam National Chemical Corporation represented 33.3%. The finance
from this joint venture was expended to rent 2 detergent factories in the North and South
of Vietnam, and a greenfield project in Cu Chi, South of Vietnam. The project includes
construction of 4 plants, which are ice-cream plant, food plant, personal care plant and
homecare plant; each plant has specialised facilities of factory, warehouse and office.
To penetrate deeper into Vietnam’s consumer goods market, Unilever acquired food and
beverage producer Best foods Vietnam and toothpaste producer LD Elisa P/S
(Vietnamese Central Institute for Economic Management, 2009). In 2009, Unilever
bought 33.3% ownership from Vietnam National Chemical Corporation, making Unilever
Vietnam Joint Venture Co. 100% foreign-owned, and renaming the company to Unilever
Vietnam International Co. Ltd (Unilever’s press release, 2009).
Unilever Vietnam operates within four categories in Vietnamese market: Home Care,
Personal Care, Oral and Food. Home Care is further divided into fabric materials
cleaning, general household cleaning, dishwashing and fabric conditioning. Personal
Care is divided into products that specially care for skin, products for hair solution, and
products which help cleaning the skin. For Food category, there are tea, ice-cream, and
Page 7
5
products that add more flavours into cooking. In Oral category there is only toothpaste
for now. Unilever Vietnam produces and distributes many well know brands in Vietnam,
for instance Knorr, Wall’s, Lifebouy, Dove, etc. The division of different categories and
products is illustrated in Figure 1.
Figure 1 Unilever Vietnam's categories (Unilever Vietnam’s internal training materials, 2017)
UVN operates five manufacturing facilities in the North and South of Vietnam, two of
each are greenfield projects, two are rented and one is acquired from a local toothpaste
manufacturer. UVN also rented three distribution centers and hired personnel to manage
them from Linfox – an Australian company that specializes in warehouse management
and logistics. They are located in Bac Ninh, Da Nang and Ho Chi Minh City, as can be
seen in Figure 2 (Vietnamese Central Institute for Economic Management, 2009).
UVN
Personal Care
Skincare Vaseline
Haircare Dove
Skincleasing Lifebouy
Home Care
Fabric cleaning
OMO
Household cleaning
Cif
Dishwashing Sunlight
Fabric conditioning
Comfort
Food
Food solution
Knorr
Tea Lipton
Ice-cream Wall's
Oral Toothpaste P/S*
Page 8
6
Figure 2. Unilever Vietnam's country facilities (Vietnamese Central Institute for Economic Management, 2009)
1.2 Objective and scope
This thesis uses Unilever Vietnam as the object for case study. Therefore, the aim of this
thesis is to (1) examine the existing state of supply chain operations at Unilever Vietnam
and then to (2) suggest them with improvements in order to optimize supply chain
operations. Although Unilever Vietnam conducts business and supply consumer goods
all over Vietnam, however the scope of this thesis focuses mainly on the supply chain
operations at the Cu Chi factory, south of Vietnam. The data for research and analysis
was compiled with the assist from Mr Thang Tran, Unilever Vietnam South Planning
manager.
In particular, this thesis is trying to look for optimizing opportunities from supply
operations with the help of literature review. By comparing suggestions from literature to
Page 9
7
Unilever Vietnam’s current operations, developments can be spotted and used to
improve the company’s supply chain.
To do so, this thesis will answer the following research questions:
1. What is the current state of FMCG market in Vietnam and what opportunity is
presented?
2. How do Unilever Vietnam supply chain operations function in Vietnam?
3. What are the short-comings or development needs in supply chain operations in
Vietnam?
4. How could the supply chain operations at Unilever Vietnam be optimized and
developed?
1.3 Data sources and methodology
This thesis is formulated using two data sources: primary data and secondary data.
According to Ithaca College Library, primary data gives eyewitness and direct evidence
about an event, person or object (Ithaca College Library, 2017). Primary data is collected
by the researchers themselves by using interviews, surveys and direct observations
(Institute for Work and Health, 2017). On the other hand, secondary data is obtained
through the process of analysing and interpreting primary data (Ithaca College Library,
2017). Unlike primary data, secondary data is usually readily available through
newspaper, magazines, reviews or scholarly journals which discuss and analyse
someone else’s original researches.
The author worked as an intern from January to August 2017 in the company’s Supply
Planning team. This position involved working closely with many teams within the supply
chain and the planning managers of the southern region. Qualitative research methods
were applied in order to gather necessary information to complete the job and to create
development suggestions for the company. Therefore, information collected were used
to understand the supply chain operations and for optimization suggestions. Most of the
information was gathered by conducting semi-structured interview with Mr Thang Tran
as well as from discussions with peer workers. Author’s own observation and knowing
about the company’s ERP system as well as internal training materials was also utilized.
Page 10
8
1.4 Limitations
This thesis uses a lot of data from my own observation therefore the thesis is not very
objective. Moreover, this thesis uses only one interview with one manager and the data
is gathered mostly from one factory only. Therefore the conclusions and analysis from
this thesis is applicable to Unilever Vietnam’s Cu Chi factory only, and there might be no
possibility for wider conclusions. This thesis also lacks quantifiable data to construct cost
effectiveness analysis for two of the solutions mentioned in this thesis. Even though the
results and suggestions might not be as accurate as possible, they deliver some
guidelines for better optimization and development at Unilever Vietnam
2 The current state of fast moving consumer goods market in Vietnam
Vietnam has a young population, with 70% out of 94,5 million Vietnamese are 15 to 64
years old. Around a third of the population is middle class with income increases by 8,8%
yearly. Along with the economy growing, Vietnamese living standard is improved. Viet-
namese spending habits have changed from being frugal to buying and experiencing a
lot more. Higher living standard also means Vietnamese, especially young Vietnamese,
are increasingly more aware of living healthily. Therefore, Vietnamese are more selective
and more willing to spend extra to buy products from recognizable FMCG brands. This
potentially could push FMCG producers to develop premium brands to improve their
margin (Brands Vietnam, 2017).
The rise of internet and smartphones have influenced greatly on how the consumers
interact with others and how they shop. Smartphone owners who access the internet
through their phones matter a lot to FMCG companies. Firstly, smartphone owners usu-
ally have higher household spending and represent majority of FMCG spending. Sec-
ondly, they offer companies new ways to approach them. Moreover, increasing internet
access and smartphones ownership is driving e-commerce. Vietnamese are getting in-
creasingly familiar with online shopping platforms, however their spending on FMCG
products is small. That also means that there is a huge potential for FMCG companies if
they can offer enough incentives and develop solid business plans to encourage online
shopping frequency, they will likely obtain a sustainable competitive advantage in the
Vietnamese market (Kantar World, 2017).
Page 11
9
Figure 3. FMCG e-commerce in 4 big cities in Vietnam (Kantar World, 2017)
With consumer demand rising, FMCG market is expected to grow. FMCG market is char-
acterized by fast turnover and high consuming rate, therefore the growth rate of the mar-
ket is always high (Brands Vietnam, 2017). Moreover, Vietnamese spending for FMCG
products is still low, hence the industry has great potential to develop further (Nielsen,
2017). The potential is proven by the high growth rate of various FMCG categories in
2017, as illustrated in Figure 4.
Figure 4. Growth rate of six main FMCG categories in Vietnam (Nielsen, 2017)
Page 12
10
In Vietnam, around a third of total population lives in urban area while the remaining two-
thirds live in rural area (General Statistics Office of Vietnam, 2017). In FMCG retail mar-
ket, sales in urban area recorded a growth of 5,1% in 2017. However, urban area market
is reaching close to saturation point, therefore, sales growth rate in this market is ex-
pected to slow down in the upcoming year. On the other hand, rural area market is show-
ing stronger growth rate of 6,5% in 2017, mostly thanks to growth in sales volume. Sales
in rural contributes around 57,5% of total sales of FMCG industry (Nielson, 2017). As
illustrated in Figure 5, even though there exists quite a few fluctuations quarter to quarter,
rural market still recorded better growth compares to urban market.
Figure 5 Urban market growth compared to rural market (Nielsen, 2017)
Living standards and way of life in rural area has got closer to urban area thanks to
urbanization, ease of access to internet and the development of smartphones. Moreover,
access to technology brings rural population closer to mass media and exposes them to
various forms of information. More surprisingly, urban population not only pursues better
quality of life but is also actively seeking and is willing to pay more for premium quality
products. Therefore, a big opportunity exists for FMCG producers to market their brands
Page 13
11
to rural area to capture maximum value from this highly promising market (Nielson,
2017).
In retail distribution channel, traditional channel represented by traditional markets and
miscellaneous stores still make up around 80% of total domestic trade (Brands Vietnam,
2017). Traditional market is a meeting place for various sellers and buyers. The meeting
place is designated to a fixed location, therefore, the name of the market usually carries
the name of the geographical location. Unlike modern markets and supermarkets, tradi-
tional markets are established by local governments to ensure that buyers can meet the
sellers. Therefore, as long as sellers register their businesses with the local govern-
ments, virtually anyone could build a stall in traditional markets (Tuan Ngo, 2015).
Miscellaneous stores are micro retail businesses, usually owned by a person or a family.
The stores are established on a very narrow ground, usually around 30m2 to 50m2 but
sell hundreds or even thousands of different types of good at the same time as seen in
Figure 7. Even though miscellaneous stores are tiny, they bring very stable income for
their owners (Vnexpress, 2015). According to a miscellaneous store owner, he spent
around 22 600 euros to open a store and made that amount of money back after two
years. Nowadays, his store still brings him around 375 euros a day (Vnexpress, 2015).
In 2017, there are 800 supermarkets, 150 shopping malls and 2 500 convenience stores
while there are 2,2 million miscellaneous stores in Vietnam (NDH, 2017).
Page 14
12
Figure 6. A typical family-owned miscellaneous store (Cafebiz, 2017)
Modern channel represented by supermarkets, convenience stores and minimarts
makes up around only 20% of total domestic trade. However in recent years, modern
channel growth rate is higher than traditional channel, mostly in urban area. One of the
reason is the continuous modernization of the younger generation, who are more willing
to experience (Brands Vietnam, 2017). Convenience stores supply products that are
‘convenient’ to consume immediately, for instance processed food, packaged food, soft
drinks, alcohols, cigarettes, pharmaceutical products or cosmetics, etc. The area of a
convenience store is usually around 50 to 200m2. Owners of the convenience stores are
independent investors or franchising from an already well-known convenience stores
chain (Vnuni, 2015).
Minimarts provides common food products such as meat, vegetables, fruits, milk etc…
alongside household necessities such as cleaning products, cooking products etc…Min-
imarts have the same operating model as supermarkets but on a way smaller scale.
Generally a minimart has the area of over under 200m2. Owners of minimarts are large
corporations who have already owned supermarkets and hypermarkets, or big food pro-
ducers. (Vnuni, 2015).
The shift from traditional channels to modern channels is giving Unilever opportunity for
collaboration. Traditional channels consist of mostly small and micro businesses with
Page 15
13
outdate technology. On the other hand, modern channels are owned by corporations,
who are more willing to invest in new technology. Therefore, Unilever has the opportunity
to develop partnership with new channels, hence reduces the uncertainty in Vietnamese
FMCG market.
Vietnamese FMCG market is dominated by a big four: Unilever, Masan, Nestle and P&G
(Son Hai, 2016). All four have their extensive distribution networks deep-rooted in six
major cities in Vietnam, namely Hanoi, Hochiminh, Hai Phong, Da Nang, Can Tho and
Nha Trang. All four also have developed well-known brand image of quality and excel-
lence in the eyes of Vietnamese. Right behind the big four are smaller companies who
focus mainly on a few product categories and have their operation in second-tier cities
and rural area (Brands Vietnam, 2017).
3 Supply chain operations in general
The concept of supply chain management contains logistics. Logistics is a planning
framework that seeks to coordinate the product flows and information flows to create a
single plan for a business. Logistics has played vital role throughout the history of man-
kind, notably in wars. Many wars have been decisively won or lost due to the sufficient
or lack of logistics capabilities and strengths. For examples, the defeat of the British army
in the America war largely pointed to logistics failure. Britain has not developed a suffi-
cient plan to supply 12,000 troops stationed in America, eventually leading to British army
downfall. Not until as early as 1915 that Arch Shaw has finally addressed the importance
of logistics in business (Christopher, 2004). Since then, logistics concept has been de-
veloped wider into supply chain management in the 1980s to address concerns about
an increasingly global economy (Grant, 2012). Supply chain management seeks to link
and coordinate the processes of entities who operate in the same value chain, such as
suppliers, customers and the company itself. The goal of supply chain management is
to deliver a ‘win-win’ outcome for every parties in the supply chain through building of
trust and recognition of each other (Christopher, 2004). Christopher (2004) has defined
supply chain management as following:
The management of upstream and downstream relationships with suppli-
ers and customers to deliver superior customer value at less cost to the
supply chain as a whole.
Page 16
14
A simplified supply chain generally consists of the focal firm, suppliers from upstream
and customers from downstream. Suppliers and customers are divided into tier depends
on how close they position on the supply chain relative to the focal firm. Depends on
which tier the suppliers and customers are on, firm can develop suitable supply chain
relationships (Grant, 2012). The simplified supply chain is shown in Figure 7.
Figure 7. A simplified supply chain (Grant, 2012)
A supply chain usually has four main processes: plan, source, make and deliver. These
four link coherently together to create a ‘chain’. This chain spans from suppliers’ supplier
to customers’ customer while aligning with the strategy, information and material flow of
a company. Supply Chain Operation Reference (SCOR) model, is an internationally ac-
cepted standard, which is developed and endorsed by the Supply Chain Council as the
guideline for supply chain management of all industries (Bauhof, 2004).
3.1 Plan
The Planning function in UVN’s Supply Chain is separated into two branches: Demand
Planning and Supply Planning (Unilever, 2017). Demand planning is the process of
determining, selecting and integrating the sources which create demand. Demand
planning aims to answer three questions (Tradegeko, 2017):
Page 17
15
1. What are the products that customers demand?
2. How many of those products are needed?
3. When do the customers need those products?
Demand planning is a necessary process for Unilever to be aware of the market demand
of goods and services. This process involves activities related to forecasting, firming
orders, undertaking orders, determining warehouse capacity etc. (Tuan Pham, 2014)
Inability to forecast the real demand of the market could potentially lead to the bullwhip
effect, which will incur great loss to the company. Bullwhip effect is the phenomenon of
increasing larger build-up of stocks from downstream of the supply chain to the upstream
when the customers make little movement in demand (Arkieva, 2017). Since in most
logistics systems there will be delay to an input or change to the system as seen in Figure
8, companies must try to protect themselves from stock-outs and missing customers’
orders by building up stocks. (Christopher, 2005).
Figure 8 Delay in inputs compared to actual requirements (Christopher, 2005)
Therefore, the bullwhip effect causes upstream companies to have more uncertainty
which results in lower forecasting accuracy, leading to building up expensive inventory
‘lumps’ as seen in Figure 9. That is why demand planning is important to Unilever, as it
allows the company to effectively optimize inventory, provides insight into upcoming cash
Page 18
16
flow and allows the company to know when to adjust staff and resources to keep the
operation running optimally during peak and valley times (Murphy & Wood, 2013).
Figure 9. Inventory lumps must be built across the supply chain to handle risks (Tradegeko, 2017)
According to Tuan Pham (2014), Demand Planning operations can be described as fol-
lows:
Demand planning aims to accomplish three main objectives:
1. Deploying the optimal plan while considering future demand.
2. Continuously updating the plan for future demand.
3. Avoiding to make unimportant updates for production planning and scheduling
through setting and managing demand priorities.
Demand planning has three main functions:
1. Defining the customers’ demand in the future by utilizing forecast techniques in
order to anticipate trends and changes or processing information that customers
supply to define demand.
2. Managing closely customers’ current demand through managing customers’
orders.
3. Providing customers with feedback regarding shipping date.
There are four requirements for demand planning:
1. Predictive: Demand planning must be able to estimate future orders to maintain
the balance between supply and demand.
Page 19
17
2. Informative: Demand planning must be able to take advantage of information
from customers and experience from management then forecast the quantity and
timing of future orders.
3. Flexible: Demand planning can allow production scheduler to make adjustment
when necessary in order to make better use of fixed assets and human
resources.
4. Prioritizing: The goal of demand planning is to cover all demand from customers.
However, when there is insufficient resources and materials to produce enough
products, demand planning must be able to allow management to make decision
of which orders must be fulfilled first, and which should wait.
Maintaining the balance between supply and demand has always been a dilemma for
manufacturers, because they have to meet customers’ demand while making sure that
the supply for this demand has to be within the limit of current resources and minimizing
the investment for such supply. Therefore, the relationship between supply and demand
is related to distributing production resources so that production process is optimized.
Hence, in order to solve this optimization problem there must be a planning process to
balance supply and demand (Ball & Seidman, 2011). Supply planning aims to fulfil future
demand in the best possible manner. The goal is to meet demand with supply in a way
that achieves financial and service objectives of the company (Mbaskool, 2017).
According to Tuan Pham (2014) supply planning includes three components:
1. Inventory management
2. Production planning
3. Distribution resource planning
Inventory management is an important factor determining the company’s revenue and
profit. In inventory-intensive sector, for instance fast moving consumer goods, a
company’s finished goods is the core of its business, therefore lack of inventory is
detrimental as it translates to losing customers (Investopedia, 2017). On the other hand,
the company must bear ordering costs and holding costs when keeping inventory.
According to Muller (2011) there are vital roles that inventory plays in the company’s
supply chain, such as following:
Page 20
18
• Protection against fluctuations: Company cannot always know what they need at
any given time while they still need to satisfy their customers or production
demand on time.
• Protection against unreliability of supply: When suppliers are unreliable or an item
is scarce and steady supply is uncertain, inventory provides additional buffer.
• Price protection: Buying quantities of inventory protects the company from
inflation and price increase.
There are a few reasons why inventory management is important:
• Minimizing capital investment in inventory.
• Keeping up service rate to satisfy customers’ demand
• Guaranteeing operation efficiency at different departments.
• Lowering cost per unit through bulk discount and less ordering costs.
• Shortening inventory turnover cycle.
• Building trust and rapport with customers through delivering products
continuously.
Production planning is the process of creating detailed optimizing schedules and plans
which use sufficient materials, staff and other resources in order to create finished goods
in specified time. Production planning serves as a guide for the company’s production
by establishing sequences which must be followed in order to achieve a given production
target so that customers’ demand is met on time (SME toolkit, 2017). It takes a long-term
view over production planning of what to produce, when to produce, how much to
produce etc. under predetermined limitations (Juneja, 2017).
According to Juneja (2017) production planning has two objectives:
1. Making sure the right quantity and quality of materials, staff, equipment and
machines is available at the time of production.
2. Making sure to optimize capacity utilization while aligning with future demand
forecasts as much as possible.
Production planning has four functions:
1. Delivering products timely and continuously
2. Informing suppliers in advance about the requirements of raw materials
3. Reducing tied capital in inventory
4. Reducing production cost by increasing efficiency (Juneja, 2017)
Page 21
19
Distribution resource planning (DRP II) is an extension of distribution requirements
planning (DRP I). DRP I is the process to determine which quantities of goods and
materials are needed at what time and at what location to satisfy anticipated demand.
DRP II is developed from DRP I, adding the planning of provision for non-inventory items
such as material handling equipment, trucks, labour and storage space. The information
about the requirements of materials and items is entered into DRP II. The process then
estimates and calculates the quantity, timing and location of input flows, then prepares
production schedules. The goal of DRP II is to minimize shortages while reduces costs
of ordering, transporting and holding of materials and items. It is a time-based process
that determines when inventory is likely depleted and have plan to replenish in order to
avoid shortages (Mba Skool, 2017).
According to Mba Skool (2017) there are five key limitations which determine how DRP
II works:
1. Forecast demands
2. Current inventory levels
3. Target safety stock
4. Acceptable replenishment batch
5. Replenishment lead time
3.2 Source
Source is the systematic business process that is associated with procuring raw materi-
als, subassemblies, products and services to satisfy planned or known demand. The
intention is to maintain a certain pre-determined level of inventory. (Supply Chain Coun-
cil, 2012). It includes the pre-production logistics activities, suppliers´ management and
pre-production inventory management. Source is responsible for the following (In-
vestopedia, 2017):
• Identifying, accessing, negotiating and procuring goods and services which are
crucial for the company’s operations under the oversight of management.
• Developing strategies in order to maintain relationships with suppliers, as well as
making sure that suppliers are accountable.
• Considering the application of supply and demand to make the optimal decision.
Page 22
20
According to Supply Chain Council (2012) source has five functions:
1. Scheduling product deliveries: scheduling and managing the deliveries of mate-
rials based on existing contracts or purchase orders. The aggregated require-
ments for materials are decided based on a detailed sourcing plan or product pull
signals.
2. Receiving product: The associated activities of receiving materials based on con-
tract requirements.
3. Verifying product: The process of accessing product compliance to requirements
and criteria.
4. Transferring product: The process and associated activities of moving the ac-
cepted product to the appropriate storage location within the supply chain. This
includes all actions of staging, transferring, repackaging and stocking product.
5. Authorizing supplier payment: The process of verifying suppliers’ payment infor-
mation, issuing payments to suppliers, collecting invoice and matching invoice.
3.3 Make
Make is the process which transforms raw materials and subassemblies into final product
(Tuan Pham, 2014). The process adds value into products through the activities of mix-
ing, forming, machining and chemical processes. Final products are intended to be
shipped immediately after manufacturing process or ‘off the shelf’, and can be done be-
fore receipt of customer order. Final products are manufactured based on a planned
schedule, which is based on sales forecast (Supply Chain Council, 2012).
According to Supply Chain Council (2012) make has seven functions:
1. Scheduling production activities: is the given plans for the production of specific
products, which are performed according to the planned availability of required
sourced materials. Scheduling depends on manufacturing sequence, factory lay-
out and standards for setup and run.
2. Issuing materials: is the selection and transferring of required sourced materials
from a storage location to a specific point of consumption. System transaction is
required in order to issue materials. Bill of Materials, routing information and pro-
duction instructions will decide which materials are issued to support the produc-
tion operations.
3. Producing and testing: are the value-adding activities which convert sourced ma-
terials from raw or semi-finished state to a state of completion. These products
Page 23
21
will be tested to make sure they are conformed to the pre-defined specifications
and requirements.
4. Packaging: is the activity of containerize completed products for stocking or trans-
porting to customers. Packaging provides important information about the prod-
ucts and makes them easy to identify, helps easing distribution process, markets
the products to end users and protects the products.
5. Staging: is the transferring of packaged products to a temporary holding location
while waiting to be transferred to a stocking location. Sometimes products are
shipped from staging location to customers’ site or distribution centers per orders.
6. Releasing product to deliver: are the activities which deal with post-production
documentation or certification required before delivering the finished products to
customers, for instance signing by a quality agency, creating certificate of analy-
sis, signing of regulatory organizations etc.
7. Waste disposal: is the collecting, managing and disposing of waste produced
during manufacturing and testing processes including scrap materials and non-
conforming products.
3.4 Delivery
Deliver process consists of order fulfilment activities which provide finished products to
meet planned or actual demand. Deliver typically involves transporting and warehousing
(Institutes of Logistics and Warehousing, 2018).
Transportation is the physical link between the company and the suppliers as well as the
customers. Transportation plays an important role in supply chain operations owing to
added value created by transportation through providing space and time benefits to the
company’s products. This role will be increasingly becoming more important as invest-
ment for transportation is only increasing gradually (Tuan Pham, 2014).
Warehousing refers to the activities involving storing products in a systematic and orderly
on a large scale. Warehousing holds and preserve products from the time of production
or purchasing and makes them available conveniently when required (Antonova, 2018).
According to Antonova (2018) warehousing has six functions:
1. Storage: is the basic function of warehouses. Goods are stored until the time of
consumption or delivery.
Page 24
22
2. Protection: Warehouses protect goods from loss or damage and provide goods
with different special arrangements depending on their nature.
3. Risk bearing: Warehouses take over the risks related to storage of goods. When
goods are passed over to warehouses, the responsibility for taking care of the
goods are passed on to warehouses. Since the goods must be return in good
condition, warehouses must take precautions to prevent any mishap.
4. Financing: When goods are in custody of warehouses, goods owner can raise
loans against warehouse receipts. In this way, warehouses act as a financial
source for businessmen to meet their business operations.
5. Processing: Some warehouses undertake processing activities to make certain
types of good consumable on behalf of the owners.
6. Grading and branding: Warehouses could perform grading and branding works
based on the requests of manufacturer, wholesaler or importer of the goods.
4 Developing supply chain operations
4.1 Vendor-managed inventory
Vendor-managed inventory (VMI) is a partnering initiative between suppliers or vendors
from upstream and consuming organization from downstream. In a VMI partnership, the
vendor makes the main replenishment decisions for the buyer. This means the vendor
is responsible for monitoring the level of inventory of buyer and decides on the quantity,
timing and shipping of resupply. In VMI initiative, buyer transfers the key decisions of
resupply to the vendor. In a close-knit relationship, buyer might transfer financial respon-
sibility for inventory and customer service goal to the vendor (Waller & Johnson, 1999).
When decisions are made independently by parties within the same supply chain, entities
from downstream might impose extra burdens on upstream entities thus incurring extra
costs. When each party make decision independently, buyer is likely to determine on a
resupply method that minimizes its operational costs. Since the quantity and timing of
the resupply neglects the vendor’s convenience, such method might not be preferred by
the vendor. Conversely, coordinated decision making reduces the need for inventory,
lowers the shipping cost and improves resources utilization (Bookbinder, 2010). The in-
dependent and coordinated decision making process are shown in Figure 10.
Page 25
23
Figure 10 Independent decision making versus coordinated decision making (Book-binder, 2010).
Demand volatility is the main issue for many supply chains. In retailing, sales fluctuation
is the key problem, resulting in forecast inaccuracy, lower sale revenues and customer
service. Many researches have all agreed that VMI initiative mitigates uncertainty of de-
mand (Bookbinder, 1999; Sari, 2007; Angulo, Nachtmann and Waller, 2004). Infrequent
large orders from buyers incur extra costs for vendors to have surplus capacity or extra
inventory. VMI alleviates the irregular production and allows smaller buffer of capacity
and inventory and greater forecast accuracy for vendors. (Bookbinder, 1999).
Successful implementation of VMI requires software systems, product identification and
tracking systems, and to a lesser extend communication technology. Software systems
are the most important because they facilitate the replenishment quantity and timing,
buffer level, transportation planning and inter facility transshipments. Bar coding is
needed so that deposits and withdrawals information can be captured at warehouses
and distribution centers. Electronic Data Interchange is a great enabler for VMI but is not
a requirement. Lesser electronic communication is sufficient, such as e-mail. (Book-
binder, 1999).
Page 26
24
According to Angulo, Nachtmann and Waller (2004), there are three primary require-
ments to successfully implement VMI. Firstly, vendor should verify the accuracy of the
information from buyer. It is widely known that retailers have numerous data errors even
with the support of technologies. These inaccuracies have the most impact on vendors,
therefore they need to actively check the accuracy of the information from buyers. Sec-
ondly, vendors need to use shared information in a timely manner. According to Angulo
(2004), information delay affects negatively to the performance of VMI initiative. Infor-
mation delay comes from information sharing interval and information analysis process
of suppliers. For instance, a retailer who updates the shared information to supplier once
every day has the maximum delay from information sharing interval of one day, while if
that retailer updates every hour, the delay is reduced to one hour. Once the supplier has
received the shared information, they have to analyze the information to make fulfillment
decisions, thus creates delay on supplier side.
Retailer cannot determine the delay by observing only when the shipment arrives be-
cause many shipments arrive based on fixed schedules. For example, if the schedule for
a shipment is Wednesday every week, but to deliver that shipment, supplier relies on
information from the previous Monday morning, then there is two days in delay. If for the
same schedule but the supplier relies on information from Wednesday morning, then
there is no delay. Thirdly, forecasts of fluctuating items should be shared first.
Even though VMI initiative has benefits, there are short-comings that require companies
to consider. Information sharing between entities of the same supply chain is beneficial,
however many are reluctant to adopt such method due to how one-sided the benefits are
to the vendors, not the retailers. Lack of trust between vendor and buyer might lead to
sharing outdated or inaccurate data. Sufficient investment in software systems is neces-
sary for the implementation of VMI, thus disparity in technology between vendor and
buyer also creates inaccurate data exchange.
4.2 Radio Frequency Identification
Supply chain management (SCM) is thought to be the pushing force behind the industry
nowadays due to various benefits that it provides, such as costs reduction, service im-
provement, revenues enhancement, and empowering both producers and customers.
However, the success of SCM cannot be made a reality if not for the components that
made SCM successful. One of these is barcode, which is a form of Automatic Identifica-
tion system. Auto-ID systems have become commonplace for security and control in
Page 27
25
industries which need to track products through the supply chain or in industries which
need to identify products at the point of sales (Agarwal, 2001).
Auto-ID systems share the following features (Agarwal, 2001):
1. There are benefits to accurately identify a product while it is moving through the
supply chain.
2. A label, tag or coding device is attached to the product so that it can be automat-
ically read to notify to the user what item is it, where it came from and to whom it
is going to.
3. A code-reading device that will read and validate the code, then converts the
content into meaningful information output. Examples of such device are
handheld barcode reader, optical character reader or radio frequency interroga-
tor.
4. The code-reading device transmits the information output to a data collection de-
vice such as networked PCs, computers or processors for storage, data commu-
nication or manipulation.
The most widely known Auto-ID system is probably barcode system, which was devel-
oped in the 1970s. Barcode system accounted for the largest share of worldwide auto-
ID system market. Even though users find auto-ID system to be complementary rather
than competitive, other auto-ID systems have gained much acceptance in fields where
they provide better solutions. Most particularly, RFID technologies have found greater
application in automatic identification field (Agarwal, 2001).
RFID is seen as a progressive mean of improving data handling process compares to
other technologies such as bar coding. RFID is very flexible and can satisfy a broad
range of applications, thanks to a wide collection of devices and associated systems.
Despite this diversity, the principles behind RFID are rather simple. The RFID tag usually
consists of a microchip which stores data and an antenna which is used communicate
via radio frequency. The tag could either be powered by a built-in battery or by the
interrogation signal from the tag reader. The tag reader usually consists of a radio fre-
quency component, a control unit and antenna to interrogate the tag for information store
in it. This information can be transmitted to a data processing electronic system through
a built-in interface attached along with the tag reader (Agarwal, 2001). The main compo-
nents of a RFID system is shown in Figure 11.
Page 28
26
Figure 11. Components in a RFID system (Sardroud, 2012)
By using radio frequencies, the tag reader can communicate with the tag at a large dis-
tance even in hostile environment condition or when is obscured from view. Moreover,
with radio frequencies, tag reader can form an interrogation zone within which the tag
could be read. For instance, a RFID system used for security could form a barrier around
the entry points to a secure area so that it can locate all tags which try to enter the area.
The size of the interrogation zone depends on the characteristics of the tag and tag
reader (Agarwal, 2001).
Bar code is a huge technological development success, as it is cheap, reliable, easy to
make and can be used by anyone. However, as supply chain management becomes
more sophisticated, a new and improved kind of tagging would be more desirable
(Agarwal, 2001). Some of the motives for this view are as bellow:
• Bar code can only identify products’ classes, while tag is capable of identify every
single individual item which is currently made and sold.
• Bar code needs to be read on line of sight, while tag can be read as long as it is
within the tag reader’s range. Hence, tag can be read in large quantity.
• Bar code is a lot less durable than tag.
• Once information has been printed on bar code, user cannot change that infor-
mation unless by reprinting. Tag has the capability of read and write.
• Bar code can contain a lot less information than tag.
By using tag instead of bar code, companies are able to monitor their products continu-
ously in real-time, from manufacture to point of consumption and disposal (Agarwal,
2001).
Page 29
27
The main objective of supply chain management is to guarantee delivery of products at
high quality, low costs, customized products and short lead-time. The attempt is to align
the objectives of all partners along the supply chain, control of the production process,
increase responsiveness and better understand customer demand. To do so, companies
need to have visible information flow along the supply chain of transaction and planning
processes. Moreover, companies need to be flexible enough to be able to adjust, rebuild
and re-optimize plans in real time to solve unexpected events taking place in the supply
chain. Therefore, to be able to achieve such effective management of the supply chain,
there must be consistent, timely and precise information which accompanies the activi-
ties of sorting, picking, storing and transporting of products (Agarwal, 2001).
There are three conditions to achieve real time visibility of information (Agarwal, 2011):
1. Ability to acquire data in real time
2. Conversion of such data into meaningful information
3. Instant access into such information
RFID tagging can provide an unmatched level of visibility within the supply chain by en-
abling continuous and accurate information in real time of products. Therefore, it can
help achieving goals such as improving efficient customer response or improving plan-
ning forecast accuracy (Agarwal, 2001).
Successful implementation of RFID needs technological requirements such as appropri-
ate hardware and software, testing and technical support. Firstly, selecting appropriate
hardware and software will reduce the chance of system interference and collision. Var-
ious RFID hardware and software are available for selection, but price does not always
equal quality. Companies should carefully consider their own usage purposes. Some-
times, organization should consider developing its own application to suit its purpose.
Secondly, sufficient technical support is necessary since RFID is a still a developing
technology. Companies usually encounter many technical issues when they are at the
early stage of implementation. Objective opinions from support staff are very helpful for
the implementation as a whole, especially during testing and measuring results. Thirdly,
testing should be conducted so that potential issues could be exposed before any large
scale implementation takes place. The company should review and modify the system
based on exposed problems (Ting, Tsang and Tse, 2013).
Page 30
28
Even though RFID technology brings better information visibility in the supply chain, com-
panies need to consider several set-backs. Implementing RFID incurs significant invest-
ment and this is the major concern for businesses. Investment includes purchasing tags
and other hardware, installing software and hardware, setting up system, training staff,
hiring experts etc… During the initial setup phase, the costs are significantly higher than
later phases because the cost of tags is much higher than barcode and the testing and
adoption time is long. Therefore companies should have realistic and clear goals so that
they can make return on investment analysis to measure the effectiveness of implement-
ing RFID. There are also a few minor problems such as security or interference issues,
but those are technical problems and can be solved through continuous testing and tink-
ering (Ting, Tsang and Tse, 2013).
5 Supply chain operations at Unilever Vietnam
5.1 Overview of supply chain operations at Unilever Vietnam
Unilever Vietnam’s Supply Chain covers the process from sourcing materials and ser-
vices from suppliers until the delivery of finished products to the customers and consum-
ers at the right time, quantity and quality while running the Supply Chain as effective and
efficient as possible. According to an interview with Mr Thang Tran (Appendix 1), plan-
ning manager at UVN South, Unilever Vietnam relies on the operation of four basic func-
tions in the Supply Chain: Plan, source, make and deliver. Figure 12 shows the main
operations of Unilever Vietnam’s Supply Chain according to UVN’s internal training man-
uals.
Page 31
29
Figure 12. Unilever Vietnam's Supply Chain structures (Unilever’s internal training mate-
rials, 2017)
The Planning function in UVN’s Supply Chain is separated into two branches: Demand
Planning and Supply Planning. The role of the Demand Planner is to capture demand
drivers from business environment and then to perform predictive analysis of current and
historical data in order to make forecasts about the future demand. The forecasts are
then communicated through ERP system to supply planners in an operational format.
After receiving forecasts of future demand from the Demand Planner, Supply Planner
consolidates the data into feasible materials, production and distribution plans within
UVN’s Supply Chain constraints. This process covers all plans and schedules for short-
term, mid-term and long-term activities. Figure 13 shows the connection between de-
mand and supply planning according to UVN’s internal training materials.
Su
pp
liers
Cu
sto
mer
s &
Consu
mer
s
Marketing Customer
Development Finance
Plan Supply
Planning
Demand
Planning
Supply
Management
Inbound
Logistics
Processing
Packing
Customer
Service
Distribution
Management
Source Make Deliver
Page 32
30
Figure 13. Unilever Vietnam's Planning function (Unilever’s internal training materials, 2017)
Sourcing function in UVN’s Supply Chain includes developing relationship with suitable
suppliers until managing physical goods and receipts from such vendors. The Supply
Management process covers the evaluation of UVN’s current business situation and
business environment to select and negotiate with appropriate suppliers and then man-
age the relationship with those suppliers. Figure 14 shows Unilever Vietnam’s step-by-
step approach of the Supply Management process.
Demand drivers
Capture Communicate Interpret
Constrained planning
Materials Production Distribution
Demand
Planning
Supply Plan-
ning
Page 33
31
Figure 14 Unilever Vietnam's Supply Management process (Unilever’s internal training
materials, 2017)
On the other hand, Inbound Logistics concentrates on the transportation and receipt of
materials from the selected vendors within contract framework. An established contract
typically has four important pieces information. Delivery terms highlight the delivery tim-
ing of materials from suppliers to Unilever Vietnam’s storing facilities as well as the safety
procedures that suppliers’ delivery personnel must follow when they arrive at Unilever
Vietnam’s warehouses. Price shown on the deliver invoice is within contract agreement
which has been established before suppliers’ delivery personnel reach Unilever Vi-
etnam’s warehouses. Contract length represents the duration of the commercial relation-
ship between Unilever Vietnam and the suppliers. Contract quantity represents the
amount of materials that Unilever Vietnam can buy from the suppliers. Figure 15 shows
the inbound logistics process of Unilever Vietnam.
UVN's business
assessment
Vendor screening
Vendor selection
Vendor negotiation
Contract establishment
Vendor relationship
management
Page 34
32
Figure 15 Unilever Vietnam's Inbound Logistics process (Unilever’s internal training materials, 2017)
Procured materials are transformed into packed stock available for delivery to customers
and consumers. Processing uses production lines, labour and machines to convert raw
materials into intermediate products in suitable form available for packing and finishing.
To make sure the production lines can run uninterruptedly, important procedures such
as buffering of materials, continuous review of machinery capacity and machine mainte-
nance are necessary to keep expense from machine changeover to a minimum. Pack-
aging uses machines to package intermediate products in flexible film (laminated and
stretch film), then uses manual labour to put laminated packages into paper boxes and
seal it with tapes. Afterwards, these boxes are finally available for stock keeping.
Last but not least, step “deliver” guarantees that the finished products can be distributed
on-time to Unilever Vietnam’s partners and consumers in the right quantity and quality,
as well as makes sure that customers and consumers are content with the products and
service that Unilever Vietnam provide. Distribution Management manages the
movement of finished goods from the factory all the way to the customers/consumers.
After packaging process, finished goods are kept for a short time at the factory
warehouse. Then finished goods are dispatched either straight to UVN partners’ sales
outlets, or to three of UVN’s Central Distribution Centres. From there, the finished goods
are delivered to sales outlets, or to Regional Distribution Centres, and then to sales
Transportation Receiving Receipt Storing
Established contract
Delivery
terms
Price Contract
length
Contract
quantity
Page 35
33
outlets. Customer Service serves as a communication channel to customers and
especially consumers, making sure that any problem with either products or services can
be reported back to the Supply Chain as soon as possible so that a corrective solution
can be deployed.
5.2 Real-life business cases at Unilever Vietnam
In this section five different real-life business cases are introduced. These cases were
observed by the author between February and August of 2017 at UVN South. The
purpose of examining these five cases is to point out the short-comings of supply chain
operations at Unilever Vietnam. Chapter 6 will analyse the short-comings to draw out
development actions.
Case 1: Supplier’s total lead time and increased safety stock at higher target
Powder detergent market in Vietnam is sensitive to price; a 4% decrease in price could
easily boost a 40% increase in sales. To achieve global volume target in February 2017,
board of directors of Unilever Vietnam decided to decrease the price of 2 OMO Pink and
Gold SKU by 20% .Compared to OMO Red, the cash cow of Unilever’s powder
detergent, OMO Pink and Gold are only secondary products. However, the market was
sensitive enough that a 20% decrease in sales price for these two SKUs effectively
projected a three-fold surge in demand for the first quarter of 2017.
Under aforementioned scenario, Unilever Vietnam’s Powder detergent plant in the North
was required to stock up packaging materials at the end of week 7 in February 2017 in
order to produce sufficient amount of finished goods so that Unilever Vietnam could
achieve global target in March. However, there are a few packaging materials which are
subjected to make-to-delivery policy. Normally, these materials have production lead
time of 2 ½ weeks at supplier A. The supplier A is located in the South. Hence, it takes
another 5 days to deliver the finished materials by trucks to the Northern powder
detergent plant. The transportation network is illustrated in Figure 16.
Page 36
34
UV North
UV SouthSupplier A
(South)
OMO
Gold&Pink
OMO
Gold&Pink
Internal
transfer
PLT 2.5
weeks +
5 days of
trucking
Figure 16. Transportation network for OMO’s packaging materials (Unilever’s Planning department, 2017)
Moreover, Material Planners and Procurement team received firm orders in this case
only in early February 2017. Therefore, the total lead time of materials had to be reduced
to have sufficient stock level prior to the start of planned production. To do so, Material
Planners and Procurement team had to work closely with supplier in order to accelerate
its production of materials for OMO Pink and Gold. However, with this solution, the
supplier managed to reduce the production lead time only to 2 weeks, and could deliver
only half of the required amount. Therefore, UVN decided to split the material
requirements for the initial production output into two batches. The first batch was airlifted
to the Northern plant right after production, while the second one was transported by
express trucks, which took three days. Luckily, the first batch of packaging materials
airlifted was almost enough for production while the Northern plant was waiting for the
second batch.
Case 2: Adding another supplier due to abrupt product promotion
As we already learned from the case 1, UVN tried to promote sales to meet the global
target by lowering sales price of two secondary OMO products, namely Gold and Pink.
However, the sales failed to meet the target so the leading brand OMO Red was put on
the frontline. Indeed, OMO Red constantly enjoys major share, around 70%, of total
powder detergent sales. To make sure that UVN would manage to reach the revenue
target of $5 million for Q1, OMO Red was offered at a discounted price.
Page 37
35
The usual sales of OMO Red has already large volume, so unsurprisingly the discount
policy resulted in volume surge. With limited capacity, the main supplier failed to meet
the new required volume for UVN North. Therefore, UVN North had to rely on an
additional supplier, supplier B, who operates in the South. Supplier B is no stranger to
Unilever Vietnam, because while supplier A provides all packaging materials for the UVN
North, supplier B supplies packaging materials for UVN South for a few SKUs. The
relationship between these two suppliers and Unilever Vietnam’s plants is illustrated in
Figure 17.
UV North
UV SouthSupplier B
(South)
Supplier A
(South)
OMO Red
OMO Red
CoA,
Sample,
Contract
Figure 17. The relationship between UVN’s plants and packaging suppliers (Unilever’s Planning department, 2017)
In order to procure from a new supplier for UVN Northern plant, there are supplier
sourcing procedures which must be followed:
1. A Certificate of Assurance (CoA) must be provided. This certificate includes all
technical specifications required by UVN North. Supplier B would produce a small
amount first for trial and test, then the CoA of the trial would be sent to UVN
North’s Quality Assurance (QA) team to be checked for any mismatch between
required and actual specifications.
2. A purchase contract must be prepared between UVN North and supplier B. The
usual lead time from the price negotiation to contract signing is around 2-3 weeks.
Page 38
36
3. A standard sample must be sent at least one day before the delivery date. The
sample will then be examined directly by QA team to make sure the specifications
from CoA and the sample match. If not, the lot could be rejected.
In order to reduce the lead time, managers at UVN decided to:
1. Use in this particular case a CoA from a similar SKU to OMO Red which supplier
B was supplying to UVN South.
2. Establish a contract with higher buying price to reduce negotiating time. The
production at supplier B factory will start right away once price is decided.
3. The standard sample was sent to UVN South instead for analysis. The result was
emailed to UVN North once done.
While the procedure lead time was reduced significantly, Unilever Vietnam was still
subjected to defect risk as well as higher buying cost. However, Unilever Vietnam was
willing to accept those setbacks as long as the company could push the planned volume
of OMO Red out to the market.
Case 3. Plant overcapacity and Revised Safety Stock
At the beginning of June 2017, Sales team reported an all-year high demand for Knorr
Granule (KG) for July. Knorr Granule is a high-demand food product, making up to 80%
of the production volume of total Food category. The usual production volume per week
is around 500 tons. However, aggregated demand forecasted for July jumped to 700
tons per week, or up by 40%.
In order to meet these demand requirements, there were two areas at the food plant that
had to be looked at:
1. Capacity Requirement Planning: the food process is capped at the output of 40
tons of KG per work shift, or 120 ton per three-shift workday. To meet the weekly
orders of 700 ton KG alone, the plant had to run almost 6 days, while suspending
all other SKUs. The management had to call for working overtime on Sunday at
extra cost to meet the capacity requirement.
2. Material Requirements Planning: there are four main raw materials which
constitute most of KG volume: monosodium glutamate, salt, tapioca flour and
sugar, which made up 30%, 40%, 10% and 8% of KG volume respectively. Given
that the warehouse was also occupied by other SKUs, increased stock inflow of
Page 39
37
materials for KG weekly production forced the management to use a third party
warehousing company to mitigate the space constraint. In addition, higher
demand of KG also raised the question of revising the safety stock level.
After carefully reviewing the two abovementioned decision areas, Food plant’s manager
decided to:
1. Have Food factory running a full 24/7 for the first week of July.
Because factory workers have 6-day-a-week contract it is always out of free will
whether they decide to work on Sunday. The manager could ask the workers to stay
on Sunday for 1 or 2 consecutive weeks. Still, most workers would find it hard to work
for a full month, even with extra pay. Therefore, the manager tried to meet 700 ton
target on the first week. After collecting feedback from Sales team about the actual
demand of the market in the first week of July, the Food plant decided to cut down
the production of a few less impactful SKUs to the total sale to make more space,
and asked factory workers whether they were ready to commit to more Sundays.
Fortunately, leaders at food plant had managed to build rapport with the workers.
Therefore most workers had agreed to work on extra Sundays.
2. Build up stock in June.
Because monosodium glutamate and sugar have the fastest lead time, the stock for
these two could be built up with ease. Tapioca flour and salt are trickier, as they
required extra monitoring in procurement process to push these two imported
materials to arrive before July. Therefore, warehouse and planners had agreed to
buy extra tapioca flour and salt in June to be used gradually for the ad-hoc in July.
Due to having fast lead time, monosodium glutamate and sugar were managed so
as these two materials arrived at plant roughly the amount required each week in
July, hence less effort in monitoring the above mentioned materials.
6 Analyses of information collected
There are two short-comings from Unilever Vietnam supply chain management drawn
from the real-life business cases presented in chapter 5:
• Inaccurate forecasting about the upcoming demand, leading to bull-whip effect
• Slow reaction to sudden changes due to low visibility of materials and slow-trav-
eling information flow along the pipeline
Page 40
38
In a growing Vietnamese market, the demand for Unilever Vietnam’s products will be
growing and remains non-stationary. Therefore it is difficult to maintain accurate fore-
casts for upcoming demand. According to chapter 5, VMI could be an initiative that re-
duces the uncertainty in Vietnamese FMCG market while improving forecasts accuracy.
Thus, a partnering relationship between Unilever Vietnam as the vendor and supermar-
ket chains as retailers and wholesalers is preferable because Unilever can acquire infor-
mation about the end-users through the information sharing and thus can forecast more
accurately.
The prerequisite of VMI partnership is technological requirements mentioned in chapter
5, therefore both vendor and buyer must be able to fulfill these requirements. We can
see that only modern distribution channels can make necessary investment to establish
a VMI initiative with Unilever Vietnam. In modern channels, minimarts as well as conven-
ience stores are too new and have too small market share. Hence, Unilever Vietnam
should choose supermarkets chain as its partner in VMI initiative.
To implement VMI successfully, Unilever Vietnam has to consider three things. Firstly,
Unilever need to check the accuracy of the information shared by supermarkets. Estab-
lish KPIs particularly for data accuracy and data clarity is one solution. Unilever and su-
permarkets should get together to review these KPIs periodically. Unilever could review
data accuracy KPIs for different categories, for example, KPIs for promotion seasons,
KPIs for big cities, etc… This helps Unilever and supermarkets to identify where do the
inaccuracies come from. Secondly, Unilever Vietnam need to use shared information in
a timely manner so that no delay can occur. Depends on how fluctuating the demand for
certain item is, Unilever Vietnam and supermarkets could choose to share information
weekly, bi-weekly or even every day. To make sure that Unilever uses the information
timely, the company should give feedback about the shared information within the day
that supermarkets send that information. Failure to do so will be recorded as KPIs.
Thirdly, Unilever Vietnam and the supermarkets should decide beforehand the items that
are most difficult to forecast so information about those items will be focused and shared
first.
Because Unilever is benefited the most from VMI partnership, the company should give
the supermarkets incentives so that they are more willing to join the initiative. The in-
centives could be commercially, for example discount on bulk purchase, or information
Page 41
39
sharing, for example Unilever Vietnam could disclose to supermarkets their upcoming
promotion activities. Since trust is very important in VMI partnership, Unilever will be
missing out on developing VMI with minimarts and convenience stores, which are grad-
ually replacing traditional distribution channels.
RFID could be a solution for Unilever Vietnam to bring more visibility to its supply chain.
However, RFID’s costs will be the main obstacle for Unilever Vietnam. I suggest Unilever
deploys prototype testing first, then review and evaluate the results to conduct quantita-
tive analysis on ROI of the project. For example, Unilever could conduct the test on a
truckload of items each time, then compare the visibility of the tested truckload to the
normal truckload. By conducting small scale tests, Unilever Vietnam can minimize the
costs while still getting quantifiable data about the potential of RFID project.
7 Conclusions and recommendations
The aims of this thesis are to examining the existing supply chain structures of Unilever
Vietnam to identify short-comings and advice the company with improvement and
development suggestions. To achieve the two objectives of this thesis, I have
constructed four research questions as the guideline for the thesis.
The first question has been answered in chapter 2. Vietnam has a big population that
getting wealthier. That means Vietnamese are more willing to spend more on consumer
goods. The rise of new technologies in Vietnam along with the appearance of modern
distribution channels is gradually changing the Vietnamese market landscape.
The second question has been answered in chapter 5. Unilever Vietnam’s supply chain
consists of four main operations: plan, source, make and deliver. ‘Plan’ consists of
demand planning and supply planning, ‘source’ consists of supply management and
inbound logistics, ‘make’ consist of production and packaging, finally ‘deliver’ consists of
distribution management and customer service.
The third question has been answered in chapter 5 and 6. After reviewing three business
cases from Unilever Vietnam’s supply chain operations, two short-comings have been
identified. First one is inaccuracies in forecasting and second is low visibility of
information within Unilever Vietnam’s supply chain.
Finally, the fourth question has been answered in chapter 4 and 6. Two possible
development opportunities have been shown. Firstly, vendor-managed inventory
Page 42
40
partnership reduces uncertainty in Vietnamese FMCG market thus improve forecast
accuracy through the continuous sharing of information between Unilever Vietnam and
retailers. I have found out that Unilever Vietnam can only possibly develop VMI initiative
with supermarkets because other distribution channels do not meet the technological
requirements for the initiative. Secondly, implementation of RFID improves the visibility
of Unilever Vietnam. However, as initial cost is a huge barrier to implement RFID, I advise
Unilever Vietnam to conduct prototype testing first, then analyses the results to
understand the cost effectiveness of the project.
The two improvement suggestions are made without proper quantitative analysis.
Therefore, the conclusions have been reached based purely on theory only. Hence, this
thesis can be improved further with quantifiable data, for instance proper KPIs can be
developed for VMI, or ROI on RFID implementation can be calculated.
Page 43
41
References
Agarwal, V., 2001. Assessing the benefits of Auto-ID Technology in the Consumer
Goods Industry. Cambridge University
Angulo, A., Nachtmann, H. and Waller, A., 2004. Supply chain information sharing in a
vendor managed relationship. Journal of Business Logistics, Vol. 25
Antonova, I., 2018. Warehousing. Ivkwarehousing, [online] Available at: <
http://ivkwarehousing.weebly.com> [Accessed 22 July 2018].
Arkieva, 2018. What is the bullwhip effect and how do you minimize it? Arkieva, [online]
Available at: < https://blog.arkieva.com/what-is-bullwhip-effect/> [Accessed 22 July
2018].
Bauhof, M., 2004. SCOR Model: Supply Chain Operations Reference Model. Beverage
Industry
Bookbinder, J., Gumus, M. and Jewkes, E., 2010. Calculating the benefits of vendor
managed inventory in a manufacturer-retailer system. International Journal of Production
Research, Vol. 48
Brands Vietnam, 2017. Đòn bẩy tăng trưởng của ngành hàng tiêu dùng nhanh. Brands
Vietnam, [online] Available at: <http://www.brandsvietnam.com/14670-Don-bay-tang-
truong-cua-nganh-hang-tieu-dung-nhanh> [Accessed 22 July 2018].
Brands Vietnam, 2017. Nielsen: Thị trường tiêu dùng nhanh năm 2018 là câu chuyện
"cá nhanh nuốt cá chậm". Brands Vietnam, [online] Available at: <
http://www.brandsvietnam.com/15076-Nielsen-Thi-truong-tieu-dung-nhanh-nam-2018-
la-cau-chuyen-ca-nhanh-nuot-ca-cham> [Accessed 22 July 2018].
Brands Vietnam, 2017. Thị trường tiêu dùng nhanh: Cuộc đua ở phân khúc cao cấp.
Brands Vietnam, [online] Available at: < http://www.brandsvietnam.com/15531-Thi-
truong-tieu-dung-nhanh-Cuoc-dua-o-phan-khuc-cao-cap> [Accessed 22 July 2018].
Page 44
42
Christopher, M., 2005. Logistics and Supply Chain Management, Creating Value-Adding
Networks, 3rd ed. Harlow: FT Press
Grant, D., 2012. Logistics Management, 1st ed. Harlow: Pearson
Institute for Work & Health. 2015. Primary data and secondary data. [online] Available
at: <https://www.iwh.on.ca/what-researchers-mean-by/primary-data-and-secondary-
data> [Accessed 7 June 2018]
Institutes of Logistics and Warehousing, 2018. SCOR: Supply-Chain Reference Model.
Institutes of Logistics and Warehousing Technological Centre
Investopedia, 2017. Inventory Management. Investopedia, [online] Available at: <
https://www.investopedia.com/terms/i/inventory-management.asp> [Accessed 22 July
2018].
Ithaca College Library. 2017. Primary and Secondary Sources. [online] Available at:
<https://library.ithaca.edu/sp/subjects/primary> [Accessed 7 June 2018]
Juneja, P., 2017. Production Planning and Control. Management Study Guide, [online]
Available at: < https://www.managementstudyguide.com/production-planning-and-
control.htm> [Accessed 22 July 2018].
Kantar World, 2018. FMCG Monitor December 2017. Kantar Worldpanel Vietnam,
[online] Available at: <https://www.kantarworldpanel.com/vn/news/FMCG-Monitor-
December-2017> [Accessed 22 July 2018].
Kantar World, 2018. The future of FMCG in Vietnam. Kantar Worldpanel Vietnam,
[online] Available at: <https://www.kantarworldpanel.com/global/News/The-future-of-
FMCG-in-Vietnam> [Accessed 22 July 2018].
Mba Skool, 2017. Distribution Resource Planning (DRP-II). Mba Skool, [online] Available
at: < https://www.mbaskool.com/business-concepts/operations-logistics-supply-chain-
terms/15020-distribution-resource-planning-drp-ii.html> [Accessed 22 July 2018].
Page 45
43
Mba Skool, 2017. Supply Planning. Mba Skool, [online] Available at: <
https://www.mbaskool.com/business-concepts/operations-logistics-supply-chain-
terms/13301-supply-planning.html> [Accessed 22 July 2018].
Ministry of Planning and Investment. 2009. Exploring the links between international
businesses and socio-economic development of Vietnam: a case study of Unilever
Vietnam. [online] Available at: <https://www.unilever.com/Images/sd-exploring-the-links-
between-international-businesses-and-socio-economic-developmen-of-vietnam-a-case-
study-of-unilever-vietnam-2009_tcm244-409773_en.pdf> [Accessed 7 June 2018]
Muller, M., 2011. Essentials of Inventory Management, 2nd ed. U.S.A: American
Management Association
NDH, 2018. Việt Nam vẫn nằm trong nhóm thị trường bán lẻ hấp dẫn nhất thế giới. NDH,
[online] Available at: < http://ndh.vn/viet-nam-van-nam-trong-nhom-thi-truong-ban-le-
hap-dan-nhat-the-gioi-20180312080740866p145c151.news> [Accessed 22 July 2018].
Ngo, T., 2015. GIẢI PHÁP PHÁT TRIỂN CHỢ TRUYỀN THỐNG TẠI THÀNH PHỐ ĐÀ
NẴNG. Ph. D. Danang University
Nielsen Vietnam, 2017. After reaching a record break, FMCG fluctuated, reflecting
market’s volatility in the second quarter. Nielsen Vietnam, [online] Available at: <
https://www.nielsen.com/vn/vi/insights/2017/nielsen-fmcg-updates-q2-17.html>
[Accessed 22 July 2018].
P.R. Murphy, Jr. & D.F. Wood, 2013. Contemporary Logistics, 10th ed. Harlow: Pearson
Pham, T., 2014. Chuỗi cung ứng và ứng dụng trong tập đoàn Unilever. B.A. University
of Foreign Trade
Sardroud, J., 2012. Influence of RFID technology on automated management of
construction materials and components. Scientia Iranica, Vol. 19
Sari, K., 2007. Exploring the benefits of vendor managed inventory. International Journal
of Physical Distribution & Logistics Management, Vol. 37
Page 46
44
Seidman, D. and Ball, M., 2012. Supply and Demand, 1st ed. U.S.A: The Rosen
Publishing Group
Supply Chain Council, 2012. Supply Chain Operations Reference Model. Supply Chain
Council, Inc
Ting, S., Tsang, A. and Tse, Y., 2013. A Framework for the Implementation of RFID
Systems. International Journal of Engineering Business Management, Vol. 5
Tradegeko, 2018. What is demand forecasting and how can it help your business?
Tradegeko, [online] Available at: < https://www.tradegecko.com/blog/what-is-demand-
forecasting-and-how-can-it-help-your-business> [Accessed 22 July 2018].
Unilever Vietnam, 2017. Supply Chain structures and KPIs. [training material]. Ho Chi
Minh city: Unilever Vietnam
Unilever. 2017. 2017 full year results. [online] Available at:
<https://www.unilever.com/Images/ir-q4-2017-full-announcement_tcm244-
515314_en.pdf> [Accessed 7 June 2018]
VNExpress, 2015. Cửa hàng tạp hóa vẫn sống khỏe. VNExpress, [online] Available at:
< https://kinhdoanh.vnexpress.net/tin-tuc/doanh-nghiep/cua-hang-tap-hoa-van-song-
khoe-3209303.html> [Accessed 22 July 2018].
VNUni, 2015. Phân biệt giữa Siêu thị mini và Cửa hàng tiện lợi. VNUni, [online] Available
at: < http://vnuni.vn/phan-biet-giua-sieu-thi-mini-va-cua-hang-tien-loi/> [Accessed 22
July 2018].
Waller, M., Johnson, E. and Davis, T., 1999. Vendor-managed inventory in the retail
supply chain. Journal of Business Logistics, Vol. 20
World Bank, 2018. The World Bank In Vietnam. World Bank, [online] Available at: <
http://www.worldbank.org/en/country/vietnam/overview> [Accessed 22 July 2018].
Page 47
Appendix 1
45 (2)
Interview questions
These are a series of questions for Mr Thang Tran – planning manager at Unilever
Vietnam South:
1. How many product categories are Unilever Vietnam operating within?
2. What are the manufacturing and supply chain facilities of Unilever Vietnam?
Where are they located?
3. Could you give me an overview of Unilever Vietnam’s supply chain structures?
4. What are the functions of Plan, Source, Make and Deliver in Unilever Vietnam’s
supply chain?


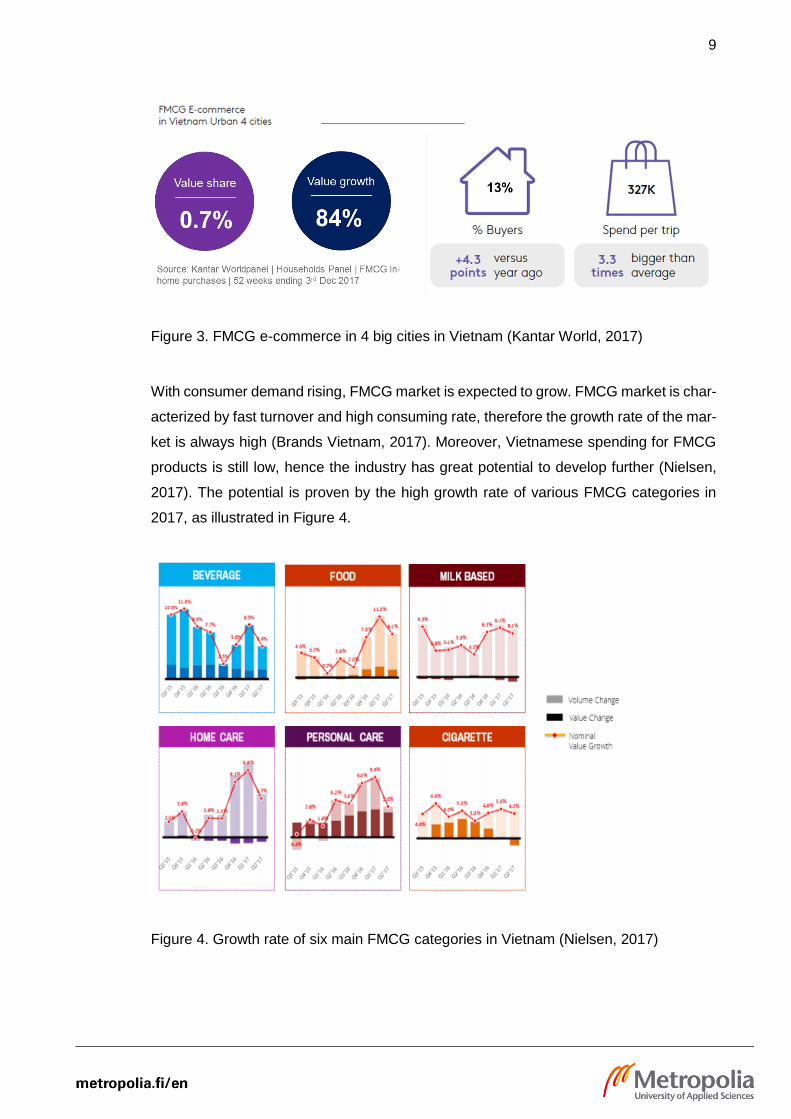


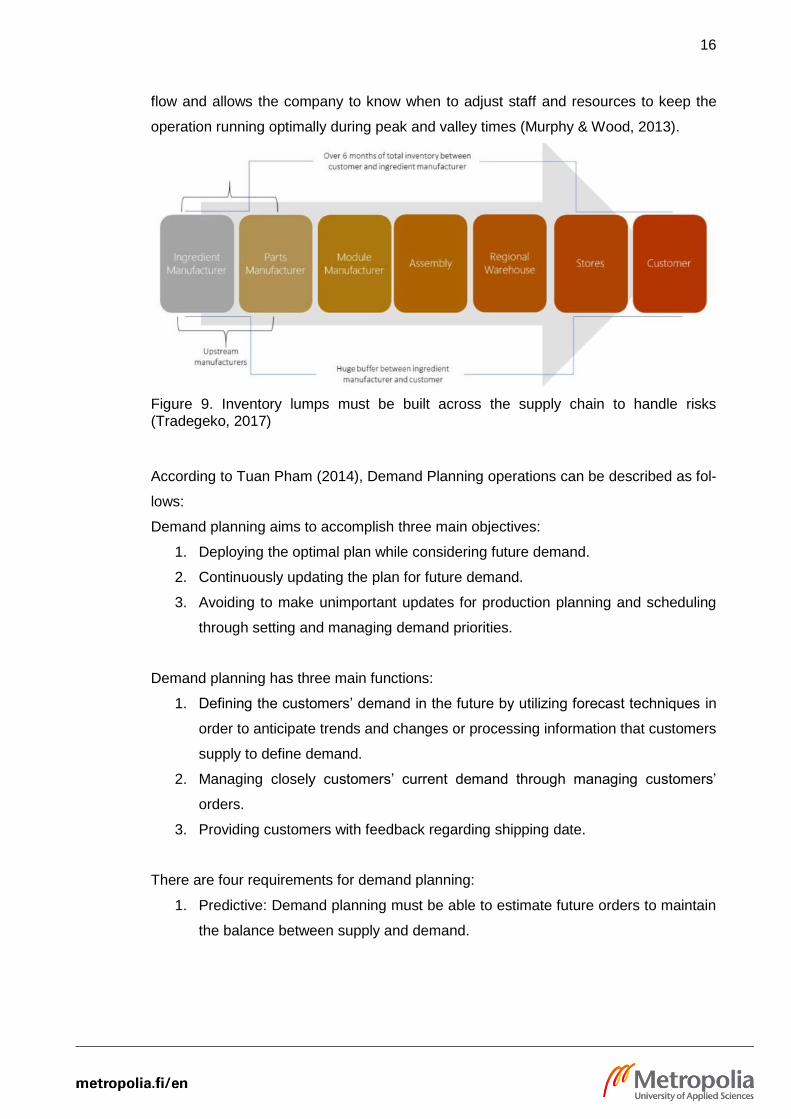


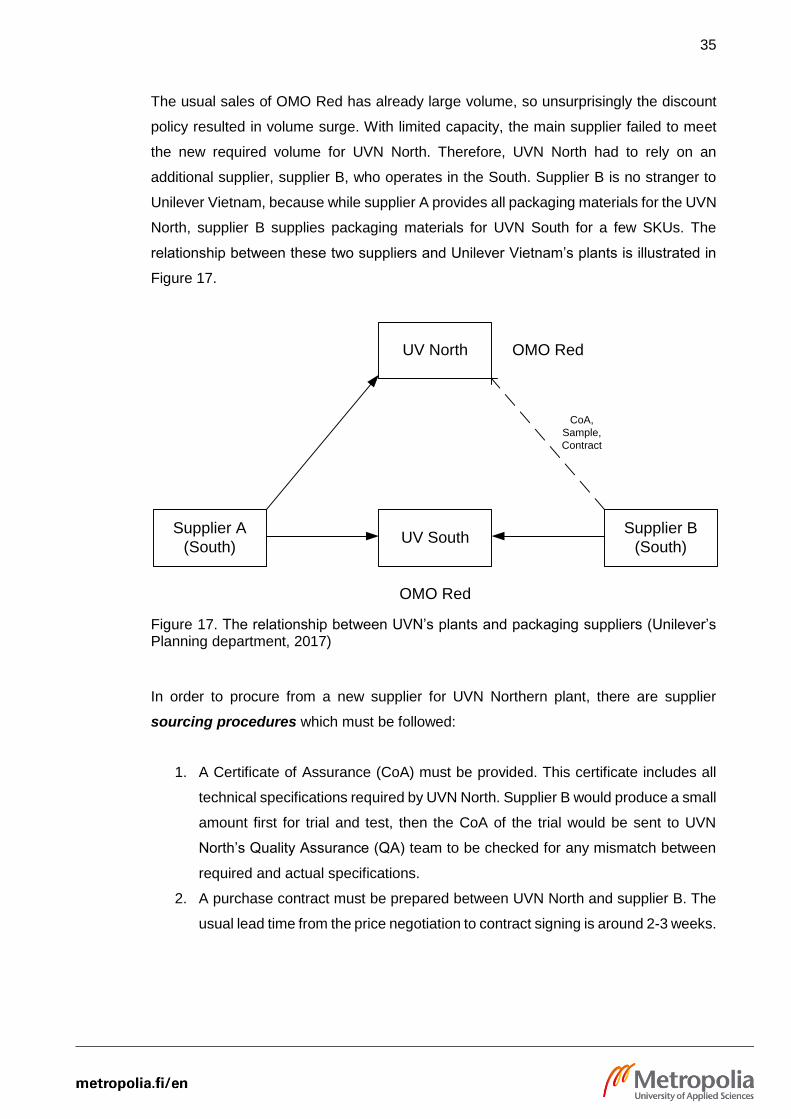


![Hot là Tốt! - Lipton Yellow Label [Unilever Vietnam]](https://static.documents.pub/doc/80x56/58f9afdb760da3da068bb139/hot-la-tot-lipton-yellow-label-unilever-vietnam-58f9d10a321ce.jpg)