+ All Categories
Home > Documents > IMPROVING THE A -M EMORY T RADE -O FF OF R ANDOM F …

IMPROVING THE A -M EMORY T RADE -O FF OF R ANDOM F …

Date post: 18-Dec-2021
Category:
Upload: others
View: 2 times
Download: 0 times
Share this document with a friend
71
I MPROVING THE ACCURACY-MEMORY T RADE -OFF OF RANDOM F ORESTS VIA L EAF -REFINEMENT Sebastian Buschj ¨ ager 1 Katharina Morik 1 ABSTRACT Random Forests (RF) are among the state-of-the-art in many machine learning applications. With the ongoing integration of ML models into everyday life, the deployment and continuous application of models becomes more and more an important issue. Hence, small models which offer good predictive performance but use small amounts of memory are required. Ensemble pruning is a standard technique to remove unnecessary classifiers from an ensemble to reduce the overall resource consumption and sometimes even improve the performance of the original ensemble. In this paper, we revisit ensemble pruning in the context of ‘modernly’ trained Random Forests where trees are very large. We show that the improvement effects of pruning diminishes for ensembles of large trees but that pruning has an overall better accuracy-memory trade-off than RF. However, pruning does not offer fine-grained control over this trade-off because it removes entire trees from the ensemble. To further improve the accuracy-memory trade-off we present a simple, yet surprisingly effective algorithm that refines the predictions in the leaf nodes in the forest via stochastic gradient descent. We evaluate our method against 7 state-of-the-art pruning methods and show that our method outperforms the other methods on 11 of 16 datasets with a statistically significant better accuracy-memory trade-off compared to most methods. We conclude our experimental evaluation with a case study showing that our method can be applied in a real-world setting. 1 I NTRODUCTION Ensemble algorithms offer state-of-the-art performance in many applications and often outperform single classifiers by a large margin. With the ongoing integration of embedded systems and machine learning models into our everyday life, e.g in the form of the Internet of Things, the hardware platforms which execute ensembles must also be taken into account when training ensembles. From a hardware perspective, a small ensemble with min- imal execution time and a small memory footprint is de- sired. Similar, learning theory indicates that ensembles of small models should generalize better which would make them ideal candidates for small, resource constraint de- vices(Koltchinskii et al., 2002; Cortes et al., 2014). Practical problems, on the other hand, often require ensembles of complex base learners to achieve good results. For some ensembling techniques such as Random Forest it is even desired that individual trees are as large as possible lead- ing to overall large ensembles (Breiman, 2000; Biau, 2012; Denil et al., 2014; Biau & Scornet, 2016). Ensemble prun- ing is a standard technique for implementing ensembles on small devices (Tsoumakas et al., 2009; Zhang et al., 2006) by removing unnecessary classifiers from the ensem- 1 Chair for Artificial Intelligence, TU Dortmund Univer- sity, Germany. Correspondence to: Sebastian Buschj ¨ ager <[email protected]>. ble. Remarkably, this removal can sometimes lead to a better predictive performance (Margineantu & Dietterich, 1997; Mart´ ınez-Mu ˜ noz & Su ´ arez, 2006; Li et al., 2012). In this paper, we revisit ensemble pruning and show that this improvement effect does not carry over to the modern-style of training individual trees as large as possible in Random Forests. Maybe even more frustrating, ensemble pruning does not seem to be necessary anymore to achieve the best accuracy if the original forest has a sufficient amount of large trees. If, however, one also considers the memory requirements of the individual trees the situation changes. We argue that, from a hardware perspective, the trade-off between memory and accuracy is what really matters. Al- though a Random Forest might produce a good model it might not be possible to deploy it onto a small device due to its memory requirements. As shown later, the best per- forming RF models are often larger than 5 - 10 MB (see e.g. Fig. 2 and Fig. 3) while most available microcontroller units (MCU) only offer a few KB to a few MB of memory as depicted in Table 1. Hence, to deploy RF onto these small devices we require a good algorithm which gives accurate models for a variety of different memory constraints. We directly optimize the accuracy-memory trade-off by introducing a technique called leaf-refinement. Leaf- Refinement is a simple, but surprisingly effective method, which, instead of removing trees from the ensemble, further refines the predictions of small ensembles using gradient- descent. This way, we can refine any given tree-ensemble
Transcript

IMPROVING THE ACCURACY-MEMORY TRADE-OFF OF RANDOM FORESTSVIA LEAF-REFINEMENT

Sebastian Buschjager 1 Katharina Morik 1

ABSTRACTRandom Forests (RF) are among the state-of-the-art in many machine learning applications. With the ongoingintegration of ML models into everyday life, the deployment and continuous application of models becomesmore and more an important issue. Hence, small models which offer good predictive performance but use smallamounts of memory are required. Ensemble pruning is a standard technique to remove unnecessary classifiersfrom an ensemble to reduce the overall resource consumption and sometimes even improve the performance ofthe original ensemble. In this paper, we revisit ensemble pruning in the context of ‘modernly’ trained RandomForests where trees are very large. We show that the improvement effects of pruning diminishes for ensemblesof large trees but that pruning has an overall better accuracy-memory trade-off than RF. However, pruning doesnot offer fine-grained control over this trade-off because it removes entire trees from the ensemble. To furtherimprove the accuracy-memory trade-off we present a simple, yet surprisingly effective algorithm that refinesthe predictions in the leaf nodes in the forest via stochastic gradient descent. We evaluate our method against 7state-of-the-art pruning methods and show that our method outperforms the other methods on 11 of 16 datasetswith a statistically significant better accuracy-memory trade-off compared to most methods. We conclude ourexperimental evaluation with a case study showing that our method can be applied in a real-world setting.

1 INTRODUCTION

Ensemble algorithms offer state-of-the-art performance inmany applications and often outperform single classifiers bya large margin. With the ongoing integration of embeddedsystems and machine learning models into our everydaylife, e.g in the form of the Internet of Things, the hardwareplatforms which execute ensembles must also be taken intoaccount when training ensembles.

From a hardware perspective, a small ensemble with min-imal execution time and a small memory footprint is de-sired. Similar, learning theory indicates that ensembles ofsmall models should generalize better which would makethem ideal candidates for small, resource constraint de-vices(Koltchinskii et al., 2002; Cortes et al., 2014). Practicalproblems, on the other hand, often require ensembles ofcomplex base learners to achieve good results. For someensembling techniques such as Random Forest it is evendesired that individual trees are as large as possible lead-ing to overall large ensembles (Breiman, 2000; Biau, 2012;Denil et al., 2014; Biau & Scornet, 2016). Ensemble prun-ing is a standard technique for implementing ensembleson small devices (Tsoumakas et al., 2009; Zhang et al.,2006) by removing unnecessary classifiers from the ensem-

1Chair for Artificial Intelligence, TU Dortmund Univer-sity, Germany. Correspondence to: Sebastian Buschjager<[email protected]>.

ble. Remarkably, this removal can sometimes lead to abetter predictive performance (Margineantu & Dietterich,1997; Martınez-Munoz & Suarez, 2006; Li et al., 2012). Inthis paper, we revisit ensemble pruning and show that thisimprovement effect does not carry over to the modern-styleof training individual trees as large as possible in RandomForests. Maybe even more frustrating, ensemble pruningdoes not seem to be necessary anymore to achieve the bestaccuracy if the original forest has a sufficient amount oflarge trees. If, however, one also considers the memoryrequirements of the individual trees the situation changes.We argue that, from a hardware perspective, the trade-offbetween memory and accuracy is what really matters. Al-though a Random Forest might produce a good model itmight not be possible to deploy it onto a small device dueto its memory requirements. As shown later, the best per-forming RF models are often larger than 5 − 10 MB (seee.g. Fig. 2 and Fig. 3) while most available microcontrollerunits (MCU) only offer a few KB to a few MB of memoryas depicted in Table 1. Hence, to deploy RF onto these smalldevices we require a good algorithm which gives accuratemodels for a variety of different memory constraints.

We directly optimize the accuracy-memory trade-off byintroducing a technique called leaf-refinement. Leaf-Refinement is a simple, but surprisingly effective method,which, instead of removing trees from the ensemble, furtherrefines the predictions of small ensembles using gradient-descent. This way, we can refine any given tree-ensemble

Improving the Accuracy-Memory Trade-Off of Random Forests Via Leaf-Refinement

MCU Flash (S)RAM Power

Arduino Uno 32KB 2KB 12mAArduino Mega 256KB 8KB 6mAArduino Nano 26–32KB 1–2KB 6mASTM32L0 192KB 20KB 7mAArduino MKR1000 256KB 32KB 4mAArduino Due 512KB 96KB 50mASTM32F2 1MB 128KB 21mASTM32F4 2MB 384KB 50mA

Table 1. Available memory on different microcontroller units. Ex-cerpt from (Branco et al., 2019).

to optimize its accuracy thereby maximizing the accuracy-memory trade-off. Our contributions are as follows:

• Revisiting ensemble pruning: We revisit ensemblepruning in the context of modernly trained RandomForests in which individual trees are typically large.We show that pruning a Random Forest can improvethe accuracy if individual trees are small, but this effectbecomes neglectable for larger trees. Moreover, ifwe are only interested in the most accurate modelswhere memory is no constraint we can simply trainunpruned Random Forests which yields comparableresults without the need for pruning.

• Random Forest with Leaf Refinement: We showthat pruning exhibits a better accuracy-memory trade-off than RF does. To further optimize this trade-offwe present a simple, yet surprisingly effective gradient-descent based algorithm called leaf-refinement (RF-LR) which refines the predictions of a pre-trained Ran-dom Forest.

• Experiments: We show the performance of our algo-rithm on 16 datasets and compare it against 7 state-of-the-art pruning methods. We show that RF-LR outper-forms the other methods on 11 of 16 datasets with astatistically significant better accuracy-memory trade-off compared to most methods. We conclude our ex-perimental evaluation with a case study showing thatour method can be applied on a real-world setting.

The paper is organized as the following. Section 2 presentsour notation and related work. In Section 3 we revisit en-semble pruning in the context of ‘modern’ Random Forests,whereas section 4 discusses how to improve the accuracy-memory trade-off without ensemble pruning. In section 5we experimentally evaluate our method and in section 6 weconclude the paper.

2 BACKGROUND AND NOTATION

We consider a supervised learning setting, in which we as-sume that training and test points are drawn i.i.d. accordingto some distribution D over the input space X and labels Y .We assume that we have given a trained ensemble with Mclassifiers hi ∈ H of the following form:

f(x) =1

M

M∑

i=1

hi(x) (1)

Additionally, we have given a labeled pruning sampleS = {(xi, yi)|i = 1, . . . , N} where xi ∈ X ⊆ Rd is ad-dimensional feature-vector and yi ∈ Y ⊆ RC is the cor-responding target vector. This sample can either be theoriginal training data used to train f or another pruning setnot related to the training or test data. For classificationproblems with C ≥ 2 classes we encode each label as a one-hot vector y = (0, . . . , 0, 1, 0, . . . , 0) which contains a ‘1’at coordinate c for label c ∈ {0, . . . , C − 1}; for regressionproblems we have C = 1 and Y = R. In this paper, we willfocus on classification problems, but note that our approachis directly applicable for regression tasks, as well. Moreoverwe will focus on tree ensembles and specifically RandomForests, but note that most of our discussion directly trans-lates to other tree ensembles such as Bagging (Breiman,1996), ExtraTrees (Geurts et al., 2006), Random Subspaces(Ho, 1998) or Random Patches (Louppe & Geurts, 2012).

The goal of ensemble pruning is to select a subset of Kclassifier from f which forms a small and accurate sub-ensemble. Formally, each classifier hi receives a corre-sponding pruning weight wi ∈ {0, 1}. Let

L(w) =1

N

(x,y)∈S`

(M∑

i=1

wihi(x), y

)(2)

be a loss function and let ‖w‖0 =∑Mi=1 1{wi > 0} be the

l0 norm which counts the number of nonzero entries in theweight vector w = (w1, w2, . . . , wM ). Then the ensemblepruning problem is defined as:

arg minw∈{0,1}M

L(w) st. ‖w‖0 = K (3)

Many effective ensemble pruning methods have been pro-posed in literature. These methods usually differ in the spe-cific loss function used to measure the performance of a sub-ensemble and the way this loss is minimized. Tsoumakaset al. give in (Tsoumakas et al., 2009) a detailed taxonomyof pruning methods which was later expanded in (Zhou,2012) to which we refer interested readers. Early workson ensemble pruning focus on ranking-based approacheswhich assign a rank to each classifier depending on theirindividual performance and then pick the top K classifier

Improving the Accuracy-Memory Trade-Off of Random Forests Via Leaf-Refinement

from to the ranking. One of the first pruning methods inthis direction was due to Margineantu and Dietterich whichproposed to use the Cohen-Kappa statistic to rate the ef-fectiveness of each classifier in (Margineantu & Dietterich,1997). More recent approaches also incorporate the ensem-ble’s diversity into the selection such as (Lu et al., 2010;Jiang et al., 2017; Guo et al., 2018). As an alternative toa simple ranking, Mixed Quadratic Integer Programming(MQIP) has also been proposed. Originally this approachwas proposed by Zhang et al. in (Zhang et al., 2006) whichuses the pairwise errors of each classifier to formulate anMQIP. Cavalcanti et al. expand on this idea in (Cavalcantiet al., 2016) which combines 5 different measures into theMQIP. A third branch of pruning considers the clustering ofensemble members to promote diversity. The main idea is tocluster the classifiers into (diverse) groups and then to selectone representative from each group (Giacinto et al., 2000;Lazarevic & Obradovic, 2001). Last, ordering-based prun-ing has been proposed. Ordering-based approaches order allensemble members according to their overall contributionto the (sub-)ensemble and then pick the top K classifierfrom this list. This approach was also first considered in(Margineantu & Dietterich, 1997) which proposed to greed-ily minimize the overall ensemble error. A series of worksby Martınez-Munoz, Suarez and others (Martınez-Munoz &Suarez, 2004; Martınez-Munoz & Suarez, 2006; Martınez-Munoz et al., 2008) add upon this work proposing differenterror measures. More recently, theoretical insights fromPAC theory and the bias-variance decomposition were alsotransformed into greedy pruning approaches (Li et al., 2012;Jiang et al., 2017).

Looking beyond ensemble pruning there are numerous, or-thogonal methods to deploy ensembles to small devices.First, ‘classic’ decision tree pruning algorithms (e.g. mini-mal cost complexity pruning or sample complexity pruning)already reduce the size of DTs while offering a better ac-curacy (c.f. (Barros et al., 2015)). Second, in the contextof model compression (see e.g. (Choudhary et al., 2020)for an overview) specific models such as Bonsai (Kumaret al., 2017) or Decision Jungles (Shotton et al., 2013) aimto find smaller tree ensembles already during training. Last,the optimal implementation of tree ensembles has also beenstudied, e.g. by optimizing the memory layout for caching(Buschjager et al., 2018) or changing the tree traversal toutilize SIMD instructions (Ye et al., 2018). We find thatall these methods are orthogonal to our approach and thatthey can be freely combined with one another, e.g. we maytrain a decision jungle, then perform ensemble pruning orleaf-refinement on it and finally find the optimal memorylayout of the trees in the jungle for the best deployment.

Algorithm 1 Reduced Error Pruning (RE).1: w ← (0, . . . , 0)2: i← argmin{L(w + ~ei)|i = 1 . . . ,M}3: w ← w + ~ei4: for j = 1, . . . ,K − 1 do5: i← argmin{L(w + ~ei)|i = 1 . . . ,M,wi 6= 1}6: w ← w + ~ei7: end for

3 REVISITING ENSEMBLE PRUNING

Before we discuss our method we first want to revisit Re-duced Error Pruning (RE, (Margineantu & Dietterich, 1997))and repeat some experiments performed with it. RE pruningis arguably one of the simplest pruning algorithms but oftenoffers competitive performance. RE is a ordering-basedpruning method. It starts with an empty ensemble and itera-tively adds that tree which minimizes the overall ensembleerror the most until K members have been selected. Algo-rithm 1 depicts this approach where L is the 0− 1 loss andei denotes the unit vector with a ‘1’ entry at position i.

We will now perform experiments in the spirit of (Martınez-Munoz & Suarez, 2006), but adapt a more modern approachto training the base ensembles. In the original experiments,the authors show that when pruning a Bagging Ensembleof 200 pruned CART trees, that RE (among other methods)achieves a better accuracy with fewer trees compared tothe original ensemble. This result has been empiricallyreproduced in various contexts (see e.g. (Margineantu &Dietterich, 1997; Zhou et al., 2002; Zhou, 2012)) and hasbeen formalized in the Many-Could-Be-Better-Than-All-Theorem (Zhou et al., 2002). It shows that the error of anensemble excluding the k−th classifier can be smaller thanthe error of the original ensemble if the bias Ck,k is largerthan its variance wrt. to the ensemble:

M∑

i=1,i6=k

M∑

j=1,i6=k

Ci,j(M − 1)2

≤M∑

i=1

M∑

h=1

Ci,jM2

(4)

⇔ −2M∑

i=1,i6=kCi,k ≤ Ck,k (5)

where

Ck,k = Ex,y∼D[(hk(x)− y)2

](6)

Ck,i = Ex,y∼D [(hk(x)− y)(hi(x)− y)] (7)

Recall that the bias of a DT rapidly decreases while thevariance increases wrt. to the size of the tree (Domingos,2000). The original experiment used pruned decision treeswhereas the today’s accepted standard is to train trees aslarge as possible for minimal errors (see (Breiman, 2000;Biau, 2012; Denil et al., 2014; Biau & Scornet, 2016) for

Improving the Accuracy-Memory Trade-Off of Random Forests Via Leaf-Refinement

more formal arguments on this). Hence, it is conceivablethat ensemble pruning does not have the same beneficialeffect on ‘modern’ Random Forests compared to RF-likeensembles trained 20 years ago. We will now investigatethis hypothesis experimentally. As an example we will con-sider the EEG dataset which has 14 980 datapoints with 14attributes and two classes (details for each dataset can befound in the appendix). By today’s standards this datasetis small to medium size which allows us to quickly trainand evaluate different configurations but it is roughly twotimes larger than the biggest dataset used in original exper-iments. We perform experiments as follows: Oshiro et al.showed in (Oshiro et al., 2012) empirically on a variety ofdatasets that the prediction of a RF stabilizes between 128and 256 trees and adding more trees to the ensemble doesnot yield significantly better results. Hence, we train the‘base’ Random Forests with M = 256 trees. To control theindividual errors of trees we set the maximum number of leafnodes nl to values between nl ∈ {64, 128, 256, 512, 1024}.For ensemble pruning we use RE which is tasked to se-lect K ∈ {2, 4, 8, 16, 32, 64, 128, 256} trees from the orig-inal RF. We compare this against a smaller RF with K ∈{2, 4, 8, 16, 32, 64, 128, 256} trees, so that we recover theoriginal RF for K = M = 256 on both cases. For RE weuse the training data as pruning set. Experiments with adedicated pruning set can be found in the appendix. Figure1 shows the average accuracy over the size of the ensemblefor a 5-fold cross-validation. The dashed lines depict thesmaller RF and solid lines are the corresponding prunedensemble. As expected, we find that ensemble pruning sig-nificantly improves the accuracy when smaller trees with64− 256 leaf nodes are used. Moreover, the performanceof the pruned forests approaches the performance of theoriginal forests when more and more trees are added muchlike in the original experiments. However, the improvementin accuracy becomes negligible for trees with up to 1024leaf nodes. Here, the accuracy of the pruned and the un-pruned forest are near identical for any given number oftrees. Maybe even worse, if we are only interested in themost accurate model then there is no reason to prune theensemble as an unpruned Random Forest already seems toachieves the best performance.

We acknowledge that this experiment is one-sided becausewe only use Reduced Error Pruning – a nearly 25 year oldmethod – for comparison. Maybe the problem simply liesin RE itself and not pruning in general? To verify thishypothesis we also repeated the above experiment with 6additional pruning algorithms from the three different cat-egories. In total we compare two ranking-based methodsnamely IE (Jiang et al., 2017) and IC (Lu et al., 2010);the three ordering-based methods RE (Margineantu & Diet-terich, 1997), DREP (Li et al., 2012) and COMP (Martınez-Munoz & Suarez, 2004) and the two clustering-based prun-

0 50 100 150 200 250Number of trees

77.5

80.0

82.5

85.0

87.5

90.0

92.5

Accu

racy

RE nl = 1024RF nl = 1024RE nl = 512RF nl = 512RE nl = 256RF nl = 256RE nl = 128RF nl = 128RE nl = 64RF nl = 64

Figure 1. 5-fold cross-validation accuracy over the number of mem-bers in the ensemble for different nl parameters on the EEG dataset.Dashed lines depict the small RF and solid lines are the prunedensemble via Reduced Error pruning. Best viewed in color.

nl K COMP DREP IC IE LMD RE RF

64 8 81.86 80.79 81.71 81.34 81.46 82.22 80.9232 83.09 82.33 83.10 82.22 82.60 83.23 81.98128 83.17 82.38 83.10 82.49 82.87 83.19 82.34

128 8 85.12 84.08 84.69 84.81 83.85 85.53 84.2332 86.34 85.49 86.38 85.76 85.65 86.62 85.17128 86.40 85.75 86.27 86.00 86.03 86.54 85.92

256 8 87.37 86.24 87.14 87.16 86.36 87.46 86.4432 88.97 88.02 89.07 88.70 88.37 89.01 88.16128 88.97 88.70 89.15 88.97 88.77 89.07 88.71

512 8 88.36 88.51 88.96 88.78 87.44 88.79 87.9532 91.11 90.30 91.34 90.67 90.37 90.68 90.17128 91.22 90.91 91.41 91.30 90.87 91.23 90.83

1024 8 89.45 89.26 89.51 89.70 88.30 88.85 88.8332 92.25 92.30 92.64 92.60 91.82 92.21 91.91128 92.85 92.85 93.17 92.98 92.70 92.84 92.70

Table 2. 5-fold cross-validation accuracy over the number of mem-bers K ∈ {8, 32, 128} in the ensemble for different nl parametersand different methods on the EEG dataset. Rounded to the seconddecimal digit. Larger is better. The best method is depicted inbold.

ing CA (Lazarevic & Obradovic, 2001) and LMD (Giacintoet al., 2000). We also experimented with MQIP pruningmethods (Zhang et al., 2006; Cavalcanti et al., 2016), butunfortunately the MQIP solver (in our case Gurobi1) usedduring experiments would frequently fail or time-out. Thuswe decided to not include any MQIP pruning methods inour evaluation.

Table 2 shows the result of this experiment. For spacereasons we only depict results for K ∈ {8, 32, 128}. Asexpected, all pruning methods manage to improve the per-formance of the original RF for smaller nl ≤ 256 and keepthis advantage to some degree for larger nl. However, thisadvantage becomes smaller and smaller for larger nl until itis virtually non-existent for nl = 1024 and the accuraciesare near identical. Again, as expected setting nl to larger

1https://www.gurobi.com/

Improving the Accuracy-Memory Trade-Off of Random Forests Via Leaf-Refinement

values leads to the overall best accuracy.

For presentational purposes we highlighted this experimenton the EEG dataset, but we found that this behavior seemsto hold universally across the other 15 datasets we experi-mented with. The detailed results for these experiments aregiven in the appendix. While the specific curves would dif-fer we always found that the performance of a well-trainedforest and its pruned counterpart would nearly match oncethe individual trees become large enough. For more plotswith experiments on other datasets and other ‘base’ ensem-bles please consult the appendix.

4 IMPROVING THE ACCURACY-MEMORYTRADE-OFF OF RF

Clearly, the previous section shows that we cannot expectthe accuracy of a pruned forest to improve much upon theperformance of a well-trained Random Forest. On the onehand, this is a clear argument in favor of Random Forests– why should we prune a pre-trained forest if we can di-rectly train a similar forest in the first place? On the otherhand, pruning shows clear superior performance for smallernl compared to RF. While pruning and RF both convergeagainst a very similar maximum accuracy, pruning showsa better trade-off between the model size (controlled by nland K) and the accuracy.

We argue that, from a hardware perspective, this trade-offis what really matters and a good algorithm should pro-duce accurate models for a variety of different model sizes.Ensemble pruning improves this trade-off by removing un-necessary trees from the ensemble thereby reducing thememory consumption while keeping (or improving) its pre-dictive power. But, the removal of entire trees does not offera very fine-grained control over this trade-off. For exam-ple, it could be better to train a large forest with many, butcomparably small trees instead of having one small forestof large trees. Hence, we propose to directly evaluate theaccuracy-memory trade-off and to optimize towards it.

To do so, we present a simply and surprisingly effectivemethod which refines the predictions of a given forest withStochastic Gradient Descent (SGD). Our method trains asmall initial Random Forest (e.g. by using small values fornl and M ) and then refines the predictions of the individualtrees to improve the overall performance: Recall that DTsuse a series of axis-aligned splits of the form 1{xi ≤ t} and1{xi > t} where i is a pre-computed feature index and t isa pre-computed threshold to determine the leaf nodes. Letsl(x) : X → {0, 1} be the series of splits which is ‘1’ if xbelongs to leaf l and ‘0’ if not, then the prediction of a treeis given by

hi(x) =

Li∑

l=1

yi,lsi,l(x) (8)

where yi,l ∈ RC is the (constant) prediction value of leafl and Li is the total number of leaves in tree hi. Let θibe the parameter vector of tree hi (e.g. containing splitvalues, feature indices and leaf-predictions) and let θ =(θ1, . . . , θM ) be the parameter vector of the entire ensemblefθ. Then our goal is to solve

argminθ

1

N

(x,y)∈S` (fθ(x), y) (9)

for a given loss `. We propose to minimize this objective viastochastic gradient-descent. SGD is an iterative algorithmwhich takes a small step into the negative direction of thegradient in each iteration t by using an estimation of thetrue gradient

θt+1 ← θt − αtgB(θt) (10)

where

gB(θt) = ∇θt

(x,y)∈B` (fθt(x), y)

(11)

is the gradient of ` wrt. to θt computed on a mini-batch B.

Unfortunately, the axis-aligned splits of a DT are not differ-entiable and thus it is difficult to refine them further withgradient-based approaches. However, the leaf predictionsyi,l are simple constants that can easily be updated via SGD.Formally, we use θi = (yi,1, yi,2, . . . ) leading to

gB(θti) =

1

|B|

(x,y)∈B

∂`(fθt(x), y)

∂fθt(x)wisi,l(x)

l=1,2,...,Li

(12)

Algorithm 2 summarizes this approach. First, inget forest a forest withK trees each containing at mostnl leaf nodes is loaded. This forest can either be a pre-trained forest with M trees from which we randomly sam-ple K trees or we may train an entirely new forest with Ktrees directly. Once the forest has been obtained SGD isperformed over the leaf-predictions of each tree using thestep-size αt ∈ R+ to minimize the given loss `.

Leaf-Refinement is a flexible technique and can be usedin combination with any tree ensemble such as Bagging(Breiman, 1996), ExtraTrees (Geurts et al., 2006), Ran-dom Subspaces (Ho, 1998) or Random Patches (Louppe &Geurts, 2012). Moreover, we can also refine the individ-ual weights wi of the trees via SGD, although we did notfind a meaningful improvement optimizing the weights andleafs simultaneously in our pre-experiments. For simplicitywe will only focus on leaf-refinement in this paper withoutoptimizing the individual weights and leave this for futureresearch.

Improving the Accuracy-Memory Trade-Off of Random Forests Via Leaf-Refinement

Algorithm 2 RF with Leaf-Refinement (RF-LR).1: {Load forest and use constant weights}2: h← get forest(K,nl)3: w ← (1/K, . . . , 1/K)4: {Init. leaf predictions}5: for i = 1, . . . ,K do6: θi ← (yi,1, yi,2, . . . )7: end for8: {Perform SGD using Eq. 10 + Eq. 12}9: for receive batch B do

10: for i = 1, . . . ,K do11: θti ← θti − αtgB(θti)12: end for13: end for

5 EXPERIMENTS

In this section we experimentally evaluate our method andcompare its accuracy-memory trade-off with regular RF andpruned RF. As argued before, our main concern is the fi-nal model size as it determines the resource consumption,runtime, and energy of the model application during deploy-ment(Buschjager & Morik, 2017; Buschjager et al., 2018).The model size is computed as follows: A baseline imple-mentation of DTs stores each node in an array and iteratesover it (Buschjager et al., 2018). Each node inside the arrayrequires a pointer to the left / right child (8 bytes in total),a boolean flag if it is a leaf-node (1 byte), the feature indexas well as the threshold to compare the feature against (8bytes). Last, entries for the class probabilities are requiredfor the leaf nodes (4 bytes per class). Thus, in total, a singlenode requires 17+ 4 ·C Bytes per node which we sum overall nodes in the entire ensemble.

We follow a similar experimental protocol as before: Asearlier we train various Random Forests with M = 256trees using nl ∈ {64, 128, 256, 512, 1024}. Again, we com-pare the aforementioned pruning methods COMP, DREP,IC, IE, LMD and RE with our leaf-refinement method(RF-LR) as well as a random selection of trees fromthe RF. Since our method shares some overlap with gra-dient boosted trees (GB, (Friedman, 2001)) we also in-clude these in our evaluation. Each pruning method istasked to select K ∈ {8, 16, 32, 64, 128} trees from the‘base’ forest. For DREP, we additionally varied ρ ∈{0.25, 0.3, 0.35, 0.4, 0.45, 0.5}. For GB we use the de-viance loss and train {8, 16, 32, 64, 128} trees with the dif-ferent nl values. For RF-LR we randomly sample K ∈{8, 16, 32, 64, 128} trees from the given forest and perform50 epochs2 of SGD with a constant step size α = 0.1 and abatch size of 128. We experimented with the mean-squarederror (MSE) and the cross-entropy loss for minimization, but

2In one epoch we iterate once over the entire dataset.

could not find meaningful differences between both losses.Hence, for these experiments we focus on the MSE loss. Inall experiments we perform a 5-fold cross validation exceptwhen the dataset comes with a given train/test split. We usethe training set for both, training the initial forest and prun-ing it. For a fair comparison we made sure that each methodreceives the same forest in each cross-validation run. In allexperiments, we use minimal pre-processing and encode cat-egorical features as one-hot encoding. The base ensembleshave been trained with Scikit-Learn (Pedregosa et al., 2011)and the code for our experiments and all pruning methodsare included in this submission. We implemented all prun-ing algorithm in a Python package for other researcherscalled PyPruning which is available under https://github.com/sbuschjaeger/PyPruning. Thecode for the experiments in this paper are avail-able under https://github.com/sbuschjaeger/leaf-refinement-experiments. In total we per-formed 8 960 experiments on 16 different datasets whichare detailed in the appendix. Additionally, more experimentswith different ‘base’ ensembles and a dedicated pruning setare shown in the appendix.

5.1 Qualitative Analysis

We are interested in the most accurate models with the small-est memory consumption. Clearly these two metrics cancontradict each other. For a fair comparison we thereforeuse the best parameter configuration of each method acrossboth dimensions. More specifically, we compute the Paretofront of each method which contains those parameter con-figurations which are not dominated across one or moredimensions. For space reasons we start with a qualitativeanalysis and focus the EEG and the chess dataset as they rep-resent distinct behaviors we found during our experiments.

Figure 2 shows the results on the EEG dataset. As before,the accuracy ranges from 75% to 92.5% and the modelsize ranges from a few KB to roughly 12MB (note thelogarithmic scale on the x-axis). As before, larger modelsseem to generally perform better and all models seem toconverge against a similar solution, expect GB which isstuck around 85% accuracy. In the range of 0− 4000 KB,however, there are larger differences. For example, forroughly 1000 KB, CA performs sub-optimal only reachingan accuracy around 87.5% whereas the other methods allseem to have a similar performance around 90% exceptRF-LR which has an accuracy around 91%. For smallermodel sizes below 4000 KB RF-LR seems to be the clearwinner offering roughly up to 1% more accuracy comparedto the other methods. Moreover, it shows a better overallaccuracy-memory trade-off.

Figure 3 shows the results on the chess dataset. Here theaccuracy ranges from 28% to 75% with model sizes up

Improving the Accuracy-Memory Trade-Off of Random Forests Via Leaf-Refinement

101 102 103 104

Model Size [KB]

0.750

0.775

0.800

0.825

0.850

0.875

0.900

0.925

Accu

racy

CACOMPDREPGBICIELMDRERFRF-LR

Figure 2. 5-fold cross-validation accuracy over the size of the en-semble on the EEG dataset. Single points are the individual param-eter configurations whereas the solid line depicts the correspondingPareto front. Best viewed in color.

101 102 103 104

Model Size [KB]

0.3

0.4

0.5

0.6

0.7

Accu

racy

CACOMPDREPGBICIELMDRERFRF-LR

Figure 3. 5-fold cross-validation accuracy over the size of the en-semble on the chess dataset. Single points are the individual param-eter configurations whereas the solid line depicts the correspondingPareto front. Best viewed in color.

to 12 MB (again note the logarithmic scale on the x-axis).Similar to before, the pruning methods all converge againstsimilar solutions just above 65%. CA still seems to performpoorly for smaller model sizes, but not as bad as on the EEGdata. Similar, GB also seems to struggle on this dataset.It is worth noting, that some pruning methods (e.g. IC orRE) have a better accuracy-memory trade-off compared toRandom Forest and they outperform the original forest byabout 2%. RF-LR offers the best performance on this datasetand outperforms the original forest by about 8% accuracyacross all model sizes. This effect is only present for RF-LRand cannot be seen for the other methods. Overall, RF-LRoffers a much better accuracy-memory trade-off and offersthe best overall accuracy.

Conclusion: First we find that the well-performing RF mod-els often require more than 1 MB easily breaking the avail-able memory on small MCUs (cf. Table 1). Second, wefound two different behaviors of RF-LR: In many cases allmethods converge against a similar accuracy when morememory is available, e.g. as seen in Figure 2. This can

be expected since all methods derive their models from thesame RF model. Here, RF-LR often has better models andhence offers a better accuracy-memory trade-off. In manyother cases we found that RF-LR significantly outperformsthe other methods and offers a much better accuracy acrossmost model sizes, e.g. as depicted in Figure 3. In these cases,RF-LR offers a much better accuracy-memory trade-off andthe best overall accuracy.

5.2 Quantitative Analysis

The previous section showed that RF-LR can offer substan-tial improvements on some datasets and smaller improve-ments in other cases. To give a more complete picture wewill now look at the performance of each method under var-ious memory constraints. Table 3 shows the best accuracyof each method (across all hyperparameter configurations)with a final model size below 64 KB. Such models couldfor example easily be deployed on an Arduino Due MCU(cf. Table 1). We find that RF-LR offers the best accuracyin 9 out of 16 cases followed by RE which is first in 4 casesfollowed by GB with ranks first in 3 cases. IE shares thefirst place with RE on the mozilla dataset. On some datasetssuch as ida2016 the differences are comparably small whichcan be expected since all models are derived from the samebase Random Forest. However, on other datasets such asthe eeg, chess, japanese-vowels or connect dataset we canfind more substantial improvements where RF-LR offers upto 5% better accuracy to the second ranking method.

A similar picture can be find in Table 4 which shows the bestaccuracy of each method (across all hyperparameter configu-rations) with a final model size below 256 KB. Such modelscould for example easily be deployed on an STM32F4 MCU(cf. Table 1). Now RF-LR offers the best accuracy in 10out of 16 cases followed by RE which is first in only 1 casefollowed by GB with ranks first in 2 cases and IC which isnow first in 3 cases. IE now shares the first place with IC onthe mozilla dataset. As before, the differences are compa-rably small on some datasets (e.g. the mozilla dataset) andmore substantial on other datasets where RF-LR now offersup 6% better accuracy against the second best method.

To give a more complete picture across different memoryconstraints we will now summarize the performance of eachmethod by the (normalized) area-under the Pareto front: In-tuitively, we want to have an algorithm which gives smalland accurate models and therefore places itself in the upper-left corner of the accuracy-memory plots. Similar to ‘reg-ular’ ROC-AUC curves we can compute the area underthe Pareto front (APF) normalized by the biggest model tosummarize the accuracy for different models on the samedataset. Table 5 depicts the normalized APF for the experi-ments. Looking at RF-LR, we see that it is the clear winner.In total, it is the best method on 11 of 14 datasets, shares the

Improving the Accuracy-Memory Trade-Off of Random Forests Via Leaf-Refinement

model CA COMP DREP GB IC IE LMD RE RF RF-LR

adult 85.455 85.777 85.618 86.616 85.799 85.882 85.378 86.128 85.464 86.241anura 96.511 97.137 96.873 95.024 97.192 96.928 96.539 97.067 96.525 97.512avila 91.930 96.957 95.318 67.724 96.760 96.689 86.965 97.048 92.534 94.278bank 89.772 90.049 89.927 90.677 90.213 90.330 89.819 90.336 89.830 90.522chess 48.025 51.714 50.492 34.969 50.356 51.793 49.041 52.495 48.090 57.382connect 72.426 73.898 73.409 70.847 73.724 73.832 73.110 74.134 72.666 77.498eeg 84.419 85.574 84.419 82.463 84.780 85.033 83.852 85.527 84.606 86.622elec 83.523 83.620 84.075 83.878 82.749 84.556 82.817 84.680 83.391 84.894ida2016 99.044 99.119 99.025 99.094 99.106 99.100 99.031 99.125 99.075 99.219japanese-vowels 90.061 91.487 91.045 87.341 91.517 90.332 90.794 91.587 90.503 93.173magic 86.109 86.613 86.282 87.355 86.692 86.771 86.456 86.845 86.419 86.997mnist 80.700 85.700 84.300 74.400 84.700 84.100 85.000 84.900 84.200 87.000mozilla 94.590 94.764 94.661 94.590 94.815 94.860 94.468 94.860 94.545 94.699nomao 95.508 95.804 95.575 95.958 95.749 95.819 95.358 95.802 95.633 96.063postures 79.913 81.688 80.827 69.058 81.137 80.996 79.599 81.727 80.246 81.081satimage 88.647 88.880 88.663 87.449 88.911 88.616 88.647 89.020 88.538 88.834

Table 3. Test accuracies for models with a memory consumption below 64 KB for each method and each dataset averaged over a 5 foldcross validation. Rounded to the third decimal digit. Larger is better. The best method is depicted in bold. More details on the experimentsand datasets can be find in the appendix.

model CA COMP DREP GB IC IE LMD RE RF RF-LR

adult 85.774 86.174 85.956 87.135 86.011 86.232 85.738 86.272 85.799 86.508anura 96.511 97.818 97.748 97.429 98.040 97.929 97.582 97.818 97.735 98.013avila 95.016 99.022 97.427 82.820 99.176 99.123 93.315 99.248 96.526 98.807bank 89.967 90.297 90.082 90.737 90.290 90.443 89.952 90.471 90.038 90.874chess 56.911 59.998 57.314 44.678 59.791 59.428 57.496 60.636 56.238 66.852connect 74.522 76.270 75.119 76.170 76.239 76.333 75.100 76.303 74.997 80.340eeg 87.223 88.364 88.511 85.734 88.959 88.778 87.784 88.785 87.951 90.454elec 85.220 85.810 85.832 85.748 86.043 86.692 84.922 86.562 85.362 87.829ida2016 99.106 99.225 99.119 99.169 99.262 99.175 99.238 99.175 99.194 99.244japanese-vowels 91.979 94.810 94.428 94.860 94.790 94.077 94.278 94.709 94.408 96.205magic 86.655 87.281 87.218 87.733 87.234 87.239 87.302 87.365 86.950 87.570mnist 86.900 90.100 89.300 84.600 90.600 89.700 88.800 89.600 89.300 91.800mozilla 94.731 95.034 94.982 94.989 95.092 95.092 94.802 94.995 94.912 95.014nomao 96.039 96.222 96.150 96.408 96.318 96.269 96.077 96.356 96.135 96.539postures 88.587 89.596 88.747 81.100 89.231 89.390 88.085 89.633 88.281 90.504satimage 88.802 90.218 89.891 89.782 89.705 89.891 90.000 90.156 90.016 90.715

Table 4. Test accuracies for models with a memory consumption below 256 KB for each method and each dataset averaged over a 5 foldcross validation. Rounded to the third decimal digit. Larger is better. The best method is depicted in bold. More details on the experimentsand datasets can be find in the appendix.

Improving the Accuracy-Memory Trade-Off of Random Forests Via Leaf-Refinement

CA COMP DREP GB IC IE LMD RE RF RF-LR

chess 0.6251 0.6628 0.6363 0.6265 0.6638 0.6489 0.6486 0.6644 0.6441 0.7290connect 0.7570 0.7712 0.7608 0.7780 0.7733 0.7726 0.7623 0.7737 0.7607 0.8219eeg 0.9050 0.9242 0.9240 0.8570 0.9276 0.9258 0.9224 0.9242 0.9225 0.9319elec 0.8667 0.8767 0.8722 0.8572 0.8787 0.8779 0.8714 0.8783 0.8720 0.8974postures 0.9390 0.9497 0.9436 0.9105 0.9504 0.9486 0.9460 0.9501 0.9460 0.9688

anura 0.9710 0.9791 0.9790 0.9766 0.9795 0.9791 0.9780 0.9792 0.9779 0.9800bank 0.9018 0.9050 0.9038 0.9073 0.9052 0.9050 0.9034 0.9052 0.9034 0.9083japanese-vowels 0.9568 0.9721 0.9717 0.9734 0.9731 0.9712 0.9719 0.9722 0.9707 0.9741magic 0.8748 0.8783 0.8786 0.8772 0.8793 0.8788 0.8788 0.8795 0.8783 0.8808mnist 0.9295 0.9393 0.9399 0.9377 0.9415 0.9400 0.9393 0.9403 0.9366 0.9432nomao 0.9647 0.9678 0.9676 0.9640 0.9681 0.9678 0.9679 0.9677 0.9678 0.9682

adult 0.8620 0.8638 0.8630 0.8712 0.8642 0.8640 0.8627 0.8639 0.8631 0.8656avila 0.9715 0.9924 0.9897 0.9909 0.9965 0.9963 0.9750 0.9930 0.9886 0.9928ida2016 0.9901 0.9916 0.9908 0.9915 0.9913 0.9909 0.9909 0.9908 0.9907 0.9912mozilla 0.9493 0.9520 0.9520 0.9498 0.9522 0.9525 0.9513 0.9526 0.9519 0.9526satimage 0.9059 0.9135 0.9133 0.9119 0.9147 0.9150 0.9140 0.9135 0.9138 0.9148

Table 5. Normalized area under the Pareto front (APF) for each method and each dataset averaged over a 5 fold cross validation. Roundedto the fourth decimal digit. Larger is better. The best method is depicted in bold.

first place on 1 dataset (mozilla), is the second best methodon 1 data-set (satimage), third best method (ida2016) andfourth best methond (avila) each on one dataset. In the firstblock of datasets (chess, connect, eeg, elec, postures) RF-LR achieves substantial improvements with 1%−8% higheraccuracies on average. Looking at the second block (adult,anura, bank, magic, mnist, nomao, japanese-vowels) RF-LRis still the best method, but the differences are smaller thanbefore. Finally, in block three (ida2016,mozilla,satimage)RF-LR is not the best method alone anymore, but ranksamong the best methods.

Table 5 implies that RF-LR can offer substantial improve-ments in some cases and moderate improvement in manyother cases. To give a statistical meaningful comparisonwe present the results in Table 5 as a CD diagram (Demsar,2006). A CD diagram ranks each method according to itsperformance on each dataset. Then, a Friedman-Test isperformed to determine if there is a statistical differencebetween the average rank of each method. If this is thecase, a pairwise Wilcoxon-Test between all methods is usedto check whether there is a statistical difference betweentwo classifiers. CD diagrams visualize this evaluation byplotting the average rank of each method on the x-axis andconnect all classifiers whose performances are statisticallysimilar via a horizontal bar.

Figure 4 shows the CD diagram for the experiments,where p = 0.95 was used for all statistical tests. RF-LRis the clear winner in this comparison. Its averagerank is close to 1.5 and it has some distance to thesecond best method IC with an average rank around

12345678910

RF-LRIC

REIE

COMPLMDDREPRFGBCA

Figure 4. CD-Diagram for the normalized area under the Paretofront for different methods over multiple datasets. For all statisticaltests p = 0.95 was used. More to the right (lower rank) is better.Methods in connected cliques are statistically similar.

2.5. It offers a statistically better performance comparedto {RE, IE,COMP,LMD,DREP,RF,GB,CA}.The second clique is given by{IC,RE, IE,COMP,LMD,DREP,RF,GB} withranks around 2.5 − 7. Overall, RE places third with anaverage rank around 4 which shows that a simple methodcan perform surprisingly well. We hypothesize that sinceRE minimizes the overall ensemble loss that it finds agood balance between the bias and the diversity of theensemble as e.g. discussed in (Buschjager et al., 2020).Next, {RF,GB,CA} form the last clique with statisticallysimilar performances which shows that a unpruned RF andGB doe not offer a good accuracy-memory trade-off. CAranks last with some distance to the other methods. We arenot sure why CA has such a bad performance and suspect abug in our implementation which we could not find so far.

Improving the Accuracy-Memory Trade-Off of Random Forests Via Leaf-Refinement

5.3 Case-Study On Raspberry Pi0

To showcase the effectiveness of our approach we will nowcompare the performance of ensemble pruning and leaf-refinement on a Raspberry Pi0. The Raspbery Pi0 has 512MB RAM and uses a BCM 2835 SOC CPU clocked at 1GHz. This makes it considerably more powerful than theMCUs mentioned in Table 1, but also allows us to run a fullLinux environment which simplifies the evaluation. Againwe will now focus on the EEG dataset as our standard ex-ample. From our previous experiment we selected pruningconfigurations that resulted in an ensemble size below 256KB and generate ensemble-specific C++ code as outline in(Buschjager et al., 2018) which is then compiled on the Pi0itself3. We compare the latency, the accuracy and the totalbinary size of these implementations. Note that the totalbinary size may exceed 256 KB because the binary alsocontains additional functions from the standard library aswell as a start routine and the corresponding ELF header.However, this overhead is the same for all implementations.For simplicity we measure the accuracy as well as the la-tency using the first cross-validation set. To ensure a faircomparison we repeat each experiment 5 times. Table 6contains the results for this evaluation. As one can see thebinary sizes range from 268 KB to roughly 800 KB and eachimplementation requires 0.8 to 1.6 µs to classify a singleobservation. As expected, RF-LR offers the best accuracyaround 91 % while ranking third in memory usage. Some-what surprisingly, RF-LR has a comparably high latency.We conjecture that the structure of the trees in RF-LR isnot very homogeneous which seems to be beneficial for theaccuracy, but may hurt the caching behavior of the trees.A more thorough discussion can be found in (Buschjageret al., 2018) on this topic and a combination of of bothapproaches should be considered in future research. Nev-ertheless, this evaluation shows that our approach can beapplied in a real-world scenario and we believe that theseresults can be transferred to other hardware architectures aswell.

6 CONCLUSION

Ensemble algorithms are among the state-of-the-art in manymachine learning applications. With the ongoing integra-tion of ML models into everyday life, the deployment andcontinuous application of models becomes more and morean important issue. By today’s standard, Random Forestsare trained with large trees for the best performance whichcan challenge the resources of small devices and sometimesmake deployment impossible. Ensemble pruning is a stan-

3For these experiments we excluded Gradient Boosting (GB)because scikit learn trains individual trees for each class instead ofprobability vectors which would have required substantial refactor-ing of our experiments.

Method Accuracy Size [Bytes] Latency [µs/obs.]

CA 86.2817 268 536 0.80107COMP 89.8531 689 712 1.06809DREP 88.7850 342 696 1.00134IC 89.2523 793 280 1.06809IE 88.8518 743 232 1.00134LMD 88.8518 784 896 1.06809RE 89.2523 792 456 1.13485RF 89.5194 588 336 1.60214RF-LR 91.0881 588 088 1.46862

Table 6. Accuracy, Size and Latency on a Raspberry Pi0. Modelsare filtered so that the ensemble size does not exceed 256 KB.

dard technique to remove unnecessary classifiers from theensemble to reduce the overall resource consumption whilepotentially improving its accuracy. This makes ensemblepruning ideal to bring accurate ensembles to small devices.While ensemble pruning improves the performance of en-sembles of small trees we found that this improvement di-minishes for ensembles of large trees. Moreover, it does notoffer fine-grained control over this trade-off because it re-moves entire trees at once from the ensemble. We argue that,from a hardware perspective, the fine-grained control overthe accuracy-memory trade-off is what really matters. Wepropose a simple and surprisingly effective algorithm whichrefines the predictions of the trees in a forest using SGD.We compared our Leaf-Refinement method against 7 state-of-the-art pruning methods on 16 datasets. Leaf-Refinementoutperforms the other methods on 11 of 16 datasets witha statistically significant better accuracy-memory trade-offcompared to most methods. In a small study we showedthat our approach can be applied in real-world scenarios.and we believe that our results can be transferred to otherhardware architectures. Since our approach is orthogonalto existing approaches it can be freely combined with othermethods for efficient deployment. Hence future researchshould include not only the combination of more diversehardware, but also the combination of different methods.

REFERENCES

Barros, R. C., de Carvalho, A. C. P. L. F., and Freitas, A. A.Decision-Tree Induction, pp. 7–45. Springer InternationalPublishing, Cham, 2015. ISBN 978-3-319-14231-9. doi:10.1007/978-3-319-14231-9 2. URL https://doi.org/10.1007/978-3-319-14231-9_2.

Biau, G. Analysis of a random forests model. Journal ofMachine Learning Research, 13(Apr):1063–1095, 2012.

Biau, G. and Scornet, E. A random forest guided tour. Test,25(2):197–227, 2016.

Branco, S., Ferreira, A. G., and Cabral, J. Machine learning

Improving the Accuracy-Memory Trade-Off of Random Forests Via Leaf-Refinement

in resource-scarce embedded systems, fpgas, and end-devices: A survey. Electronics, 8(11):1289, 2019.

Breiman, L. Bagging predictors. Machine learning, 24(2):123–140, 1996.

Breiman, L. Some infinity theory for predictor ensembles.Technical report, Technical Report 579, Statistics Dept.UCB, 2000.

Buschjager, S. and Morik, K. Decision tree and randomforest implementations for fast filtering of sensor data.IEEE Transactions on Circuits and Systems I: RegularPapers, 65(1):209–222, 2017.

Buschjager, S., Pfahler, L., and Morik, K. Generalizednegative correlation learning for deep ensembling. arXivpreprint arXiv:2011.02952, 2020.

Buschjager, S., Chen, K., Chen, J., and Morik, K. Real-ization of random forest for real-time evaluation throughtree framing. In ICDM, pp. 19–28, 2018. doi: 10.1109/ICDM.2018.00017.

Cavalcanti, G. D., Oliveira, L. S., Moura, T. J., and Car-valho, G. V. Combining diversity measures for ensemblepruning. Pattern Recognition Letters, 74:38–45, 2016.

Choudhary, T., Mishra, V., Goswami, A., and Sarangapani,J. A comprehensive survey on model compression andacceleration. Artificial Intelligence Review, 53(7):5113–5155, 2020.

Cortes, C., Mohri, M., and Syed, U. Deep boosting. InProceedings of the Thirty-First International Conferenceon Machine Learning (ICML 2014), 2014.

Demsar, J. Statistical comparisons of classifiers over multi-ple data sets. The Journal of Machine Learning Research,7:1–30, 2006.

Denil, M., Matheson, D., and De Freitas, N. Narrowingthe gap: Random forests in theory and in practice. InInternational conference on machine learning (ICML),2014.

Domingos, P. A unified bias-variance decomposition forzero-one and squared loss. AAAI/IAAI, 2000:564–569,2000.

Friedman, J. H. Greedy function approximation: a gradientboosting machine. Annals of statistics, pp. 1189–1232,2001.

Geurts, P., Ernst, D., and Wehenkel, L. Extremely random-ized trees. Machine learning, 63(1):3–42, 2006.

Giacinto, G., Roli, F., and Fumera, G. Design of effectivemultiple classifier systems by clustering of classifiers. InProceedings 15th International Conference on PatternRecognition. ICPR-2000, volume 2, pp. 160–163. IEEE,2000.

Guo, H., Liu, H., Li, R., Wu, C., Guo, Y., and Xu, M.Margin & diversity based ordering ensemble pruning.Neurocomputing, 275:237–246, 2018.

Ho, T. K. The random subspace method for constructingdecision forests. IEEE transactions on pattern analysisand machine intelligence, 20(8):832–844, 1998.

Jiang, Z., Liu, H., Fu, B., and Wu, Z. Generalized ambigu-ity decompositions for classification with applications inactive learning and unsupervised ensemble pruning. 31stAAAI Conference on Artificial Intelligence, AAAI 2017,pp. 2073–2079, 2017.

Koltchinskii, V. et al. Empirical margin distributions andbounding the generalization error of combined classifiers.The Annals of Statistics, 30(1):1–50, 2002.

Kumar, A., Goyal, S., and Varma, M. Resource-efficientmachine learning in 2 kb ram for the internet of things.In International Conference on Machine Learning, pp.1935–1944. PMLR, 2017.

Lazarevic, A. and Obradovic, Z. Effective pruning of neuralnetwork classifier ensembles. In IJCNN’01, volume 2,pp. 796–801. IEEE, 2001.

Li, N., Yu, Y., and Zhou, Z.-H. Diversity regularized en-semble pruning. In ECML PKDD, pp. 330–345. Springer,2012.

Louppe, G. and Geurts, P. Ensembles on random patches.In Joint European Conference on Machine Learningand Knowledge Discovery in Databases, pp. 346–361.Springer, 2012.

Lu, Z., Wu, X., Zhu, X., and Bongard, J. Ensemble pruningvia individual contribution ordering. In Proc. of the ACMSIGKDD, pp. 871–880, 2010.

Margineantu, D. D. and Dietterich, T. G. Pruning adaptiveboosting. In ICML, volume 97, pp. 211–218, 1997.

Martınez-Munoz, G. and Suarez, A. Aggregation orderingin bagging. In Proc. of the IASTED, pp. 258–263, 2004.

Martınez-Munoz, G. and Suarez, A. Pruning in orderedbagging ensembles. In ICML, pp. 609–616, 2006.

Martınez-Munoz, G., Hernandez-Lobato, D., and Suarez,A. An analysis of ensemble pruning techniques basedon ordered aggregation. IEEE Transactions on PatternAnalysis and Machine Intelligence, 31(2):245–259, 2008.

Improving the Accuracy-Memory Trade-Off of Random Forests Via Leaf-Refinement

Oshiro, T. M., Perez, P. S., and Baranauskas, J. A. Howmany trees in a random forest? In International work-shop on machine learning and data mining in patternrecognition, pp. 154–168. Springer, 2012.

Pedregosa, F., Varoquaux, G., Gramfort, A., Michel, V.,Thirion, B., Grisel, O., Blondel, M., Prettenhofer, P.,Weiss, R., Dubourg, V., Vanderplas, J., Passos, A., Cour-napeau, D., Brucher, M., Perrot, M., and Duchesnay, E.Scikit-learn: Machine learning in Python. Journal ofMachine Learning Research, 12:2825–2830, 2011.

Shotton, J., Sharp, T., Kohli, P., Nowozin, S., Winn, J.,and Criminisi, A. Decision jungles: Compact and richmodels for classification. In NIPS’13 Proceedings ofthe 26th International Conference on Neural InformationProcessing Systems, pp. 234–242, 2013.

Tsoumakas, G., Partalas, I., and Vlahavas, I. An ensem-ble pruning primer. In Applications of supervised andunsupervised ensemble methods. Springer, 2009.

Ye, T., Zhou, H., Zou, W. Y., Gao, B., and Zhang, R. Rapid-scorer: fast tree ensemble evaluation by maximizingcompactness in data level parallelization. In Proceed-ings of the 24th ACM SIGKDD International Conferenceon Knowledge Discovery & Data Mining, pp. 941–950,2018.

Zhang, Y., Burer, S., and Street, W. N. Ensemble pruning viasemi-definite programming. Journal of machine learningresearch, 7(Jul):1315–1338, 2006.

Zhou, Z.-H. Ensemble methods: foundations and algo-rithms. CRC press, 2012.

Zhou, Z.-H., Wu, J., and Tang, W. Ensembling neuralnetworks: many could be better than all. Artificial intelli-gence, 137(1-2):239–263, 2002.

APPENDIX: Improving the Accuracy-Memory Trade-Off of Random Forests Via Leaf-Refinement

APPENDIX: Improving the Accuracy-Memory Trade-Off ofRandom Forests Via Leaf-Refinement

Sebastian Buschjager [email protected]

Katharina Morik [email protected]

Abstract

This appendix accompanies the paper ‘Improving the Accuracy-Memory Trade-Off ofRandom Forests Via Leaf-Refinement’. It provides results for more experiments which arenot given in the paper due to space reasons.

1. Transformation of the Many-Could-Be-Better-Than-All-Theorem

Let

Ck,k = Ex,y∼D[(hk(x)− y)2

](1)

Ck,i = Ex,y∼D [(hk(x)− y)(hi(x)− y)] (2)

then from Eq. (14) and Eq. (15) in ? we have:

M∑

i=1,i 6=k

M∑

j=1,i 6=k

Ci,j

(M − 1)2≤

M∑

i=1

M∑

h=1

Ci,j

M2=

M∑

i=1,i 6=k

M∑

j=1,i 6=k

Ci,j

M2+ 2

M∑

i=1,i 6=k

Ci,k

M2+

Ck,k

M2

≤ (M − 1)2

M2

M∑

i=1,i 6=k

M∑

j=1,i 6=k

Ci,j + 2

M∑

i=1,i 6=k

Ci,k + Ck,k

≤M∑

i=1,i 6=k

M∑

j=1,i 6=k

Ci,j + 2

M∑

i=1,i 6=k

Ci,k + Ck,k

0 ≤ 2M∑

i=1,i 6=k

Ci,k + Ck,k

−2M∑

i=1,i 6=k

Ci,k ≤ Ck,k

2. Dataset

Table 1 gives an overview of the datasets used for all experiments. All datasets arefreely available online. The detailed download scripts for each dataset are provided in theanonymized version of the source code.

3. Revisiting Ensemble Pruning on More Datasets

The section ‘Revisiting Ensemble Pruning’ showed results for the EEG dataset. In thissection, we show the results for this experiment on the other dataset depicted in Table 1.

1

arX

iv:2

110.

1007

5v1

[cs

.LG

] 1

9 O

ct 2

021

Sebastian Buschjager, Katharina Morik

Table 1: Summary of data sets for our experiments. All datasets are publicly available anddownload scripts are included in this submission. In all experiments we use a 5-foldcross validation except for mnist and ida2016 in which we used the given test/trainsplit. We use minimal pre-processing and by removing examples containing NaN

values and computing a one-hot encoding for categorical features. N depicts totalnumber of datapoints (after removing NaN), d is the dimensionality including allone-hot encoded features and C is the number of classes.

Dataset N d C

adult 32, 561 108 2anura 7, 195 22 10avila 20, 867 10 11bank 45, 211 51 2chess 28 056 23 17

connect 67, 557 42 3eeg 14, 980 14 2elec 45, 312 14 2

Dataset N d C

ida2016 76, 000 170 2japanese-vowels 9, 961 14 9

magic 19, 019 10 2mnist 70, 000 784 10

mozilla 15, 545 5 2nomao 34, 465 174 2

postures 78, 095 9 5satimage 6, 430 36 6

Recall the following experimental protocol: Oshiro et al. showed in ? that the prediction ofa RF stabilizes between 128 and 256 trees in the ensemble and adding more trees to theensemble does not yield significantly better results. Hence, we train the ‘base’ RandomForests with M = 256 trees. To control the individual errors of trees we set the maximumnumber of leaf nodes nl to values between nl ∈ {64, 128, 256, 512, 1024}. For ensemblepruning we use RE and compare it against a random selection of trees from the originalensemble (which is the same a training a smaller forest directly). In both cases a sub-ensemblewith K ∈ {2, 4, 8, 16, 32, 64, 128, 256} members is selected so that for K = 256 the originalRF is recovered. For RE we use the training data as pruning set. We report the averageaccuracy over a 5-fold cross-validation.

2

APPENDIX: Improving the Accuracy-Memory Trade-Off of Random Forests Via Leaf-Refinement

0 50 100 150 200 250Number of trees

83.5

84.0

84.5

85.0

85.5

86.0

86.5

Accu

racy

RE nl = 1024RF nl = 1024RE nl = 512RF nl = 512RE nl = 256RF nl = 256RE nl = 128RF nl = 128RE nl = 64RF nl = 64

model COMP DREP IC IE LMD REmax leaf nodes n estimators

64 8.0 85.47 85.40 85.30 85.73 85.06 85.9916.0 85.65 85.57 85.71 85.65 85.14 86.0432.0 85.66 85.43 85.81 85.65 85.34 86.0164.0 85.57 85.34 85.64 85.78 85.30 85.90128.0 85.52 85.33 85.64 85.66 85.27 85.69

128 8.0 85.78 85.62 85.80 85.88 85.38 86.1316.0 85.92 85.74 85.98 85.91 85.74 86.1632.0 85.89 85.76 86.01 85.96 85.59 86.1664.0 85.98 85.80 86.05 85.84 85.69 86.04128.0 85.92 85.70 86.00 85.88 85.70 86.00

256 8.0 85.82 85.78 85.77 86.16 85.46 86.1316.0 86.17 85.96 85.97 86.23 85.68 86.2732.0 86.04 86.01 86.00 86.21 85.75 86.1964.0 86.07 86.11 86.17 86.22 85.83 86.30128.0 86.08 86.12 86.19 86.22 85.88 86.17

512 8.0 85.78 85.90 85.93 86.09 85.35 86.1916.0 86.08 86.00 86.11 86.20 85.88 86.2232.0 86.15 86.19 86.28 86.29 86.02 86.3364.0 86.40 86.17 86.38 86.41 86.22 86.40128.0 86.36 86.26 86.38 86.47 86.26 86.42

1024 8.0 85.83 85.77 85.91 86.13 85.36 86.0516.0 86.19 86.06 86.21 86.29 85.73 86.3132.0 86.30 86.16 86.46 86.34 85.90 86.3964.0 86.31 86.35 86.45 86.45 86.26 86.45128.0 86.47 86.40 86.52 86.47 86.33 86.40

Figure 1: (Left) The error over the number of trees in the ensemble on the adult dataset.Dashed lines depict the Random Forest and solid lines are the correspondingpruned ensemble via Reduced Error pruning. (Right) The 5-fold cross-validationaccuracy on the adult dataset. Rounded to the second decimal digit. Larger isbetter.

0 50 100 150 200 250Number of trees

93

94

95

96

97

98

Accu

racy

RE nl = 1024RF nl = 1024RE nl = 512RF nl = 512RE nl = 256RF nl = 256RE nl = 128RF nl = 128RE nl = 64RF nl = 64

model COMP DREP IC IE LMD REmax leaf nodes n estimators

64 8.0 96.48 96.22 96.61 96.21 96.08 96.6116.0 96.82 96.43 97.01 96.57 96.33 96.8532.0 96.96 96.68 97.03 96.75 96.72 96.8664.0 96.96 96.71 96.89 96.87 96.83 96.86128.0 96.78 96.79 96.87 96.87 96.79 96.91

128 8.0 97.14 96.87 97.19 96.93 96.54 97.0716.0 97.57 97.14 97.65 97.44 97.14 97.3332.0 97.72 97.36 97.72 97.72 97.37 97.4664.0 97.69 97.53 97.98 97.90 97.55 97.64128.0 97.76 97.62 97.82 97.73 97.62 97.64

256 8.0 97.25 97.11 97.29 97.51 96.90 97.4116.0 97.73 97.61 97.86 97.76 97.41 97.8232.0 98.04 98.12 98.21 98.07 97.98 97.9864.0 98.12 98.08 98.23 98.05 98.14 98.11128.0 98.11 98.11 98.10 98.05 98.08 98.11

512 8.0 96.96 97.04 97.68 97.21 97.08 97.3316.0 97.50 97.57 98.04 97.80 97.53 97.7632.0 97.93 97.93 97.96 97.78 97.90 98.1064.0 98.19 98.17 98.04 97.98 98.08 98.18128.0 98.07 98.04 98.12 98.04 98.11 98.05

1024 8.0 97.23 97.21 97.28 97.36 96.89 97.0816.0 97.82 97.75 97.69 97.93 97.54 97.5732.0 98.05 98.00 98.03 97.98 97.89 98.0164.0 98.03 97.98 98.18 98.07 98.04 98.04128.0 98.23 98.23 98.17 98.25 98.01 98.25

Figure 2: (Left) The error over the number of trees in the ensemble on the anura dataset.Dashed lines depict the Random Forest and solid lines are the correspondingpruned ensemble via Reduced Error pruning. (Right) The 5-fold cross-validationaccuracy on the anura dataset. Rounded to the second decimal digit. Larger isbetter.

3

Sebastian Buschjager, Katharina Morik

0 50 100 150 200 250Number of trees

75

80

85

90

95

100

Accu

racy

RE nl = 1024RF nl = 1024RE nl = 512RF nl = 512RE nl = 256RF nl = 256RE nl = 128RF nl = 128RE nl = 64RF nl = 64

model COMP DREP IC IE LMD REmax leaf nodes n estimators

64 8.0 81.37 76.83 81.21 79.80 78.55 82.2816.0 81.47 77.19 81.40 80.73 79.34 83.1532.0 81.27 77.43 81.45 80.51 79.49 82.8164.0 80.62 77.78 80.73 79.91 78.89 81.78128.0 79.59 NaN 79.72 79.19 78.52 80.28

128 8.0 90.13 85.99 89.43 88.90 84.82 90.7916.0 90.66 86.51 90.67 89.52 86.12 91.3732.0 90.31 86.79 90.66 89.74 86.89 91.2364.0 89.87 86.45 89.89 89.10 86.74 90.04128.0 88.42 NaN 88.55 88.18 86.77 88.72

256 8.0 96.61 92.82 96.75 96.40 89.03 96.9916.0 97.09 93.46 97.10 96.55 90.26 97.2532.0 96.82 93.63 96.97 96.70 91.12 97.0464.0 96.31 NaN 96.55 96.12 91.63 96.52128.0 95.50 NaN 95.62 95.31 92.15 95.50

512 8.0 99.02 96.35 99.18 99.12 93.31 99.2516.0 99.21 96.56 99.32 99.15 93.61 99.2032.0 99.06 97.04 99.13 98.97 94.23 99.0664.0 98.81 NaN 98.91 98.84 95.02 98.76128.0 98.36 NaN 98.53 98.46 96.04 98.25

1024 8.0 99.14 98.41 99.49 99.54 94.41 99.3716.0 99.28 98.62 99.70 99.72 95.42 99.3932.0 99.30 98.88 99.76 99.74 96.50 99.3364.0 99.30 99.16 99.74 99.73 97.22 99.30128.0 99.36 NaN 99.59 99.59 98.01 99.32

Figure 3: (Left) The error over the number of trees in the ensemble on the avila dataset.Dashed lines depict the Random Forest and solid lines are the correspondingpruned ensemble via Reduced Error pruning. (Right) The 5-fold cross-validationaccuracy on the avila dataset. Rounded to the second decimal digit. Larger isbetter.

0 50 100 150 200 250Number of trees

88.50

88.75

89.00

89.25

89.50

89.75

90.00

90.25

90.50

Accu

racy

RE nl = 1024RF nl = 1024RE nl = 512RF nl = 512RE nl = 256RF nl = 256RE nl = 128RF nl = 128RE nl = 64RF nl = 64

model COMP DREP IC IE LMD REmax leaf nodes n estimators

64 8.0 89.98 89.74 90.21 90.21 89.66 90.2416.0 90.02 89.70 90.17 90.21 89.72 90.2732.0 90.00 89.69 90.13 90.17 89.69 90.2864.0 90.00 89.65 90.14 90.03 89.68 90.16128.0 89.86 89.65 89.91 89.78 89.70 90.04

128 8.0 90.05 89.85 90.15 90.29 89.82 90.3416.0 90.12 89.83 90.22 90.27 89.80 90.3532.0 90.16 89.84 90.22 90.32 89.90 90.3564.0 90.21 89.83 90.29 90.21 89.86 90.26128.0 90.03 89.79 90.05 90.00 89.84 90.21

256 8.0 90.15 89.98 90.26 90.38 89.83 90.2716.0 90.27 89.94 90.29 90.39 89.85 90.3332.0 90.25 90.02 90.34 90.37 90.07 90.3864.0 90.31 89.95 90.35 90.39 90.03 90.40128.0 90.21 89.94 90.25 90.20 90.01 90.28

512 8.0 90.30 90.08 90.27 90.44 89.95 90.4716.0 90.32 90.28 90.40 90.53 90.16 90.5332.0 90.41 90.13 90.51 90.50 90.29 90.5564.0 90.45 90.20 90.43 90.47 90.28 90.42128.0 90.40 90.18 90.49 90.49 90.29 90.43

1024 8.0 90.30 90.12 90.36 90.28 90.12 90.0816.0 90.50 90.43 90.51 90.47 90.28 90.4432.0 90.54 90.39 90.55 90.44 90.34 90.5464.0 90.56 90.38 90.58 90.48 90.40 90.56128.0 90.55 90.39 90.59 90.55 90.42 90.58

Figure 4: (Left) The error over the number of trees in the ensemble on the bank dataset.Dashed lines depict the Random Forest and solid lines are the correspondingpruned ensemble via Reduced Error pruning. (Right) The 5-fold cross-validationaccuracy on the bank dataset. Rounded to the second decimal digit. Larger isbetter.

4

APPENDIX: Improving the Accuracy-Memory Trade-Off of Random Forests Via Leaf-Refinement

0 50 100 150 200 250Number of trees

40

45

50

55

60

65

Accu

racy

RE nl = 1024RF nl = 1024RE nl = 512RF nl = 512RE nl = 256RF nl = 256RE nl = 128RF nl = 128RE nl = 64RF nl = 64

model COMP DREP IC IE LMD REmax leaf nodes n estimators

64 8.0 44.23 42.94 43.93 43.17 43.41 45.7616.0 44.91 43.75 45.27 43.58 44.26 46.6632.0 45.33 43.82 45.84 43.77 44.56 47.1764.0 45.23 NaN 45.25 43.82 44.36 46.82128.0 NaN NaN 44.77 44.01 44.41 NaN

128 8.0 49.74 47.21 49.33 48.18 48.47 50.5816.0 50.92 48.56 50.51 48.31 49.19 51.5232.0 50.79 49.00 50.95 48.94 49.93 51.9064.0 50.53 NaN 50.47 48.87 49.71 51.85128.0 49.83 NaN 50.14 48.96 49.49 NaN

256 8.0 54.06 52.57 53.66 53.77 52.41 55.3316.0 55.65 53.46 55.61 54.48 54.50 57.2232.0 56.04 54.09 56.49 54.89 55.10 57.3164.0 56.43 NaN 56.52 55.04 55.34 57.42128.0 NaN NaN 55.98 54.88 55.35 56.39

512 8.0 58.90 56.79 59.24 58.15 56.89 59.8016.0 61.14 58.38 61.31 59.44 59.37 61.5432.0 61.79 NaN 61.97 60.41 60.51 62.2864.0 61.63 NaN 62.08 60.77 60.89 62.08128.0 61.28 NaN 61.44 60.52 60.80 61.48

1024 8.0 63.58 61.36 63.85 62.80 61.38 64.3616.0 65.93 62.91 65.95 64.25 63.82 65.8632.0 66.69 NaN 66.82 65.07 65.05 66.6564.0 66.48 NaN 66.77 65.30 65.39 66.86128.0 NaN NaN 66.39 65.30 65.33 NaN

Figure 5: (Left) The error over the number of trees in the ensemble on the chess dataset.Dashed lines depict the Random Forest and solid lines are the correspondingpruned ensemble via Reduced Error pruning. (Right) The 5-fold cross-validationaccuracy on the chess dataset. Rounded to the second decimal digit. Larger isbetter.

0 50 100 150 200 250Number of trees

70

72

74

76

Accu

racy

RE nl = 1024RF nl = 1024RE nl = 512RF nl = 512RE nl = 256RF nl = 256RE nl = 128RF nl = 128RE nl = 64RF nl = 64

model COMP DREP IC IE LMD REmax leaf nodes n estimators

64 8.0 70.73 69.92 70.45 71.14 69.68 71.6616.0 70.32 69.60 70.38 70.76 69.41 71.4232.0 70.12 69.41 70.07 70.48 69.33 70.9864.0 69.88 NaN 69.87 70.30 69.31 70.61128.0 69.67 NaN 69.61 70.00 69.26 70.12

128 8.0 72.32 71.45 72.54 72.62 71.43 73.1116.0 72.15 71.36 72.17 72.34 71.17 72.8732.0 71.89 71.13 72.00 72.05 71.13 72.4964.0 71.66 NaN 71.64 71.80 71.11 72.11128.0 71.36 NaN 71.36 71.47 71.07 71.62

256 8.0 73.97 72.95 74.17 73.96 72.98 74.3916.0 73.79 72.88 73.93 73.91 72.89 74.4432.0 73.63 72.79 73.69 73.76 73.08 74.1364.0 73.50 NaN 73.53 73.46 72.93 73.79128.0 73.16 NaN 73.20 73.19 72.86 73.33

512 8.0 75.46 74.31 75.51 75.40 74.73 75.7216.0 75.44 74.30 75.56 75.47 74.70 75.8932.0 75.48 74.54 75.50 75.42 74.71 75.6564.0 75.30 NaN 75.26 75.25 74.69 75.40128.0 75.02 NaN 75.02 74.96 74.63 75.08

1024 8.0 76.93 75.87 76.98 77.08 75.96 77.2016.0 77.14 75.94 77.41 77.36 76.23 77.4732.0 77.22 76.15 77.44 77.27 76.33 77.3564.0 77.06 NaN 77.13 77.09 76.28 77.12128.0 76.79 NaN 76.82 76.75 76.27 76.75

Figure 6: (Left) The error over the number of trees in the ensemble on the connect dataset.Dashed lines depict the Random Forest and solid lines are the correspondingpruned ensemble via Reduced Error pruning. (Right) The 5-fold cross-validationaccuracy on the connect dataset. Rounded to the second decimal digit. Larger isbetter.

5

Sebastian Buschjager, Katharina Morik

0 50 100 150 200 250Number of trees

77.5

80.0

82.5

85.0

87.5

90.0

92.5

Accu

racy

RE nl = 1024RF nl = 1024RE nl = 512RF nl = 512RE nl = 256RF nl = 256RE nl = 128RF nl = 128RE nl = 64RF nl = 64

model COMP DREP IC IE LMD REmax leaf nodes n estimators

64 8.0 81.86 80.79 81.71 81.34 81.46 82.2216.0 83.04 81.96 83.09 81.69 82.24 82.9232.0 83.09 82.33 83.10 82.22 82.60 83.2364.0 83.06 82.55 83.05 82.30 82.96 83.31128.0 83.17 82.38 83.10 82.49 82.87 83.19

128 8.0 85.12 84.08 84.69 84.81 83.85 85.5316.0 85.93 85.15 86.04 85.23 85.25 86.2232.0 86.34 85.49 86.38 85.76 85.65 86.6264.0 86.39 85.55 86.49 85.96 86.04 86.60128.0 86.40 85.75 86.27 86.00 86.03 86.54

256 8.0 87.37 86.24 87.14 87.16 86.36 87.4616.0 88.36 87.64 88.50 88.23 87.78 88.5132.0 88.97 88.02 89.07 88.70 88.37 89.0164.0 88.91 88.59 89.03 88.90 88.62 89.19128.0 88.97 88.70 89.15 88.97 88.77 89.07

512 8.0 88.36 88.51 88.96 88.78 87.44 88.7916.0 90.18 89.89 90.28 89.87 89.45 90.2732.0 91.11 90.30 91.34 90.67 90.37 90.6864.0 91.04 90.75 91.56 91.16 90.79 91.22128.0 91.22 90.91 91.41 91.30 90.87 91.23

1024 8.0 89.45 89.26 89.51 89.70 88.30 88.8516.0 90.77 90.89 91.64 91.48 90.86 91.1732.0 92.25 92.30 92.64 92.60 91.82 92.2164.0 92.55 92.54 93.09 92.86 92.38 92.69128.0 92.85 92.85 93.17 92.98 92.70 92.84

Figure 7: (Left) The error over the number of trees in the ensemble on the eeg dataset.Dashed lines depict the Random Forest and solid lines are the correspondingpruned ensemble via Reduced Error pruning. (Right) The 5-fold cross-validationaccuracy on the eeg dataset. Rounded to the second decimal digit. Larger isbetter.

0 50 100 150 200 250Number of trees

80

82

84

86

88

Accu

racy

RE nl = 1024RF nl = 1024RE nl = 512RF nl = 512RE nl = 256RF nl = 256RE nl = 128RF nl = 128RE nl = 64RF nl = 64

model COMP DREP IC IE LMD REmax leaf nodes n estimators

64 8.0 81.77 81.73 79.40 82.28 80.97 82.9216.0 82.06 81.85 81.97 82.52 81.59 83.0132.0 82.23 81.79 82.40 82.55 81.80 82.8464.0 82.20 81.74 82.38 82.50 81.82 82.71128.0 82.07 81.80 82.19 82.13 81.79 82.53

128 8.0 83.42 82.75 82.75 83.58 82.82 83.8916.0 83.50 82.97 83.51 83.80 83.30 84.1932.0 83.75 82.97 83.75 83.66 83.20 84.2964.0 83.65 83.09 83.74 83.52 83.14 83.95128.0 83.48 83.10 83.56 83.41 83.19 83.68

256 8.0 84.32 84.16 83.85 84.90 83.90 85.2316.0 84.83 84.45 84.93 85.00 84.26 85.4332.0 85.03 84.61 85.05 85.03 84.39 85.3964.0 84.94 84.50 85.03 84.82 84.51 85.26128.0 84.83 84.51 84.94 84.64 84.58 84.94

512 8.0 85.81 85.48 86.04 86.35 84.78 86.5616.0 86.45 85.72 86.58 86.46 85.49 86.8532.0 86.35 85.82 86.68 86.47 85.64 86.7864.0 86.28 85.96 86.56 86.37 85.69 86.58128.0 86.22 85.93 86.28 86.21 85.86 86.32

1024 8.0 86.95 86.45 87.19 87.44 86.18 87.3616.0 87.46 86.90 87.85 87.77 86.74 87.8132.0 87.74 87.18 88.04 87.91 87.13 87.9464.0 87.84 87.32 87.94 87.75 87.21 87.94128.0 87.65 87.38 87.80 87.64 87.36 87.73

Figure 8: (Left) The error over the number of trees in the ensemble on the elec dataset.Dashed lines depict the Random Forest and solid lines are the correspondingpruned ensemble via Reduced Error pruning. (Right) The 5-fold cross-validationaccuracy on the elec dataset. Rounded to the second decimal digit. Larger isbetter.

6

APPENDIX: Improving the Accuracy-Memory Trade-Off of Random Forests Via Leaf-Refinement

0 50 100 150 200 250Number of trees

98.5

98.6

98.7

98.8

98.9

99.0

99.1

99.2

Accu

racy

RE nl = 1024RF nl = 1024RE nl = 512RF nl = 512RE nl = 256RF nl = 256RE nl = 128RF nl = 128RE nl = 64RF nl = 64

model COMP DREP IC IE LMD REmax leaf nodes n estimators

64 8.0 99.04 98.97 99.09 99.02 98.95 99.0916.0 99.12 99.01 99.08 99.05 99.02 99.1232.0 99.05 99.04 99.09 99.02 99.02 99.0864.0 99.05 99.06 99.07 99.07 99.04 99.08128.0 99.06 99.09 99.09 99.10 99.04 99.04

128 8.0 99.06 99.02 99.11 99.10 99.03 99.1016.0 99.08 99.09 99.12 99.13 99.13 99.1232.0 99.08 99.04 99.09 99.14 99.15 99.1564.0 99.06 99.11 99.09 99.14 99.15 99.12128.0 99.11 99.16 99.16 99.14 99.16 99.13

256 8.0 99.11 99.11 99.12 99.08 99.16 99.0816.0 99.22 99.12 99.26 99.18 99.24 99.1232.0 99.31 99.21 99.28 99.18 99.23 99.1964.0 99.23 99.15 99.25 99.25 99.22 99.21128.0 99.23 99.21 99.27 99.24 99.23 99.24

512 8.0 99.07 99.03 99.12 99.01 99.02 98.9916.0 99.14 99.12 99.18 99.13 99.14 99.1932.0 99.19 99.18 99.18 99.19 99.21 99.1964.0 99.20 99.21 99.21 99.20 99.18 99.20128.0 99.19 99.19 99.21 99.23 99.22 99.20

1024 8.0 99.04 99.07 99.14 99.03 99.01 99.0316.0 99.12 99.22 99.16 99.16 99.15 99.0832.0 99.17 99.21 99.22 99.17 99.20 99.2064.0 99.21 99.23 99.24 99.20 99.22 99.21128.0 99.21 99.22 99.21 99.18 99.21 99.19

Figure 9: (Left) The error over the number of trees in the ensemble on the ida2016 dataset.Dashed lines depict the Random Forest and solid lines are the correspondingpruned ensemble via Reduced Error pruning. (Right) The 5-fold cross-validationaccuracy on the ida2016 dataset. Rounded to the second decimal digit. Larger isbetter.

0 50 100 150 200 250Number of trees

77.5

80.0

82.5

85.0

87.5

90.0

92.5

95.0

97.5

Accu

racy

RE nl = 1024RF nl = 1024RE nl = 512RF nl = 512RE nl = 256RF nl = 256RE nl = 128RF nl = 128RE nl = 64RF nl = 64

model COMP DREP IC IE LMD REmax leaf nodes n estimators

64 8.0 88.78 87.31 88.53 86.86 87.28 88.9316.0 90.24 89.10 90.62 88.53 89.80 90.7232.0 91.00 90.21 91.16 89.34 90.96 91.2464.0 91.54 90.78 91.37 89.98 91.03 91.61128.0 91.60 91.03 91.15 90.40 91.11 91.55

128 8.0 91.49 91.05 91.52 90.33 90.79 91.5916.0 92.70 92.06 92.97 91.62 92.37 93.0532.0 93.10 92.99 93.71 92.22 93.16 93.5964.0 93.76 93.15 93.91 92.76 93.60 93.86128.0 93.76 93.54 93.71 93.10 93.89 93.99

256 8.0 93.57 92.91 93.44 92.65 92.63 93.1416.0 94.81 94.43 94.79 93.87 94.13 94.7132.0 95.23 95.12 95.32 94.50 95.13 95.1864.0 95.63 95.23 95.50 95.16 95.48 95.45128.0 95.59 95.54 95.59 95.26 95.74 95.63

512 8.0 94.34 93.96 94.51 94.08 94.28 94.3716.0 95.76 95.68 95.79 95.45 95.65 95.6432.0 96.39 96.39 96.69 96.36 96.26 96.5264.0 96.77 96.71 96.91 96.72 96.70 96.74128.0 97.14 96.98 97.11 96.89 96.86 97.01

1024 8.0 94.45 94.24 95.07 94.77 94.32 94.8716.0 96.19 95.80 96.68 96.02 96.26 96.3732.0 96.94 96.86 97.33 96.83 96.99 97.0464.0 97.32 97.37 97.48 97.18 97.39 97.41128.0 97.60 97.57 97.66 97.51 97.61 97.57

Figure 10: (Left) The error over the number of trees in the ensemble on the japanese-vowels dataset. Dashed lines depict the Random Forest and solid lines are thecorresponding pruned ensemble via Reduced Error pruning. (Right) The 5-foldcross-validation accuracy on the japanese-vowels dataset. Rounded to the seconddecimal digit. Larger is better.

7

Sebastian Buschjager, Katharina Morik

0 50 100 150 200 250Number of trees

80

82

84

86

88

Accu

racy

RE nl = 1024RF nl = 1024RE nl = 512RF nl = 512RE nl = 256RF nl = 256RE nl = 128RF nl = 128RE nl = 64RF nl = 64

model COMP DREP IC IE LMD REmax leaf nodes n estimators

64 8.0 86.37 86.14 86.07 86.10 86.11 86.6416.0 86.60 86.11 86.66 86.35 86.45 86.6432.0 86.81 86.29 86.83 86.41 86.55 86.6764.0 86.79 86.35 86.80 86.42 86.57 86.75128.0 86.64 86.47 86.72 86.43 86.62 86.69

128 8.0 86.61 86.28 86.69 86.77 86.46 86.8416.0 86.88 86.63 87.07 86.99 87.00 87.0132.0 87.19 86.68 87.18 86.87 87.04 87.1264.0 87.13 86.81 87.17 87.04 86.98 87.07128.0 87.12 86.90 87.11 87.03 87.13 86.98

256 8.0 86.74 86.66 86.93 86.92 87.09 86.9616.0 87.28 87.22 87.23 87.24 87.30 87.3732.0 87.62 87.32 87.54 87.16 87.27 87.2764.0 87.50 87.16 87.44 87.37 87.46 87.38128.0 87.42 87.41 87.41 87.34 87.40 87.34

512 8.0 87.07 86.68 87.02 87.00 86.72 86.8916.0 87.59 87.10 87.65 87.57 87.20 87.5032.0 87.76 87.49 87.84 87.75 87.35 87.5364.0 87.76 87.49 87.73 87.74 87.63 87.65128.0 87.72 87.62 87.73 87.77 87.61 87.62

1024 8.0 86.26 86.29 86.69 86.49 86.38 86.7316.0 87.40 87.33 87.50 87.38 87.36 87.4532.0 87.56 87.74 87.90 87.76 87.80 87.9964.0 87.86 87.96 88.01 87.96 87.91 88.08128.0 87.87 87.94 87.91 87.99 88.04 88.06

Figure 11: (Left) The error over the number of trees in the ensemble on the magic dataset.Dashed lines depict the Random Forest and solid lines are the correspondingpruned ensemble via Reduced Error pruning. (Right) The 5-fold cross-validationaccuracy on the magic dataset. Rounded to the second decimal digit. Larger isbetter

0 50 100 150 200 250Number of trees

70

75

80

85

90

95

Accu

racy

RE nl = 1024RF nl = 1024RE nl = 512RF nl = 512RE nl = 256RF nl = 256RE nl = 128RF nl = 128RE nl = 64RF nl = 64

model COMP DREP IC IE LMD REmax leaf nodes n estimators

64 8.0 85.7 84.3 84.7 84.1 85.0 84.916.0 87.4 87.6 88.5 86.6 87.2 86.732.0 89.4 88.5 89.4 87.6 87.9 88.464.0 89.8 89.6 89.8 88.6 88.5 89.1128.0 89.0 89.4 89.5 88.8 89.0 89.7

128 8.0 89.0 87.1 87.9 87.4 86.6 86.816.0 90.1 89.3 90.6 89.7 88.8 89.632.0 90.0 90.5 90.4 89.7 91.0 90.564.0 91.0 90.6 90.8 90.5 91.1 91.2128.0 91.1 91.3 91.1 90.6 92.0 91.5

256 8.0 88.1 87.6 89.1 87.9 87.7 88.016.0 91.1 90.8 90.9 91.1 89.9 91.432.0 91.9 91.5 91.5 91.9 92.2 91.264.0 92.3 92.3 91.8 91.2 93.4 92.2128.0 92.9 92.8 93.0 92.6 93.0 92.7

512 8.0 86.7 89.2 88.6 88.7 88.1 89.416.0 91.4 90.3 92.2 91.6 90.8 91.332.0 92.6 93.1 93.3 93.1 92.8 92.064.0 93.6 93.8 93.7 93.6 93.7 93.6128.0 94.2 94.3 93.8 93.8 93.9 94.5

1024 8.0 87.2 88.0 87.7 88.7 87.9 87.716.0 91.5 91.3 91.6 92.1 91.5 91.932.0 92.6 93.2 93.9 93.3 93.1 93.064.0 93.9 94.0 94.2 94.0 93.3 94.2128.0 94.4 94.5 94.6 94.5 93.9 94.3

Figure 12: (Left) The error over the number of trees in the ensemble on the mnist dataset.Dashed lines depict the Random Forest and solid lines are the correspondingpruned ensemble via Reduced Error pruning. (Right) The 5-fold cross-validationaccuracy on the mnist dataset. Rounded to the second decimal digit. Larger isbetter.

8

APPENDIX: Improving the Accuracy-Memory Trade-Off of Random Forests Via Leaf-Refinement

0 50 100 150 200 250Number of trees

91

92

93

94

95

Accu

racy

RE nl = 1024RF nl = 1024RE nl = 512RF nl = 512RE nl = 256RF nl = 256RE nl = 128RF nl = 128RE nl = 64RF nl = 64

model COMP DREP IC IE LMD REmax leaf nodes n estimators

64 8.0 94.63 94.47 94.82 94.68 94.27 94.6616.0 94.62 94.50 94.76 94.66 94.35 94.6232.0 94.65 94.51 94.69 94.67 94.47 94.6464.0 94.60 94.54 94.63 94.65 94.53 94.60128.0 94.56 94.54 94.56 94.58 94.55 94.56

128 8.0 94.71 94.65 94.76 94.86 94.47 94.8616.0 94.71 94.69 94.81 94.80 94.53 94.8032.0 94.72 94.67 94.79 94.73 94.60 94.8064.0 94.72 94.66 94.76 94.73 94.61 94.74128.0 94.69 94.64 94.71 94.67 94.62 94.68

256 8.0 95.00 94.74 95.00 94.96 94.78 94.8816.0 95.03 94.88 95.09 95.05 94.80 94.9832.0 95.07 94.85 95.09 95.03 94.86 94.9464.0 95.05 94.95 95.08 95.05 94.84 95.04128.0 94.96 94.92 95.05 95.02 94.90 94.99

512 8.0 95.02 94.85 95.05 95.09 94.71 94.9216.0 95.14 95.09 95.27 95.14 94.91 95.1632.0 95.19 95.21 95.26 95.28 95.03 95.2564.0 95.22 95.13 95.30 95.34 95.10 95.23128.0 95.18 95.13 95.29 95.30 95.12 95.21

1024 8.0 94.72 94.98 94.94 94.85 94.50 95.0016.0 95.20 95.29 95.25 95.19 94.92 95.2832.0 95.30 95.26 95.25 95.29 95.19 95.3664.0 95.27 95.20 95.30 95.31 95.21 95.28128.0 95.27 95.26 95.31 95.36 95.21 95.25

Figure 13: (Left) The error over the number of trees in the ensemble on the mozilla dataset.Dashed lines depict the Random Forest and solid lines are the correspondingpruned ensemble via Reduced Error pruning. (Right) The 5-fold cross-validationaccuracy on the mozilla dataset. Rounded to the second decimal digit. Larger isbetter.

0 50 100 150 200 250Number of trees

94.0

94.5

95.0

95.5

96.0

96.5

97.0

Accu

racy

RE nl = 1024RF nl = 1024RE nl = 512RF nl = 512RE nl = 256RF nl = 256RE nl = 128RF nl = 128RE nl = 64RF nl = 64

model COMP DREP IC IE LMD REmax leaf nodes n estimators

64 8.0 95.37 95.11 95.19 95.19 94.97 95.3516.0 95.39 95.29 95.39 95.29 95.08 95.4432.0 95.45 95.29 95.50 95.29 95.13 95.5164.0 95.41 95.20 95.49 95.31 95.19 95.53128.0 95.40 NaN 95.40 95.29 95.21 95.43

128 8.0 95.63 95.47 95.75 95.75 95.36 95.8016.0 95.75 95.69 95.87 95.89 95.52 95.8932.0 95.83 95.75 95.91 95.93 95.67 95.9164.0 95.89 95.75 95.90 95.91 95.76 95.86128.0 95.85 NaN 95.82 95.82 95.76 95.82

256 8.0 96.09 95.90 95.97 96.06 95.92 96.0616.0 96.19 96.12 96.23 96.18 96.08 96.2132.0 96.30 96.15 96.35 96.24 96.17 96.3064.0 96.31 96.21 96.34 96.25 96.19 96.26128.0 96.29 96.24 96.29 96.23 96.22 96.31

512 8.0 96.22 96.15 96.32 96.27 96.04 96.3616.0 96.39 96.37 96.55 96.38 96.41 96.5332.0 96.56 96.47 96.56 96.52 96.53 96.6064.0 96.57 96.53 96.66 96.58 96.56 96.60128.0 96.61 96.55 96.61 96.65 96.62 96.62

1024 8.0 96.29 96.33 96.25 96.36 96.31 96.4516.0 96.64 96.66 96.63 96.70 96.69 96.6832.0 96.74 96.74 96.80 96.76 96.85 96.7464.0 96.86 96.84 96.85 96.81 96.86 96.82128.0 96.89 96.87 96.95 96.91 96.90 96.85

Figure 14: (Left) The error over the number of trees in the ensemble on the nomao dataset.Dashed lines depict the Random Forest and solid lines are the correspondingpruned ensemble via Reduced Error pruning. (Right) The 5-fold cross-validationaccuracy on the nomao dataset. Rounded to the second decimal digit. Larger isbetter.

9

Sebastian Buschjager, Katharina Morik

0 50 100 150 200 250Number of trees

70

75

80

85

90

95

Accu

racy

RE nl = 1024RF nl = 1024RE nl = 512RF nl = 512RE nl = 256RF nl = 256RE nl = 128RF nl = 128RE nl = 64RF nl = 64

model COMP DREP IC IE LMD REmax leaf nodes n estimators

64 8.0 77.19 74.43 76.87 75.15 76.41 77.6416.0 78.05 75.57 78.01 75.75 77.33 78.8932.0 78.30 NaN 78.19 76.16 77.77 79.0264.0 78.06 NaN 78.08 76.36 77.63 78.77128.0 NaN NaN 77.76 76.51 77.36 NaN

128 8.0 82.54 80.47 82.43 81.23 81.53 82.8816.0 83.41 81.64 83.45 81.93 82.66 83.9532.0 83.69 NaN 83.65 82.53 82.99 84.1364.0 83.62 NaN 83.62 82.74 83.04 83.94128.0 NaN NaN 83.30 82.68 82.86 83.51

256 8.0 87.44 85.67 87.20 86.36 86.04 87.7116.0 88.45 86.70 88.31 87.50 87.29 88.6532.0 88.69 NaN 88.68 87.94 87.83 88.9864.0 88.65 NaN 88.68 88.16 87.99 88.86128.0 88.40 NaN 88.45 88.11 88.13 88.62

512 8.0 91.36 90.50 91.22 90.96 90.12 91.4116.0 92.15 91.31 92.18 91.76 91.22 92.2932.0 92.46 NaN 92.46 92.22 91.71 92.5764.0 92.46 NaN 92.48 92.29 91.91 92.53128.0 92.31 NaN 92.40 92.18 91.99 NaN

1024 8.0 94.14 93.20 94.11 93.78 93.17 94.1816.0 94.88 94.17 94.89 94.66 94.14 94.9632.0 95.16 NaN 95.20 95.00 94.68 95.1964.0 95.20 NaN 95.30 95.12 94.80 95.25128.0 95.17 NaN 95.20 95.12 94.92 NaN

Figure 15: (Left) The error over the number of trees in the ensemble on the postures dataset.Dashed lines depict the Random Forest and solid lines are the correspondingpruned ensemble via Reduced Error pruning. (Right) The 5-fold cross-validationaccuracy on the postures dataset. Rounded to the second decimal digit. Largeris better.

0 50 100 150 200 250Number of trees

84

85

86

87

88

89

90

91

92

Accu

racy

RE nl = 1024RF nl = 1024RE nl = 512RF nl = 512RE nl = 256RF nl = 256RE nl = 128RF nl = 128RE nl = 64RF nl = 64

model COMP DREP IC IE LMD REmax leaf nodes n estimators

64 8.0 88.88 88.66 88.91 88.62 88.65 89.0216.0 89.28 89.00 89.42 89.10 89.24 89.4432.0 89.77 89.32 89.56 89.36 89.46 89.7264.0 89.61 89.42 89.52 89.41 89.52 89.67128.0 89.64 89.35 89.61 89.47 89.53 89.56

128 8.0 89.38 89.30 89.11 89.39 89.52 89.4616.0 90.22 89.89 89.67 89.89 90.00 90.1632.0 90.16 90.09 90.31 90.36 90.16 90.4464.0 90.54 90.44 90.36 90.45 90.34 90.75128.0 90.65 90.44 90.64 90.47 90.51 90.78

256 8.0 90.14 89.32 89.70 89.38 89.94 90.0016.0 90.72 89.98 90.34 90.45 90.45 90.6532.0 90.96 90.68 91.06 90.84 90.84 90.9864.0 91.23 91.10 91.09 91.01 91.20 91.09128.0 91.24 91.45 91.17 90.98 91.20 91.26

512 8.0 89.52 90.19 89.52 89.94 89.38 90.0316.0 90.53 90.76 90.72 90.93 90.25 90.8432.0 91.31 91.12 91.35 91.45 91.04 91.2364.0 91.46 91.56 91.60 91.49 91.54 91.57128.0 91.60 91.60 91.59 91.70 91.74 91.59

1024 8.0 89.83 89.49 89.25 90.19 89.53 89.9716.0 90.58 90.67 90.65 91.04 90.56 90.5632.0 91.17 91.06 91.56 91.66 91.06 91.0364.0 91.46 91.42 91.59 91.60 91.68 91.32128.0 91.49 91.59 91.79 91.80 91.57 91.56

Figure 16: (Left) The error over the number of trees in the ensemble on the satimage dataset.Dashed lines depict the Random Forest and solid lines are the correspondingpruned ensemble via Reduced Error pruning. (Right) The 5-fold cross-validationaccuracy on the satimage dataset. Rounded to the second decimal digit. Largeris better.

10

APPENDIX: Improving the Accuracy-Memory Trade-Off of Random Forests Via Leaf-Refinement

4. Plotting the Pareto Front For More Datasets

101 102 103 104

Model Size [KB]

0.835

0.840

0.845

0.850

0.855

0.860

0.865

0.870

Accu

racy

CACOMPDREPGBICIELMDRERFRF-LR

101 102 103

Model Size [KB]

0.60

0.65

0.70

0.75

0.80

0.85

0.90

0.95

1.00

Accu

racy

CACOMPDREPGBICIELMDRERFRF-LR

Figure 17: 5-fold cross-validation accuracy over the size of the ensemble for different nl anddifferent M on the chess dataset. Single points are the individual parameterconfigurations whereas the solid line depicts the corresponding Pareto Front.Left side show the adult dataset, right side shows the anura dataset.

101 102 103 104

Model Size [KB]

0.5

0.6

0.7

0.8

0.9

1.0

Accu

racy

CACOMPDREPGBICIELMDRERFRF-LR

101 102 103 104

Model Size [KB]

0.892

0.894

0.896

0.898

0.900

0.902

0.904

0.906

0.908

Accu

racy

CACOMPDREPGBICIELMDRERFRF-LR

Figure 18: 5-fold cross-validation accuracy over the size of the ensemble for different nl anddifferent M on the chess dataset. Single points are the individual parameterconfigurations whereas the solid line depicts the corresponding Pareto Front.Left side show the avila dataset, right side shows the bank dataset.

11

Sebastian Buschjager, Katharina Morik

101 102 103 104

Model Size [KB]

0.3

0.4

0.5

0.6

0.7

Accu

racy

CACOMPDREPGBICIELMDRERFRF-LR

101 102 103 104

Model Size [KB]

0.675

0.700

0.725

0.750

0.775

0.800

0.825

Accu

racy

CACOMPDREPGBICIELMDRERFRF-LR

Figure 19: 5-fold cross-validation accuracy over the size of the ensemble for different nl anddifferent M on the chess dataset. Single points are the individual parameterconfigurations whereas the solid line depicts the corresponding Pareto Front.Left side show the chess dataset, right side shows the connect dataset.

101 102 103 104

Model Size [KB]

0.750

0.775

0.800

0.825

0.850

0.875

0.900

0.925

Accu

racy

CACOMPDREPGBICIELMDRERFRF-LR

101 102 103 104

Model Size [KB]

0.725

0.750

0.775

0.800

0.825

0.850

0.875

0.900

Accu

racy

CACOMPDREPGBICIELMDRERFRF-LR

Figure 20: 5-fold cross-validation accuracy over the size of the ensemble for different nl anddifferent M on the chess dataset. Single points are the individual parameterconfigurations whereas the solid line depicts the corresponding Pareto Front.Left side show the eeg dataset, right side shows the elec dataset.

12

APPENDIX: Improving the Accuracy-Memory Trade-Off of Random Forests Via Leaf-Refinement

101 102 103

Model Size [KB]

0.987

0.988

0.989

0.990

0.991

0.992

0.993Ac

cura

cy

CACOMPDREPGBICIELMDRERFRF-LR

101 102 103 104

Model Size [KB]

0.70

0.75

0.80

0.85

0.90

0.95

Accu

racy

CACOMPDREPGBICIELMDRERFRF-LR

Figure 21: 5-fold cross-validation accuracy over the size of the ensemble for different nl anddifferent M on the chess dataset. Single points are the individual parameterconfigurations whereas the solid line depicts the corresponding Pareto Front.Left side show the ida2016 dataset, right side shows the japanese-vowels dataset.

101 102 103 104

Model Size [KB]

0.84

0.85

0.86

0.87

0.88

Accu

racy

CACOMPDREPGBICIELMDRERFRF-LR

101 102 103 104

Model Size [KB]

0.70

0.75

0.80

0.85

0.90

0.95

Accu

racy

CACOMPDREPGBICIELMDRERFRF-LR

Figure 22: 5-fold cross-validation accuracy over the size of the ensemble for different nl anddifferent M on the chess dataset. Single points are the individual parameterconfigurations whereas the solid line depicts the corresponding Pareto Front.Left side show the magic dataset, right side shows the mnist dataset.

13

Sebastian Buschjager, Katharina Morik

101 102 103 104

Model Size [KB]

0.9350

0.9375

0.9400

0.9425

0.9450

0.9475

0.9500

0.9525

Accu

racy

CACOMPDREPGBICIELMDRERFRF-LR

101 102 103 104

Model Size [KB]

0.935

0.940

0.945

0.950

0.955

0.960

0.965

0.970

Accu

racy

CACOMPDREPGBICIELMDRERFRF-LR

Figure 23: 5-fold cross-validation accuracy over the size of the ensemble for different nl anddifferent M on the chess dataset. Single points are the individual parameterconfigurations whereas the solid line depicts the corresponding Pareto Front.Left side show the mozilla dataset, right side shows the nomao dataset.

101 102 103 104

Model Size [KB]

0.60

0.65

0.70

0.75

0.80

0.85

0.90

0.95

Accu

racy

CACOMPDREPGBICIELMDRERFRF-LR

101 102 103 104

Model Size [KB]

0.84

0.85

0.86

0.87

0.88

0.89

0.90

0.91

0.92Ac

cura

cy

CACOMPDREPGBICIELMDRERFRF-LR

Figure 24: 5-fold cross-validation accuracy over the size of the ensemble for different nl anddifferent M on the chess dataset. Single points are the individual parameterconfigurations whereas the solid line depicts the corresponding Pareto Front.Left side show the postures dataset, right side shows the satimage dataset.

4.1 Accuracies under various resource constraints

5. Revisiting Ensemble Pruning on More Datasets with a dedicatedpruning set

Some authors use a dedicated pruning set (see e.g. ) for ensemble pruning which wasnot used for training the ensemble. For completeness, we adapt this approach into theexperimental protocol. We now split the training data into two sets with 2/3 and 1/3 of theoriginal training data. The 2/3 of the training data is used to train the base ensemble, andthe 1/3 of the data is used for pruning. As before, we either use a 5-fold cross validationor the given test/train split. For reference, recall our experimental protocol: Oshiro et al.showed in ? that the prediction of a RF stabilizes between 128 and 256 trees in the ensembleand adding more trees to the ensemble does not yield significantly better results. Hence, wetrain the ‘base’ Random Forests with M = 256 trees. To control the individual errors of treeswe set the maximum number of leaf nodes nl to values between nl ∈ {64, 128, 256, 512, 1024}.

14

APPENDIX: Improving the Accuracy-Memory Trade-Off of Random Forests Via Leaf-Refinement

model CA COMP DREP GB IC IE LMD RE RF RF-LR

adult 85.120 85.467 85.403 86.244 85.295 85.824 85.056 86.035 85.234 85.891anura 95.789 96.484 96.220 91.564 96.609 96.372 96.081 96.609 96.178 96.831avila 86.102 93.382 91.115 59.496 93.435 93.219 82.446 94.197 86.285 88.355bank 89.741 89.985 89.927 90.527 90.213 90.226 89.706 90.246 89.764 90.343chess 44.914 47.986 46.696 30.175 46.753 48.371 45.391 48.571 44.614 51.205connect 71.551 73.052 72.595 67.584 73.057 73.223 71.993 73.313 71.466 75.160eeg 81.015 83.037 82.917 79.226 82.911 83.451 81.455 83.565 82.443 84.059elec 82.252 82.122 83.009 81.941 79.401 83.737 81.649 83.942 82.027 83.464ida2016 98.956 99.038 98.969 99.038 99.087 99.025 98.950 99.094 99.031 99.031japanese-vowels 86.819 88.796 87.843 81.930 88.716 88.626 87.280 88.927 87.632 90.433magic 86.109 86.366 86.140 86.629 86.072 86.487 86.114 86.640 86.019 86.187mnist 80.700 80.000 79.400 70.600 81.200 79.900 79.800 82.200 78.900 80.500mozilla 94.442 94.628 94.661 94.493 94.815 94.693 94.275 94.783 94.532 94.538nomao 95.242 95.372 95.239 95.273 95.381 95.567 95.065 95.683 95.358 95.668postures 74.960 76.138 75.261 64.126 75.477 75.978 74.101 76.873 74.673 75.069satimage 87.807 88.491 87.776 85.925 88.289 87.589 87.403 88.258 87.760 87.216

Table 2: Test accuracies for models with a memory consumption below 32 KB for eachmethod and each dataset averaged over a 5 fold cross validation. Rounded to thethird decimal digit. Larger is better. The best method is depicted in bold.

model CA COMP DREP GB IC IE LMD RE RF RF-LR

adult 85.455 85.777 85.618 86.616 85.799 85.882 85.378 86.128 85.464 86.241anura 96.511 97.137 96.873 95.024 97.192 96.928 96.539 97.067 96.525 97.512avila 91.930 96.957 95.318 67.724 96.760 96.689 86.965 97.048 92.534 94.278bank 89.772 90.049 89.927 90.677 90.213 90.330 89.819 90.336 89.830 90.522chess 48.025 51.714 50.492 34.969 50.356 51.793 49.041 52.495 48.090 57.382connect 72.426 73.898 73.409 70.847 73.724 73.832 73.110 74.134 72.666 77.498eeg 84.419 85.574 84.419 82.463 84.780 85.033 83.852 85.527 84.606 86.622elec 83.523 83.620 84.075 83.878 82.749 84.556 82.817 84.680 83.391 84.894ida2016 99.044 99.119 99.025 99.094 99.106 99.100 99.031 99.125 99.075 99.219japanese-vowels 90.061 91.487 91.045 87.341 91.517 90.332 90.794 91.587 90.503 93.173magic 86.109 86.613 86.282 87.355 86.692 86.771 86.456 86.845 86.419 86.997mnist 80.700 85.700 84.300 74.400 84.700 84.100 85.000 84.900 84.200 87.000mozilla 94.590 94.764 94.661 94.590 94.815 94.860 94.468 94.860 94.545 94.699nomao 95.508 95.804 95.575 95.958 95.749 95.819 95.358 95.802 95.633 96.063postures 79.913 81.688 80.827 69.058 81.137 80.996 79.599 81.727 80.246 81.081satimage 88.647 88.880 88.663 87.449 88.911 88.616 88.647 89.020 88.538 88.834

Table 3: Test accuracies for models with a memory consumption below 64 KB for eachmethod and each dataset averaged over a 5 fold cross validation. Rounded to thethird decimal digit. Larger is better. The best method is depicted in bold.

15

Sebastian Buschjager, Katharina Morik

model CA COMP DREP GB IC IE LMD RE RF RF-LR

adult 85.685 85.925 85.784 87.135 85.980 86.164 85.738 86.155 85.787 86.508anura 96.511 97.568 97.206 96.553 97.679 97.512 97.137 97.415 97.206 97.693avila 94.738 98.720 95.697 75.262 98.845 98.730 91.015 98.869 93.411 97.791bank 89.967 90.148 89.985 90.737 90.259 90.376 89.830 90.354 89.994 90.794chess 53.315 56.027 54.370 40.719 55.318 55.703 53.201 56.672 53.261 62.749connect 73.348 74.897 74.065 73.850 75.083 75.026 74.327 75.305 73.825 79.142eeg 85.534 87.370 86.242 85.734 87.136 87.163 86.355 87.457 86.442 88.992elec 84.589 84.318 84.872 85.748 84.635 85.549 83.896 85.851 84.574 86.416ida2016 99.044 99.119 99.106 99.169 99.125 99.131 99.156 99.125 99.087 99.244japanese-vowels 91.979 93.575 92.912 91.748 93.444 92.651 92.631 93.143 92.410 94.699magic 86.608 86.882 86.661 87.733 87.071 86.987 87.087 87.008 86.918 87.570mnist 86.900 89.000 87.600 79.300 88.500 87.400 87.200 86.800 86.900 90.200mozilla 94.622 95.002 94.744 94.989 94.995 94.957 94.783 94.879 94.834 94.957nomao 95.738 96.092 95.903 96.408 95.973 96.060 95.920 96.060 95.871 96.298postures 84.582 86.166 85.655 75.760 85.933 86.149 84.167 86.267 84.400 86.300satimage 88.647 89.378 89.300 88.631 89.425 89.393 89.518 89.456 89.580 90.140

Table 4: Test accuracies for models with a memory consumption below 128 KB for eachmethod and each dataset averaged over a 5 fold cross validation. Rounded to thethird decimal digit. Larger is better. The best method is depicted in bold.

model CA COMP DREP GB IC IE LMD RE RF RF-LR

adult 85.774 86.174 85.956 87.135 86.011 86.232 85.738 86.272 85.799 86.508anura 96.511 97.818 97.748 97.429 98.040 97.929 97.582 97.818 97.735 98.013avila 95.016 99.022 97.427 82.820 99.176 99.123 93.315 99.248 96.526 98.807bank 89.967 90.297 90.082 90.737 90.290 90.443 89.952 90.471 90.038 90.874chess 56.911 59.998 57.314 44.678 59.791 59.428 57.496 60.636 56.238 66.852connect 74.522 76.270 75.119 76.170 76.239 76.333 75.100 76.303 74.997 80.340eeg 87.223 88.364 88.511 85.734 88.959 88.778 87.784 88.785 87.951 90.454elec 85.220 85.810 85.832 85.748 86.043 86.692 84.922 86.562 85.362 87.829ida2016 99.106 99.225 99.119 99.169 99.262 99.175 99.238 99.175 99.194 99.244japanese-vowels 91.979 94.810 94.428 94.860 94.790 94.077 94.278 94.709 94.408 96.205magic 86.655 87.281 87.218 87.733 87.234 87.239 87.302 87.365 86.950 87.570mnist 86.900 90.100 89.300 84.600 90.600 89.700 88.800 89.600 89.300 91.800mozilla 94.731 95.034 94.982 94.989 95.092 95.092 94.802 94.995 94.912 95.014nomao 96.039 96.222 96.150 96.408 96.318 96.269 96.077 96.356 96.135 96.539postures 88.587 89.596 88.747 81.100 89.231 89.390 88.085 89.633 88.281 90.504satimage 88.802 90.218 89.891 89.782 89.705 89.891 90.000 90.156 90.016 90.715

Table 5: Test accuracies for models with a memory consumption below 256 KB for eachmethod and each dataset averaged over a 5 fold cross validation. Rounded to thethird decimal digit. Larger is better. The best method is depicted in bold.

16

APPENDIX: Improving the Accuracy-Memory Trade-Off of Random Forests Via Leaf-Refinement

For ensemble pruning we use RE and compare it against a random selection of trees fromthe original ensemble (which is the same a training a smaller forest directly). In both cases asub-ensemble with K ∈ {2, 4, 8, 16, 32, 64, 128, 256} members is selected so that for K = 256the original RF is recovered.

0 50 100 150 200 250Number of trees

82.5

83.0

83.5

84.0

84.5

85.0

85.5

86.0

Accu

racy

RE nl = 1024RF nl = 1024RE nl = 512RF nl = 512RE nl = 256RF nl = 256RE nl = 128RF nl = 128RE nl = 64RF nl = 64

model COMP DREP IC IE LMD REmax leaf nodes n estimators

64 8.0 85.59 85.14 85.38 85.53 85.07 86.0816.0 85.64 85.39 85.61 85.66 85.17 85.9332.0 85.64 85.43 85.80 85.71 85.35 85.8164.0 85.71 85.28 85.83 85.68 85.40 85.80128.0 85.57 85.23 85.65 85.62 85.34 85.67

128 8.0 85.55 85.51 85.51 85.93 85.16 85.9916.0 85.85 85.63 85.84 85.97 85.29 86.0832.0 85.91 85.65 85.92 85.93 85.51 86.1264.0 85.88 85.68 86.06 86.01 85.72 85.97128.0 85.91 85.69 85.97 85.99 85.70 85.94

256 8.0 85.77 85.71 85.65 86.06 85.43 85.9216.0 85.87 85.97 86.05 86.04 85.63 86.1732.0 86.14 85.92 86.15 86.18 85.71 86.1264.0 86.12 85.97 86.17 86.16 85.92 86.18128.0 86.15 86.00 86.19 86.20 85.95 86.16

512 8.0 85.90 85.72 85.68 85.95 85.42 85.8416.0 85.97 85.99 86.02 86.08 85.63 86.2332.0 86.13 86.11 86.12 86.18 85.91 86.1864.0 86.18 86.19 86.19 86.31 86.05 86.22128.0 86.19 86.24 86.23 86.29 86.04 86.24

1024 8.0 85.56 85.55 85.43 85.79 85.23 85.8216.0 85.90 85.87 85.92 86.03 85.81 86.2032.0 86.07 86.03 86.24 86.17 86.06 86.1664.0 86.24 86.15 86.33 86.26 86.12 86.22128.0 86.30 86.20 86.27 86.32 86.24 86.30

Figure 25: (Left) The error over the number of trees in the ensemble on the adult dataset.Dashed lines depict the Random Forest and solid lines are the correspondingpruned ensemble via Reduced Error pruning. (Right) The 5-fold cross-validationaccuracy on the adult dataset. Rounded to the second decimal digit. Larger isbetter.

17

Sebastian Buschjager, Katharina Morik

0 50 100 150 200 250Number of trees

92

93

94

95

96

97

98

Accu

racy

RE nl = 1024RF nl = 1024RE nl = 512RF nl = 512RE nl = 256RF nl = 256RE nl = 128RF nl = 128RE nl = 64RF nl = 64

model COMP DREP IC IE LMD REmax leaf nodes n estimators

64 8.0 96.50 96.26 96.64 96.65 95.89 96.3216.0 96.69 96.44 96.85 96.76 96.23 96.5932.0 96.86 96.55 97.07 96.80 96.47 96.7964.0 96.83 96.58 96.89 96.76 96.55 96.73128.0 96.82 96.75 96.79 96.76 96.71 96.72

128 8.0 96.62 96.69 96.79 96.48 96.50 97.0416.0 97.26 97.10 97.33 97.18 97.16 97.3732.0 97.53 97.44 97.68 97.47 97.29 97.6164.0 97.69 97.57 97.72 97.48 97.58 97.73128.0 97.62 97.50 97.68 97.51 97.58 97.67

256 8.0 96.97 96.71 96.94 96.86 96.76 96.6916.0 97.54 97.26 97.64 97.58 97.43 97.2632.0 97.80 97.54 97.78 97.60 97.62 97.6264.0 97.98 97.78 97.89 97.72 97.73 97.75128.0 97.79 97.79 97.79 97.73 97.85 97.73

512 8.0 96.61 96.55 96.91 96.69 96.82 96.8516.0 97.37 97.10 97.48 97.39 97.46 97.5332.0 97.72 97.61 97.68 97.64 97.73 97.7864.0 97.83 97.71 97.92 97.65 97.73 97.79128.0 97.85 97.80 97.87 97.83 97.82 97.71

1024 8.0 96.79 96.62 96.79 96.65 96.75 97.0016.0 97.53 97.16 97.53 97.54 97.32 97.4332.0 97.80 97.43 97.79 97.75 97.69 97.7664.0 97.89 97.64 97.94 97.87 97.64 97.83128.0 97.76 97.62 97.85 97.85 97.83 97.85

Figure 26: (Left) The error over the number of trees in the ensemble on the anura dataset.Dashed lines depict the Random Forest and solid lines are the correspondingpruned ensemble via Reduced Error pruning. (Right) The 5-fold cross-validationaccuracy on the anura dataset. Rounded to the second decimal digit. Larger isbetter.

0 50 100 150 200 250Number of trees

75

80

85

90

95

100

Accu

racy

RE nl = 1024RF nl = 1024RE nl = 512RF nl = 512RE nl = 256RF nl = 256RE nl = 128RF nl = 128RE nl = 64RF nl = 64

model COMP DREP IC IE LMD REmax leaf nodes n estimators

64 8.0 80.60 77.01 80.67 79.33 78.23 81.5716.0 81.63 77.53 81.21 79.88 79.14 81.9132.0 81.02 77.64 80.84 80.02 78.76 81.7164.0 80.19 77.93 80.49 79.90 78.48 81.33128.0 79.49 77.78 79.62 79.29 78.30 79.91

128 8.0 88.80 83.96 88.93 88.21 84.01 89.1116.0 89.85 84.39 90.00 88.85 85.40 90.3032.0 89.57 84.84 89.80 89.19 85.75 89.9564.0 88.98 85.08 89.07 88.37 85.97 89.13128.0 87.66 85.46 87.92 87.41 85.95 87.70

256 8.0 95.44 90.01 95.50 94.91 87.79 95.7216.0 96.03 91.13 96.07 95.69 89.23 96.0432.0 95.80 91.71 96.06 95.52 90.33 95.7764.0 95.26 92.09 95.35 95.08 90.71 95.04128.0 94.15 92.10 94.35 94.04 91.13 93.97

512 8.0 98.64 95.35 98.62 98.44 90.87 98.5716.0 98.68 96.05 98.84 98.71 92.28 98.8232.0 98.68 96.49 98.75 98.67 93.37 98.6064.0 98.37 96.77 98.55 98.37 93.89 98.24128.0 97.83 96.70 97.97 97.88 94.86 97.63

1024 8.0 99.13 97.30 99.20 99.21 93.93 99.1716.0 99.46 98.01 99.54 99.51 94.75 99.3932.0 99.45 98.44 99.57 99.51 95.43 99.4264.0 99.37 98.63 99.48 99.46 96.28 99.30128.0 99.22 98.67 99.30 99.28 97.33 99.15

Figure 27: (Left) The error over the number of trees in the ensemble on the avila dataset.Dashed lines depict the Random Forest and solid lines are the correspondingpruned ensemble via Reduced Error pruning. (Right) The 5-fold cross-validationaccuracy on the avila dataset. Rounded to the second decimal digit. Larger isbetter.

18

APPENDIX: Improving the Accuracy-Memory Trade-Off of Random Forests Via Leaf-Refinement

0 50 100 150 200 250Number of trees

88.5

89.0

89.5

90.0

90.5

Accu

racy

RE nl = 1024RF nl = 1024RE nl = 512RF nl = 512RE nl = 256RF nl = 256RE nl = 128RF nl = 128RE nl = 64RF nl = 64

model COMP DREP IC IE LMD REmax leaf nodes n estimators

64 8.0 89.89 89.67 90.05 90.17 89.69 90.1416.0 89.99 89.57 90.17 90.07 89.73 90.2232.0 90.08 89.66 90.15 90.04 89.71 90.2464.0 90.01 89.66 90.11 89.86 89.68 90.15128.0 89.89 89.65 89.87 89.69 89.69 89.99

128 8.0 90.11 89.94 90.23 90.21 89.69 90.2516.0 90.13 89.75 90.25 90.08 89.83 90.2732.0 90.06 89.73 90.21 90.13 89.90 90.2264.0 90.07 89.71 90.08 89.97 89.82 90.21128.0 89.95 89.81 89.96 89.82 89.79 90.14

256 8.0 90.18 89.98 90.26 90.19 89.95 90.2716.0 90.26 90.00 90.28 90.31 90.05 90.2832.0 90.22 90.02 90.29 90.26 90.09 90.2264.0 90.25 89.99 90.33 90.14 89.98 90.24128.0 90.11 89.95 90.17 90.02 90.02 90.16

512 8.0 90.07 90.10 90.10 90.25 90.01 90.2016.0 90.19 90.24 90.28 90.40 90.13 90.2832.0 90.43 90.21 90.45 90.44 90.24 90.3864.0 90.51 90.21 90.54 90.44 90.30 90.46128.0 90.46 90.27 90.50 90.39 90.40 90.47

1024 8.0 90.07 90.04 90.06 90.15 89.87 90.1616.0 90.27 90.22 90.27 90.33 90.34 90.3632.0 90.42 90.27 90.47 90.39 90.40 90.3564.0 90.53 90.41 90.54 90.42 90.45 90.35128.0 90.42 90.37 90.42 90.47 90.38 90.40

Figure 28: (Left) The error over the number of trees in the ensemble on the bank dataset.Dashed lines depict the Random Forest and solid lines are the correspondingpruned ensemble via Reduced Error pruning. (Right) The 5-fold cross-validationaccuracy on the bank dataset. Rounded to the second decimal digit. Larger isbetter.

0 50 100 150 200 250Number of trees

35

40

45

50

55

60

65

Accu

racy

RE nl = 1024RF nl = 1024RE nl = 512RF nl = 512RE nl = 256RF nl = 256RE nl = 128RF nl = 128RE nl = 64RF nl = 64

model COMP DREP IC IE LMD REmax leaf nodes n estimators

64 8.0 44.04 41.52 44.13 42.74 43.03 45.2116.0 44.98 42.83 44.76 43.41 44.07 46.3132.0 45.11 43.35 45.04 43.59 44.55 46.5764.0 45.03 43.47 45.03 43.41 44.56 46.08128.0 44.44 NaN 44.43 43.38 44.11 45.18

128 8.0 48.71 46.29 49.12 47.63 47.48 49.9316.0 50.35 47.80 50.31 48.66 48.82 51.0832.0 50.54 48.15 50.32 49.14 49.75 51.1564.0 50.48 48.69 50.65 49.01 49.76 51.16128.0 50.22 NaN 50.10 49.08 49.65 50.58

256 8.0 53.39 51.18 53.68 52.42 52.15 53.9816.0 54.88 52.18 55.04 53.60 54.12 55.2032.0 55.33 53.09 55.76 54.20 54.55 55.8564.0 55.18 53.36 55.19 54.22 54.48 55.75128.0 54.65 NaN 54.73 54.07 54.10 55.23

512 8.0 58.07 54.25 57.23 56.90 56.01 58.3316.0 59.36 56.66 59.50 58.22 58.48 60.0032.0 60.23 57.85 60.58 59.17 59.18 60.7264.0 60.41 58.25 60.62 59.36 59.44 60.61128.0 60.07 NaN 59.99 59.01 59.35 60.18

1024 8.0 60.55 58.56 61.14 59.81 59.11 60.9016.0 62.86 60.20 63.14 62.12 62.01 62.8832.0 64.01 61.51 64.23 63.31 63.01 63.9064.0 64.50 62.40 64.26 63.60 63.63 64.28128.0 64.02 NaN 64.20 63.26 63.71 63.98

Figure 29: (Left) The error over the number of trees in the ensemble on the chess dataset.Dashed lines depict the Random Forest and solid lines are the correspondingpruned ensemble via Reduced Error pruning. (Right) The 5-fold cross-validationaccuracy on the chess dataset. Rounded to the second decimal digit. Larger isbetter.

19

Sebastian Buschjager, Katharina Morik

0 50 100 150 200 250Number of trees

69

70

71

72

73

74

75

76

77

Accu

racy

RE nl = 1024RF nl = 1024RE nl = 512RF nl = 512RE nl = 256RF nl = 256RE nl = 128RF nl = 128RE nl = 64RF nl = 64

model COMP DREP IC IE LMD REmax leaf nodes n estimators

64 8.0 70.71 70.01 70.70 70.95 69.77 71.6316.0 70.35 69.77 70.35 70.80 69.37 71.3732.0 70.16 69.39 70.15 70.53 69.30 70.9964.0 69.93 69.38 69.94 70.37 69.27 70.59128.0 69.70 69.38 69.70 70.03 69.29 70.09

128 8.0 72.19 71.34 72.40 72.48 71.20 72.9316.0 71.96 71.09 72.09 72.27 71.10 72.6432.0 71.67 71.07 71.73 71.94 70.88 72.1764.0 71.42 70.94 71.45 71.68 70.95 71.93128.0 71.26 70.93 71.25 71.44 70.98 71.51

256 8.0 73.66 72.91 73.83 73.84 72.30 74.2016.0 73.66 72.79 73.73 73.80 72.56 74.0732.0 73.40 72.77 73.44 73.54 72.72 73.8464.0 73.28 72.77 73.24 73.30 72.71 73.52128.0 72.97 72.70 72.98 73.00 72.73 73.14

512 8.0 75.44 74.23 75.55 75.35 74.46 75.6116.0 75.48 74.35 75.60 75.35 74.47 75.6632.0 75.37 74.49 75.49 75.30 74.54 75.4764.0 75.20 74.42 75.29 75.11 74.56 75.23128.0 74.87 74.43 74.88 74.84 74.53 74.87

1024 8.0 76.55 75.62 76.71 76.62 75.37 76.5516.0 76.83 75.77 77.04 76.88 75.71 76.9532.0 76.86 75.93 76.96 77.00 75.94 76.9064.0 76.75 75.93 76.80 76.69 76.01 76.68128.0 76.45 75.92 76.46 76.37 76.00 76.30

Figure 30: (Left) The error over the number of trees in the ensemble on the connect dataset.Dashed lines depict the Random Forest and solid lines are the correspondingpruned ensemble via Reduced Error pruning. (Right) The 5-fold cross-validationaccuracy on the connect dataset. Rounded to the second decimal digit. Larger isbetter.

0 50 100 150 200 250Number of trees

76

78

80

82

84

86

88

90

92

Accu

racy

RE nl = 1024RF nl = 1024RE nl = 512RF nl = 512RE nl = 256RF nl = 256RE nl = 128RF nl = 128RE nl = 64RF nl = 64

model COMP DREP IC IE LMD REmax leaf nodes n estimators

64 8.0 81.73 80.87 81.81 81.76 80.97 81.6416.0 82.38 81.54 82.58 82.34 81.96 82.8932.0 83.11 81.91 82.75 82.43 82.18 83.0064.0 83.03 82.18 82.97 82.25 82.84 82.90128.0 82.94 82.40 82.88 82.29 82.71 82.89

128 8.0 84.77 83.53 84.40 84.03 83.48 84.6216.0 85.60 84.66 85.65 84.84 84.85 85.5532.0 86.28 85.09 86.28 85.30 85.75 85.8464.0 86.13 85.39 86.34 85.51 85.69 85.98128.0 85.97 85.46 85.91 85.59 85.67 85.92

256 8.0 86.60 85.86 86.98 86.44 85.31 86.1816.0 87.72 87.09 88.14 87.66 87.12 87.9532.0 88.32 87.82 88.95 88.28 88.06 88.2764.0 88.89 88.22 88.92 88.57 88.28 88.58128.0 88.82 88.40 88.81 88.44 88.54 88.50

512 8.0 87.94 87.42 88.00 87.88 86.76 87.8116.0 89.56 88.70 89.69 89.30 88.89 89.3232.0 90.52 89.79 90.34 90.17 89.72 90.3564.0 90.79 90.23 91.11 90.60 90.22 90.58128.0 90.84 90.51 90.94 90.69 90.58 90.56

1024 8.0 87.79 87.30 87.77 87.84 86.56 87.9116.0 89.99 89.37 90.11 89.99 88.83 89.9432.0 90.91 90.63 91.22 91.00 90.53 90.9364.0 91.86 91.16 91.94 91.63 91.35 91.59128.0 91.89 91.53 91.98 91.74 91.63 91.86

Figure 31: (Left) The error over the number of trees in the ensemble on the eeg dataset.Dashed lines depict the Random Forest and solid lines are the correspondingpruned ensemble via Reduced Error pruning. (Right) The 5-fold cross-validationaccuracy on the eeg dataset. Rounded to the second decimal digit. Larger isbetter.

20

APPENDIX: Improving the Accuracy-Memory Trade-Off of Random Forests Via Leaf-Refinement

0 50 100 150 200 250Number of trees

80

81

82

83

84

85

86

87

Accu

racy

RE nl = 1024RF nl = 1024RE nl = 512RF nl = 512RE nl = 256RF nl = 256RE nl = 128RF nl = 128RE nl = 64RF nl = 64

model COMP DREP IC IE LMD REmax leaf nodes n estimators

64 8.0 81.50 81.76 80.41 82.52 80.94 82.5716.0 82.12 81.69 82.02 82.66 81.65 82.7432.0 82.24 81.79 82.26 82.48 81.73 82.6864.0 82.26 81.79 82.37 82.38 81.83 82.50128.0 82.15 81.83 82.18 82.09 81.82 82.32

128 8.0 82.88 82.52 81.36 83.45 82.29 83.5516.0 83.12 82.71 83.06 83.59 82.65 83.7032.0 83.36 82.91 83.34 83.45 82.83 83.6764.0 83.31 82.96 83.41 83.48 82.93 83.63128.0 83.29 82.99 83.32 83.29 82.95 83.36

256 8.0 84.14 83.94 84.06 84.43 83.45 84.4916.0 84.53 84.00 84.49 84.61 84.05 84.7932.0 84.77 84.25 84.94 84.65 84.28 84.8864.0 84.81 84.29 84.94 84.72 84.30 84.79128.0 84.71 84.39 84.72 84.59 84.39 84.71

512 8.0 85.39 85.05 85.61 85.77 84.78 85.6316.0 85.94 85.39 86.13 85.94 85.31 86.0732.0 86.16 85.49 86.18 86.07 85.51 86.2764.0 86.10 85.65 86.19 85.95 85.66 86.17128.0 85.97 85.75 85.96 85.83 85.70 85.96

1024 8.0 86.42 86.07 86.61 86.80 85.38 86.8116.0 87.10 86.48 87.35 87.20 86.30 87.1832.0 87.38 86.63 87.37 87.40 86.69 87.3164.0 87.40 86.85 87.44 87.24 86.74 87.34128.0 87.21 86.80 87.27 87.09 86.83 87.14

Figure 32: (Left) The error over the number of trees in the ensemble on the elec dataset.Dashed lines depict the Random Forest and solid lines are the correspondingpruned ensemble via Reduced Error pruning. (Right) The 5-fold cross-validationaccuracy on the elec dataset. Rounded to the second decimal digit. Larger isbetter.

0 50 100 150 200 250Number of trees

98.6

98.7

98.8

98.9

99.0

99.1

99.2

Accu

racy

RE nl = 1024RF nl = 1024RE nl = 512RF nl = 512RE nl = 256RF nl = 256RE nl = 128RF nl = 128RE nl = 64RF nl = 64

model COMP DREP IC IE LMD REmax leaf nodes n estimators

64 8.0 98.88 99.07 98.99 98.96 98.83 99.0316.0 99.04 99.02 99.02 99.01 99.01 99.0032.0 99.01 99.02 99.00 99.02 99.01 99.0864.0 99.03 99.03 99.08 99.01 99.04 99.06128.0 99.07 99.03 99.09 99.06 99.04 99.05

128 8.0 99.08 99.02 99.11 98.98 98.98 99.0416.0 99.08 99.09 99.11 99.08 99.12 99.1132.0 99.14 99.12 99.09 99.08 99.09 99.1464.0 99.14 99.13 99.12 99.11 99.13 99.12128.0 99.14 99.16 99.11 99.12 99.15 99.14

256 8.0 99.03 98.98 98.98 98.99 98.99 98.9716.0 99.12 99.11 99.09 99.05 99.11 99.1032.0 99.13 99.18 99.06 99.12 99.14 99.1964.0 99.14 99.17 99.14 99.13 99.14 99.18128.0 99.18 99.17 99.14 99.12 99.14 99.15

512 8.0 99.01 99.06 99.06 98.96 98.98 98.9816.0 99.09 99.07 99.11 99.13 98.99 99.1132.0 99.16 99.19 99.14 99.13 99.14 99.1264.0 99.19 99.19 99.18 99.16 99.18 99.17128.0 99.22 99.16 99.17 99.14 99.17 99.16

1024 8.0 99.00 99.07 99.03 99.11 98.98 99.0816.0 99.09 99.12 99.16 99.17 99.07 99.1332.0 99.18 99.19 99.18 99.14 99.14 99.1864.0 99.22 99.26 99.22 99.16 99.18 99.21128.0 99.22 99.24 99.21 99.19 99.20 99.21

Figure 33: (Left) The error over the number of trees in the ensemble on the ida2016 dataset.Dashed lines depict the Random Forest and solid lines are the correspondingpruned ensemble via Reduced Error pruning. (Right) The 5-fold cross-validationaccuracy on the ida2016 dataset. Rounded to the second decimal digit. Larger isbetter.

21

Sebastian Buschjager, Katharina Morik

0 50 100 150 200 250Number of trees

77.5

80.0

82.5

85.0

87.5

90.0

92.5

95.0

97.5

Accu

racy

RE nl = 1024RF nl = 1024RE nl = 512RF nl = 512RE nl = 256RF nl = 256RE nl = 128RF nl = 128RE nl = 64RF nl = 64

model COMP DREP IC IE LMD REmax leaf nodes n estimators

64 8.0 89.02 87.32 89.18 87.70 87.35 88.8516.0 90.64 89.57 90.65 88.89 89.58 90.4232.0 91.43 90.34 91.33 89.64 91.00 91.4964.0 91.88 90.60 91.57 90.05 91.43 91.67128.0 91.60 90.91 91.60 90.44 91.53 91.42

128 8.0 90.95 89.84 90.88 90.06 90.21 90.9116.0 92.46 91.22 92.47 91.45 92.07 92.2132.0 93.34 92.21 93.32 92.19 93.15 93.0864.0 93.50 92.99 93.77 92.69 93.55 93.40128.0 93.69 93.34 93.76 93.13 93.52 93.67

256 8.0 92.38 91.69 92.07 91.42 91.97 92.3916.0 94.08 93.48 93.96 93.00 93.79 93.7432.0 94.78 94.44 94.68 93.83 94.52 94.7064.0 95.18 94.85 95.00 94.48 95.15 95.03128.0 95.32 95.09 95.20 94.87 95.14 95.07

512 8.0 93.36 93.25 93.42 93.27 93.03 93.4916.0 95.26 95.22 95.48 94.80 95.06 95.1832.0 96.00 95.95 96.35 95.76 96.03 95.8864.0 96.60 96.30 96.52 96.26 96.54 96.30128.0 96.63 96.46 96.69 96.41 96.63 96.52

1024 8.0 93.63 93.48 93.53 93.13 92.80 93.4616.0 95.43 94.94 95.39 94.76 95.10 95.4132.0 96.26 96.05 96.42 95.63 96.24 96.1164.0 96.65 96.56 96.53 96.26 96.60 96.47128.0 96.72 96.66 96.85 96.62 96.81 96.86

Figure 34: (Left) The error over the number of trees in the ensemble on the japanese-vowels dataset. Dashed lines depict the Random Forest and solid lines are thecorresponding pruned ensemble via Reduced Error pruning. (Right) The 5-foldcross-validation accuracy on the japanese-vowels dataset. Rounded to the seconddecimal digit. Larger is better.

0 50 100 150 200 250Number of trees

81

82

83

84

85

86

87

88

Accu

racy

RE nl = 1024RF nl = 1024RE nl = 512RF nl = 512RE nl = 256RF nl = 256RE nl = 128RF nl = 128RE nl = 64RF nl = 64

model COMP DREP IC IE LMD REmax leaf nodes n estimators

64 8.0 86.16 85.71 86.24 85.96 86.07 86.4516.0 86.62 86.12 86.60 86.05 86.45 86.4132.0 86.62 86.12 86.76 86.15 86.47 86.6064.0 86.62 86.24 86.70 86.27 86.42 86.53128.0 86.52 86.23 86.62 86.33 86.46 86.40

128 8.0 86.59 86.11 86.26 86.30 86.10 86.5016.0 86.82 86.51 86.84 86.52 86.68 86.8132.0 87.01 86.64 87.06 86.77 86.91 86.8164.0 86.96 86.56 87.05 86.84 86.86 86.87128.0 86.98 86.77 87.01 86.84 86.83 86.86

256 8.0 86.74 86.22 86.89 86.61 86.69 86.7116.0 87.15 87.03 87.07 86.80 87.02 86.9632.0 87.30 86.98 87.33 87.01 87.17 87.1564.0 87.24 87.06 87.38 87.04 87.21 87.37128.0 87.30 87.19 87.24 87.19 87.17 87.30

512 8.0 86.61 86.45 86.50 86.42 86.52 86.3716.0 87.22 87.02 87.29 87.12 87.21 87.1732.0 87.58 87.35 87.54 87.40 87.65 87.4464.0 87.65 87.58 87.68 87.48 87.44 87.47128.0 87.73 87.50 87.62 87.52 87.52 87.48

1024 8.0 86.28 86.26 86.47 86.56 85.97 86.5916.0 87.02 86.92 87.21 87.05 86.94 87.4132.0 87.46 87.35 87.42 87.62 87.46 87.6364.0 87.68 87.66 87.57 87.64 87.72 87.71128.0 87.82 87.65 87.76 87.69 87.72 87.79

Figure 35: (Left) The error over the number of trees in the ensemble on the magic dataset.Dashed lines depict the Random Forest and solid lines are the correspondingpruned ensemble via Reduced Error pruning. (Right) The 5-fold cross-validationaccuracy on the magic dataset. Rounded to the second decimal digit. Larger isbetter

22

APPENDIX: Improving the Accuracy-Memory Trade-Off of Random Forests Via Leaf-Refinement

0 50 100 150 200 250Number of trees

65

70

75

80

85

90

95

Accu

racy

RE nl = 1024RF nl = 1024RE nl = 512RF nl = 512RE nl = 256RF nl = 256RE nl = 128RF nl = 128RE nl = 64RF nl = 64

model COMP DREP IC IE LMD REmax leaf nodes n estimators

64 8.0 84.7 82.9 84.0 83.1 83.0 83.916.0 87.4 85.2 86.7 85.9 86.0 85.632.0 89.0 87.6 88.3 87.4 87.9 88.164.0 89.5 88.6 88.8 88.6 89.2 88.4128.0 89.0 89.1 88.6 89.0 89.6 89.3

128 8.0 88.1 86.2 87.0 85.3 87.1 85.916.0 88.9 88.2 89.5 89.2 89.0 88.632.0 91.0 89.4 90.4 89.3 90.2 90.564.0 91.2 90.9 91.1 90.5 90.9 91.4128.0 91.6 90.9 91.2 90.7 91.2 91.4

256 8.0 86.7 86.6 87.6 86.4 84.4 86.516.0 89.3 89.1 89.8 88.9 88.0 88.332.0 90.5 89.5 91.3 90.6 90.0 90.164.0 91.2 91.4 92.0 91.1 90.9 90.5128.0 92.4 91.7 92.1 91.8 91.9 91.3

512 8.0 85.3 86.3 87.4 87.8 85.8 87.016.0 90.0 90.0 89.6 90.5 88.9 89.132.0 91.8 91.3 92.0 91.5 90.4 92.364.0 92.6 93.2 92.7 93.0 92.6 92.9128.0 93.2 93.6 92.8 93.0 93.3 93.5

1024 8.0 86.2 85.3 85.6 87.3 85.1 87.016.0 90.7 90.3 90.2 89.9 89.8 89.732.0 91.0 91.2 91.9 91.7 92.2 91.564.0 91.8 92.9 93.2 93.3 92.7 93.0128.0 93.2 93.2 93.9 93.3 92.9 93.7

Figure 36: (Left) The error over the number of trees in the ensemble on the mnist dataset.Dashed lines depict the Random Forest and solid lines are the correspondingpruned ensemble via Reduced Error pruning. (Right) The 5-fold cross-validationaccuracy on the mnist dataset. Rounded to the second decimal digit. Larger isbetter.

0 50 100 150 200 250Number of trees

90

91

92

93

94

95

Accu

racy

RE nl = 1024RF nl = 1024RE nl = 512RF nl = 512RE nl = 256RF nl = 256RE nl = 128RF nl = 128RE nl = 64RF nl = 64

model COMP DREP IC IE LMD REmax leaf nodes n estimators

64 8.0 94.52 94.54 94.58 94.62 94.21 94.6416.0 94.56 94.50 94.60 94.66 94.36 94.6132.0 94.58 94.54 94.63 94.63 94.35 94.6664.0 94.59 94.53 94.63 94.62 94.44 94.63128.0 94.55 94.54 94.56 94.55 94.47 94.57

128 8.0 94.64 94.53 94.65 94.67 94.27 94.6616.0 94.74 94.58 94.76 94.80 94.39 94.7532.0 94.68 94.67 94.76 94.76 94.45 94.7764.0 94.71 94.65 94.74 94.75 94.60 94.73128.0 94.71 94.62 94.69 94.69 94.60 94.72

256 8.0 94.73 94.60 94.82 94.68 94.53 94.6516.0 94.87 94.73 94.78 94.82 94.64 94.9132.0 94.85 94.80 94.85 94.92 94.81 94.8664.0 94.85 94.80 94.88 94.92 94.80 94.85128.0 94.84 94.84 94.83 94.87 94.80 94.89

512 8.0 94.71 94.63 94.65 94.92 94.19 94.6616.0 94.99 94.92 95.01 95.09 94.76 94.9832.0 95.18 95.05 95.24 95.18 94.91 95.1764.0 95.15 95.04 95.18 95.17 94.94 95.15128.0 95.14 94.98 95.14 95.10 94.98 95.09

1024 8.0 94.69 94.38 94.54 94.73 94.09 94.6216.0 94.84 94.74 94.93 94.94 94.51 94.9232.0 94.96 94.88 94.92 94.97 94.67 95.0764.0 95.00 94.96 95.01 94.97 94.79 94.97128.0 95.00 94.92 95.03 94.96 94.81 94.97

Figure 37: (Left) The error over the number of trees in the ensemble on the mozilla dataset.Dashed lines depict the Random Forest and solid lines are the correspondingpruned ensemble via Reduced Error pruning. (Right) The 5-fold cross-validationaccuracy on the mozilla dataset. Rounded to the second decimal digit. Larger isbetter.

23

Sebastian Buschjager, Katharina Morik

0 50 100 150 200 250Number of trees

93.5

94.0

94.5

95.0

95.5

96.0

96.5

Accu

racy

RE nl = 1024RF nl = 1024RE nl = 512RF nl = 512RE nl = 256RF nl = 256RE nl = 128RF nl = 128RE nl = 64RF nl = 64

model COMP DREP IC IE LMD REmax leaf nodes n estimators

64 8.0 95.17 94.90 95.20 95.13 94.97 95.1516.0 95.35 95.13 95.32 95.31 95.15 95.2632.0 95.42 95.13 95.42 95.22 95.12 95.3064.0 95.38 95.17 95.39 95.23 95.19 95.34128.0 95.34 95.16 95.33 95.24 95.26 95.29

128 8.0 95.56 95.49 95.61 95.52 95.33 95.5516.0 95.77 95.66 95.74 95.77 95.56 95.7032.0 95.86 95.71 95.83 95.80 95.63 95.8064.0 95.80 95.72 95.81 95.80 95.69 95.75128.0 95.80 95.75 95.83 95.78 95.73 95.80

256 8.0 95.89 95.83 95.90 95.85 95.76 95.9416.0 96.15 95.96 96.07 96.07 95.99 96.0632.0 96.23 96.04 96.21 96.17 96.15 96.1664.0 96.23 96.09 96.23 96.18 96.10 96.19128.0 96.20 96.15 96.16 96.14 96.16 96.18

512 8.0 96.18 96.05 96.06 96.16 95.86 96.1216.0 96.44 96.29 96.41 96.43 96.26 96.4232.0 96.49 96.43 96.49 96.54 96.43 96.5564.0 96.55 96.47 96.56 96.54 96.48 96.52128.0 96.55 96.53 96.54 96.57 96.54 96.57

1024 8.0 96.12 96.09 96.20 96.11 95.98 96.1416.0 96.41 96.27 96.43 96.32 96.34 96.4232.0 96.56 96.43 96.50 96.44 96.52 96.5364.0 96.54 96.51 96.60 96.55 96.60 96.57128.0 96.63 96.60 96.63 96.63 96.64 96.65

Figure 38: (Left) The error over the number of trees in the ensemble on the nomao dataset.Dashed lines depict the Random Forest and solid lines are the correspondingpruned ensemble via Reduced Error pruning. (Right) The 5-fold cross-validationaccuracy on the nomao dataset. Rounded to the second decimal digit. Larger isbetter.

0 50 100 150 200 250Number of trees

70

75

80

85

90

95

Accu

racy

RE nl = 1024RF nl = 1024RE nl = 512RF nl = 512RE nl = 256RF nl = 256RE nl = 128RF nl = 128RE nl = 64RF nl = 64

model COMP DREP IC IE LMD REmax leaf nodes n estimators

64 8.0 76.80 74.79 76.31 74.43 75.84 77.5816.0 77.88 76.01 77.45 75.33 77.08 78.6232.0 78.31 76.41 77.94 75.87 77.32 78.9364.0 78.19 76.69 78.11 76.46 77.58 78.64128.0 77.86 NaN 77.79 76.72 77.48 78.07

128 8.0 82.50 80.57 81.87 81.53 81.47 82.5116.0 83.47 81.43 83.24 82.29 82.55 83.7032.0 83.71 82.10 83.70 82.68 83.06 84.0764.0 83.64 82.25 83.71 82.67 83.08 83.82128.0 83.34 NaN 83.33 82.61 82.82 83.39

256 8.0 87.18 85.86 86.83 86.47 86.12 87.1616.0 88.19 86.99 87.96 87.50 87.12 88.3132.0 88.41 87.57 88.43 87.98 87.87 88.6364.0 88.52 NaN 88.52 88.04 87.99 88.56128.0 88.38 NaN 88.36 88.04 87.99 88.34

512 8.0 90.84 89.93 90.85 90.49 90.07 90.9216.0 91.84 90.85 91.81 91.46 91.15 91.7532.0 92.17 91.34 92.14 91.87 91.61 92.1364.0 92.26 NaN 92.29 91.98 91.79 92.24128.0 92.12 NaN 92.16 91.97 91.86 92.06

1024 8.0 93.62 93.10 93.82 93.45 92.68 93.5716.0 94.48 93.86 94.58 94.34 93.66 94.4132.0 94.81 94.27 94.86 94.71 94.30 94.7264.0 94.89 NaN 94.95 94.78 94.56 94.82128.0 94.86 NaN 94.91 94.77 94.61 94.81

Figure 39: (Left) The error over the number of trees in the ensemble on the postures dataset.Dashed lines depict the Random Forest and solid lines are the correspondingpruned ensemble via Reduced Error pruning. (Right) The 5-fold cross-validationaccuracy on the postures dataset. Rounded to the second decimal digit. Largeris better.

24

APPENDIX: Improving the Accuracy-Memory Trade-Off of Random Forests Via Leaf-Refinement

0 50 100 150 200 250Number of trees

82

84

86

88

90

Accu

racy

RE nl = 1024RF nl = 1024RE nl = 512RF nl = 512RE nl = 256RF nl = 256RE nl = 128RF nl = 128RE nl = 64RF nl = 64

model COMP DREP IC IE LMD REmax leaf nodes n estimators

64 8.0 88.69 88.30 88.85 88.16 87.78 88.5816.0 89.18 88.80 89.14 88.85 89.08 89.0732.0 89.18 89.28 89.30 88.85 89.44 89.1964.0 89.52 89.10 89.46 88.94 89.21 89.24128.0 89.36 89.21 89.36 89.24 89.35 89.25

128 8.0 88.76 88.72 89.13 88.80 88.58 89.4416.0 89.66 89.36 89.61 89.33 89.14 89.7832.0 89.94 89.77 90.02 90.09 89.66 89.8864.0 90.03 90.05 90.40 90.00 90.05 90.17128.0 90.31 90.03 90.34 90.19 90.11 90.16

256 8.0 88.85 89.18 89.10 88.97 89.11 89.0516.0 89.75 90.16 90.06 90.12 89.98 90.3432.0 90.62 90.50 90.86 90.50 90.23 90.5664.0 90.90 90.61 90.92 90.82 90.53 90.72128.0 90.89 90.73 90.92 90.79 90.75 90.90

512 8.0 89.16 88.86 88.97 89.11 88.85 88.9116.0 90.26 90.05 90.17 90.16 90.34 90.1732.0 90.98 90.70 91.03 90.95 90.75 90.8164.0 91.24 90.96 91.09 90.95 91.01 90.84128.0 91.07 91.00 90.96 91.00 91.00 91.17

1024 8.0 88.72 88.44 89.14 88.85 88.66 89.0416.0 89.89 89.49 90.11 89.74 90.11 90.1232.0 90.34 89.86 90.42 90.34 90.62 90.5364.0 90.54 90.39 90.78 90.50 90.78 90.47128.0 90.95 90.62 90.76 90.59 90.92 90.93

Figure 40: (Left) The error over the number of trees in the ensemble on the satimage dataset.Dashed lines depict the Random Forest and solid lines are the correspondingpruned ensemble via Reduced Error pruning. (Right) The 5-fold cross-validationaccuracy on the satimage dataset. Rounded to the second decimal digit. Largeris better.

5.1 Plotting the Pareto Front For More Datasets with Dedicated Pruning Set

101 102 103 104

Model Size [KB]

0.835

0.840

0.845

0.850

0.855

0.860

0.865

0.870

Accu

racy

CACOMPDREPGBICIELMDRERFRF-LR

101 102 103

Model Size [KB]

0.60

0.65

0.70

0.75

0.80

0.85

0.90

0.95

1.00

Accu

racy

CACOMPDREPGBICIELMDRERFRF-LR

Figure 41: (left) 5-fold cross-validation accuracy on the adult dataset. (right) 5-fold cross-validation accuracy on the anura dataset.

25

Sebastian Buschjager, Katharina Morik

101 102 103 104

Model Size [KB]

0.5

0.6

0.7

0.8

0.9

1.0Ac

cura

cy

CACOMPDREPGBICIELMDRERFRF-LR

101 102 103 104

Model Size [KB]

0.894

0.896

0.898

0.900

0.902

0.904

0.906

0.908

Accu

racy

CACOMPDREPGBICIELMDRERFRF-LR

Figure 42: (left) 5-fold cross-validation accuracy on the avila dataset. (right) 5-fold cross-validation accuracy on the bank dataset.

101 102 103 104

Model Size [KB]

0.25

0.30

0.35

0.40

0.45

0.50

0.55

0.60

0.65

Accu

racy

CACOMPDREPGBICIELMDRERFRF-LR

101 102 103 104

Model Size [KB]

0.66

0.68

0.70

0.72

0.74

0.76

0.78

0.80

Accu

racy

CACOMPDREPGBICIELMDRERFRF-LR

Figure 43: (left) 5-fold cross-validation accuracy on the chess dataset. (right) 5-fold cross-validation accuracy on the connect dataset.

101 102 103 104

Model Size [KB]

0.750

0.775

0.800

0.825

0.850

0.875

0.900

0.925

Accu

racy

CACOMPDREPGBICIELMDRERFRF-LR

101 102 103 104

Model Size [KB]

0.72

0.74

0.76

0.78

0.80

0.82

0.84

0.86

0.88

Accu

racy

CACOMPDREPGBICIELMDRERFRF-LR

Figure 44: (left) 5-fold cross-validation accuracy on the eeg dataset. (right) 5-fold cross-validation accuracy on the elec dataset.

26

APPENDIX: Improving the Accuracy-Memory Trade-Off of Random Forests Via Leaf-Refinement

101 102 103

Model Size [KB]

0.986

0.988

0.990

0.992

Accu

racy

CACOMPDREPGBICIELMDRERFRF-LR

101 102 103 104

Model Size [KB]

0.70

0.75

0.80

0.85

0.90

0.95

Accu

racy

CACOMPDREPGBICIELMDRERFRF-LR

Figure 45: (left) 5-fold cross-validation accuracy on the ida2016 dataset. (right) 5-foldcross-validation accuracy on the japanese-vowels dataset.

101 102 103 104

Model Size [KB]

0.83

0.84

0.85

0.86

0.87

0.88

Accu

racy

CACOMPDREPGBICIELMDRERFRF-LR

101 102 103 104

Model Size [KB]

0.65

0.70

0.75

0.80

0.85

0.90

0.95Ac

cura

cy

CACOMPDREPGBICIELMDRERFRF-LR

Figure 46: (left) 5-fold cross-validation accuracy on the magic dataset. (right) 5-fold cross-validation accuracy on the mnist dataset.

101 102 103

Model Size [KB]

0.925

0.930

0.935

0.940

0.945

0.950

Accu

racy

CACOMPDREPGBICIELMDRERFRF-LR

101 102 103 104

Model Size [KB]

0.935

0.940

0.945

0.950

0.955

0.960

0.965

Accu

racy

CACOMPDREPGBICIELMDRERFRF-LR

Figure 47: (left) 5-fold cross-validation accuracy on the mozilla dataset. (right) 5-foldcross-validation accuracy on the nomao dataset.

27

Sebastian Buschjager, Katharina Morik

model CA COMP DREP GB IC IE LMD RE RF RF-LR

adult 85.102 85.587 85.400 86.244 85.381 85.756 85.071 86.085 85.188 85.541anura 95.455 96.498 96.261 91.564 96.637 96.650 95.886 96.317 95.928 96.678avila 85.360 92.035 89.150 59.496 91.163 91.939 81.718 91.743 84.152 86.170bank 89.717 89.887 89.830 90.527 90.053 90.184 89.695 90.140 89.775 89.929chess 43.834 46.571 45.801 30.175 45.734 46.970 43.841 47.762 43.545 48.065connect 70.771 72.530 72.450 67.584 72.524 72.993 71.360 73.197 71.100 74.555eeg 81.509 82.590 81.569 79.226 82.029 82.677 81.202 82.804 81.515 82.810elec 82.080 81.502 82.398 81.941 80.407 83.205 80.941 83.082 82.067 82.982ida2016 98.988 98.931 99.069 99.038 98.994 98.962 98.831 99.031 98.906 99.025japanese-vowels 86.287 89.017 87.321 81.930 89.178 87.702 87.351 88.847 87.391 88.877magic 85.762 86.161 85.714 86.629 86.240 85.961 86.067 86.445 85.814 86.004mnist 79.900 80.100 79.000 70.600 78.100 80.100 77.300 80.100 77.400 77.700mozilla 94.378 94.519 94.538 94.493 94.577 94.622 94.210 94.641 94.474 94.500nomao 94.998 95.259 95.271 95.273 95.250 95.323 94.972 95.404 95.152 95.381postures 74.165 76.115 75.412 64.126 75.319 76.093 73.922 76.518 73.986 75.310satimage 87.372 87.683 87.247 85.925 87.481 87.434 87.030 87.683 87.185 86.719

Table 6: Test accuracies for models with a memory consumption below 32 KB for eachmethod and each dataset averaged over a 5 fold cross validation using a dedicatedpruning set. Rounded to the third decimal digit. Larger is better. The best methodis depicted in bold.

101 102 103 104

Model Size [KB]

0.60

0.65

0.70

0.75

0.80

0.85

0.90

0.95

Accu

racy

CACOMPDREPGBICIELMDRERFRF-LR

101 102 103

Model Size [KB]

0.84

0.85

0.86

0.87

0.88

0.89

0.90

0.91

Accu

racy

CACOMPDREPGBICIELMDRERFRF-LR

Figure 48: (left) 5-fold cross-validation accuracy on the postures dataset. (right) 5-foldcross-validation accuracy on the satimage dataset.

28

APPENDIX: Improving the Accuracy-Memory Trade-Off of Random Forests Via Leaf-Refinement

model CA COMP DREP GB IC IE LMD RE RF RF-LR

adult 85.179 85.639 85.523 86.616 85.609 85.928 85.172 86.085 85.507 86.075anura 95.719 96.692 96.692 95.024 96.845 96.859 96.498 97.040 96.289 97.054avila 89.610 94.522 93.171 67.724 94.719 94.930 84.473 94.863 88.690 91.757bank 89.741 90.113 89.941 90.677 90.230 90.206 89.733 90.248 89.775 90.151chess 48.314 50.235 48.849 34.969 50.307 50.403 48.236 50.834 47.220 53.728connect 72.465 73.408 73.351 70.847 73.473 73.813 72.043 74.075 72.244 76.676eeg 83.091 84.766 83.718 82.463 84.399 84.272 83.478 84.619 83.271 85.501elec 83.073 83.038 83.333 83.878 82.018 83.940 82.289 84.176 82.826 84.040ida2016 99.012 99.081 99.069 99.094 99.106 99.006 99.012 99.044 99.050 99.131japanese-vowels 89.459 90.955 89.840 87.341 90.884 90.061 90.212 90.915 89.589 91.668magic 86.003 86.624 86.124 87.355 86.598 86.303 86.445 86.503 86.245 86.892mnist 82.800 84.700 82.900 74.400 84.000 83.100 83.000 83.900 84.200 83.700mozilla 94.455 94.641 94.538 94.590 94.654 94.667 94.365 94.661 94.603 94.635nomao 95.358 95.564 95.491 95.958 95.610 95.555 95.331 95.575 95.363 95.784postures 79.571 80.910 80.392 69.058 80.513 81.127 79.857 81.268 79.476 81.161satimage 87.869 88.694 88.305 87.449 88.849 88.165 87.776 88.585 88.616 88.305

Table 7: Test accuracies for models with a memory consumption below 64 KB for eachmethod and each dataset averaged over a 5 fold cross validation using a dedicatedpruning set. Rounded to the third decimal digit. Larger is better. The best methodis depicted in bold.

model CA COMP DREP GB IC IE LMD RE RF RF-LR

adult 85.741 85.854 85.710 87.135 85.839 86.060 85.434 86.085 85.633 86.269anura 96.386 97.262 97.095 96.553 97.331 97.582 97.165 97.373 97.067 97.609avila 92.107 97.623 95.007 75.262 97.791 97.738 88.154 97.796 92.126 95.534bank 89.876 90.184 89.980 90.737 90.259 90.206 89.949 90.268 89.978 90.644chess 51.066 54.926 51.900 40.719 53.682 53.486 52.146 54.716 50.150 57.018connect 73.270 74.738 74.105 73.850 74.969 74.854 73.972 75.147 73.354 77.865eeg 85.547 86.595 85.861 85.734 86.976 86.435 85.314 86.182 85.107 87.977elec 83.647 84.192 84.454 85.748 84.324 85.050 83.453 85.068 84.223 85.454ida2016 99.012 99.081 99.087 99.169 99.106 99.106 99.119 99.112 99.087 99.131japanese-vowels 90.433 92.461 91.688 91.748 92.471 91.447 92.069 92.390 91.878 93.575magic 86.251 86.818 86.508 87.733 86.887 86.613 86.692 86.813 86.603 87.255mnist 85.900 88.100 86.200 79.300 87.000 85.900 87.100 85.900 86.400 87.200mozilla 94.455 94.738 94.603 94.989 94.821 94.802 94.526 94.751 94.603 94.667nomao 95.697 95.891 95.833 96.408 95.897 95.854 95.764 95.941 95.825 96.089postures 83.912 85.294 84.616 75.760 84.726 85.003 83.849 85.527 84.016 85.691satimage 88.243 89.176 88.802 88.631 89.145 88.849 89.082 89.440 88.740 89.440

Table 8: Test accuracies for models with a memory consumption below 128 KB for eachmethod and each dataset averaged over a 5 fold cross validation using a dedicatedpruning set. Rounded to the third decimal digit. Larger is better. The best methodis depicted in bold.

29

Sebastian Buschjager, Katharina Morik

model CA COMP DREP GB IC IE LMD RE RF RF-LR

adult 85.741 85.906 85.974 87.135 86.051 86.060 85.630 86.168 85.793 86.269anura 96.386 97.540 97.443 97.429 97.679 97.748 97.457 97.609 97.387 97.860avila 92.222 98.644 95.644 82.820 98.620 98.442 90.871 98.567 94.249 97.685bank 90.069 90.257 90.102 90.737 90.277 90.308 90.049 90.277 89.978 90.657chess 54.038 58.066 54.822 44.678 57.228 56.897 56.009 58.330 54.502 60.572connect 74.302 75.970 75.079 76.170 76.171 75.863 74.456 75.844 74.331 78.972eeg 85.587 87.944 87.417 85.734 88.144 87.884 87.123 87.951 87.230 89.706elec 84.547 85.392 85.061 85.748 85.611 85.865 84.783 85.836 84.660 86.491ida2016 99.069 99.144 99.125 99.169 99.156 99.169 99.119 99.144 99.150 99.238japanese-vowels 91.216 94.077 93.485 94.860 93.956 93.274 93.786 93.736 93.555 95.282magic 86.251 87.150 87.029 87.733 87.066 86.803 87.018 86.960 86.813 87.255mnist 86.700 89.000 88.200 84.600 89.500 89.200 89.000 88.600 88.000 89.700mozilla 94.455 94.867 94.731 94.989 94.821 94.924 94.641 94.905 94.699 94.969nomao 96.037 96.179 96.045 96.408 96.066 96.158 95.990 96.118 96.132 96.289postures 87.773 88.697 88.202 81.100 88.855 88.752 87.593 89.086 87.660 89.771satimage 88.631 89.658 89.362 89.782 89.611 89.331 89.440 89.782 89.580 90.451

Table 9: Test accuracies for models with a memory consumption below 256 KB for eachmethod and each dataset averaged over a 5 fold cross validation using a dedicatedpruning set. Rounded to the third decimal digit. Larger is better. The best methodis depicted in bold.

5.2 Accuracies under various resource constraints with Dedicated Pruning Set

5.3 Area Under the Pareto Front with Dedicated Pruning Set

AUCmodel CA COMP DREP GB IC IE LMD RE RF RF-LRdataset

adult 0.8606 0.8621 0.8619 0.8705 0.8625 0.8626 0.8611 0.8623 0.8614 0.8643anura 0.9673 0.9759 0.9740 0.9749 0.9757 0.9750 0.9743 0.9748 0.9738 0.9760avila 0.9536 0.9933 0.9843 0.9907 0.9944 0.9938 0.9677 0.9930 0.9823 0.9903bank 0.9019 0.9047 0.9032 0.9065 0.9048 0.9042 0.9037 0.9042 0.9034 0.9067chess 0.5939 0.6401 0.6210 0.6265 0.6383 0.6313 0.6309 0.6383 0.6209 0.6618connect 0.7555 0.7677 0.7584 0.7777 0.7695 0.7690 0.7587 0.7686 0.7577 0.8049eeg 0.8964 0.9146 0.9106 0.8562 0.9156 0.9132 0.9111 0.9138 0.9101 0.9202elec 0.8577 0.8724 0.8670 0.8566 0.8728 0.8727 0.8662 0.8722 0.8674 0.8846ida2016 0.9892 0.9900 0.9903 0.9879 0.9900 0.9898 0.9898 0.9900 0.9902 0.9908japanese-vowels 0.9457 0.9633 0.9621 0.9724 0.9638 0.9612 0.9628 0.9630 0.9603 0.9667magic 0.8731 0.8769 0.8759 0.8764 0.8765 0.8759 0.8765 0.8765 0.8759 0.8779mnist 0.9174 0.9280 0.9287 0.9365 0.9313 0.9281 0.9280 0.9304 0.9280 0.9330mozilla 0.9465 0.9504 0.9492 0.9481 0.9510 0.9505 0.9484 0.9504 0.9490 0.9500nomao 0.9630 0.9652 0.9648 0.9629 0.9652 0.9652 0.9652 0.9653 0.9649 0.9662postures 0.9362 0.9462 0.9419 0.9104 0.9470 0.9452 0.9426 0.9457 0.9424 0.9597satimage 0.8980 0.9092 0.9069 0.9100 0.9078 0.9071 0.9071 0.9076 0.9061 0.9097

30

APPENDIX: Improving the Accuracy-Memory Trade-Off of Random Forests Via Leaf-Refinement

12345678910

RF-LRIC

COMPREIEGB

LMDDREPRFCA

Figure 49: Critical Difference Diagram for the normalized area under the Pareto front fordifferent methods over multiple datasets. More to the right (lower rank) is better.Methods in connected cliques are statistically similar.

6. Revisiting Ensemble Pruning with a Bagging Classifier

For space reasons, the paper focuses on Random Forest classifier. Here we will repeat ourexperiment with a Bagging Classifier implemented in Scikit-Learn ?. As before, we either usea 5-fold cross validation or the given test/train split. For reference, recall our experimentalprotocol: Oshiro et al. showed in ? that the prediction of a RF stabilizes between 128 and256 trees in the ensemble and adding more trees to the ensemble does not yield significantlybetter results. Hence, we train the ‘base’ Random Forests with M = 256 trees. To controlthe individual errors of trees we set the maximum number of leaf nodes nl to values betweennl ∈ {64, 128, 256, 512, 1024}. For ensemble pruning we use RE and compare it against arandom selection of trees from the original ensemble (which is the same a training a smallerforest directly). In both cases a sub-ensemble with K ∈ {2, 4, 8, 16, 32, 64, 128, 256} membersis selected so that for K = 256 the original RF is recovered.

31

Sebastian Buschjager, Katharina Morik

0 50 100 150 200 250Number of trees

83.0

83.5

84.0

84.5

85.0

85.5

86.0

86.5

Accu

racy

RE nl = 1024Bag. nl = 1024RE nl = 512Bag. nl = 512RE nl = 256Bag. nl = 256RE nl = 128Bag. nl = 128RE nl = 64Bag. nl = 64

model COMP DREP IC IE LMD REmax leaf nodes n estimators

64 8.0 86.26 86.25 86.16 86.31 86.08 86.4416.0 86.30 86.24 86.20 86.39 86.25 86.4232.0 86.35 86.24 86.29 86.45 86.34 86.4564.0 86.41 86.33 86.39 86.42 86.35 86.47128.0 86.38 86.39 86.37 86.43 86.37 86.48

128 8.0 86.26 86.20 86.25 86.35 86.22 86.3416.0 86.34 86.37 86.47 86.50 86.45 86.4832.0 86.49 86.40 86.49 86.51 86.47 86.5864.0 86.52 86.44 86.56 86.51 86.51 86.57128.0 86.57 86.53 86.55 86.59 86.55 86.55

256 8.0 86.22 86.12 86.28 86.43 86.20 86.2616.0 86.38 86.37 86.35 86.35 86.34 86.4032.0 86.47 86.38 86.48 86.38 86.45 86.5264.0 86.59 86.55 86.55 86.46 86.45 86.54128.0 86.52 86.53 86.52 86.49 86.54 86.56

512 8.0 85.80 85.82 85.94 85.94 85.94 85.9216.0 86.16 85.99 86.07 86.16 86.08 86.1332.0 86.25 86.30 86.19 86.32 86.29 86.2764.0 86.32 86.37 86.35 86.43 86.31 86.43128.0 86.39 86.40 86.34 86.35 86.38 86.31

1024 8.0 85.37 85.44 85.36 85.49 85.46 85.2116.0 85.61 85.97 85.90 85.72 85.87 85.7732.0 86.03 86.04 85.96 85.89 85.96 85.8264.0 86.08 85.99 86.13 85.98 86.10 86.00128.0 86.12 86.14 86.05 86.10 86.20 86.10

Figure 50: (Left) The error over the number of trees in the ensemble on the adult dataset.Dashed lines depict the Random Forest and solid lines are the correspondingpruned ensemble via Reduced Error pruning. (Right) The 5-fold cross-validationaccuracy on the adult dataset. Rounded to the second decimal digit. Larger isbetter.

0 50 100 150 200 250Number of trees

93.5

94.0

94.5

95.0

95.5

96.0

96.5

97.0

Accu

racy

RE nl = 1024Bag. nl = 1024RE nl = 512Bag. nl = 512RE nl = 256Bag. nl = 256RE nl = 128Bag. nl = 128RE nl = 64Bag. nl = 64

model COMP DREP IC IE LMD REmax leaf nodes n estimators

64 8.0 96.08 95.41 95.89 95.43 95.94 95.8316.0 96.34 95.55 96.18 95.64 95.86 96.1532.0 96.28 95.66 96.12 95.86 95.98 96.3264.0 96.16 95.93 96.25 96.04 95.90 96.19128.0 96.05 95.83 96.14 95.91 95.97 96.07

128 8.0 96.59 96.40 96.50 96.29 96.33 96.6116.0 96.85 96.59 96.93 96.58 96.66 96.8032.0 97.01 96.59 97.00 96.85 96.69 96.8364.0 97.01 96.68 97.08 96.97 96.79 96.79128.0 96.89 96.68 96.94 96.87 96.91 96.80

256 8.0 96.57 96.39 96.69 96.41 96.69 96.4416.0 96.93 96.86 97.04 96.83 96.89 96.7832.0 97.08 97.10 97.25 97.03 97.04 97.1064.0 97.08 97.07 97.30 97.18 97.10 97.11128.0 97.05 97.10 97.12 97.14 97.14 97.12

512 8.0 96.68 96.58 96.79 96.73 96.58 96.6916.0 97.04 96.72 97.25 97.04 97.07 96.9332.0 97.16 97.10 97.61 97.19 97.29 97.1064.0 97.18 97.16 97.48 97.18 97.22 97.21128.0 97.16 97.18 97.30 97.11 97.28 97.16

1024 8.0 96.44 96.34 96.76 96.59 96.44 96.6616.0 96.78 96.72 97.12 96.86 96.96 96.8632.0 97.08 97.07 97.40 97.01 97.11 97.0764.0 97.15 97.12 97.26 97.05 97.23 97.10128.0 97.07 97.08 97.15 97.11 97.14 97.07

Figure 51: (Left) The error over the number of trees in the ensemble on the anura dataset.Dashed lines depict the Random Forest and solid lines are the correspondingpruned ensemble via Reduced Error pruning. (Right) The 5-fold cross-validationaccuracy on the anura dataset. Rounded to the second decimal digit. Larger isbetter.

32

APPENDIX: Improving the Accuracy-Memory Trade-Off of Random Forests Via Leaf-Refinement

0 50 100 150 200 250Number of trees

80

85

90

95

100

Accu

racy

RE nl = 1024Bag. nl = 1024RE nl = 512Bag. nl = 512RE nl = 256Bag. nl = 256RE nl = 128Bag. nl = 128RE nl = 64Bag. nl = 64

model COMP DREP IC IE LMD REmax leaf nodes n estimators

64 8.0 81.07 79.17 79.22 78.95 80.45 81.3016.0 80.74 79.69 80.14 79.23 80.44 82.0232.0 80.86 79.49 80.03 79.52 80.46 82.0564.0 80.52 79.45 80.25 79.26 79.75 81.85128.0 80.20 NaN 80.16 79.16 79.60 81.21

128 8.0 90.28 88.67 89.87 89.24 89.15 91.1616.0 90.51 88.82 90.27 89.39 89.68 91.7032.0 90.54 89.20 90.54 89.68 89.60 92.0264.0 90.21 NaN 90.21 89.52 89.50 91.60128.0 90.02 NaN 89.89 89.22 89.33 90.89

256 8.0 97.72 96.27 97.50 97.36 94.64 97.8916.0 97.65 96.35 97.61 97.34 95.05 97.9232.0 97.58 96.48 97.58 97.30 94.94 97.7864.0 97.42 96.57 97.43 97.26 95.17 97.63128.0 97.08 NaN 97.06 96.91 95.21 97.29

512 8.0 99.34 99.09 99.36 99.34 97.49 99.3416.0 99.37 99.23 99.47 99.44 97.66 99.3832.0 99.40 99.29 99.47 99.47 97.82 99.4364.0 99.42 99.34 99.47 99.45 98.03 99.40128.0 99.43 NaN 99.45 99.43 98.53 99.41

1024 8.0 99.16 99.22 99.39 99.35 98.48 99.3616.0 99.32 99.30 99.45 99.40 98.71 99.4132.0 99.39 99.37 99.46 99.49 98.77 99.3964.0 99.40 99.38 99.46 99.42 98.91 99.41128.0 99.43 NaN 99.43 99.44 99.17 99.44

Figure 52: (Left) The error over the number of trees in the ensemble on the avila dataset.Dashed lines depict the Random Forest and solid lines are the correspondingpruned ensemble via Reduced Error pruning. (Right) The 5-fold cross-validationaccuracy on the avila dataset. Rounded to the second decimal digit. Larger isbetter.

0 50 100 150 200 250Number of trees

88.5

89.0

89.5

90.0

90.5

Accu

racy

RE nl = 1024Bag. nl = 1024RE nl = 512Bag. nl = 512RE nl = 256Bag. nl = 256RE nl = 128Bag. nl = 128RE nl = 64Bag. nl = 64

model COMP DREP IC IE LMD REmax leaf nodes n estimators

64 8.0 90.55 90.49 90.38 90.49 90.37 90.5116.0 90.55 90.58 90.56 90.52 90.47 90.5332.0 90.61 90.54 90.62 90.57 90.54 90.6464.0 90.64 90.53 90.63 90.61 90.58 90.60128.0 90.56 90.59 90.59 90.58 90.60 90.64

128 8.0 90.57 90.60 90.63 90.59 90.54 90.6016.0 90.64 90.66 90.64 90.65 90.60 90.6832.0 90.67 90.62 90.65 90.65 90.71 90.6964.0 90.72 90.66 90.73 90.65 90.62 90.63128.0 90.69 90.65 90.68 90.71 90.65 90.64

256 8.0 90.44 90.58 90.50 90.56 90.50 90.6716.0 90.67 90.59 90.68 90.65 90.61 90.7932.0 90.73 90.74 90.73 90.65 90.66 90.7364.0 90.76 90.75 90.70 90.73 90.63 90.73128.0 90.70 90.72 90.76 90.76 90.70 90.72

512 8.0 90.40 90.32 90.62 90.33 90.40 90.4816.0 90.52 90.51 90.64 90.58 90.54 90.5532.0 90.62 90.57 90.68 90.65 90.61 90.6064.0 90.64 90.64 90.65 90.69 90.67 90.63128.0 90.67 90.72 90.69 90.69 90.66 90.68

1024 8.0 90.07 90.16 90.29 89.99 90.28 90.0416.0 90.38 90.54 90.50 90.39 90.48 90.3732.0 90.61 90.69 90.57 90.60 90.56 90.4264.0 90.62 90.67 90.67 90.70 90.57 90.62128.0 90.65 90.64 90.73 90.69 90.66 90.64

Figure 53: (Left) The error over the number of trees in the ensemble on the bank dataset.Dashed lines depict the Random Forest and solid lines are the correspondingpruned ensemble via Reduced Error pruning. (Right) The 5-fold cross-validationaccuracy on the bank dataset. Rounded to the second decimal digit. Larger isbetter.

33

Sebastian Buschjager, Katharina Morik

0 50 100 150 200 250Number of trees

45

50

55

60

65

70

Accu

racy

RE nl = 1024Bag. nl = 1024RE nl = 512Bag. nl = 512RE nl = 256Bag. nl = 256RE nl = 128Bag. nl = 128RE nl = 64Bag. nl = 64

model COMP DREP IC IE LMD REmax leaf nodes n estimators

64 8.0 44.60 43.93 44.35 43.99 44.36 45.6316.0 44.79 43.81 44.65 43.92 44.53 45.9432.0 44.88 44.05 44.61 44.04 44.60 45.8064.0 44.84 NaN 44.54 44.10 44.50 45.74128.0 NaN NaN 44.36 43.99 44.08 NaN

128 8.0 50.34 49.80 50.15 50.19 49.62 51.6016.0 50.71 49.59 50.53 50.55 50.02 51.5432.0 50.75 49.80 50.73 50.19 50.17 51.6364.0 50.63 NaN 50.58 50.16 50.28 51.53128.0 NaN NaN 50.45 50.06 50.19 NaN

256 8.0 57.17 56.71 56.95 56.48 56.86 57.8916.0 57.24 56.75 57.22 56.69 57.08 58.2032.0 57.63 57.06 57.32 57.05 57.11 58.2764.0 57.65 NaN 57.43 56.99 57.40 58.57128.0 NaN NaN 57.47 57.14 57.34 58.20

512 8.0 63.90 63.75 63.82 63.61 63.86 64.7316.0 64.58 64.03 64.36 64.51 64.41 65.4332.0 64.81 64.20 64.79 64.31 64.65 65.4264.0 64.64 NaN 64.70 64.26 64.66 65.25128.0 NaN NaN 64.75 64.39 64.54 NaN

1024 8.0 71.34 70.34 70.80 70.75 70.51 71.4416.0 71.74 71.30 71.37 71.30 71.24 72.1532.0 71.87 71.37 71.96 71.66 71.70 72.3264.0 71.95 NaN 72.24 71.65 71.79 72.35128.0 NaN NaN 72.03 71.74 71.86 72.28

Figure 54: (Left) The error over the number of trees in the ensemble on the chess dataset.Dashed lines depict the Random Forest and solid lines are the correspondingpruned ensemble via Reduced Error pruning. (Right) The 5-fold cross-validationaccuracy on the chess dataset. Rounded to the second decimal digit. Larger isbetter.

0 50 100 150 200 250Number of trees

70

71

72

73

74

75

76

77

78

Accu

racy

RE nl = 1024Bag. nl = 1024RE nl = 512Bag. nl = 512RE nl = 256Bag. nl = 256RE nl = 128Bag. nl = 128RE nl = 64Bag. nl = 64

model COMP DREP IC IE LMD REmax leaf nodes n estimators

64 8.0 71.25 70.62 71.26 71.10 71.14 71.6816.0 71.18 70.58 71.05 71.02 70.94 71.7832.0 71.08 70.55 71.02 70.90 70.74 71.5864.0 70.92 NaN 70.87 70.73 70.69 71.31128.0 70.64 NaN 70.63 70.57 70.52 70.95

128 8.0 73.20 72.62 72.98 72.98 72.93 73.6816.0 73.21 72.59 73.23 72.99 72.98 73.5832.0 73.20 72.62 73.11 72.93 72.96 73.4564.0 73.09 NaN 73.03 72.77 72.78 73.25128.0 72.87 NaN 72.84 72.66 72.71 73.02

256 8.0 75.11 74.46 75.11 74.75 74.96 75.2916.0 75.25 74.48 75.21 74.85 74.97 75.2532.0 75.18 74.52 75.16 74.79 74.89 75.2864.0 75.07 NaN 75.06 74.75 74.80 75.13128.0 74.86 NaN 74.87 74.67 74.82 75.07

512 8.0 76.65 76.16 76.78 76.62 76.40 76.7116.0 76.76 76.32 76.87 76.62 76.53 76.8632.0 76.73 76.37 76.77 76.57 76.61 76.8864.0 76.77 NaN 76.77 76.56 76.57 76.76128.0 76.64 NaN 76.60 76.53 76.55 76.65

1024 8.0 77.86 77.27 77.98 77.84 77.63 77.9316.0 78.02 77.53 78.15 77.97 77.81 78.1132.0 78.15 77.70 78.12 78.03 77.87 78.1764.0 78.08 NaN 78.10 77.98 77.92 78.12128.0 78.04 NaN 78.06 77.92 77.92 78.04

Figure 55: (Left) The error over the number of trees in the ensemble on the connect dataset.Dashed lines depict the Random Forest and solid lines are the correspondingpruned ensemble via Reduced Error pruning. (Right) The 5-fold cross-validationaccuracy on the connect dataset. Rounded to the second decimal digit. Larger isbetter.

34

APPENDIX: Improving the Accuracy-Memory Trade-Off of Random Forests Via Leaf-Refinement

0 50 100 150 200 250Number of trees

80

82

84

86

88

90

92

Accu

racy

RE nl = 1024Bag. nl = 1024RE nl = 512Bag. nl = 512RE nl = 256Bag. nl = 256RE nl = 128Bag. nl = 128RE nl = 64Bag. nl = 64

model COMP DREP IC IE LMD REmax leaf nodes n estimators

64 8.0 83.43 82.75 83.14 83.02 82.94 83.4716.0 83.99 83.24 83.71 83.26 83.34 83.9632.0 84.10 83.34 83.92 83.71 83.68 84.2664.0 84.04 83.45 84.05 83.57 83.68 84.11128.0 83.85 83.44 83.79 83.72 83.55 83.93

128 8.0 85.97 85.65 85.94 86.05 85.66 86.3016.0 87.15 86.07 86.86 86.70 86.49 87.1432.0 87.49 86.42 87.25 87.06 86.96 87.5864.0 87.41 86.70 87.38 87.19 87.01 87.26128.0 87.37 86.78 87.42 87.08 86.93 87.16

256 8.0 88.30 87.38 88.12 88.11 87.66 88.5516.0 89.45 88.50 89.10 89.07 88.81 89.0532.0 89.71 88.92 89.81 89.42 89.21 89.5164.0 89.80 89.13 89.67 89.67 89.31 89.64128.0 89.75 89.27 89.81 89.57 89.47 89.67

512 8.0 89.26 89.10 89.35 89.61 88.82 89.7516.0 90.51 90.18 90.71 90.93 90.07 90.5832.0 91.07 90.86 91.49 91.36 90.62 91.0164.0 91.37 91.02 91.77 91.44 90.95 91.25128.0 91.36 91.16 91.55 91.48 91.16 91.35

1024 8.0 89.98 89.36 89.84 89.95 89.03 89.7716.0 91.30 91.03 91.82 91.48 90.77 90.9632.0 92.06 91.97 92.60 92.32 91.55 91.9864.0 92.32 92.32 92.76 92.66 92.07 92.38128.0 92.68 92.66 92.90 92.75 92.54 92.67

Figure 56: (Left) The error over the number of trees in the ensemble on the eeg dataset.Dashed lines depict the Random Forest and solid lines are the correspondingpruned ensemble via Reduced Error pruning. (Right) The 5-fold cross-validationaccuracy on the eeg dataset. Rounded to the second decimal digit. Larger isbetter.

0 50 100 150 200 250Number of trees

83

84

85

86

87

88

89

90

91

Accu

racy

RE nl = 1024Bag. nl = 1024RE nl = 512Bag. nl = 512RE nl = 256Bag. nl = 256RE nl = 128Bag. nl = 128RE nl = 64Bag. nl = 64

model COMP DREP IC IE LMD REmax leaf nodes n estimators

64 8.0 83.77 83.82 83.89 83.97 83.83 84.4316.0 84.11 83.87 84.04 84.02 84.27 84.5332.0 84.26 84.01 84.11 84.04 84.13 84.5964.0 84.16 84.04 84.17 84.05 84.02 84.45128.0 84.07 84.02 84.08 84.07 84.05 84.28

128 8.0 86.20 85.76 86.00 86.18 85.79 86.5016.0 86.29 85.81 86.20 86.01 86.03 86.6432.0 86.36 85.92 86.30 86.04 86.06 86.6064.0 86.29 86.07 86.25 86.15 86.09 86.52128.0 86.28 86.13 86.17 86.12 86.16 86.38

256 8.0 87.88 87.64 88.03 88.02 87.59 88.1816.0 88.24 87.93 88.29 88.16 87.90 88.3832.0 88.42 88.00 88.39 88.25 88.14 88.4464.0 88.35 88.12 88.36 88.21 88.19 88.44128.0 88.34 88.18 88.33 88.27 88.23 88.38

512 8.0 89.41 89.10 89.36 89.41 89.03 89.5616.0 89.76 89.48 89.76 89.67 89.34 89.7832.0 89.82 89.65 89.80 89.86 89.57 89.8764.0 89.87 89.69 89.85 89.93 89.66 89.93128.0 89.90 89.74 89.89 89.92 89.75 89.88

1024 8.0 90.60 90.29 90.52 90.59 90.02 90.5116.0 90.87 90.70 90.87 90.86 90.45 90.8432.0 91.05 90.88 91.18 91.09 90.55 90.9464.0 91.09 90.96 91.11 91.11 90.79 91.06128.0 91.09 91.02 91.17 91.09 90.91 91.02

Figure 57: (Left) The error over the number of trees in the ensemble on the elec dataset.Dashed lines depict the Random Forest and solid lines are the correspondingpruned ensemble via Reduced Error pruning. (Right) The 5-fold cross-validationaccuracy on the elec dataset. Rounded to the second decimal digit. Larger isbetter.

35

Sebastian Buschjager, Katharina Morik

0 50 100 150 200 250Number of trees

98.6

98.7

98.8

98.9

99.0

99.1

99.2

99.3

Accu

racy

RE nl = 1024Bag. nl = 1024RE nl = 512Bag. nl = 512RE nl = 256Bag. nl = 256RE nl = 128Bag. nl = 128RE nl = 64Bag. nl = 64

model COMP DREP IC IE LMD REmax leaf nodes n estimators

64 8.0 99.11 99.14 99.04 99.10 99.06 99.1216.0 99.08 99.14 99.12 99.11 99.11 99.1232.0 99.12 99.14 99.10 99.11 99.12 99.1364.0 99.14 99.18 99.09 99.06 99.13 99.13128.0 99.13 99.11 99.12 99.12 99.16 99.11

128 8.0 99.12 99.21 99.09 99.18 99.16 99.1816.0 99.18 99.18 99.15 99.24 99.12 99.2432.0 99.19 99.19 99.19 99.23 99.16 99.2164.0 99.19 99.18 99.19 99.20 99.19 99.21128.0 99.20 99.20 99.22 99.19 99.19 99.20

256 8.0 99.13 99.07 99.11 99.14 99.05 99.0816.0 99.18 99.16 99.21 99.22 99.15 99.1632.0 99.19 99.22 99.22 99.19 99.18 99.1864.0 99.21 99.21 99.20 99.19 99.23 99.21128.0 99.22 99.21 99.22 99.21 99.20 99.21

512 8.0 99.19 99.17 99.13 99.17 99.08 99.1916.0 99.20 99.21 99.23 99.20 99.15 99.2232.0 99.25 99.24 99.26 99.21 99.21 99.2764.0 99.22 99.23 99.26 99.22 99.17 99.21128.0 99.23 99.23 99.24 99.25 99.23 99.24

1024 8.0 99.12 99.15 99.16 99.23 99.06 99.1416.0 99.23 99.19 99.16 99.22 99.18 99.1932.0 99.22 99.21 99.26 99.24 99.21 99.2264.0 99.22 99.22 99.27 99.26 99.23 99.22128.0 99.22 99.22 99.26 99.23 99.21 99.22

Figure 58: (Left) The error over the number of trees in the ensemble on the ida2016 dataset.Dashed lines depict the Random Forest and solid lines are the correspondingpruned ensemble via Reduced Error pruning. (Right) The 5-fold cross-validationaccuracy on the ida2016 dataset. Rounded to the second decimal digit. Larger isbetter.

0 50 100 150 200 250Number of trees

82

84

86

88

90

92

94

Accu

racy

RE nl = 1024Bag. nl = 1024RE nl = 512Bag. nl = 512RE nl = 256Bag. nl = 256RE nl = 128Bag. nl = 128RE nl = 64Bag. nl = 64

model COMP DREP IC IE LMD REmax leaf nodes n estimators

64 8.0 85.54 83.56 85.02 84.11 85.33 85.4516.0 85.87 84.07 85.67 84.35 85.61 85.7132.0 85.82 84.43 86.01 84.43 85.55 85.5064.0 85.67 84.43 85.49 84.57 85.13 85.24128.0 85.27 84.60 85.24 84.65 85.07 85.11

128 8.0 89.29 88.12 89.08 88.07 88.78 89.2316.0 89.79 88.72 90.04 88.68 89.41 89.7932.0 89.82 89.03 89.91 89.31 89.54 89.7864.0 89.80 88.99 89.97 89.20 89.60 89.79128.0 89.70 89.23 89.70 89.22 89.64 89.61

256 8.0 91.83 90.88 91.73 91.30 91.88 91.4116.0 92.63 92.11 92.66 92.25 92.46 92.4332.0 92.90 92.45 93.10 92.68 92.74 92.7964.0 93.07 92.61 93.15 92.82 92.73 92.97128.0 92.97 92.77 93.15 92.73 92.85 92.87

512 8.0 93.44 92.90 93.26 93.01 93.05 92.8016.0 94.28 94.02 94.64 94.24 94.30 94.0332.0 94.56 94.56 95.15 94.53 94.72 94.5664.0 94.77 94.72 95.01 94.71 94.85 94.72128.0 94.86 94.89 95.23 94.79 94.95 94.80

1024 8.0 93.10 93.29 93.42 92.81 92.50 93.0816.0 94.16 94.19 94.42 93.95 93.62 94.2432.0 94.66 94.57 94.96 94.50 94.30 94.5564.0 94.77 94.65 95.09 94.81 94.56 94.70128.0 94.93 94.86 95.16 94.96 94.81 94.92

Figure 59: (Left) The error over the number of trees in the ensemble on the japanese-vowels dataset. Dashed lines depict the Random Forest and solid lines are thecorresponding pruned ensemble via Reduced Error pruning. (Right) The 5-foldcross-validation accuracy on the japanese-vowels dataset. Rounded to the seconddecimal digit. Larger is better.

36

APPENDIX: Improving the Accuracy-Memory Trade-Off of Random Forests Via Leaf-Refinement

0 50 100 150 200 250Number of trees

82

83

84

85

86

87

88

Accu

racy

RE nl = 1024Bag. nl = 1024RE nl = 512Bag. nl = 512RE nl = 256Bag. nl = 256RE nl = 128Bag. nl = 128RE nl = 64Bag. nl = 64

model COMP DREP IC IE LMD REmax leaf nodes n estimators

64 8.0 86.35 86.15 86.25 86.24 86.11 86.3716.0 86.49 86.20 86.35 86.26 86.30 86.5932.0 86.49 86.35 86.43 86.34 86.40 86.4764.0 86.52 86.41 86.46 86.43 86.47 86.44128.0 86.50 86.45 86.46 86.43 86.46 86.53

128 8.0 86.63 86.61 86.71 86.63 86.48 86.8816.0 86.81 86.63 86.80 86.88 86.77 86.9432.0 86.97 86.89 86.93 86.83 86.85 86.9464.0 86.97 86.92 87.01 86.92 86.79 86.91128.0 87.01 86.92 87.04 87.04 86.90 86.91

256 8.0 86.72 86.63 86.74 86.84 86.82 86.9116.0 87.11 86.89 87.13 87.13 87.15 87.0732.0 87.28 87.18 87.33 87.13 87.23 87.3564.0 87.40 87.24 87.32 87.21 87.29 87.39128.0 87.32 87.20 87.40 87.29 87.32 87.34

512 8.0 86.64 86.71 86.77 86.91 86.61 86.7916.0 87.20 87.20 87.21 87.17 87.03 87.1732.0 87.35 87.37 87.41 87.35 87.35 87.4364.0 87.56 87.53 87.55 87.51 87.58 87.42128.0 87.61 87.66 87.70 87.59 87.57 87.58

1024 8.0 86.32 86.45 86.39 86.36 86.16 86.2616.0 87.11 86.97 87.21 87.05 87.01 87.1532.0 87.49 87.49 87.68 87.49 87.63 87.6164.0 87.75 87.75 87.76 87.69 87.78 87.72128.0 87.88 87.85 87.89 87.88 87.78 87.79

Figure 60: (Left) The error over the number of trees in the ensemble on the magic dataset.Dashed lines depict the Random Forest and solid lines are the correspondingpruned ensemble via Reduced Error pruning. (Right) The 5-fold cross-validationaccuracy on the magic dataset. Rounded to the second decimal digit. Larger isbetter

0 50 100 150 200 250Number of trees

72.5

75.0

77.5

80.0

82.5

85.0

87.5

90.0

92.5

Accu

racy

RE nl = 1024Bag. nl = 1024RE nl = 512Bag. nl = 512RE nl = 256Bag. nl = 256RE nl = 128Bag. nl = 128RE nl = 64Bag. nl = 64

model COMP DREP IC IE LMD REmax leaf nodes n estimators

64 8.0 84.7 84.3 85.6 82.6 84.4 85.416.0 86.2 85.1 85.4 82.9 85.3 86.032.0 86.2 86.1 85.6 82.4 86.6 87.064.0 86.6 86.4 85.9 83.4 87.2 87.1128.0 86.8 86.4 86.2 85.4 86.4 86.4

128 8.0 88.2 86.6 87.0 86.4 88.4 86.816.0 89.3 88.1 88.6 87.4 89.6 88.032.0 89.3 88.3 89.4 86.7 89.4 89.564.0 89.5 89.1 89.5 88.8 90.0 89.9128.0 89.3 89.0 89.5 89.0 89.5 88.7

256 8.0 88.0 88.3 88.1 87.9 86.2 89.216.0 89.8 90.2 89.9 90.3 89.3 89.832.0 89.6 90.4 91.0 90.0 91.0 90.064.0 90.9 90.0 90.8 90.3 90.7 90.6128.0 91.5 90.8 90.8 90.9 91.5 90.8

512 8.0 87.5 88.8 88.5 87.1 86.9 88.216.0 90.3 90.6 90.1 89.0 90.0 90.432.0 91.1 91.5 91.1 90.0 91.2 91.264.0 91.4 91.6 91.6 90.8 91.0 91.6128.0 91.5 91.8 91.8 91.7 91.6 91.8

1024 8.0 89.1 87.6 87.7 89.2 88.1 88.216.0 90.7 89.5 90.4 91.2 90.0 90.232.0 91.5 90.9 92.2 92.0 91.9 91.064.0 91.9 91.7 91.8 91.6 92.4 91.8128.0 92.3 92.4 92.0 91.2 92.3 92.5

Figure 61: (Left) The error over the number of trees in the ensemble on the mnist dataset.Dashed lines depict the Random Forest and solid lines are the correspondingpruned ensemble via Reduced Error pruning. (Right) The 5-fold cross-validationaccuracy on the mnist dataset. Rounded to the second decimal digit. Larger isbetter.

37

Sebastian Buschjager, Katharina Morik

0 50 100 150 200 250Number of trees

91

92

93

94

95

Accu

racy

RE nl = 1024Bag. nl = 1024RE nl = 512Bag. nl = 512RE nl = 256Bag. nl = 256RE nl = 128Bag. nl = 128RE nl = 64Bag. nl = 64

model COMP DREP IC IE LMD REmax leaf nodes n estimators

64 8.0 94.64 94.62 94.70 94.70 94.62 94.8216.0 94.68 94.63 94.71 94.77 94.61 94.8132.0 94.71 94.60 94.72 94.74 94.62 94.7164.0 94.69 94.58 94.69 94.69 94.59 94.71128.0 94.63 94.58 94.63 94.65 94.59 94.72

128 8.0 94.78 94.76 94.80 94.91 94.76 94.9216.0 94.89 94.77 94.88 94.93 94.79 94.9332.0 94.81 94.74 94.91 94.94 94.75 94.9164.0 94.87 94.80 94.87 94.94 94.78 94.87128.0 94.85 94.81 94.85 94.86 94.79 94.86

256 8.0 94.94 94.94 95.05 94.86 94.85 94.9416.0 95.04 94.98 95.07 95.09 94.99 95.0832.0 95.07 95.03 95.03 95.15 95.05 95.1364.0 95.10 95.10 95.15 95.19 95.05 95.12128.0 95.10 95.09 95.16 95.19 95.09 95.14

512 8.0 94.79 94.87 94.89 94.99 94.92 94.7816.0 95.21 95.14 95.21 95.12 95.18 95.2332.0 95.29 95.42 95.34 95.37 95.32 95.3364.0 95.37 95.39 95.43 95.39 95.39 95.39128.0 95.41 95.40 95.44 95.45 95.39 95.42

1024 8.0 94.75 94.69 94.87 94.80 94.56 94.8516.0 95.08 95.08 95.25 95.24 95.17 95.1832.0 95.25 95.16 95.36 95.27 95.27 95.2764.0 95.35 95.31 95.37 95.36 95.25 95.38128.0 95.37 95.36 95.33 95.34 95.34 95.39

Figure 62: (Left) The error over the number of trees in the ensemble on the mozilla dataset.Dashed lines depict the Random Forest and solid lines are the correspondingpruned ensemble via Reduced Error pruning. (Right) The 5-fold cross-validationaccuracy on the mozilla dataset. Rounded to the second decimal digit. Larger isbetter.

0 50 100 150 200 250Number of trees

94.5

95.0

95.5

96.0

96.5

Accu

racy

RE nl = 1024Bag. nl = 1024RE nl = 512Bag. nl = 512RE nl = 256Bag. nl = 256RE nl = 128Bag. nl = 128RE nl = 64Bag. nl = 64

model COMP DREP IC IE LMD REmax leaf nodes n estimators

64 8.0 95.63 95.34 95.67 95.61 95.52 95.6816.0 95.74 95.39 95.69 95.57 95.59 95.7132.0 95.63 95.47 95.67 95.60 95.59 95.6364.0 95.66 95.49 95.64 95.54 95.57 95.60128.0 95.55 95.52 95.58 95.51 95.53 95.54

128 8.0 95.97 95.86 95.97 95.93 95.88 95.9816.0 96.09 95.97 96.11 96.03 95.90 96.0932.0 96.10 95.95 96.14 95.97 95.98 96.0464.0 96.06 95.96 96.07 95.99 96.01 96.06128.0 96.06 95.96 96.06 95.96 96.04 96.02

256 8.0 96.22 96.16 96.20 96.25 96.17 96.4216.0 96.30 96.27 96.33 96.33 96.32 96.4232.0 96.34 96.36 96.38 96.45 96.36 96.4664.0 96.41 96.47 96.45 96.43 96.44 96.47128.0 96.42 96.43 96.45 96.45 96.43 96.47

512 8.0 96.25 96.22 96.43 96.31 96.23 96.2816.0 96.57 96.41 96.52 96.61 96.48 96.5732.0 96.69 96.60 96.69 96.65 96.57 96.6264.0 96.74 96.68 96.72 96.70 96.70 96.71128.0 96.73 96.70 96.73 96.70 96.72 96.71

1024 8.0 96.27 96.37 96.34 96.29 96.26 96.2716.0 96.54 96.47 96.62 96.60 96.54 96.5432.0 96.64 96.65 96.72 96.77 96.74 96.6764.0 96.72 96.72 96.77 96.74 96.75 96.74128.0 96.71 96.72 96.81 96.77 96.72 96.72

Figure 63: (Left) The error over the number of trees in the ensemble on the nomao dataset.Dashed lines depict the Random Forest and solid lines are the correspondingpruned ensemble via Reduced Error pruning. (Right) The 5-fold cross-validationaccuracy on the nomao dataset. Rounded to the second decimal digit. Larger isbetter.

38

APPENDIX: Improving the Accuracy-Memory Trade-Off of Random Forests Via Leaf-Refinement

0 50 100 150 200 250Number of trees

70

75

80

85

90

95

Accu

racy

RE nl = 1024Bag. nl = 1024RE nl = 512Bag. nl = 512RE nl = 256Bag. nl = 256RE nl = 128Bag. nl = 128RE nl = 64Bag. nl = 64

model COMP DREP IC IE LMD REmax leaf nodes n estimators

64 8.0 74.93 72.26 72.28 72.88 73.10 75.3716.0 74.75 72.63 73.01 73.20 73.14 75.7332.0 74.85 NaN 74.29 73.64 73.15 75.4764.0 74.25 NaN 74.12 73.14 73.05 74.75128.0 73.39 NaN 73.20 72.95 72.81 73.80

128 8.0 81.48 78.99 78.99 78.86 80.40 81.8116.0 81.83 79.29 79.92 79.46 80.36 82.1332.0 81.72 NaN 81.53 79.66 80.35 82.0764.0 81.26 NaN 80.97 79.79 80.10 81.49128.0 80.59 NaN 80.27 79.81 80.04 80.65

256 8.0 87.21 84.98 84.88 85.46 86.49 87.5416.0 87.78 85.46 86.19 86.10 86.49 87.9732.0 87.86 NaN 87.53 86.15 86.60 88.0164.0 87.46 NaN 87.31 86.33 86.47 87.62128.0 86.85 NaN 86.77 86.45 86.35 86.95

512 8.0 91.57 89.71 89.98 89.82 90.76 91.7716.0 91.96 90.22 90.91 90.40 91.04 92.1732.0 92.08 NaN 92.02 90.71 91.11 92.1264.0 91.87 NaN 91.82 90.89 91.03 91.94128.0 91.47 NaN 91.34 91.03 90.93 91.50

1024 8.0 94.57 93.06 93.18 93.43 93.72 94.5316.0 94.96 93.53 94.53 93.93 94.24 95.0032.0 95.10 NaN 95.05 94.27 94.37 95.0564.0 95.02 NaN 94.86 94.47 94.39 94.92128.0 94.69 NaN 94.68 94.48 94.35 94.66

Figure 64: (Left) The error over the number of trees in the ensemble on the postures dataset.Dashed lines depict the Random Forest and solid lines are the correspondingpruned ensemble via Reduced Error pruning. (Right) The 5-fold cross-validationaccuracy on the postures dataset. Rounded to the second decimal digit. Largeris better.

0 50 100 150 200 250Number of trees

84

85

86

87

88

89

90

91

Accu

racy

RE nl = 1024Bag. nl = 1024RE nl = 512Bag. nl = 512RE nl = 256Bag. nl = 256RE nl = 128Bag. nl = 128RE nl = 64Bag. nl = 64

model COMP DREP IC IE LMD REmax leaf nodes n estimators

64 8.0 88.82 88.90 88.54 88.48 88.69 89.0816.0 89.07 89.21 89.00 89.16 89.07 88.9732.0 89.18 89.36 89.25 88.99 89.19 89.2264.0 89.25 89.16 89.38 89.25 89.22 89.08128.0 89.32 89.27 89.38 89.28 89.21 89.25

128 8.0 89.32 88.94 89.61 89.04 89.33 89.5616.0 89.75 89.70 89.97 89.74 89.97 89.9832.0 90.20 90.11 90.37 90.03 89.84 90.1464.0 90.16 90.08 90.20 90.11 90.14 90.22128.0 90.26 90.19 90.37 90.19 90.12 90.33

256 8.0 89.44 89.24 89.56 89.13 88.83 89.1916.0 90.12 89.92 90.28 90.02 89.89 90.0832.0 90.68 90.56 90.67 90.22 90.40 90.5864.0 90.70 90.58 90.65 90.53 90.59 90.68128.0 90.70 90.68 90.81 90.59 90.78 90.87

512 8.0 89.52 89.11 89.60 89.75 88.93 89.5316.0 90.05 89.95 90.08 89.95 90.00 90.2032.0 90.62 90.42 90.62 90.56 90.78 90.5664.0 90.79 90.78 90.81 90.87 90.89 90.87128.0 90.90 90.76 90.95 90.87 90.84 90.78

1024 8.0 89.22 89.35 89.63 89.19 89.41 89.6016.0 90.14 90.56 90.47 90.30 90.40 90.1132.0 90.62 90.73 91.01 90.44 90.70 90.7364.0 90.82 90.86 91.09 90.50 90.73 90.75128.0 91.06 91.09 90.86 90.79 90.96 91.04

Figure 65: (Left) The error over the number of trees in the ensemble on the satimage dataset.Dashed lines depict the Random Forest and solid lines are the correspondingpruned ensemble via Reduced Error pruning. (Right) The 5-fold cross-validationaccuracy on the satimage dataset. Rounded to the second decimal digit. Largeris better.

39

Sebastian Buschjager, Katharina Morik

model Bag-LR Bag. CA COMP DREP GB IC IE LMD RE

adult 86.045 86.204 86.118 86.260 86.254 86.244 86.155 86.315 86.082 86.441anura 96.081 95.386 95.817 96.081 95.622 91.564 96.081 96.067 95.942 95.830avila 95.193 94.843 93.200 97.125 96.545 59.496 97.000 96.947 93.468 97.446bank 90.507 90.493 90.558 90.549 90.487 90.527 90.487 90.491 90.398 90.511chess 55.314 54.470 54.088 55.307 54.705 30.175 54.324 55.047 54.081 56.049connect 73.073 72.968 73.200 74.174 73.890 67.584 74.134 73.738 74.278 74.414eeg 84.680 83.865 83.852 84.666 84.666 79.226 84.372 84.653 84.666 85.060elec 86.675 86.202 86.456 86.333 86.743 81.941 86.723 86.871 86.207 86.990ida2016 99.106 99.119 99.038 99.112 99.138 99.038 99.038 99.112 99.075 99.125japanese-vowels 88.274 86.538 86.166 87.873 87.080 81.930 87.501 87.290 87.622 87.923magic 86.187 86.251 85.993 86.345 86.245 86.629 86.251 86.272 86.156 86.461mnist 82.800 78.100 80.200 83.000 80.600 70.600 84.200 81.000 81.700 83.300mozilla 94.596 94.616 94.429 94.738 94.622 94.493 94.719 94.699 94.622 94.821nomao 95.656 95.645 95.645 95.848 95.616 95.273 95.799 95.726 95.671 95.761postures 75.707 76.366 75.421 78.615 77.029 64.126 75.705 76.337 78.192 78.566satimage 87.823 87.543 87.574 88.212 87.900 85.925 87.543 87.838 87.900 88.383

Table 10: Test accuracies for models with a memory consumption below 32 KB for eachmethod and each dataset averaged over a 5 fold cross validation. Rounded to thethird decimal digit. Larger is better. The best method is depicted in bold.

model Bag-LR Bag. CA COMP DREP GB IC IE LMD RE

adult 86.220 86.373 86.306 86.300 86.254 86.616 86.254 86.395 86.250 86.441anura 96.762 96.233 96.470 96.595 96.400 95.024 96.498 96.289 96.331 96.609avila 98.596 97.101 97.350 98.457 98.160 67.724 98.328 98.342 96.535 98.356bank 90.507 90.573 90.624 90.569 90.595 90.677 90.628 90.591 90.538 90.602chess 61.762 61.085 61.217 61.616 61.506 34.969 61.188 61.965 61.242 62.332connect 74.814 74.824 74.349 75.443 75.267 70.847 75.428 75.391 75.248 75.643eeg 86.789 85.621 85.300 86.943 85.654 82.463 86.709 86.068 85.661 86.642elec 87.805 87.427 87.264 87.730 87.813 83.878 87.725 88.014 87.189 88.041ida2016 99.200 99.238 99.112 99.119 99.212 99.094 99.119 99.175 99.156 99.181japanese-vowels 90.894 89.338 88.776 90.342 89.499 87.341 89.620 89.830 90.182 89.760magic 86.671 86.419 86.519 86.629 86.613 87.355 86.708 86.634 86.477 86.876mnist 86.600 82.900 83.300 85.600 84.300 74.400 85.600 85.100 84.400 86.200mozilla 94.937 94.751 94.622 94.776 94.764 94.590 94.802 94.905 94.764 94.918nomao 96.013 95.717 95.839 95.967 95.862 95.958 95.967 95.929 95.880 96.121postures 83.236 82.082 81.839 83.999 82.767 69.058 81.880 82.675 83.356 84.218satimage 88.818 88.274 88.600 88.818 88.896 87.449 88.538 88.476 88.694 89.082

Table 11: Test accuracies for models with a memory consumption below 64 KB for eachmethod and each dataset averaged over a 5 fold cross validation. Rounded to thethird decimal digit. Larger is better. The best method is depicted in bold.

40

APPENDIX: Improving the Accuracy-Memory Trade-Off of Random Forests Via Leaf-Refinement

model Bag-LR Bag. CA COMP DREP GB IC IE LMD RE

adult 86.373 86.496 86.306 86.355 86.370 87.135 86.468 86.496 86.450 86.478anura 96.928 96.678 96.470 96.845 96.720 96.553 96.928 96.734 96.692 96.803avila 99.161 98.505 98.428 99.219 98.994 75.262 99.157 99.147 97.407 99.157bank 90.666 90.659 90.624 90.637 90.664 90.737 90.644 90.648 90.602 90.679chess 69.087 67.526 66.881 68.124 67.412 40.719 67.469 67.658 66.895 68.524connect 76.461 75.658 75.579 76.387 75.926 73.850 76.259 76.114 76.048 76.524eeg 88.959 87.503 86.856 88.304 87.383 85.734 88.124 88.111 87.664 88.551elec 89.131 88.484 88.692 88.751 88.696 85.748 88.771 88.930 88.451 89.124ida2016 99.275 99.238 99.200 99.188 99.212 99.169 99.162 99.238 99.156 99.238japanese-vowels 92.541 91.035 90.904 91.828 90.985 91.748 91.728 91.296 91.878 91.407magic 87.060 86.761 86.519 86.813 86.634 87.733 86.797 86.882 86.818 86.939mnist 87.700 85.300 85.700 88.200 86.600 79.300 87.000 86.400 88.400 86.800mozilla 94.969 94.751 94.622 94.937 94.937 94.989 95.047 94.931 94.854 94.937nomao 96.292 96.170 95.979 96.219 96.156 96.408 96.202 96.251 96.173 96.417postures 87.476 86.634 86.515 88.494 87.460 75.760 86.991 87.798 87.481 88.558satimage 89.658 89.145 88.647 89.316 89.207 88.631 89.611 89.160 89.331 89.565

Table 12: Test accuracies for models with a memory consumption below 128 KB for eachmethod and each dataset averaged over a 5 fold cross validation. Rounded to thethird decimal digit. Larger is better. The best method is depicted in bold.

model Bag-LR Bag. CA COMP DREP GB IC IE LMD RE

adult 86.401 86.511 86.306 86.493 86.401 87.135 86.493 86.515 86.465 86.576anura 97.040 96.873 96.470 97.040 96.859 97.429 97.248 97.040 97.067 96.928avila 99.406 99.224 98.428 99.339 99.224 82.820 99.391 99.353 97.824 99.363bank 90.719 90.659 90.635 90.670 90.664 90.737 90.677 90.655 90.710 90.788chess 72.822 69.347 69.365 70.021 69.440 44.678 69.554 69.372 68.545 70.406connect 77.606 76.577 76.383 77.275 76.726 76.170 77.376 77.080 77.002 77.333eeg 90.641 88.939 88.211 89.453 89.099 85.734 89.346 89.613 88.818 89.753elec 90.462 89.431 89.349 89.857 89.460 85.748 89.753 89.718 89.140 89.751ida2016 99.275 99.238 99.200 99.231 99.212 99.169 99.231 99.238 99.181 99.238japanese-vowels 93.866 93.063 92.029 93.444 93.294 94.860 93.424 93.013 93.053 93.083magic 87.465 87.013 86.519 87.108 86.892 87.733 87.129 87.129 87.155 87.071mnist 90.200 87.600 88.300 89.300 88.300 84.600 88.600 87.900 89.600 89.200mozilla 95.085 95.117 94.867 95.040 94.976 94.989 95.072 95.085 94.989 95.079nomao 96.521 96.205 96.092 96.298 96.274 96.408 96.434 96.333 96.315 96.417postures 90.705 90.115 90.170 91.119 90.469 81.100 90.203 90.482 90.204 91.106satimage 90.093 89.580 89.362 89.751 89.705 89.782 89.969 89.751 89.969 89.984

Table 13: Test accuracies for models with a memory consumption below 256 KB for eachmethod and each dataset averaged over a 5 fold cross validation. Rounded to thethird decimal digit. Larger is better. The best method is depicted in bold.

41

Sebastian Buschjager, Katharina Morik

6.1 Accuracies under various resource constraints with a BaggingClassifier

6.2 Plotting the Pareto Front For More Datasets with Dedicated Pruning Set

101 102 103 104

Model Size [KB]

0.856

0.858

0.860

0.862

0.864

0.866

0.868

0.870

0.872

Accu

racy

Bag-LRBag.CACOMPDREPGBICIELMDRE

101 102 103

Model Size [KB]

0.60

0.65

0.70

0.75

0.80

0.85

0.90

0.95

1.00

Accu

racy

Bag-LRBag.CACOMPDREPGBICIELMDRE

Figure 66: (left) 5-fold cross-validation accuracy on the adult dataset. (right) 5-fold cross-validation accuracy on the anura dataset.

101 102 103 104

Model Size [KB]

0.5

0.6

0.7

0.8

0.9

1.0

Accu

racy

Bag-LRBag.CACOMPDREPGBICIELMDRE

101 102 103 104

Model Size [KB]

0.902

0.903

0.904

0.905

0.906

0.907

0.908

Accu

racy

Bag-LRBag.CACOMPDREPGBICIELMDRE

Figure 67: (left) 5-fold cross-validation accuracy on the avila dataset. (right) 5-fold cross-validation accuracy on the bank dataset.

101 102 103 104

Model Size [KB]

0.3

0.4

0.5

0.6

0.7

Accu

racy

Bag-LRBag.CACOMPDREPGBICIELMDRE

101 102 103 104

Model Size [KB]

0.66

0.68

0.70

0.72

0.74

0.76

0.78

0.80

Accu

racy

Bag-LRBag.CACOMPDREPGBICIELMDRE

Figure 68: (left) 5-fold cross-validation accuracy on the chess dataset. (right) 5-fold cross-validation accuracy on the connect dataset.

42

APPENDIX: Improving the Accuracy-Memory Trade-Off of Random Forests Via Leaf-Refinement

101 102 103 104

Model Size [KB]

0.78

0.80

0.82

0.84

0.86

0.88

0.90

0.92Ac

cura

cy

Bag-LRBag.CACOMPDREPGBICIELMDRE

101 102 103 104

Model Size [KB]

0.80

0.82

0.84

0.86

0.88

0.90

0.92

Accu

racy

Bag-LRBag.CACOMPDREPGBICIELMDRE

Figure 69: (left) 5-fold cross-validation accuracy on the eeg dataset. (right) 5-fold cross-validation accuracy on the elec dataset.

101 102 103

Model Size [KB]

0.989

0.990

0.991

0.992

Accu

racy

Bag-LRBag.CACOMPDREPGBICIELMDRE

101 102 103

Model Size [KB]

0.70

0.75

0.80

0.85

0.90

0.95

Accu

racy

Bag-LRBag.CACOMPDREPGBICIELMDRE

Figure 70: (left) 5-fold cross-validation accuracy on the ida2016 dataset. (right) 5-foldcross-validation accuracy on the japanese-vowels dataset.

101 102 103 104

Model Size [KB]

0.850

0.855

0.860

0.865

0.870

0.875

0.880

Accu

racy

Bag-LRBag.CACOMPDREPGBICIELMDRE

102 103 104

Model Size [KB]

0.70

0.75

0.80

0.85

0.90

0.95

Accu

racy

Bag-LRBag.CACOMPDREPGBICIELMDRE

Figure 71: (left) 5-fold cross-validation accuracy on the magic dataset. (right) 5-fold cross-validation accuracy on the mnist dataset.

43

Sebastian Buschjager, Katharina Morik

101 102 103

Model Size [KB]

0.9350

0.9375

0.9400

0.9425

0.9450

0.9475

0.9500

0.9525

0.9550Ac

cura

cy

Bag-LRBag.CACOMPDREPGBICIELMDRE

101 102 103 104

Model Size [KB]

0.945

0.950

0.955

0.960

0.965

Accu

racy

Bag-LRBag.CACOMPDREPGBICIELMDRE

Figure 72: (left) 5-fold cross-validation accuracy on the mozilla dataset. (right) 5-foldcross-validation accuracy on the nomao dataset.

101 102 103 104

Model Size [KB]

0.60

0.65

0.70

0.75

0.80

0.85

0.90

0.95

Accu

racy

Bag-LRBag.CACOMPDREPGBICIELMDRE

101 102 103

Model Size [KB]

0.84

0.85

0.86

0.87

0.88

0.89

0.90

0.91

Accu

racy

Bag-LRBag.CACOMPDREPGBICIELMDRE

Figure 73: (left) 5-fold cross-validation accuracy on the postures dataset. (right) 5-foldcross-validation accuracy on the satimage dataset.

6.3 Area Under the Pareto Front with a Bagging Classifier

AUCmodel Bag-LR Bag. CA COMP DREP GB IC IE LMD REdataset

adult 0.8648 0.8653 0.8652 0.8654 0.8653 0.8705 0.8653 0.8654 0.8653 0.8654anura 0.9686 0.9679 0.9638 0.9684 0.9681 0.9746 0.9724 0.9684 0.9693 0.9685avila 0.9930 0.9926 0.9885 0.9930 0.9926 0.9864 0.9934 0.9936 0.9892 0.9931bank 0.9079 0.9069 0.9067 0.9071 0.9070 0.9065 0.9071 0.9071 0.9068 0.9074chess 0.7627 0.7129 0.7057 0.7174 0.7127 0.6265 0.7194 0.7150 0.7157 0.7214connect 0.7947 0.7768 0.7736 0.7805 0.7768 0.7777 0.7806 0.7794 0.7782 0.7808eeg 0.9268 0.9215 0.9050 0.9227 0.9222 0.8562 0.9256 0.9241 0.9206 0.9225elec 0.9192 0.9082 0.9050 0.9097 0.9086 0.8566 0.9104 0.9099 0.9072 0.9092ida2016 0.9906 0.9906 0.9901 0.9904 0.9903 0.9878 0.9905 0.9904 0.9902 0.9906japanese-vowels 0.9484 0.9448 0.9301 0.9461 0.9456 0.9721 0.9493 0.9460 0.9463 0.9456magic 0.8780 0.8758 0.8741 0.8771 0.8769 0.8765 0.8773 0.8769 0.8768 0.8767mnist 0.9218 0.9135 0.9034 0.9180 0.9173 0.9358 0.9187 0.9178 0.9198 0.9185mozilla 0.9533 0.9538 0.9502 0.9527 0.9529 0.9483 0.9530 0.9531 0.9526 0.9528nomao 0.9669 0.9662 0.9643 0.9664 0.9661 0.9627 0.9669 0.9667 0.9664 0.9664postures 0.9577 0.9405 0.9343 0.9493 0.9375 0.9104 0.9480 0.9425 0.9421 0.9489satimage 0.9086 0.9063 0.9009 0.9072 0.9076 0.9102 0.9083 0.9063 0.9069 0.9072

44

APPENDIX: Improving the Accuracy-Memory Trade-Off of Random Forests Via Leaf-Refinement

12345678910

Bag-LRIC

REIE

COMPLMDDREPGBBag.CA

Figure 74: Critical Difference Diagram for the normalized area under the Pareto front fordifferent methods over multiple datasets. More to the right (lower rank) is better.Methods in connected cliques are statistically similar.

7. Revisiting Ensemble Pruning with ExtaTrees Classifier

For space reasons, the paper focuses on Random Forest classifier. Here we will repeat ourexperiment with ExtaTreesClassifier implemented in Scikit-Learn ?. As before, we either usea 5-fold cross validation or the given test/train split. For reference, recall our experimentalprotocol: Oshiro et al. showed in ? that the prediction of a RF stabilizes between 128 and256 trees in the ensemble and adding more trees to the ensemble does not yield significantlybetter results. Hence, we train the ‘base’ Random Forests with M = 256 trees. To controlthe individual errors of trees we set the maximum number of leaf nodes nl to values betweennl ∈ {64, 128, 256, 512, 1024}. For ensemble pruning we use RE and compare it against arandom selection of trees from the original ensemble (which is the same a training a smallerforest directly). In both cases a sub-ensemble with K ∈ {2, 4, 8, 16, 32, 64, 128, 256} membersis selected so that for K = 256 the original RF is recovered.

45

Sebastian Buschjager, Katharina Morik

0 50 100 150 200 250Number of trees

83.0

83.5

84.0

84.5

85.0

Accu

racy

RE nl = 1024ET nl = 1024RE nl = 512ET nl = 512RE nl = 256ET nl = 256RE nl = 128ET nl = 128RE nl = 64ET nl = 64

model COMP DREP IC IE LMD REmax leaf nodes n estimators

64 8.0 84.03 83.72 84.24 84.48 83.42 84.9716.0 84.10 83.54 84.24 84.34 83.82 84.8532.0 84.19 83.52 84.27 84.23 83.68 84.5664.0 84.07 83.45 84.09 84.05 83.68 84.30128.0 83.86 83.46 83.86 83.65 83.63 83.88

128 8.0 84.28 84.06 84.53 85.06 83.88 85.1716.0 84.30 83.97 84.65 84.79 84.09 85.1032.0 84.37 83.83 84.49 84.63 84.05 84.7764.0 84.27 83.82 84.33 84.38 84.02 84.48128.0 84.09 83.80 84.17 84.01 83.94 84.22

256 8.0 84.39 84.13 84.53 85.19 83.90 85.1716.0 84.57 84.21 84.72 84.97 84.19 85.0132.0 84.55 84.08 84.67 84.73 84.25 84.8364.0 84.52 84.10 84.54 84.55 84.26 84.60128.0 84.39 84.11 84.38 84.38 84.28 84.43

512 8.0 84.90 84.44 85.14 85.14 84.18 85.2116.0 84.90 84.43 85.16 85.22 84.38 85.0632.0 85.06 84.43 85.05 85.09 84.52 85.0064.0 84.77 84.45 84.89 84.99 84.67 84.75128.0 84.71 84.52 84.73 84.71 84.56 84.71

1024 8.0 84.71 84.46 84.72 85.17 84.21 85.1216.0 84.80 84.64 84.95 85.32 84.58 85.1232.0 85.06 84.80 85.04 85.32 84.68 85.2164.0 85.04 84.76 85.14 85.12 84.79 85.17128.0 84.92 84.84 85.00 85.08 84.90 85.00

Figure 75: (Left) The error over the number of trees in the ensemble on the adult dataset.Dashed lines depict the Random Forest and solid lines are the correspondingpruned ensemble via Reduced Error pruning. (Right) The 5-fold cross-validationaccuracy on the adult dataset. Rounded to the second decimal digit. Larger isbetter.

0 50 100 150 200 250Number of trees

91

92

93

94

95

96

97

98

Accu

racy

RE nl = 1024ET nl = 1024RE nl = 512ET nl = 512RE nl = 256ET nl = 256RE nl = 128ET nl = 128RE nl = 64ET nl = 64

model COMP DREP IC IE LMD REmax leaf nodes n estimators

64 8.0 95.26 94.30 94.95 94.82 93.50 95.0516.0 95.54 94.86 95.57 95.47 94.84 95.6432.0 95.96 95.08 95.82 95.65 95.21 96.0364.0 95.87 95.36 95.90 95.66 95.36 95.69128.0 95.75 95.51 95.71 95.61 95.52 95.76

128 8.0 96.33 95.84 96.26 96.00 95.82 96.1816.0 96.43 96.26 96.69 96.54 96.23 96.4632.0 96.78 96.41 96.97 96.69 96.43 96.6264.0 96.82 96.58 96.90 96.75 96.53 96.71128.0 96.75 96.57 96.82 96.72 96.58 96.72

256 8.0 96.94 96.69 97.28 97.18 96.33 96.9116.0 97.25 97.08 97.58 97.35 96.94 97.4332.0 97.53 97.33 97.53 97.46 97.21 97.4664.0 97.53 97.55 97.57 97.61 97.43 97.48128.0 97.61 97.44 97.55 97.51 97.33 97.50

512 8.0 96.96 96.98 97.18 97.16 96.87 97.1116.0 97.69 97.78 97.65 97.67 97.64 97.6932.0 97.85 97.85 98.01 97.89 97.83 97.9064.0 98.11 98.05 98.17 98.10 97.96 98.04128.0 98.08 98.12 98.18 98.18 98.10 98.12

1024 8.0 97.00 97.11 97.30 97.12 96.76 97.0416.0 97.57 97.62 97.97 97.75 97.35 97.6232.0 97.83 97.76 97.96 97.82 97.86 97.7864.0 98.05 98.03 98.14 98.00 97.94 97.92128.0 98.05 98.05 98.11 98.08 98.10 98.05

Figure 76: (Left) The error over the number of trees in the ensemble on the anura dataset.Dashed lines depict the Random Forest and solid lines are the correspondingpruned ensemble via Reduced Error pruning. (Right) The 5-fold cross-validationaccuracy on the anura dataset. Rounded to the second decimal digit. Larger isbetter.

46

APPENDIX: Improving the Accuracy-Memory Trade-Off of Random Forests Via Leaf-Refinement

0 50 100 150 200 250Number of trees

60

70

80

90

100

Accu

racy

RE nl = 1024ET nl = 1024RE nl = 512ET nl = 512RE nl = 256ET nl = 256RE nl = 128ET nl = 128RE nl = 64ET nl = 64

model COMP DREP IC IE LMD REmax leaf nodes n estimators

64 8.0 66.20 59.64 67.22 65.74 62.84 68.5916.0 66.12 58.31 66.52 65.25 62.23 68.1832.0 65.12 58.43 65.27 64.30 62.34 66.8764.0 63.43 58.07 63.59 62.80 61.98 64.77128.0 61.87 NaN 61.86 60.96 61.02 62.40

128 8.0 78.32 67.91 78.09 78.55 72.63 80.2116.0 78.79 67.86 78.78 77.75 72.50 80.4332.0 77.27 66.40 77.43 76.73 72.01 78.9864.0 75.01 65.75 75.01 74.41 71.79 76.29128.0 71.97 NaN 71.76 71.53 70.24 72.59

256 8.0 90.34 78.20 90.23 89.95 80.19 90.9816.0 91.43 76.87 90.68 90.58 81.57 92.0632.0 90.50 77.34 90.32 89.97 82.81 91.3964.0 88.61 77.37 88.56 88.24 83.21 89.20128.0 85.29 NaN 85.15 84.70 82.11 85.50

512 8.0 96.95 88.05 96.62 96.58 85.53 97.2216.0 97.57 87.77 97.16 97.02 86.84 97.7032.0 97.27 87.67 97.01 96.64 87.88 97.3264.0 96.06 87.57 96.05 95.71 87.86 96.14128.0 93.58 NaN 93.58 93.30 87.68 93.61

1024 8.0 99.40 94.44 99.37 99.31 86.35 99.3416.0 99.45 95.17 99.53 99.43 87.00 99.4232.0 99.25 94.12 99.42 99.36 87.54 99.2064.0 99.02 94.05 99.14 99.05 88.09 98.93128.0 98.05 NaN 98.15 98.09 89.43 97.93

Figure 77: (Left) The error over the number of trees in the ensemble on the avila dataset.Dashed lines depict the Random Forest and solid lines are the correspondingpruned ensemble via Reduced Error pruning. (Right) The 5-fold cross-validationaccuracy on the avila dataset. Rounded to the second decimal digit. Larger isbetter.

0 50 100 150 200 250Number of trees

88.50

88.75

89.00

89.25

89.50

89.75

90.00

90.25

Accu

racy

RE nl = 1024ET nl = 1024RE nl = 512ET nl = 512RE nl = 256ET nl = 256RE nl = 128ET nl = 128RE nl = 64ET nl = 64

model COMP DREP IC IE LMD REmax leaf nodes n estimators

64 8.0 89.72 89.47 89.90 89.86 89.46 90.0116.0 89.68 89.46 89.80 89.77 89.43 89.8932.0 89.62 89.44 89.60 89.58 89.41 89.7464.0 89.46 89.38 89.45 89.50 89.40 89.58128.0 89.41 89.38 89.37 89.43 89.35 89.47

128 8.0 89.95 89.59 90.05 90.08 89.59 90.1116.0 89.84 89.45 89.98 89.94 89.59 90.0332.0 89.76 89.45 89.85 89.70 89.52 89.8364.0 89.64 89.46 89.61 89.61 89.52 89.64128.0 89.53 89.47 89.52 89.52 89.49 89.55

256 8.0 89.96 89.51 90.12 89.99 89.71 90.0316.0 89.96 89.55 90.03 89.97 89.65 90.1032.0 89.87 89.56 89.92 89.86 89.64 89.9164.0 89.73 89.58 89.73 89.73 89.62 89.77128.0 89.60 89.55 89.60 89.59 89.59 89.62

512 8.0 89.96 89.69 89.96 90.01 89.78 90.1716.0 90.00 89.64 90.05 90.02 89.71 90.1232.0 89.95 89.64 89.98 89.90 89.73 90.0364.0 89.81 89.65 89.85 89.82 89.76 89.87128.0 89.75 89.65 89.76 89.75 89.71 89.76

1024 8.0 90.04 89.66 90.12 90.25 89.85 90.1516.0 90.18 89.69 90.20 90.27 89.86 90.2332.0 90.15 89.75 90.21 90.18 89.82 90.1064.0 90.00 89.76 90.08 90.05 89.87 89.98128.0 89.85 89.78 89.84 89.93 89.87 89.87

Figure 78: (Left) The error over the number of trees in the ensemble on the bank dataset.Dashed lines depict the Random Forest and solid lines are the correspondingpruned ensemble via Reduced Error pruning. (Right) The 5-fold cross-validationaccuracy on the bank dataset. Rounded to the second decimal digit. Larger isbetter.

47

Sebastian Buschjager, Katharina Morik

0 50 100 150 200 250Number of trees

35

40

45

50

55

60

Accu

racy

RE nl = 1024ET nl = 1024RE nl = 512ET nl = 512RE nl = 256ET nl = 256RE nl = 128ET nl = 128RE nl = 64ET nl = 64

model COMP DREP IC IE LMD REmax leaf nodes n estimators

64 8.0 42.95 39.91 41.76 41.10 41.93 44.5316.0 43.50 40.37 43.33 41.37 42.99 45.3932.0 43.81 NaN 43.78 41.24 43.06 45.5264.0 43.46 NaN 43.58 41.15 43.25 45.18128.0 NaN NaN 42.92 41.06 42.80 44.11

128 8.0 47.52 43.73 47.57 46.44 46.84 48.3616.0 48.39 44.59 48.83 46.95 47.89 49.8032.0 48.71 NaN 49.00 46.78 48.08 49.8464.0 48.52 NaN 48.55 46.66 48.10 49.60128.0 NaN NaN 47.87 46.61 47.65 NaN

256 8.0 52.30 49.15 51.18 51.00 50.84 53.0616.0 53.57 50.41 53.00 51.73 52.85 54.4932.0 54.15 51.27 54.35 51.72 53.28 55.0364.0 54.05 NaN 53.95 51.96 53.36 54.59128.0 NaN NaN 53.33 51.72 52.96 NaN

512 8.0 56.71 54.03 55.93 54.41 55.12 56.8416.0 58.61 55.06 58.44 55.83 57.03 58.7832.0 58.85 55.65 58.71 56.40 57.62 59.4164.0 58.48 NaN 58.59 57.09 58.01 58.75128.0 57.78 NaN 57.97 56.78 57.57 57.98

1024 8.0 59.97 56.43 59.73 57.99 57.72 59.8316.0 61.77 58.47 61.94 59.50 60.76 62.1232.0 62.63 NaN 62.76 60.58 61.64 63.0564.0 62.70 NaN 62.58 60.77 61.71 62.51128.0 NaN NaN 62.15 60.66 61.62 NaN

Figure 79: (Left) The error over the number of trees in the ensemble on the chess dataset.Dashed lines depict the Random Forest and solid lines are the correspondingpruned ensemble via Reduced Error pruning. (Right) The 5-fold cross-validationaccuracy on the chess dataset. Rounded to the second decimal digit. Larger isbetter.

0 50 100 150 200 250Number of trees

68

70

72

74

76

Accu

racy

RE nl = 1024ET nl = 1024RE nl = 512ET nl = 512RE nl = 256ET nl = 256RE nl = 128ET nl = 128RE nl = 64ET nl = 64

model COMP DREP IC IE LMD REmax leaf nodes n estimators

64 8.0 69.42 68.27 69.33 70.20 68.29 70.5316.0 68.93 67.61 68.96 69.85 67.89 70.2632.0 68.50 67.46 68.53 69.63 67.70 69.7664.0 68.22 67.30 68.22 69.02 67.61 69.28128.0 67.92 NaN 67.93 68.28 67.47 68.46

128 8.0 70.76 70.02 71.03 71.57 69.47 71.9816.0 70.41 69.57 70.31 71.35 69.50 71.6832.0 70.05 69.21 70.05 70.91 69.41 71.2764.0 69.87 NaN 69.87 70.53 69.10 70.68128.0 69.51 NaN 69.49 69.93 69.02 70.00

256 8.0 72.54 71.51 72.90 73.20 71.40 73.5316.0 72.53 70.89 72.60 73.04 71.22 73.4432.0 72.08 70.86 72.22 72.57 71.07 72.9664.0 71.67 NaN 71.66 72.11 70.91 72.38128.0 71.30 NaN 71.32 71.52 70.77 71.62

512 8.0 74.48 73.32 74.49 74.71 72.93 75.0216.0 74.18 73.02 74.49 74.62 72.91 74.9232.0 73.97 72.79 74.20 74.34 72.83 74.5964.0 73.71 NaN 73.80 73.92 72.72 74.11128.0 73.24 NaN 73.26 73.36 72.70 73.36

1024 8.0 75.74 74.53 76.16 76.08 74.27 76.2416.0 75.81 74.40 76.07 76.00 74.38 76.2432.0 75.62 74.57 75.76 75.71 74.50 75.9464.0 75.31 NaN 75.39 75.43 74.46 75.55128.0 74.87 NaN 74.96 75.02 74.41 75.00

Figure 80: (Left) The error over the number of trees in the ensemble on the connect dataset.Dashed lines depict the Random Forest and solid lines are the correspondingpruned ensemble via Reduced Error pruning. (Right) The 5-fold cross-validationaccuracy on the connect dataset. Rounded to the second decimal digit. Larger isbetter.

48

APPENDIX: Improving the Accuracy-Memory Trade-Off of Random Forests Via Leaf-Refinement

0 50 100 150 200 250Number of trees

70

75

80

85

90

Accu

racy

RE nl = 1024ET nl = 1024RE nl = 512ET nl = 512RE nl = 256ET nl = 256RE nl = 128ET nl = 128RE nl = 64ET nl = 64

model COMP DREP IC IE LMD REmax leaf nodes n estimators

64 8.0 76.17 75.59 76.76 76.83 74.69 78.4816.0 78.16 76.46 78.38 77.85 76.58 79.6632.0 79.17 77.51 79.13 77.94 77.84 80.4364.0 79.23 77.86 79.00 78.54 78.52 80.17128.0 78.98 78.01 78.94 78.54 78.89 79.61

128 8.0 79.39 79.05 80.25 79.95 77.72 81.4516.0 81.58 79.79 81.36 81.01 80.51 82.3732.0 82.37 80.94 82.39 81.35 81.93 83.0764.0 82.72 81.17 82.66 81.53 82.24 82.93128.0 82.56 81.62 82.58 81.72 82.35 82.74

256 8.0 81.16 81.64 82.48 82.96 79.70 83.2416.0 83.83 82.66 84.47 84.37 82.63 85.0332.0 85.19 84.01 85.27 84.24 84.16 85.8164.0 85.70 84.45 85.43 84.66 85.09 85.95128.0 85.47 84.45 85.05 84.57 85.10 85.42

512 8.0 84.09 83.77 84.90 84.97 82.92 85.5316.0 86.56 85.71 86.93 86.60 85.83 87.1932.0 87.37 86.48 87.90 87.10 87.08 88.0064.0 88.18 87.09 88.34 87.59 87.73 88.26128.0 88.22 87.52 88.20 87.56 87.78 88.11

1024 8.0 87.13 86.72 87.75 87.93 85.09 87.3616.0 89.32 88.44 89.51 89.31 87.74 89.3132.0 90.25 89.37 90.59 90.13 89.23 90.4464.0 90.60 90.00 90.71 90.48 89.89 90.67128.0 90.73 90.47 90.91 90.67 90.23 90.68

Figure 81: (Left) The error over the number of trees in the ensemble on the eeg dataset.Dashed lines depict the Random Forest and solid lines are the correspondingpruned ensemble via Reduced Error pruning. (Right) The 5-fold cross-validationaccuracy on the eeg dataset. Rounded to the second decimal digit. Larger isbetter.

0 50 100 150 200 250Number of trees

70

72

74

76

78

80

82

84

Accu

racy

RE nl = 1024ET nl = 1024RE nl = 512ET nl = 512RE nl = 256ET nl = 256RE nl = 128ET nl = 128RE nl = 64ET nl = 64

model COMP DREP IC IE LMD REmax leaf nodes n estimators

64 8.0 75.98 76.17 78.07 77.84 74.35 79.2516.0 77.10 76.07 78.55 78.03 76.38 79.3532.0 77.91 76.26 78.94 78.45 76.38 79.5364.0 77.92 76.33 78.82 78.61 76.74 79.38128.0 77.68 76.62 78.13 77.93 76.78 78.60

128 8.0 78.16 78.35 78.89 78.94 75.00 80.2816.0 78.77 78.30 79.35 79.30 77.56 80.7532.0 79.14 78.57 79.79 79.55 78.00 80.5464.0 79.20 78.37 79.90 79.55 78.30 80.31128.0 78.92 78.39 79.42 79.21 78.34 79.70

256 8.0 79.15 79.52 79.96 79.71 77.47 81.1716.0 80.22 79.53 80.49 80.16 79.07 81.3232.0 80.35 79.83 80.83 80.45 79.76 81.4964.0 80.49 79.92 80.87 80.57 80.00 81.20128.0 80.33 79.91 80.63 80.42 79.89 80.74

512 8.0 80.13 80.57 81.31 81.28 78.84 81.8616.0 81.27 80.93 81.97 81.67 80.43 82.3532.0 81.70 81.33 82.06 81.77 81.19 82.5364.0 81.70 81.33 82.18 81.83 81.29 82.36128.0 81.68 81.40 81.91 81.65 81.35 81.98

1024 8.0 81.80 82.11 82.88 82.65 80.91 83.1916.0 82.67 82.76 83.34 82.92 82.02 83.8032.0 83.38 82.98 83.54 83.04 82.68 83.8064.0 83.31 83.15 83.51 83.16 82.96 83.79128.0 83.36 83.04 83.27 83.13 83.14 83.55

Figure 82: (Left) The error over the number of trees in the ensemble on the elec dataset.Dashed lines depict the Random Forest and solid lines are the correspondingpruned ensemble via Reduced Error pruning. (Right) The 5-fold cross-validationaccuracy on the elec dataset. Rounded to the second decimal digit. Larger isbetter.

49

Sebastian Buschjager, Katharina Morik

0 50 100 150 200 250Number of trees

98.5

98.6

98.7

98.8

98.9

99.0

99.1

Accu

racy

RE nl = 1024ET nl = 1024RE nl = 512ET nl = 512RE nl = 256ET nl = 256RE nl = 128ET nl = 128RE nl = 64ET nl = 64

model COMP DREP IC IE LMD REmax leaf nodes n estimators

64 8.0 98.80 98.66 98.76 98.76 98.47 98.7816.0 98.74 98.63 98.82 98.82 98.48 98.7832.0 98.75 98.62 98.81 98.82 98.59 98.8264.0 98.76 98.69 98.79 98.81 98.69 98.78128.0 98.78 98.70 98.79 98.80 98.74 98.78

128 8.0 98.89 98.80 98.91 98.87 98.86 98.9716.0 98.88 98.85 98.98 98.89 98.84 98.9532.0 98.90 98.88 98.96 98.91 98.87 99.0164.0 98.90 98.90 98.95 98.92 98.87 98.93128.0 98.91 98.88 98.91 98.89 98.88 98.92

256 8.0 99.03 98.90 99.02 98.99 98.82 98.9816.0 99.02 98.97 99.02 99.01 98.89 98.9832.0 99.02 99.01 99.02 99.01 98.92 98.9964.0 98.99 99.02 99.01 99.01 98.92 98.99128.0 98.98 99.01 99.01 99.01 98.98 98.99

512 8.0 98.92 98.89 98.92 99.01 98.84 98.9716.0 99.02 99.01 99.04 99.09 98.94 99.0532.0 99.08 99.08 99.08 99.12 99.06 99.1264.0 99.10 99.11 99.10 99.12 99.13 99.16128.0 99.10 99.17 99.15 99.14 99.11 99.11

1024 8.0 98.96 99.01 99.07 99.06 98.86 98.9816.0 99.08 99.02 99.07 99.07 99.05 99.0432.0 99.11 99.04 99.11 99.11 99.03 99.0764.0 99.08 99.11 99.08 99.09 99.09 99.07128.0 99.12 99.15 99.09 99.08 99.11 99.15

Figure 83: (Left) The error over the number of trees in the ensemble on the ida2016 dataset.Dashed lines depict the Random Forest and solid lines are the correspondingpruned ensemble via Reduced Error pruning. (Right) The 5-fold cross-validationaccuracy on the ida2016 dataset. Rounded to the second decimal digit. Larger isbetter.

0 50 100 150 200 250Number of trees

70

75

80

85

90

95

Accu

racy

RE nl = 1024ET nl = 1024RE nl = 512ET nl = 512RE nl = 256ET nl = 256RE nl = 128ET nl = 128RE nl = 64ET nl = 64

model COMP DREP IC IE LMD REmax leaf nodes n estimators

64 8.0 86.97 84.31 86.36 85.58 84.52 87.2116.0 89.76 87.38 89.16 87.72 88.47 90.1132.0 90.94 89.48 90.64 89.38 90.75 91.4864.0 91.58 90.55 91.27 90.34 91.27 92.14128.0 91.68 90.92 91.51 90.88 91.26 91.98

128 8.0 89.59 87.89 88.89 88.26 87.19 90.1316.0 91.79 90.56 91.34 90.27 91.05 91.9832.0 93.02 92.26 92.69 91.49 92.62 93.3464.0 93.52 92.76 93.02 92.43 93.28 93.54128.0 93.74 93.17 93.39 93.12 93.53 93.68

256 8.0 91.91 90.44 91.88 91.07 90.18 91.6416.0 93.84 92.54 93.73 92.89 93.12 93.8232.0 94.55 94.00 94.72 94.05 94.34 94.7964.0 95.05 94.70 94.95 94.53 94.89 95.27128.0 95.20 95.02 95.09 95.00 95.07 95.25

512 8.0 93.41 92.70 93.06 92.69 91.65 92.8716.0 95.33 94.79 94.89 94.50 94.28 94.8932.0 96.07 95.66 95.87 95.38 95.66 95.8164.0 96.42 96.21 96.25 96.03 96.28 96.26128.0 96.38 96.30 96.38 96.19 96.46 96.36

1024 8.0 94.12 94.02 93.90 94.30 93.31 94.3016.0 95.99 95.97 96.01 95.96 95.55 96.0932.0 97.02 96.69 97.06 96.96 96.66 96.8664.0 97.32 97.25 97.49 97.21 97.30 97.31128.0 97.59 97.44 97.65 97.55 97.57 97.53

Figure 84: (Left) The error over the number of trees in the ensemble on the japanese-vowels dataset. Dashed lines depict the Random Forest and solid lines are thecorresponding pruned ensemble via Reduced Error pruning. (Right) The 5-foldcross-validation accuracy on the japanese-vowels dataset. Rounded to the seconddecimal digit. Larger is better.

50

APPENDIX: Improving the Accuracy-Memory Trade-Off of Random Forests Via Leaf-Refinement

0 50 100 150 200 250Number of trees

81

82

83

84

85

86

87

Accu

racy

RE nl = 1024ET nl = 1024RE nl = 512ET nl = 512RE nl = 256ET nl = 256RE nl = 128ET nl = 128RE nl = 64ET nl = 64

model COMP DREP IC IE LMD REmax leaf nodes n estimators

64 8.0 84.12 83.48 84.54 84.52 83.22 85.2816.0 84.74 83.73 84.99 84.74 83.81 85.4832.0 84.90 83.72 85.03 84.58 84.13 85.1564.0 84.90 83.73 84.92 84.47 84.11 85.01128.0 84.56 83.78 84.53 84.14 84.10 84.65

128 8.0 84.88 84.54 85.21 85.11 84.07 85.6416.0 85.21 84.85 85.73 85.24 84.77 85.8432.0 85.47 84.82 85.77 85.27 85.04 85.9864.0 85.49 84.80 85.66 85.23 84.96 85.75128.0 85.44 84.81 85.51 85.09 85.00 85.51

256 8.0 85.38 84.89 85.80 85.70 84.95 85.8616.0 85.97 85.48 86.23 86.01 85.52 86.2732.0 86.23 85.61 86.35 85.99 85.71 86.1964.0 86.21 85.55 86.39 85.93 85.80 86.14128.0 86.10 85.60 86.19 85.71 85.88 86.11

512 8.0 85.96 85.65 86.04 85.94 84.97 86.0616.0 86.46 86.27 86.82 86.35 85.88 86.3932.0 86.63 86.05 86.92 86.55 86.45 86.5364.0 86.67 86.18 86.74 86.55 86.45 86.58128.0 86.74 86.23 86.77 86.55 86.51 86.62

1024 8.0 85.79 85.69 86.24 86.10 85.73 86.0716.0 86.51 86.21 86.77 86.59 86.26 86.6332.0 86.79 86.71 87.03 86.86 86.53 86.8664.0 87.09 86.97 87.11 86.97 86.98 86.86128.0 87.03 86.89 87.19 87.07 86.92 87.02

Figure 85: (Left) The error over the number of trees in the ensemble on the magic dataset.Dashed lines depict the Random Forest and solid lines are the correspondingpruned ensemble via Reduced Error pruning. (Right) The 5-fold cross-validationaccuracy on the magic dataset. Rounded to the second decimal digit. Larger isbetter

0 50 100 150 200 250Number of trees

65

70

75

80

85

90

95

Accu

racy

RE nl = 1024ET nl = 1024RE nl = 512ET nl = 512RE nl = 256ET nl = 256RE nl = 128ET nl = 128RE nl = 64ET nl = 64

model COMP DREP IC IE LMD REmax leaf nodes n estimators

64 8.0 82.3 82.3 81.4 81.3 79.7 84.716.0 85.8 85.6 85.3 84.8 83.0 85.332.0 87.3 87.0 87.4 86.1 86.4 87.964.0 88.1 87.6 88.0 87.1 88.1 88.5128.0 88.6 88.3 88.1 87.9 88.0 88.8

128 8.0 85.5 83.9 86.1 84.4 83.4 85.116.0 88.6 87.0 88.2 89.2 88.0 88.632.0 90.2 88.7 89.5 89.4 88.1 89.564.0 90.6 89.2 91.7 91.2 90.0 90.7128.0 90.9 90.1 91.4 90.8 90.1 90.8

256 8.0 87.7 87.6 85.8 86.4 86.5 86.416.0 90.0 89.6 88.8 88.9 88.8 90.532.0 91.7 91.4 90.9 90.2 90.7 92.464.0 92.3 91.3 91.9 91.1 91.5 92.0128.0 92.2 92.5 91.9 92.5 92.2 92.3

512 8.0 88.3 86.4 89.1 88.5 86.4 87.916.0 90.5 88.5 91.0 91.2 90.5 90.032.0 91.9 91.5 92.0 92.1 91.2 91.964.0 92.1 92.8 92.8 92.0 92.1 92.9128.0 93.2 93.0 93.7 93.5 92.6 93.3

1024 8.0 85.6 85.1 87.5 87.7 86.3 84.816.0 89.5 90.5 90.8 91.0 90.4 89.832.0 92.3 92.3 92.2 92.6 92.2 91.364.0 93.3 93.1 93.3 93.6 92.7 92.6128.0 93.4 93.7 93.8 94.0 93.8 93.6

Figure 86: (Left) The error over the number of trees in the ensemble on the mnist dataset.Dashed lines depict the Random Forest and solid lines are the correspondingpruned ensemble via Reduced Error pruning. (Right) The 5-fold cross-validationaccuracy on the mnist dataset. Rounded to the second decimal digit. Larger isbetter.

51

Sebastian Buschjager, Katharina Morik

0 50 100 150 200 250Number of trees

90

91

92

93

94

Accu

racy

RE nl = 1024ET nl = 1024RE nl = 512ET nl = 512RE nl = 256ET nl = 256RE nl = 128ET nl = 128RE nl = 64ET nl = 64

model COMP DREP IC IE LMD REmax leaf nodes n estimators

64 8.0 91.88 91.66 93.03 92.88 88.21 93.3516.0 91.91 91.56 92.90 92.63 89.75 93.2232.0 92.20 91.78 92.71 92.36 90.83 92.9464.0 92.20 91.70 92.47 92.13 90.94 92.84128.0 92.01 91.64 92.10 91.81 91.29 92.46

128 8.0 92.20 92.04 93.30 93.18 89.89 93.3916.0 92.40 92.04 93.21 93.00 91.36 93.5432.0 92.50 92.11 93.10 92.72 91.53 93.3164.0 92.45 91.99 93.02 92.51 91.59 93.10128.0 92.40 92.15 92.69 92.32 91.73 92.80

256 8.0 92.92 92.87 93.87 93.62 91.55 93.6316.0 93.36 92.84 93.59 93.37 92.16 93.5832.0 93.33 92.98 93.60 93.42 92.36 93.3864.0 93.17 93.05 93.44 93.30 92.45 93.35128.0 93.19 93.04 93.32 93.14 92.52 93.28

512 8.0 93.50 93.37 94.17 94.04 92.58 94.0916.0 93.80 93.71 94.04 94.00 93.05 94.0132.0 93.82 93.66 93.95 93.89 93.35 93.9164.0 93.75 93.61 93.88 93.77 93.34 93.84128.0 93.62 93.55 93.81 93.62 93.31 93.66

1024 8.0 94.69 94.27 94.67 94.69 93.30 94.4516.0 94.68 94.19 94.78 94.80 93.75 94.5332.0 94.63 94.26 94.83 94.80 94.08 94.6964.0 94.48 94.36 94.73 94.66 94.11 94.55128.0 94.36 94.37 94.55 94.43 94.23 94.42

Figure 87: (Left) The error over the number of trees in the ensemble on the mozilla dataset.Dashed lines depict the Random Forest and solid lines are the correspondingpruned ensemble via Reduced Error pruning. (Right) The 5-fold cross-validationaccuracy on the mozilla dataset. Rounded to the second decimal digit. Larger isbetter.

0 50 100 150 200 250Number of trees

94.0

94.5

95.0

95.5

96.0

96.5

Accu

racy

RE nl = 1024ET nl = 1024RE nl = 512ET nl = 512RE nl = 256ET nl = 256RE nl = 128ET nl = 128RE nl = 64ET nl = 64

model COMP DREP IC IE LMD REmax leaf nodes n estimators

64 8.0 94.60 94.41 94.60 94.51 94.39 94.9116.0 94.85 94.50 94.69 94.53 94.45 95.0232.0 94.93 94.51 94.88 94.47 94.55 94.9864.0 94.86 94.48 94.91 94.46 94.60 94.96128.0 94.76 94.52 94.86 94.49 94.55 94.82

128 8.0 95.12 94.88 95.11 95.06 94.82 95.3016.0 95.23 95.02 95.30 95.19 95.04 95.4632.0 95.32 95.10 95.34 95.16 95.15 95.4264.0 95.34 95.09 95.37 95.17 95.11 95.34128.0 95.28 95.08 95.26 95.15 95.13 95.26

256 8.0 95.44 95.35 95.65 95.54 95.34 95.6616.0 95.71 95.52 95.75 95.49 95.57 95.7032.0 95.78 95.56 95.85 95.54 95.57 95.7164.0 95.76 95.56 95.77 95.61 95.61 95.68128.0 95.69 95.61 95.71 95.64 95.60 95.70

512 8.0 95.89 95.82 95.87 95.86 95.67 95.9016.0 96.09 95.98 96.06 96.08 95.85 96.0832.0 96.07 95.97 96.08 96.13 96.01 96.1664.0 96.12 96.01 96.16 96.11 96.06 96.18128.0 96.11 96.05 96.11 96.05 96.14 96.17

1024 8.0 96.13 96.18 96.09 96.16 96.09 96.2016.0 96.32 96.38 96.45 96.37 96.29 96.3632.0 96.51 96.48 96.53 96.50 96.45 96.5264.0 96.50 96.48 96.57 96.52 96.46 96.56128.0 96.54 96.49 96.55 96.51 96.54 96.54

Figure 88: (Left) The error over the number of trees in the ensemble on the nomao dataset.Dashed lines depict the Random Forest and solid lines are the correspondingpruned ensemble via Reduced Error pruning. (Right) The 5-fold cross-validationaccuracy on the nomao dataset. Rounded to the second decimal digit. Larger isbetter.

52

APPENDIX: Improving the Accuracy-Memory Trade-Off of Random Forests Via Leaf-Refinement

0 50 100 150 200 250Number of trees

60

65

70

75

80

85

90

Accu

racy

RE nl = 1024ET nl = 1024RE nl = 512ET nl = 512RE nl = 256ET nl = 256RE nl = 128ET nl = 128RE nl = 64ET nl = 64

model COMP DREP IC IE LMD REmax leaf nodes n estimators

64 8.0 70.21 68.15 69.78 68.81 68.17 71.7416.0 72.13 70.30 72.34 70.73 71.17 73.9432.0 73.11 NaN 73.10 71.59 72.71 75.2364.0 73.58 NaN 73.37 72.15 73.09 75.23128.0 73.38 NaN 73.30 72.38 73.12 74.47

128 8.0 75.72 73.98 74.99 74.60 73.75 76.7316.0 77.28 75.26 77.40 75.99 76.06 78.7832.0 78.02 NaN 78.05 76.61 77.28 79.7964.0 78.27 NaN 78.26 76.95 77.80 79.52128.0 77.90 NaN 77.65 76.91 77.72 78.73

256 8.0 80.93 79.10 81.23 78.96 78.59 81.4916.0 83.00 80.96 82.62 80.71 81.46 83.5832.0 83.50 NaN 83.28 81.50 82.57 84.3564.0 83.66 NaN 83.45 82.08 82.88 84.19128.0 83.19 NaN 83.06 82.12 82.80 83.76

512 8.0 85.74 84.15 85.54 84.69 83.95 86.0016.0 87.33 86.03 87.09 86.03 86.30 87.6832.0 87.93 NaN 87.88 86.71 87.23 88.4264.0 88.13 NaN 87.93 87.14 87.41 88.49128.0 87.93 NaN 87.77 87.30 87.63 88.18

1024 8.0 89.77 88.68 89.96 89.32 88.51 90.2016.0 91.16 90.14 91.09 90.60 90.30 91.4832.0 91.73 NaN 91.79 91.19 91.04 92.0064.0 91.91 NaN 91.86 91.50 91.47 92.18128.0 91.87 NaN 91.85 91.59 91.58 92.00

Figure 89: (Left) The error over the number of trees in the ensemble on the postures dataset.Dashed lines depict the Random Forest and solid lines are the correspondingpruned ensemble via Reduced Error pruning. (Right) The 5-fold cross-validationaccuracy on the postures dataset. Rounded to the second decimal digit. Largeris better.

0 50 100 150 200 250Number of trees

82

84

86

88

90

Accu

racy

RE nl = 1024ET nl = 1024RE nl = 512ET nl = 512RE nl = 256ET nl = 256RE nl = 128ET nl = 128RE nl = 64ET nl = 64

model COMP DREP IC IE LMD REmax leaf nodes n estimators

64 8.0 87.59 87.17 87.85 87.93 87.22 88.0616.0 88.16 87.56 88.35 87.87 87.78 88.0732.0 88.02 87.96 88.41 88.12 87.82 88.0964.0 88.34 88.15 88.26 88.32 88.13 88.24128.0 88.16 88.20 88.27 88.24 88.21 88.20

128 8.0 88.44 88.32 88.77 88.46 87.76 88.6916.0 88.83 88.69 89.18 89.18 88.65 88.8032.0 89.14 89.02 89.14 89.18 88.62 89.1664.0 89.13 89.18 89.22 89.30 88.85 89.24128.0 89.35 88.99 89.39 89.30 89.24 89.30

256 8.0 89.60 88.88 88.80 89.39 88.62 89.3216.0 89.81 89.39 89.97 90.12 89.19 89.8432.0 89.95 89.61 90.14 90.02 89.75 90.2864.0 90.19 90.00 90.36 90.12 89.98 90.06128.0 90.22 90.28 90.17 90.20 90.08 90.23

512 8.0 89.27 89.13 89.04 89.44 88.15 89.3516.0 90.26 89.80 89.81 90.45 89.55 90.0032.0 90.68 90.40 90.39 90.72 90.30 90.4264.0 91.01 90.51 90.59 90.81 90.81 90.67128.0 90.89 90.90 90.89 91.09 90.96 90.95

1024 8.0 89.42 89.05 89.42 89.41 88.88 89.3616.0 90.30 90.16 90.31 90.20 89.83 90.4532.0 90.62 90.48 90.76 90.90 90.33 90.7264.0 90.93 90.65 91.07 91.17 90.92 90.64128.0 91.03 90.89 91.34 91.06 91.14 90.89

Figure 90: (Left) The error over the number of trees in the ensemble on the satimage dataset.Dashed lines depict the Random Forest and solid lines are the correspondingpruned ensemble via Reduced Error pruning. (Right) The 5-fold cross-validationaccuracy on the satimage dataset. Rounded to the second decimal digit. Largeris better.

53

Sebastian Buschjager, Katharina Morik

7.1 Plotting the Pareto Front For More Datasets with Dedicated Pruning Set

101 102 103 104

Model Size [KB]

0.82

0.83

0.84

0.85

0.86

0.87

Accu

racy

CACOMPDREPETET-LRGBICIELMDRE

101 102 103

Model Size [KB]

0.60

0.65

0.70

0.75

0.80

0.85

0.90

0.95

1.00

Accu

racy

CACOMPDREPETET-LRGBICIELMDRE

Figure 91: (left) 5-fold cross-validation accuracy on the adult dataset. (right) 5-fold cross-validation accuracy on the anura dataset.

101 102 103 104

Model Size [KB]

0.5

0.6

0.7

0.8

0.9

1.0

Accu

racy

CACOMPDREPETET-LRGBICIELMDRE

101 102 103 104

Model Size [KB]

0.8925

0.8950

0.8975

0.9000

0.9025

0.9050

0.9075

Accu

racy

CACOMPDREPETET-LRGBICIELMDRE

Figure 92: (left) 5-fold cross-validation accuracy on the avila dataset. (right) 5-fold cross-validation accuracy on the bank dataset.

101 102 103 104

Model Size [KB]

0.3

0.4

0.5

0.6

0.7

Accu

racy

CACOMPDREPETET-LRGBICIELMDRE

101 102 103 104

Model Size [KB]

0.675

0.700

0.725

0.750

0.775

0.800

0.825

Accu

racy

CACOMPDREPETET-LRGBICIELMDRE

Figure 93: (left) 5-fold cross-validation accuracy on the chess dataset. (right) 5-fold cross-validation accuracy on the connect dataset.

54

APPENDIX: Improving the Accuracy-Memory Trade-Off of Random Forests Via Leaf-Refinement

101 102 103 104

Model Size [KB]

0.65

0.70

0.75

0.80

0.85

0.90

Accu

racy

CACOMPDREPETET-LRGBICIELMDRE

101 102 103 104

Model Size [KB]

0.65

0.70

0.75

0.80

0.85

Accu

racy

CACOMPDREPETET-LRGBICIELMDRE

Figure 94: (left) 5-fold cross-validation accuracy on the eeg dataset. (right) 5-fold cross-validation accuracy on the elec dataset.

101 102 103 104

Model Size [KB]

0.984

0.985

0.986

0.987

0.988

0.989

0.990

0.991

0.992

Accu

racy

CACOMPDREPETET-LRGBICIELMDRE

101 102 103 104

Model Size [KB]

0.65

0.70

0.75

0.80

0.85

0.90

0.95

Accu

racy

CACOMPDREPETET-LRGBICIELMDRE

Figure 95: (left) 5-fold cross-validation accuracy on the ida2016 dataset. (right) 5-foldcross-validation accuracy on the japanese-vowels dataset.

101 102 103 104

Model Size [KB]

0.78

0.80

0.82

0.84

0.86

0.88

Accu

racy

CACOMPDREPETET-LRGBICIELMDRE

101 102 103 104

Model Size [KB]

0.65

0.70

0.75

0.80

0.85

0.90

0.95

Accu

racy

CACOMPDREPETET-LRGBICIELMDRE

Figure 96: (left) 5-fold cross-validation accuracy on the magic dataset. (right) 5-fold cross-validation accuracy on the mnist dataset.

55

Sebastian Buschjager, Katharina Morik

101 102 103 104

Model Size [KB]

0.75

0.80

0.85

0.90

0.95Ac

cura

cy

CACOMPDREPETET-LRGBICIELMDRE

101 102 103 104

Model Size [KB]

0.93

0.94

0.95

0.96

Accu

racy

CACOMPDREPETET-LRGBICIELMDRE

Figure 97: (left) 5-fold cross-validation accuracy on the mozilla dataset. (right) 5-foldcross-validation accuracy on the nomao dataset.

101 102 103 104

Model Size [KB]

0.5

0.6

0.7

0.8

0.9

Accu

racy

CACOMPDREPETET-LRGBICIELMDRE

101 102 103 104

Model Size [KB]

0.84

0.85

0.86

0.87

0.88

0.89

0.90

0.91

Accu

racy

CACOMPDREPETET-LRGBICIELMDRE

Figure 98: (left) 5-fold cross-validation accuracy on the postures dataset. (right) 5-foldcross-validation accuracy on the satimage dataset.

56

APPENDIX: Improving the Accuracy-Memory Trade-Off of Random Forests Via Leaf-Refinement

model CA COMP DREP ET ET-LR GB IC IE LMD RE

adult 83.483 84.248 84.303 83.655 84.306 86.244 84.392 85.031 83.523 85.123anura 94.329 95.261 95.038 94.580 96.178 91.564 95.427 95.372 93.871 95.525avila 66.191 83.548 80.381 68.735 74.328 59.496 83.836 83.874 73.532 84.406bank 89.427 89.737 89.578 89.491 89.772 90.527 90.117 90.115 89.496 90.124chess 40.797 45.577 44.810 41.121 48.282 30.175 43.638 45.897 43.684 46.650connect 70.036 72.050 72.013 70.117 74.735 67.584 71.808 72.320 70.546 72.699eeg 75.935 76.168 76.702 76.175 78.632 79.226 76.762 78.652 74.693 79.393elec 75.448 75.980 78.686 75.872 77.344 81.941 78.136 79.063 74.347 79.844ida2016 98.725 98.800 98.881 98.719 98.906 99.038 98.962 98.894 98.744 98.894japanese-vowels 84.018 86.969 84.309 83.847 88.706 81.930 86.357 85.584 84.520 87.210magic 83.464 84.121 83.932 83.332 85.225 86.629 84.542 84.752 83.217 85.283mnist 72.000 78.300 77.700 76.500 78.600 70.600 76.000 77.700 73.500 78.800mozilla 90.621 91.875 92.950 91.534 93.001 94.493 93.361 93.355 88.215 93.573nomao 94.612 94.728 94.658 94.516 95.125 95.273 94.818 94.914 94.554 95.099postures 63.365 67.290 65.118 63.535 67.743 64.126 65.807 66.641 59.460 68.149satimage 86.034 86.579 86.454 86.376 87.076 85.925 87.170 86.905 86.283 86.921

Table 14: Test accuracies for models with a memory consumption below 32 KB for eachmethod and each dataset averaged over a 5 fold cross validation. Rounded to thethird decimal digit. Larger is better. The best method is depicted in bold.

model CA COMP DREP ET ET-LR GB IC IE LMD RE

adult 83.855 84.282 84.405 83.815 84.847 86.616 84.534 85.059 83.876 85.166anura 94.329 96.331 95.858 95.691 97.276 95.024 96.261 96.275 95.817 96.178avila 78.157 92.462 89.112 74.395 82.298 67.724 92.352 92.433 77.807 92.687bank 89.516 89.949 89.587 89.491 90.367 90.677 90.117 90.115 89.593 90.124chess 44.978 49.615 46.749 44.956 54.398 34.969 47.754 48.777 46.838 49.832connect 71.813 73.009 72.894 71.784 77.212 70.847 72.990 73.568 71.580 73.822eeg 78.184 79.386 79.586 78.698 82.684 82.463 80.247 81.348 77.724 81.469elec 76.033 78.156 79.348 76.704 79.707 83.878 78.889 79.928 76.382 80.577ida2016 98.925 98.900 98.881 98.856 99.031 99.094 98.962 98.894 98.862 98.969japanese-vowels 85.915 89.760 87.893 88.033 93.254 87.341 89.158 88.264 88.465 90.132magic 84.300 84.878 84.657 84.368 86.198 87.355 85.210 85.115 84.074 85.641mnist 80.500 82.300 82.300 82.300 84.900 74.400 82.000 81.300 79.700 84.700mozilla 92.030 92.203 92.950 91.682 93.451 94.590 93.985 93.786 89.894 93.734nomao 94.876 95.244 95.111 94.957 95.691 95.958 95.361 95.213 94.917 95.358postures 70.184 72.281 70.851 69.851 76.214 69.058 71.476 71.861 68.168 73.158satimage 87.449 87.589 87.247 86.983 88.834 87.449 87.854 87.932 87.216 88.056

Table 15: Test accuracies for models with a memory consumption below 64 KB for eachmethod and each dataset averaged over a 5 fold cross validation. Rounded to thethird decimal digit. Larger is better. The best method is depicted in bold.

57

Sebastian Buschjager, Katharina Morik

model CA COMP DREP ET ET-LR GB IC IE LMD RE

adult 83.898 84.601 84.445 83.941 85.369 87.135 84.712 85.188 84.085 85.172anura 95.344 96.942 96.692 96.567 97.512 96.553 97.276 97.179 96.331 96.915avila 83.323 96.454 93.051 82.206 88.796 75.262 96.300 96.454 80.817 96.454bank 89.516 89.960 89.633 89.589 90.595 90.737 90.117 90.115 89.706 90.124chess 50.121 53.393 50.866 48.695 57.973 40.719 52.481 51.943 50.845 53.532connect 72.413 73.927 73.314 72.429 78.861 73.850 74.080 74.697 72.749 74.795eeg 81.582 81.575 81.636 81.495 85.534 85.734 82.483 82.964 80.507 83.244elec 78.791 79.147 80.091 78.849 81.661 85.748 80.508 80.806 77.560 81.257ida2016 98.925 99.031 98.900 98.894 99.131 99.169 99.025 98.994 98.862 98.975japanese-vowels 88.636 91.908 90.563 90.533 94.699 91.748 91.878 91.065 91.045 91.979magic 84.773 85.383 84.952 84.621 86.939 87.733 85.798 85.704 84.952 85.862mnist 83.800 85.800 85.600 85.000 89.200 79.300 86.100 84.800 83.400 85.300mozilla 92.499 92.924 93.483 92.570 94.017 94.989 94.107 94.024 91.547 93.747nomao 95.462 95.593 95.453 95.419 95.851 96.408 95.654 95.688 95.337 95.656postures 75.577 77.789 76.502 75.981 82.953 75.760 77.215 77.465 73.751 77.983satimage 87.854 88.445 88.320 88.009 89.736 88.631 88.771 88.460 87.776 88.694

Table 16: Test accuracies for models with a memory consumption below 128 KB for eachmethod and each dataset averaged over a 5 fold cross validation. Rounded to thethird decimal digit. Larger is better. The best method is depicted in bold.

model CA COMP DREP ET ET-LR GB IC IE LMD RE

adult 84.137 84.896 84.445 84.285 85.719 87.135 85.142 85.188 84.187 85.212anura 95.344 97.248 97.109 97.192 97.707 97.429 97.582 97.345 96.942 97.429avila 85.925 98.888 93.051 89.869 94.393 82.820 98.922 98.840 85.527 98.922bank 89.644 89.965 89.695 89.589 90.668 90.737 90.117 90.115 89.783 90.173chess 52.253 56.708 54.031 52.965 63.131 44.678 55.935 54.965 55.118 56.836connect 73.230 75.254 74.194 73.590 80.553 76.170 75.307 75.588 73.495 75.563eeg 82.570 84.092 83.772 84.119 88.144 85.734 84.900 84.967 82.924 85.527elec 79.586 80.224 81.140 79.994 82.861 85.748 82.223 81.861 79.065 82.523ida2016 98.925 99.031 99.006 98.950 99.138 99.169 99.025 99.062 98.887 99.012japanese-vowels 89.720 93.836 92.701 92.902 95.894 94.860 93.725 92.892 93.123 93.816magic 85.015 85.972 85.646 85.404 87.081 87.733 86.230 86.009 85.520 86.266mnist 83.800 88.600 87.600 88.300 91.200 84.600 88.200 89.200 88.000 88.600mozilla 93.284 94.037 93.483 93.097 94.114 94.989 94.172 94.037 92.576 94.088nomao 95.668 95.886 95.825 95.651 96.240 96.408 95.871 95.860 95.665 95.900postures 80.599 82.708 81.608 80.563 87.939 81.100 82.304 82.918 79.493 83.077satimage 88.445 89.596 88.880 88.694 90.140 89.782 89.176 89.393 88.647 89.316

Table 17: Test accuracies for models with a memory consumption below 256 KB for eachmethod and each dataset averaged over a 5 fold cross validation. Rounded to thethird decimal digit. Larger is better. The best method is depicted in bold.

58

APPENDIX: Improving the Accuracy-Memory Trade-Off of Random Forests Via Leaf-Refinement

12345678910

ET-LRIC

GBREIECOMP

DREPETLMDCA

Figure 99: Critical Difference Diagram for the normalized area under the Pareto front fordifferent methods over multiple datasets. More to the right (lower rank) is better.Methods in connected cliques are statistically similar.

7.2 Accuracies under various resource constraints with a ExtraTrees Classifier

7.3 Area Under the Pareto Front with ExtaTrees Classifier

AUCmodel CA COMP DREP ET ET-LR GB IC IE LMD REdataset
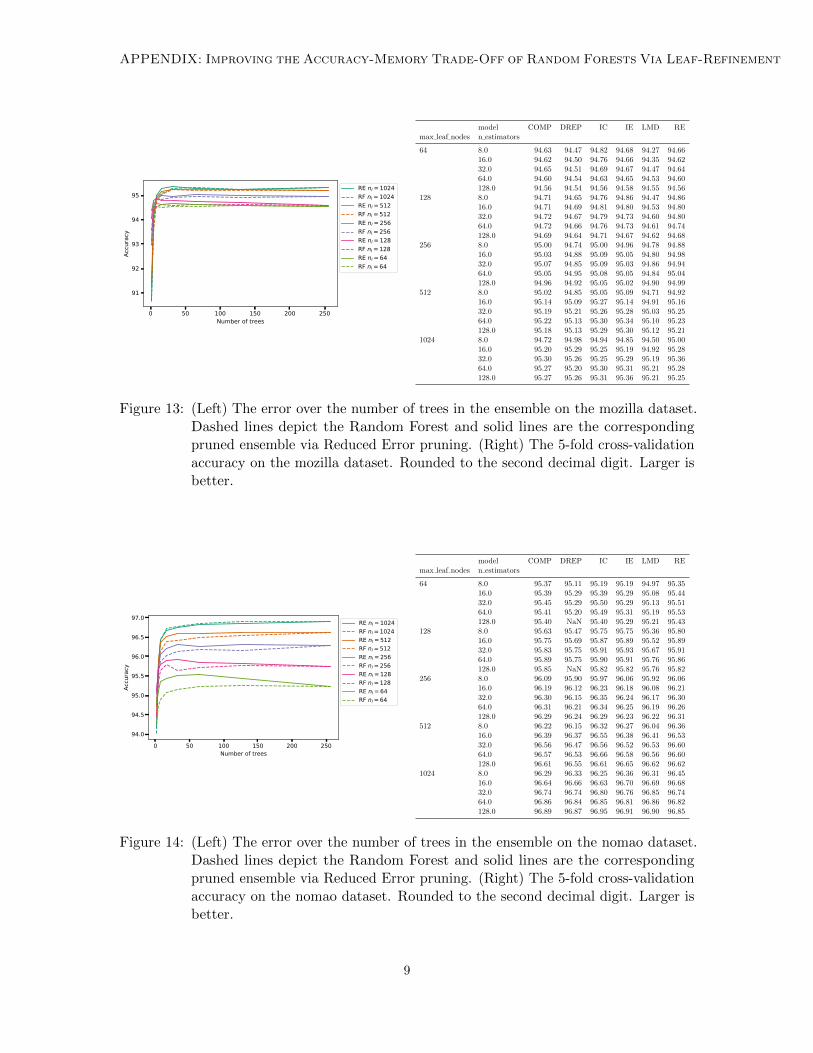
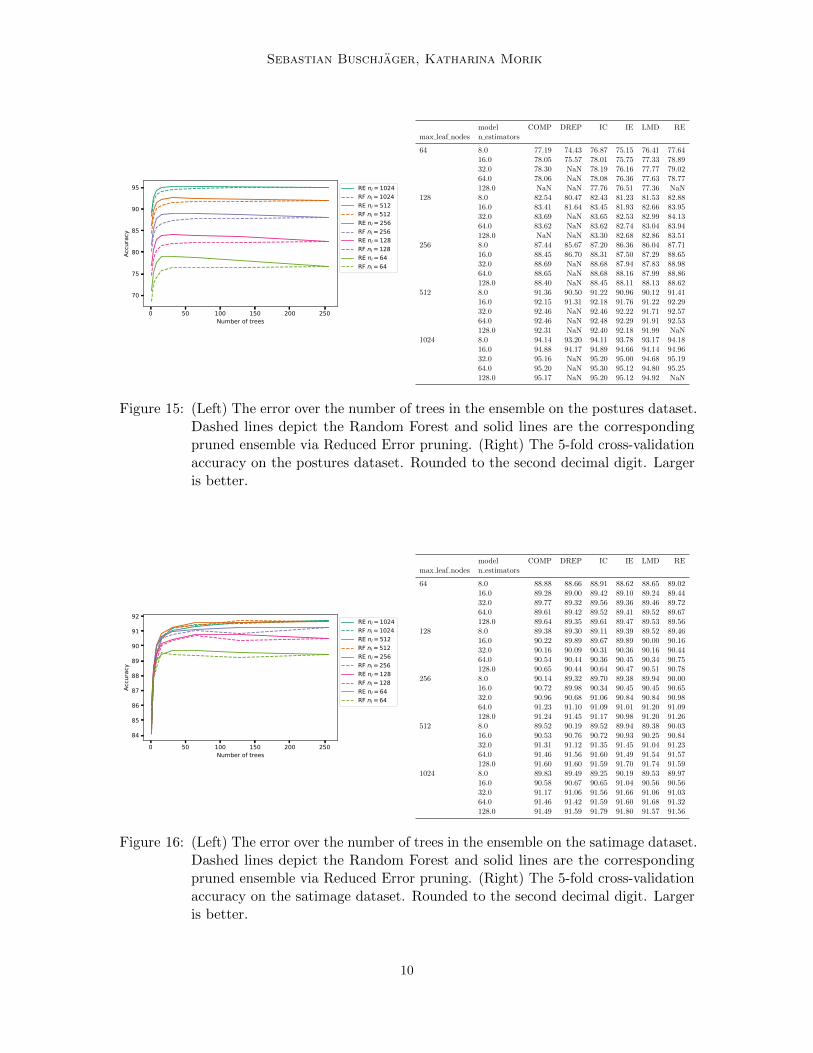
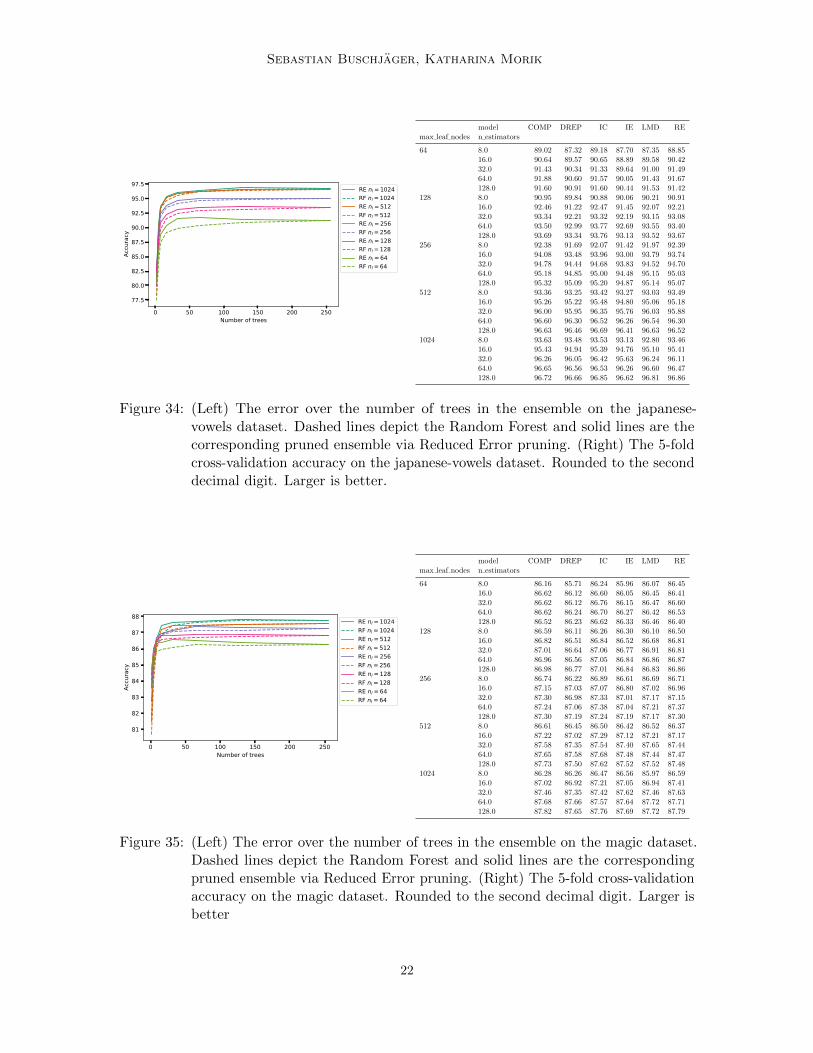
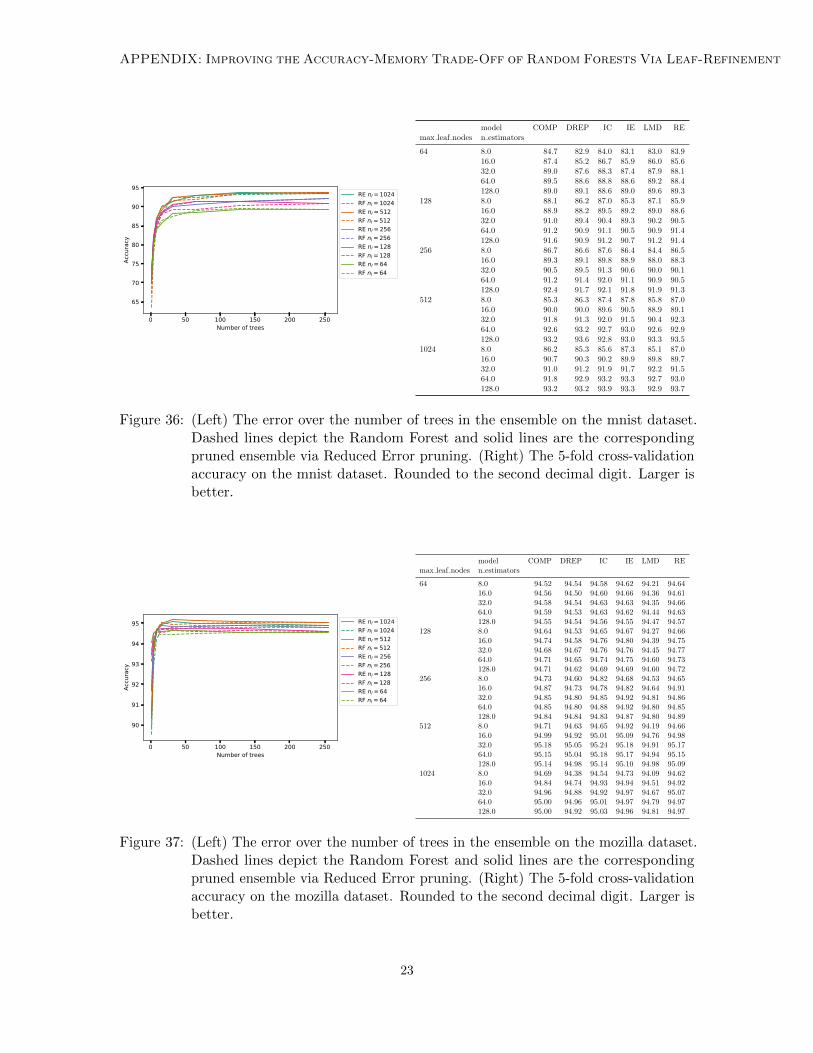
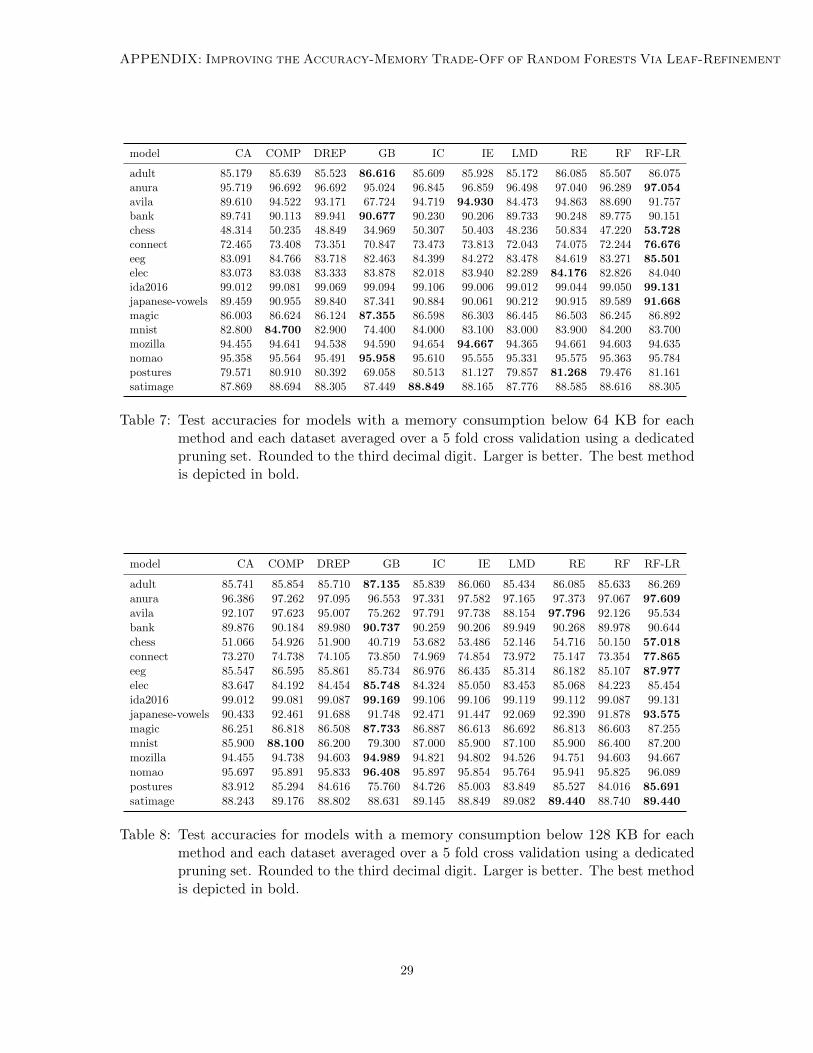
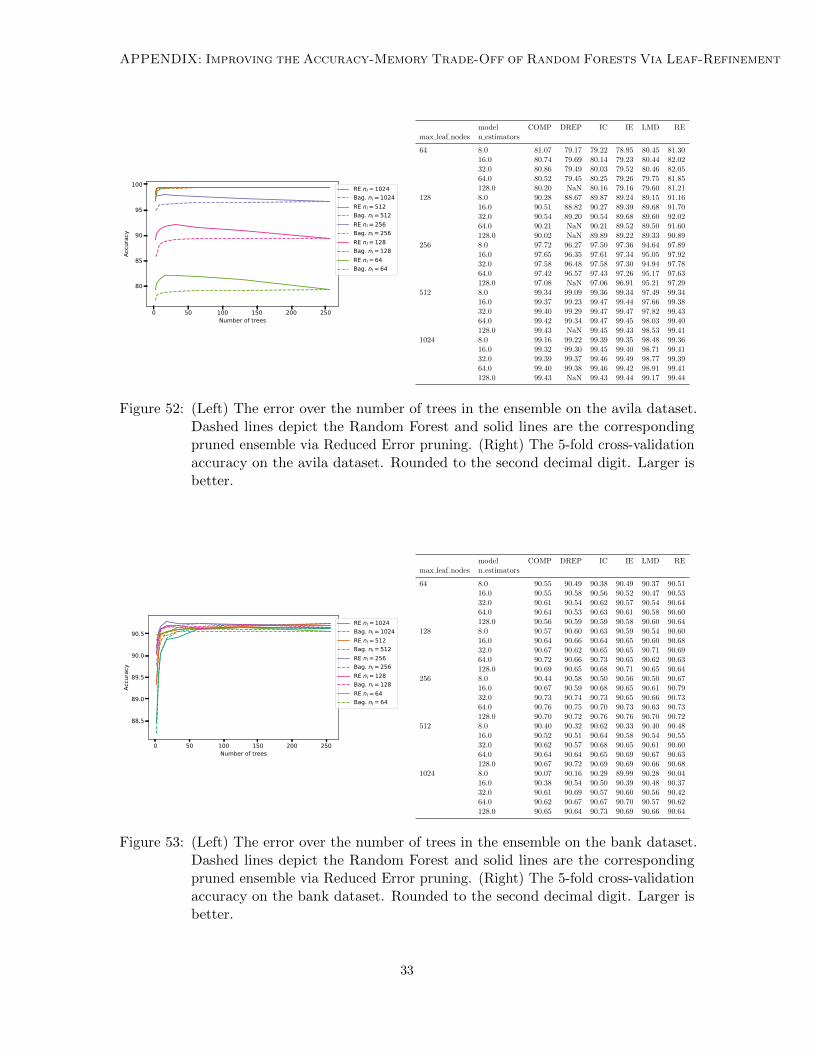
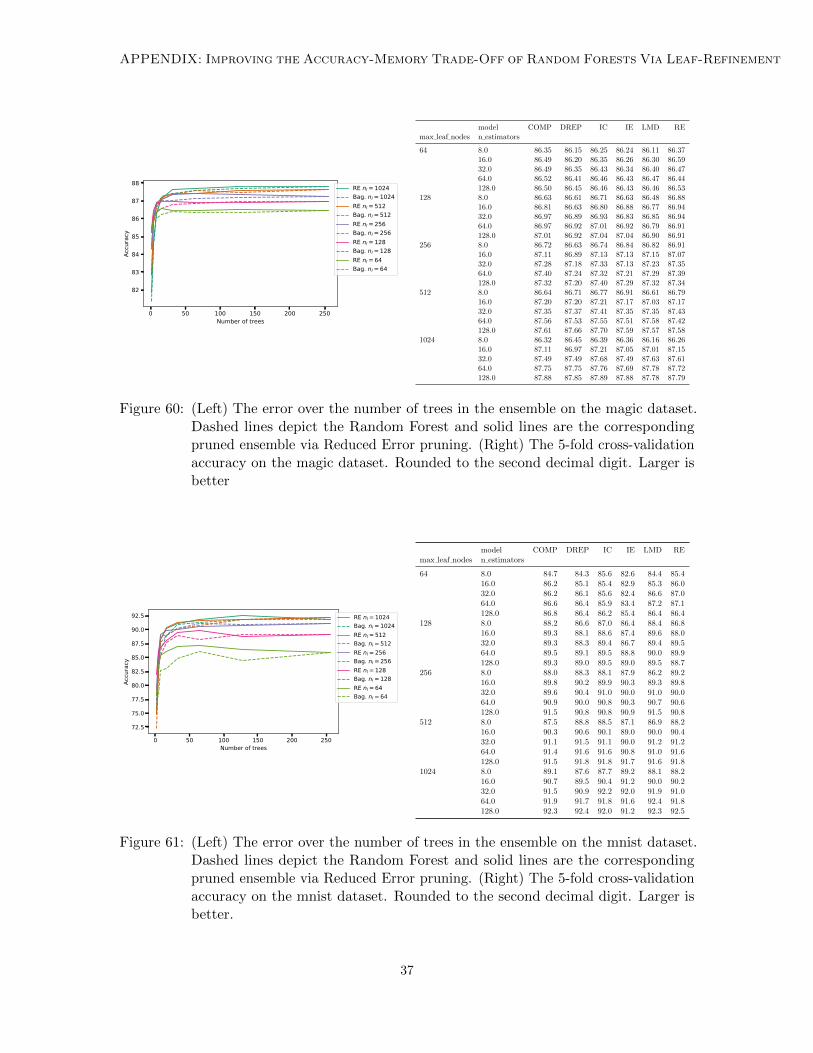
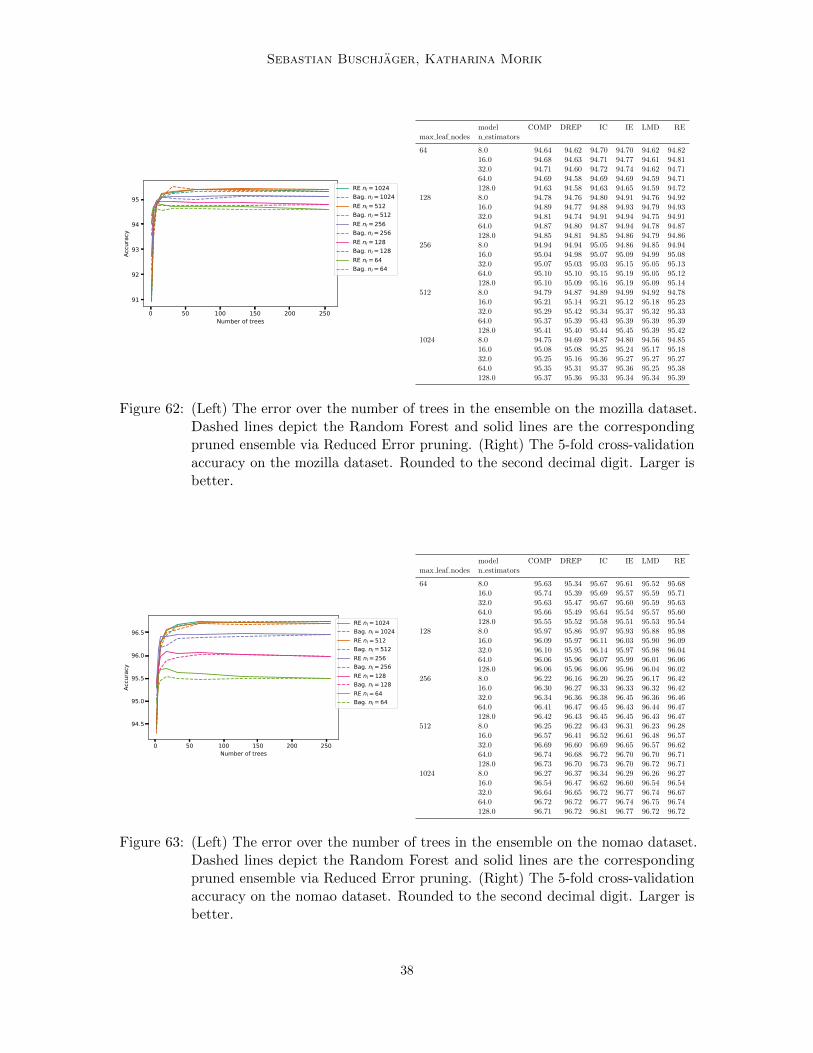
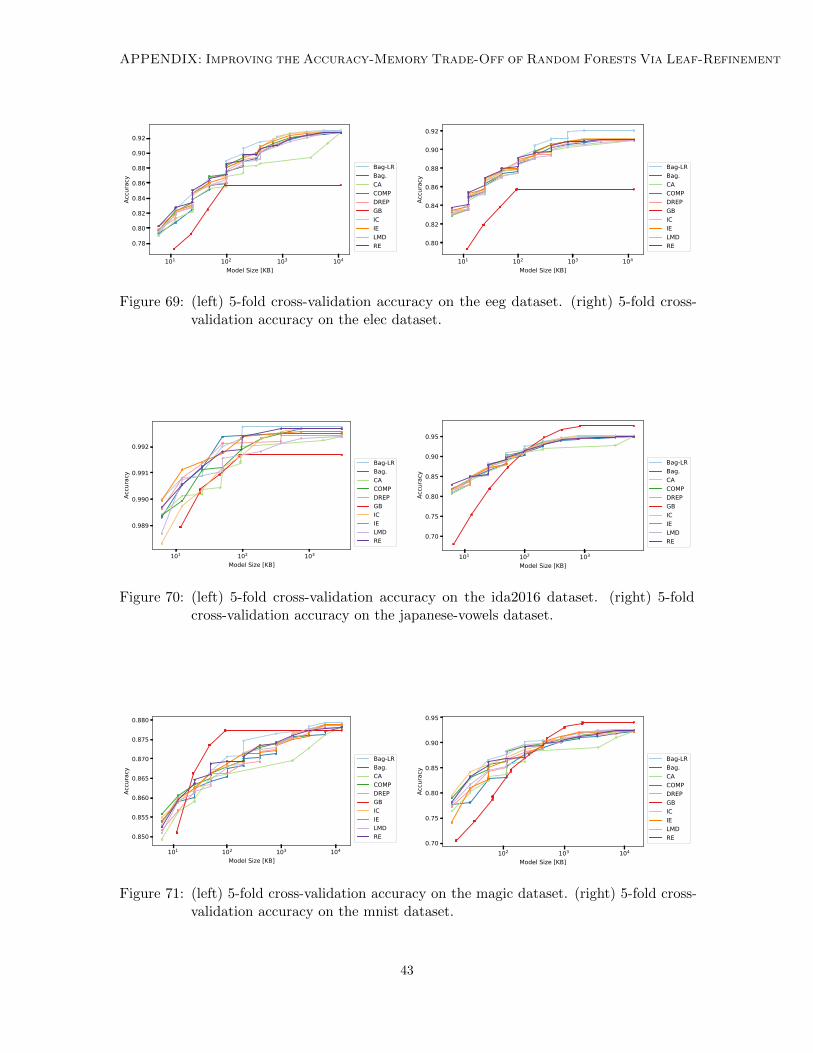
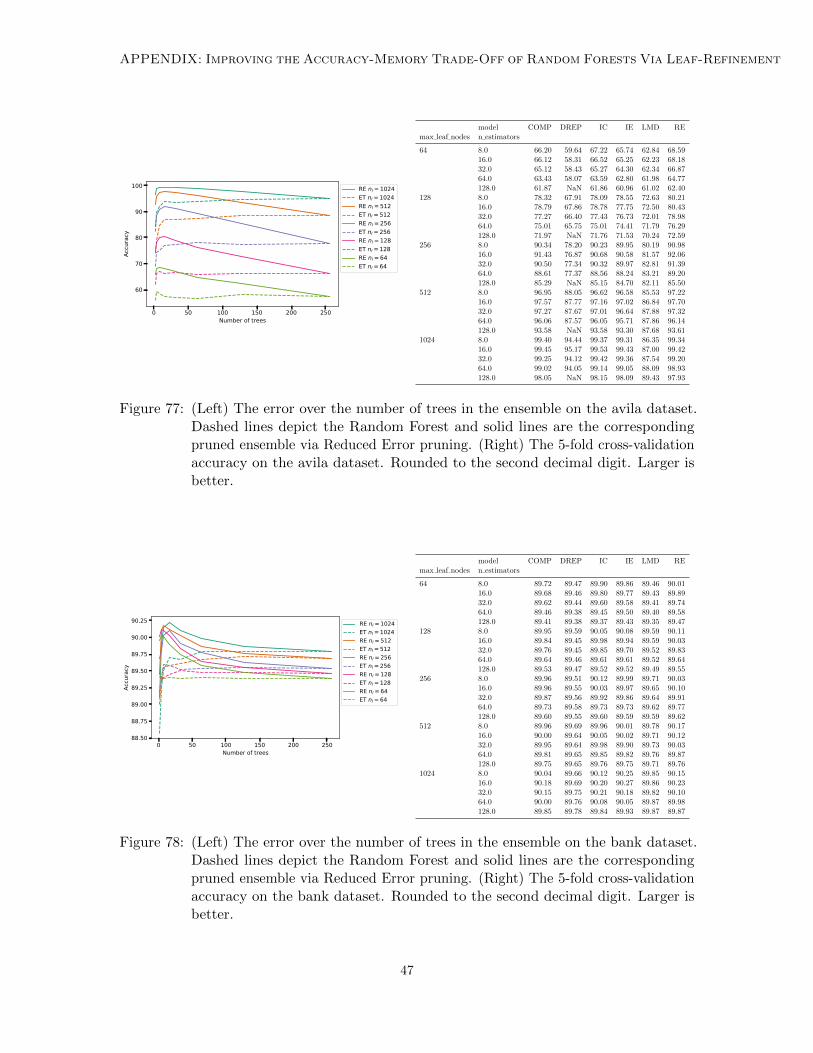
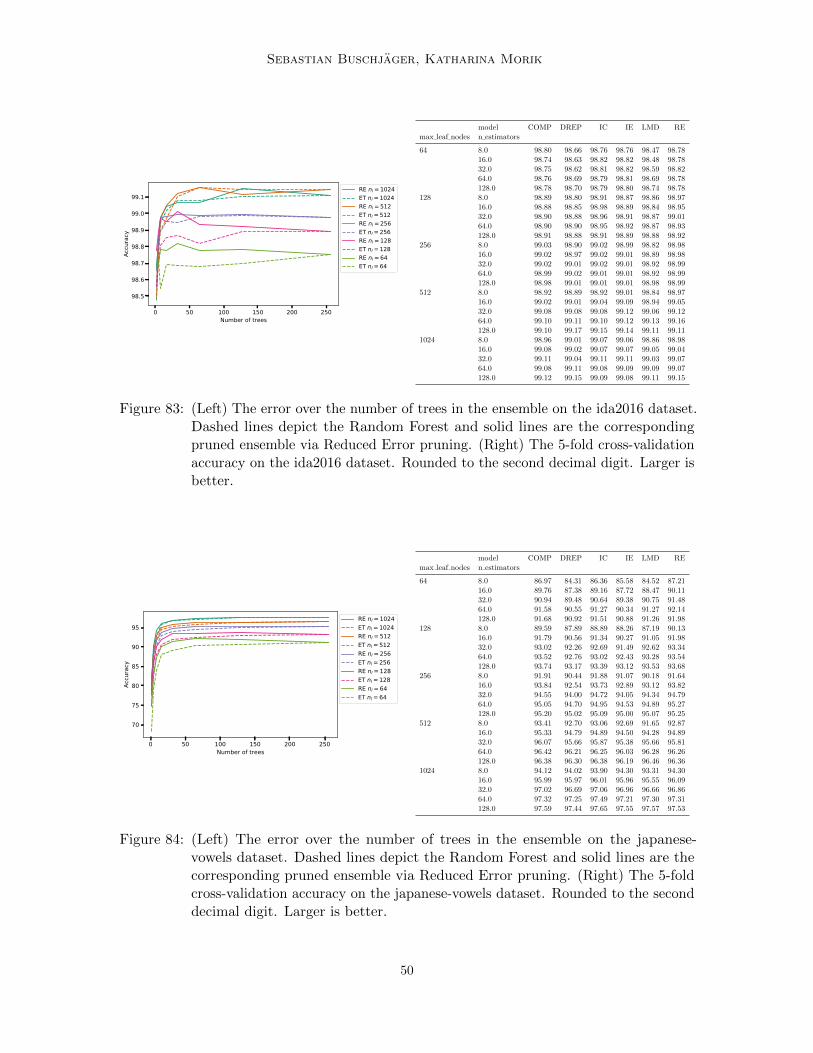
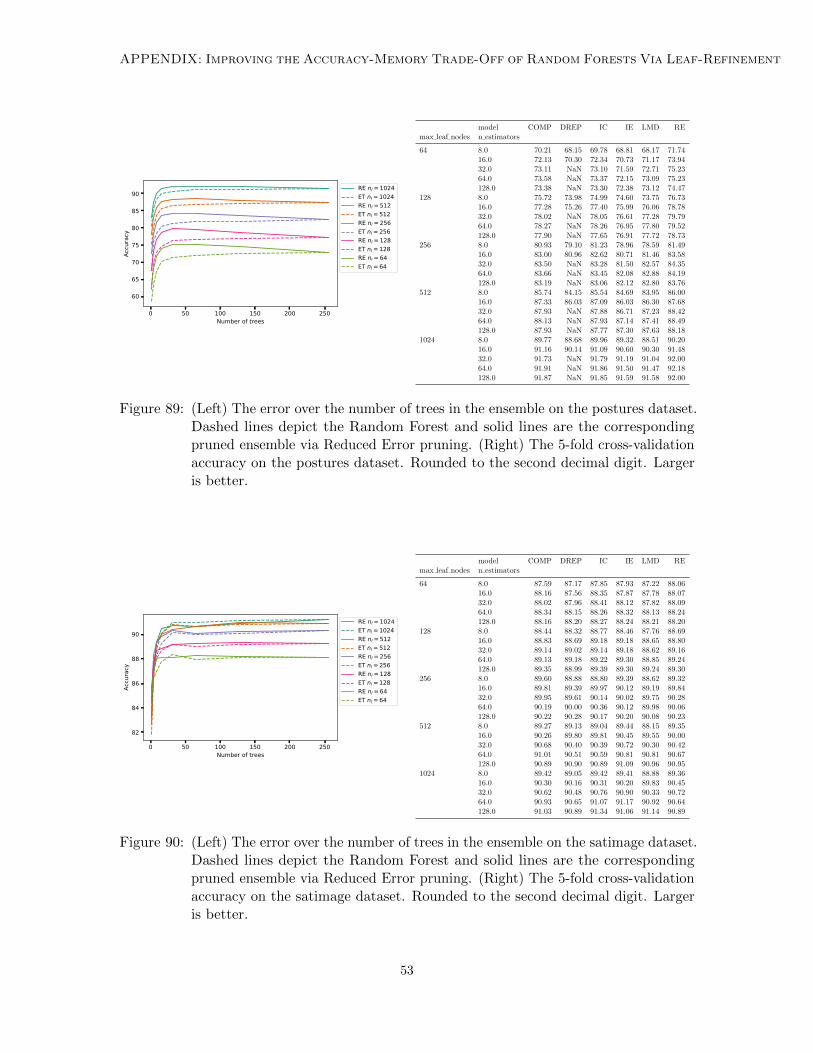
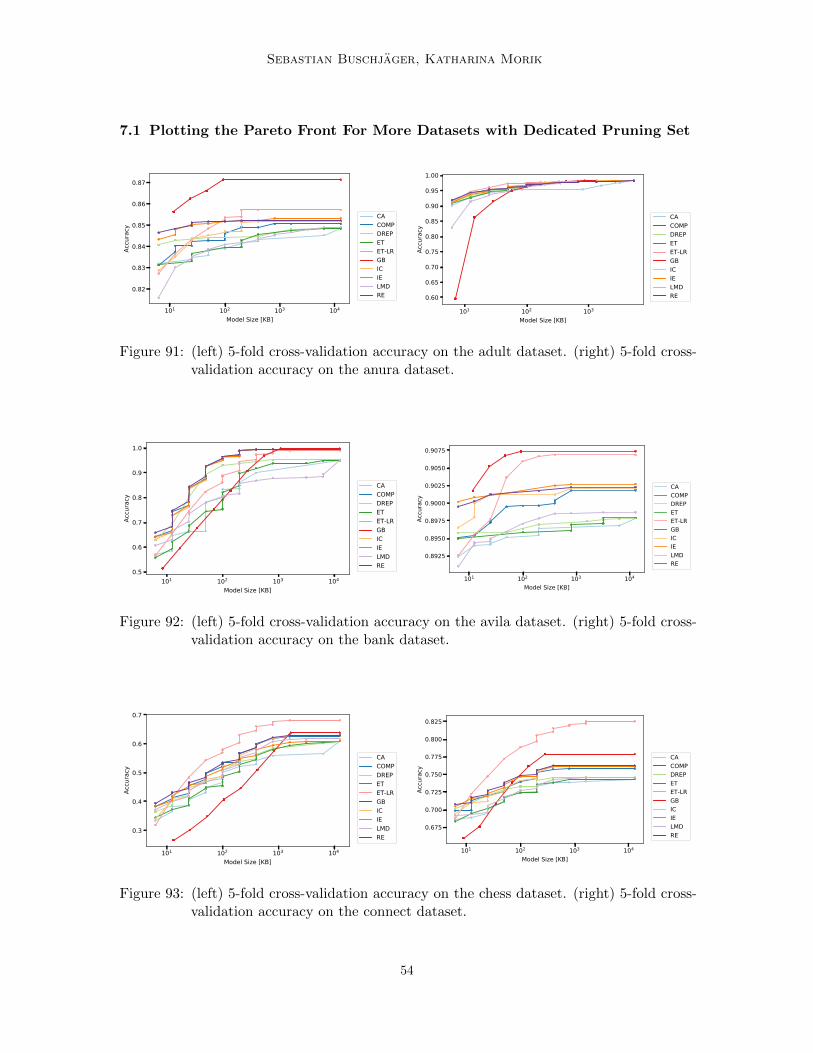
adult 0.8451 0.8501 0.8477 0.8474 0.8567 0.8705 0.8511 0.8527 0.8477 0.8517anura 0.9686 0.9789 0.9788 0.9786 0.9811 0.9794 0.9797 0.9793 0.9782 0.9787avila 0.9210 0.9929 0.9501 0.9408 0.9852 0.9909 0.9936 0.9926 0.8991 0.9926bank 0.8965 0.9013 0.8972 0.8972 0.9064 0.9065 0.9017 0.9022 0.8982 0.9018chess 0.5722 0.6232 0.5936 0.5990 0.6779 0.6265 0.6235 0.6044 0.6128 0.6267connect 0.7406 0.7573 0.7451 0.7426 0.8234 0.7777 0.7608 0.7600 0.7441 0.7617eeg 0.8759 0.9021 0.8985 0.8976 0.9228 0.8563 0.9042 0.9023 0.8964 0.9027elec 0.8229 0.8316 0.8298 0.8278 0.8577 0.8566 0.8340 0.8304 0.8276 0.8369ida2016 0.9897 0.9905 0.9906 0.9906 0.9911 0.9903 0.9906 0.9905 0.9904 0.9907japanese-vowels 0.9556 0.9717 0.9701 0.9704 0.9750 0.9743 0.9719 0.9704 0.9704 0.9711magic 0.8627 0.8693 0.8683 0.8668 0.8751 0.8765 0.8706 0.8692 0.8679 0.8688mnist 0.9235 0.9306 0.9311 0.9313 0.9385 0.9385 0.9334 0.9343 0.9296 0.9327mozilla 0.9361 0.9461 0.9428 0.9420 0.9471 0.9491 0.9476 0.9473 0.9404 0.9461nomao 0.9609 0.9645 0.9641 0.9638 0.9663 0.9632 0.9648 0.9644 0.9642 0.9647postures 0.8951 0.9152 0.9049 0.9085 0.9619 0.9104 0.9149 0.9117 0.9102 0.9179satimage 0.9012 0.9087 0.9071 0.9090 0.9093 0.9123 0.9102 0.9097 0.9079 0.9082

59


Recommended