Improving the Fiscal Health of Indian Cities: A Pilot Study of Pune Draft Report Submitted by the National Institute of Public Finance and Policy 18/2 Satsang Vihar Marg Special Institutional Area New Delhi 110 067. India. Ph: +91-11-2656 9303, 2656 9780, 2656 9784, 2656 3305, 2656 9286 Fax: +91-11-2685 2548 Kala S. Sridhar, NIPFP Simanti Bandyopadhyay, NIPFP November 2007
Transcript
Improving the Fiscal Health of Indian Cities: A Pilot Study of
Figure 5.1: Per Capita Fiscal Gaps and Related Variables (PMC and PCMC) ................ 64
Figure 5.2:Per Capita Fiscal Gaps and Related Variables (Cantonment Boards) ............. 65
6
ACKNOWLEDGEMENTS
This study is a part of the international program anchored by the University of Wisconsin
on fiscal health of cities in a number of countries. Thanks are due to World Bank Institute for
providing a part funding of the study. We also acknowledge our thanks to Infrastructure
Development Finance Company (IDFC) which also partly contributed to financing of the study under the IDFC Chair. We would like to acknowledge with thanks the advice and comments
received from Andrew Reschovsky of the University of Wisconsin and Howard Chernick of
Hunter College, City University of New York, at several stages of the study, beginning from questionnaire design to the analysis of results. Our special thanks are due to Anwar Shah of the
World Bank Institute, Washington DC, for his keen interest in the study. We would also like to
thank the reviewers of the proposal for their comments. Thanks are also due to Deepak Sanan of the Water and Sanitation Program (South Asia) for his support for this study.
We would also like to acknowledge with thanks the detailed field visits, work and
excellent efforts of the research team members, Satadru Sikdar, Purna Chandra Jena, and Anand Prakash Ekka, and the data entry assistance which Amita Manhas provided, without which it
would not have been possible to complete this report. We would like to thank the officials from
various departments for their help and co-operation during data collection and subsequent clarifications regarding the data. The names of these officials are given in a list at the end of this
section.
We would like to thank O.P.Mathur, Senior Consultant, NIPFP for his valuable
suggestions at different steps of the study.
We would like to thank Siva Chidambaram, Senior Librarian, NIPFP and the library personnel in NIPFP for their efforts to make different data sources and references available to the
team.
Finally, thanks are due to all the seminar participants for their comments, specifically
Mr.Nitin Khareer, the then Commissioner of Pune Municipal Corporation, at a workshop held to
discuss some preliminary findings, at NIPFP, in December 2006.
We would like to thank Nilesh Rajadhyaksha, Project associate, NIPFP for translating
some of the documents from local language (Marathi) to English.
Any errors remain with the authors.
List of Officials
Mr. Praveen Singh Pardeshi Commissioner
PMC
Mrs.Mary Kerketta
Additional Commissioner
PMC
Subash Dumbare
PCMC (Additional Commissioner)
7
Mr. G. S. Rajeshwaran CEO
Khadki Cantonment Board
Mr.Rajendra Pawaar CEO
Dehu Cantonment Board
Mr.S.K.Sardana
CEO
Pune Cantonment Board
Mr.Amaresh Galinde
Joint Commissioner (Finance)
PMC
Mr.Vivek Kharwadkar
City Engineer PMC
Mr.K.C.Karkar Octroi Department Head
PMC
Suraj Mandhare Deputy Commissioner. Land & Estate,
PMC.
Dr. R. R. Pardeshi
Deputy Medical Officers, Health & Slum Department,
PMC
Mr. Karamkar,
Joint Commissioner Urban and Community Development
PMC.
Mr. Surendar Karpe
Junior Engineer PMC
Ms. Kalaskar & Ms. Pendenekar
Department of Finance, PMC
Dr. D. R. Bhoslae
Director, Directorate of Economics & Statistics,
Government of Maharashtra
Neelkant Boman, PCMC (Nodal Officer)
8
Mr. N. N. Londe
H. O. D., Finance, PCMC
Mr. Gaikordae
Additional City Engineer, Water Supply & Sewerage. PCMC.
Mr. Saheb Rao Gaikorde, Asst. Commissioner Property Tax, PCMC.
Mr. Nagkumar Khunachgi Health Officer, PCMC
Mr. G.Gangle
H. O. D. Accounts, PCB
Mr. K. V. Sirodkar, Chief Engineer, PCB
Dr. Moolchand Sharma Vice-Chairman, University Grant Commission
9
CHAPTER 1: INTRODUCTION
The Pune Urban Agglomeration (UA) is a rapidly growing urban area in the western part
of India, located 220 kilometres southeast of Mumbai. The Pune UA comprises of five local
governments, two of which are municipal corporations, and the remaining are cantonment boards:
1. Pune Municipal Corporation (PMC) 2. Pimpri-Chinchwad Municipal Corporation (PCMC)
3. Kirkee Cantonment Board (KCB) 4. Pune Cantonment Board (PCB)
5. Dehu Road Cantonment Board (DCB)
The main city is administered by the Pune Municipal Corporation (PMC). According to
2001 census data, the central city (Pune Municipal Corporation) alone contains 67 percent of total
population among five urban local bodies (ULBs) and the second largest ULB is Pimpri
Chinchwad Municipal Corporation which contains 26 percent of the UA’s total population. In
fact, an Economic Times (ET) Places to Live and Work Survey in 2007 ranked Pune the best city
in the western region of the country, toppling Mumbai, Ahmedabad, Surat and Nagpur, because
of its booming job market and quality of life.1
Table 1.1 summarizes the growth rates of population during 1991-2001 for the local
bodies in the Pune UA. Clearly the PMC, representing the central city, is the largest local body,
accounting for over two-thirds of the UA’s population. It is also clear that while the central city
(Pune Municipal Corporation (PMC)), the Pimpri Chinchwad Municipal Corporation (PCMC)
and Dehu Cantonment Boards steadily gained population over the past two decades, the Pune and
Khadki Cantonment Boards steadily lost population over this time period. PCMC’s gain in
population as a new town is to be expected as the older central city got congested, with the result
that it is emerging as a second new centre.
We examined a variety of socio-demographic indicators such as the population,
households, literacy rate, and workforce participation rate, for 1991 and 2001, with and without
the central city, the PMC, given that it is the largest, and these characteristics for the UA might be
influenced to a considerable extent by the PMC. Table 1.2 summarizes these data for the Pune
1 The ET Survey, conducted jointly with Indicus Analytics, was done by categorizing cities of the western
region based on their demographics and economic parameters, and is derived from Indicus Analytics’
annual city survey City Skyline of India 2006-07. This survey ranks cities on three basic parameters –
index to earn in, the index to invest in, and the third is the index to reside in. The lower the index, the better
the city is.
10
UA without and with the PMC for 2001. For 1991 there are no significant differences hence we
do not report them.
Table 1.1: Total Population, Pune UA, All Local Bodies, 1991 and 2001
Commercial and Industrial (B) 32532 42864 48044 57649 68179
Ratio (A:B) 8.09 7.69 7.69 7.51 7.33
`Assessment of property tax is done by ratable value method. From Financial Year 2005
– 06 the Tax rates are revised. Pune Municipal Limit is divided into 5 zones such as ‘A’, ‘B’,
‘C’, ‘D’ and ‘E’. According to the zones and the type of property (Residential, Non-
Residential, Open Plots – Developed, Undeveloped and Parking Area), assessment rates are
4Mharashtra is one of the very few states in India which still imposes octroi on goods produced in their
jurisdiction. The goods manufactured in PMC and going out of its territory are charged lump sum amounts
according to their sale values whereas goods entering into the market of PMC for sale are charged at specified rates varying mostly between 1-3% of their transacted values, the minimum rate being 0.5 % and
the maximum 6%. In case the goods entering into the jurisdiction are not sold, 10% of the potential
transacted value goes to the municipality funds. Though octroi is the major source of revenue for
municipalities imposing it, because of its distortionary impact it is a nationwide policy to abolish octroi at
the earliest for any municipality which imposes it.
19
decided and implemented from 1st April 2005. Box 2.1 gives the details of the method for
ratable value calculation and the revised rates for PMC.
Box 2.1: Details of Property Tax Calculation in PMC
Though the municipality is coming up with new ideas and implementing them to
increase property tax collection, it has remained below the property tax demand in the recent
past. Table 2.2 below gives an idea about the collection efficiency of PMC in terms of
Ratable Value Calculation
Residential:
Carpet area*market rate*12=Annual Rent
If self occupied, 40% of the annual rent is deducted from total annual rent which amounts to 60% of Annual Rent. 15% of annual rent is exempted for maintenance allowance.45% of annual
rent is the Ratable Value for self owned residential properties.
If rented out, 85% of the annual rent is treated as ratable value.
Non-Residential:
85% of annual rent is treated as ratable value
Open plots
Annual Rent=Total area*market rate*12 = Ratable Value
Details of Tax Rates
1. General Tax (Same for residential, non-residential, open space):
Slab (Rs) Rate (% of RV)
1000-2000 14%
2001-5000 21%
5001-20000 30%
20001 and above 38%
2. Conservancy; 13% of RV
3. Water Benefit Tax: 2%of RV
4. Sewerage Benefit Tax: 4% of RV 5. Fire and Tree Cess: 1.75%of RV
6. Street Tax:5% of RV\
7. Water Tax (non-metered residential properties):
Slab(Rs) Rate
0-1000 Rs 900 per year
1001-3000 Rs. 1000 per year
3001-5000 Rs. 1100 per year
5001 and above 25% of RV or Rs. 2500 whichever is less
8. Special Conservancy Tax - Hospitals, Restaurants, Marriage Halls
Applicable for properties above Rs 10,000 RV at the rate of 10% of RV
20
property tax collection. It is found that it has remained stable around 34% over the last three
years. This ratio is quite low compared to both the overall existing level for India which is
60% and targeted level to achieve 90% collection efficiency in property taxes.
Table 2.2: Collection Efficiency in Property Tax in PMC
The following initiatives taken to improve collection efficiency in property taxes are
worth mentioning:
1. Citizen Facilitation Center (CFC) : CFC is furnished with ward wise online
Tax collection facility.
2. Banks: COSMOS Bank and Bank Of Maharashtra provide facility to property
owner to pay tax by simply issuing cheque or Cash in favour of PMC.
3. Kiosks: Kiosk is most convenient method for collection of Property Tax.
Kiosks are placed in every Kothi and public places so as property owner can
pay property tax by mode of cash or cheque without visiting Ward Offices.
A scrutiny of a time series data on revenues of PMC from the municipal budgets throws
some light on the behavior of different components of total revenue over years 99-00 to 05-06.
We find similar trend in the revenue components in both absolute and per capita terms. All the
components of tax revenue i.e. property tax, octroi and other tax and also grants component show
moderate fluctuations over the years with an increasing trend whereas the non-tax component
shows a steep rise from 04-05 to 05-06. It is interesting to note that the revenue from rent and sale
proceeds from land and sale of tender for roads, show phenomenal increases both in absolute and
relative terms in this period. We find that the earnings from rent increased from Rs. 71. 25 lakhs
in 04-05 to 2.28 crores in 05-06 showing an increase of 219%; earnings from sale proceeds of
land increase from Rs. 23.75 lakhs to Rs 58 lakhs showing an increase of 145%; earnings from
Year Property Tax (Rs Crores)
2003-04
Demand 167.28
Collection 57.47
Collection efficiency 34.35%
2004-05
Demand 185.42
Collection 63.92
Collection efficiency 34.47%
2005-06
Demand 261.78
Collection 89.00
Collection efficiency 34%
21
sale of tender on roads increased from Rs 1.5 lakhs to Rs. 2.3 lakhs recording an increase of 50%
over the period. This is an outcome of the city’s restructuring to accommodate the growing needs
of the high income class emerging due to development of software and IT industries in the city.
The utilization of the city’s land resources in terms of leases to industries, building shopping
malls and multiplexes in the recent years have inflated the revenues to the ULB. A growing
demand for roads for better communication in the city has compelled the government to float new
tenders for road construction. Other components of non tax revenues like fees collected from
educational institutions, slum rehabilitation charges, revenues collected from issue of medical
licenses, medicine sale proceeds, and laboratory fees show moderate increases. These are mostly
caused by increased economic activities due to rise in population.
Figure 2.3: Components of Per Capita Revenue (in Constant 1999-00 Prices) With
Octroi
It is because of the non-tax component that the total revenue both in absolute and per
capita terms shows a steep rise in the said period. The average (over the time period mentioned
above) total revenue per capita of Rs. 2054 has Rs 198 as per capita property tax, Rs 883 as
octroi, Rs. 64 as other tax, Rs 787 as non tax revenue and Rs. 121 as grants. It is interesting to
note that per capita property tax has remained almost stable over the time period of our
consideration, while in absolute terms property tax collection recorded a fall only in 03-04 after
which the reforms in the property tax system started in the city. Among the tax components octroi
has the highest value followed by non tax revenues, both higher than the property tax component.
Per capita own Source Per capita grants + share Rev Per capita total Revenue
22
If we take the total revenues without octoi there is a decrease by Rs. 787 per capita which is quite
large. Figure 2.3 gives the year wise details of the components of per capita revenues for PMC.
A close look at the average proportions of different components of total revenue over the
time period reveals that octroi has a major share of 43% followed by non tax revenues which is
38%, property tax 10%, other tax 3% and grants 6%. If we examine the proportions of different
components of total revenue for the most recent year that is 2005-06, we find that non tax
component in the total revenue accounts for the highest share of 45% followed by octroi which
accounts for 41%. Property tax accounts for only 8% whereas grants accounts for 5% and other
taxes accounts for 1%. Figure 2.4 gives the details of this break-up.
Figure 2.4: Composition of Total Revenue without Octroi (2005-06)
.
If we consider a scenario where there is no octroi we find that share of property taxes goes up to
14%, grants to 9%, other tax to 2% and non-tax revenues to 75%. Figure 2.5 gives the details of
this break-up.
grants + share Rev 9%
Other Tax 2%
Property Tax 14%
Non-tax 75%
23
Figure 2.5: Composition of Total Revenue with Octroi (2005-06)
One thing which emerges clearly after analyzing the revenue is that PMC needs to tap its
resources through property taxes by increasing the collection efficiency and a thoroughly
reformed property tax system with a view to abolishing octroi in near future. Over the most recent
years 04-05 and 05-06, we find octroi has increased by 31% whereas property tax has increased
by 28 %. Overdependence on octroi as a ready source of finances has resulted in half hearted
efforts in terms of utilizing the city’s property tax potential.
The dominance of non tax component in the revenue share is visible both in absolute and
relative terms. This is a clear indication of a tremendous rise in economic activities in the city, be
it individual, commercial or industrial. In the coming years this is likely to create more properties
which would add to the property tax potential of the city. It was not possible to check from the
available data whether the property tax base covers the entire set of taxable properties. It is
important to identify the correct base and bring all taxable properties under the tax net.
The market rate applied for property tax calculation should reflect the true values of
properties without which undervaluation would lead to loss of revenues. The change in the
Property Tax 8%
grants + share Rev 5%
Non-tax 45%
Other Tax 1%
Octroi 41%
24
market rate with rise in demand for properties should be taken into account. Also, the city can
multiply its gains only if the collection efficiency can be improved to tap the property tax
potential to its fullest extent.
For PMC it seems finances are not the constraining factor for the city’s development. In
the coming years even with the abolition of octroi, the compensatory transfers from the upper
tiers of the government can prove to be sufficient only if the city is in a position to operate at
higher administrative efficiency. Recent evidence shows that big industries are closing down
because of heavy levy of octroi. Abolition of octroi would lead to sustained industrial growth in
the city which would ensure continuous increase in revenues in the long run at the cost of short
run losses in revenues. But the success of the city depends on how efficiently it can reform the
existing property tax system.
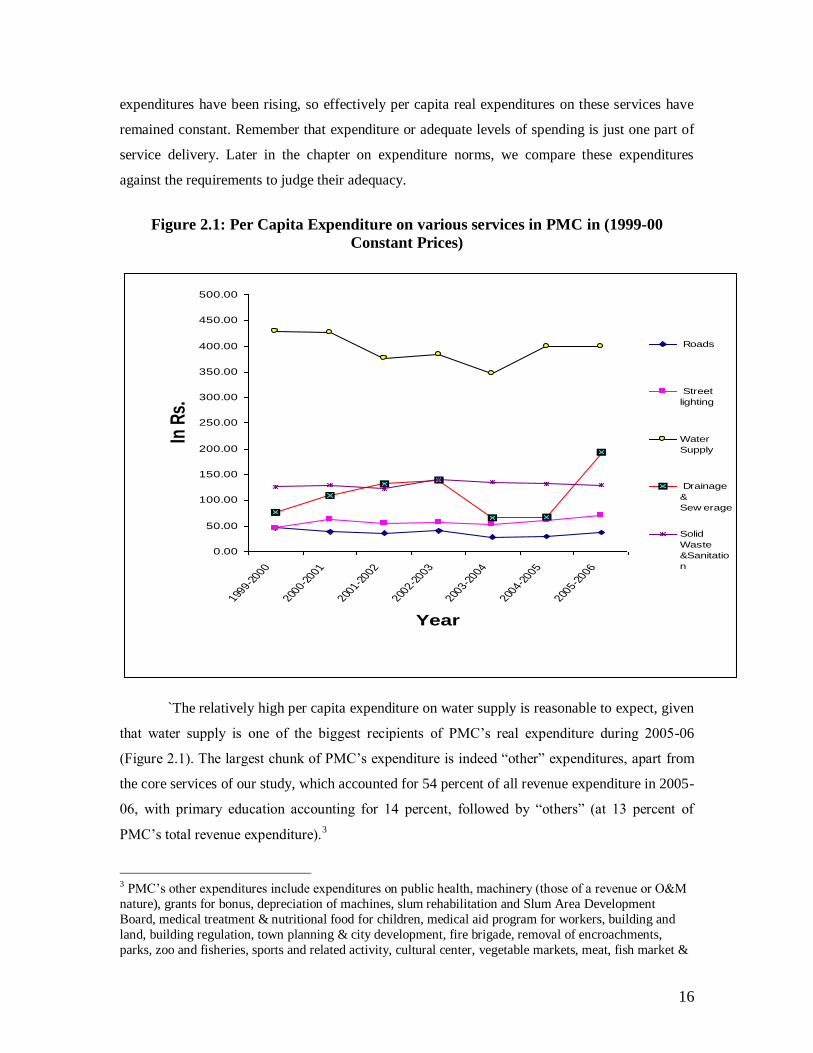
Physical Level of Services
The following sections describe the physical levels of services in the PMC for water
supply, sewerage, solid waste, roads and street lights.
Water Supply
As described earlier, the development and operations of water supply is done by the
PMC. This section presents a brief overview of current water supply schemes in Pune, their
source and treatment capacities, and distribution network. The level of services and key issues
with regard to water supply operations are also discussed.
Sources and Distribution System:
There are 39 storage reservoirs in the city, fed by two principal water supply sources --
Mulla and Mutha rivers. Of these, 11 reservoirs (sumps) with a storage capacity of 42.96 million
litres (ML), function as balancing storages. The other 28 reservoirs, with a storage capacity of
177.96 ML, act as service reservoirs. The Swar gate Water Works came into existence in 1873.
Water from Mutha’s right bank canal was picked up at Swar gate, treated and supplied to the city.
After Pune reached the status of Municipal Corporation in year 1950, a project of 45 million litres
daily (MLD) was developed on the Mutha’s right bank canal again, for supply to the city and the
cantonment. Another scheme, with 110 MLD capacities in 1975, was constructed at Parvati in
1968. It was augmented to 270 MLD capacities and further expanded to its present capacity of
470 MLD in two more stages in 1980 and 1990. The capacity of the Pune cantonment water
works, which was earlier governed by Maharashtra Jeevan Pradhikaran, and later handed over
to PMC, was augmented from 173 MLD to 273 MLD.
25
Distribution Network:
The distribution network consists of pipelines varying from the smallest size diameter of
80 mm to the largest diameter of 1,600 mm. The total length of the network is 647.18 kilometres.
This apparently does not include all the tertiary pipelines. The total length of distribution is
indicated to be about 2,474 kilometres including 24 kilometres of transmission lines. The total
length of the roads in the city is 1,750 kilometres. This implies that some roads may have more
than one pipeline, laid at different points of time to meet the demand.
Table 2.3: Supply Statistics, Water Supply, PMC
Details Unit Service Level Indicator
Source availability 800 MLD 260 LPCD
Treatment capacity 797 MLD 100%
Storage Reservoirs (OHT) 180 MLD (27 in number) 22.40%
Storage Reservoirs (GLSR)
41 MLD (12 in
number) 5.20%
Total Storage Capacity 221 MLD 27.60%
Distribution network 2450 km 136% of roads covered (about 70% of developed area)
Individual House Service Connections - Numbers
Metered Residential 61,559 66%
Non-metered Residential 12,044 13%
Commercial 19,275 21%
Total Connections 92,878
Source: PMC and Pune CDP.
Table 2.3 summarizes some supply statistics for water supply in PMC. The number of
house connections (73,603 (61,559+12,044, Table 2.3) is low, compared to the total number of
housing units (555,771, see Chapter 1), accounting for only about 13 percent. Even if allowance
were to be made to exclude low income households and slums, one would agree that this is quite
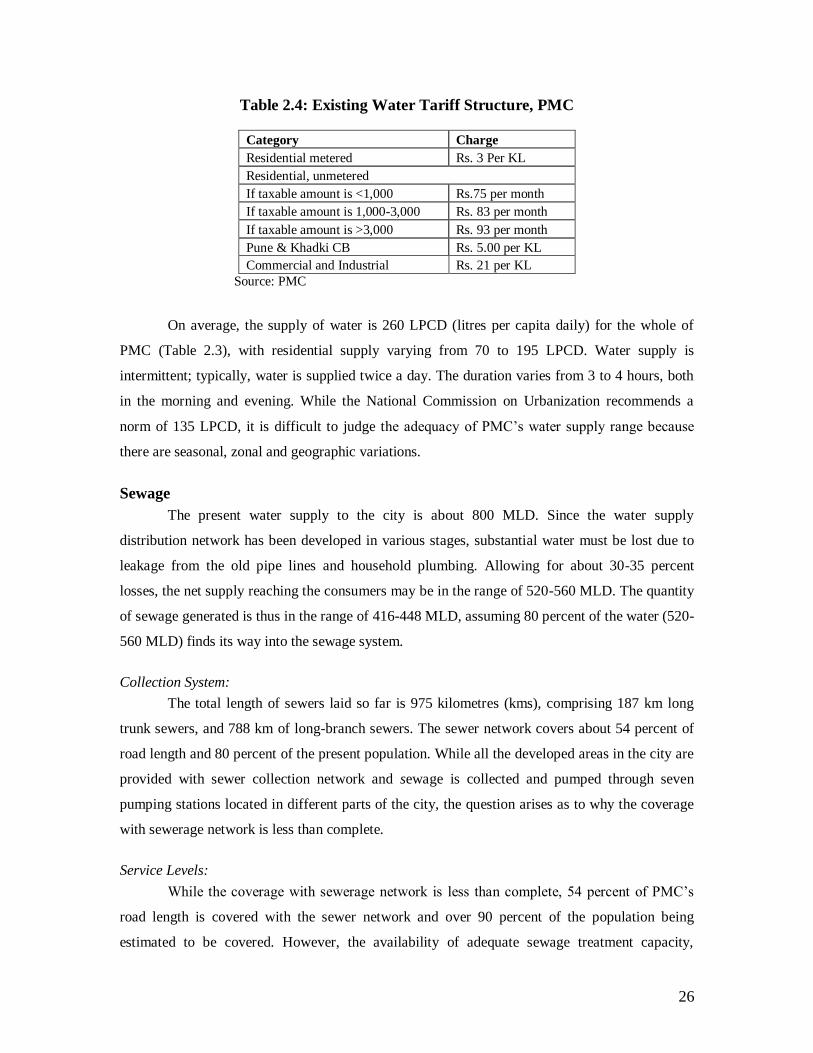
low.5 Table 2.4 summarizes the water tariff structure for PMC’s residential and non-residential
connections, and the selling rate for the Khadki and Pune Cantonment Boards, given the KCB
and PCB buy water in bulk from the PMC. It is clear that in the PMC, there is no incentive to
control the use of water, especially so in the case of unmetered connections.
5 A case study by the Water and Sanitation Program, South Asia (2000) speaks of the cancellation of the
$185 million Pune water supply and sewerage project. There are several reasons the case study cites were
responsible for cancellation of the project, after great initial interest and enthusiasm. First, institutional
structures were partly responsible, for when the Commissioner was transferred, the project was left without a local champion. Further, the estimated costs of the project were perceived by the local administration to
be high, and were designed to ensure a high rate of return to the private operator at the expense of the
consumer. Further, local contractors were averse to the idea of international firms being awarded the
contract. The cancellation of this project thus highlighted how the lack of a well-informed public debate
resulted in the cancellation of what may have been a model for other projects in the country.
26
Table 2.4: Existing Water Tariff Structure, PMC
Category Charge
Residential metered Rs. 3 Per KL
Residential, unmetered
If taxable amount is <1,000 Rs.75 per month
If taxable amount is 1,000-3,000 Rs. 83 per month
If taxable amount is >3,000 Rs. 93 per month
Pune & Khadki CB Rs. 5.00 per KL
Commercial and Industrial Rs. 21 per KL
Source: PMC
On average, the supply of water is 260 LPCD (litres per capita daily) for the whole of
PMC (Table 2.3), with residential supply varying from 70 to 195 LPCD. Water supply is
intermittent; typically, water is supplied twice a day. The duration varies from 3 to 4 hours, both
in the morning and evening. While the National Commission on Urbanization recommends a
norm of 135 LPCD, it is difficult to judge the adequacy of PMC’s water supply range because
there are seasonal, zonal and geographic variations.
Sewage
The present water supply to the city is about 800 MLD. Since the water supply
distribution network has been developed in various stages, substantial water must be lost due to
leakage from the old pipe lines and household plumbing. Allowing for about 30-35 percent
losses, the net supply reaching the consumers may be in the range of 520-560 MLD. The quantity
of sewage generated is thus in the range of 416-448 MLD, assuming 80 percent of the water (520-
560 MLD) finds its way into the sewage system.
Collection System:
The total length of sewers laid so far is 975 kilometres (kms), comprising 187 km long
trunk sewers, and 788 km of long-branch sewers. The sewer network covers about 54 percent of
road length and 80 percent of the present population. While all the developed areas in the city are
provided with sewer collection network and sewage is collected and pumped through seven
pumping stations located in different parts of the city, the question arises as to why the coverage
with sewerage network is less than complete.
Service Levels:
While the coverage with sewerage network is less than complete, 54 percent of PMC’s
road length is covered with the sewer network and over 90 percent of the population being
estimated to be covered. However, the availability of adequate sewage treatment capacity,
27
currently at 68 percent of sewerage generated, assuming losses of 30 per cent during distribution,
is a concern. In case PMC manages to reduce the distribution losses to 15 per cent as envisaged,
the gap in treatment plant at current service levels will be about 143 MLD. Tables 2.5 and 2.6
summarize some service level indicators for PMC’s sewerage system.
30% distribution losses (800-30% of 800(240)=560) and 20% of
net supply loss during consumption (560-20% of 560
(112)=448)
Current treatment capacity 305 MLD 68% of sewerage generated
Sewer network length 975 km. 54% of road length
Gap in treatment capacity
If losses continue to be at 30%
255 MLD
(560-305)
If water distribution losses are
reduced to 15 %
143 MLD
(448-305)
Source: PMC and Pune CDP
Table 2.6: Service Level Indicators, Sewerage, PMC
Year Total length
of drains/
undergroun
d drains
Total
length of
high/big
drains
Total
length of
storm
water
drains
% of area
covered
under
sewerage
network
% of pop. covered by
drainage and storm
water drainage system
2005 1,727 km 380km 60km 95 95
Source: PMC
Proposed Projects:
In order to ensure sewerage treatment and increase the coverage network, the Pune
Municipal Corporation has proposed certain projects. It plans to augment the Naidu sewerage
treatment plant (STP) by 115 MLD. Also, it proposes to set up four new STPs at Vithalwadi (32
MLD), Mundhwa (45 MLD), Baner (30 MLD) and Kharadi (40 MLD). Thus the proposal will
enhance the sewerage treatment capacity by 262 MLD. This will not only enable the treatment of
all the sewerage being generated currently but will also cater to the increasing demand for
sewerage treatment along with increased water supply in the future. Besides, the PMC also plans
to set up two pumping stations at Topkhana and New Kasba and two rising mains, one from
28
Topkhana to Naidu and the other from New Kasba to Naidu. This proposal will also eliminate the
flow of sewerage into the river and will improve the overall environment.
Solid Waste
Consumption, linked to per capita income, has a strong relationship with waste
generation. Waste is unwanted material left over from the manufacturing process and refuse from
places of human and animal habitation. As per capita income rises, more savings are spent on
goods and services, especially when the transition is from a low income to a middle income level.
Urbanization not only concentrates waste, but also raises generation rates since rural consumers
consume less than urban ones. Some estimates are that India will probably see a rise in waste
generation from less than 40,000 metric tones per year at present, to over 125,000 metric tones by
the year 2030 (Economic Times, 2007).
Table 2.7: Source-wise Quantity of Solid Waste Generated, PMC
Source Category
Quantity of waste generated
per day-tons
%
Composition
Domestic (Households) 400 40
Commercial 250 25
Market areas 50 5
Hotels and restaurants 250 25
Vegetable waste (from 19 markets) 50 5
Total 1000 100
Source: PMC
Note: Bio-medical and hazardous wastes are not included.
Solid waste comprises unwanted and discarded materials of about 1,000-1,200 tones
(approximate generation per capita per day is 360 grams) in the PMC, each with 50 percent dry
and wet waste generation. PMC is responsible for collection, transportation and disposal of all
solid waste generated in the city, except untreated bio-medical waste, which is assigned to a
private operator appointed by the PMC on pay and use basis by the respective hospital. Currently,
PMC has strategic plans for safe disposal of municipal solid waste and has the necessary
infrastructure for collection, storage, segregation, transportation processing and disposal. The
health department of the PMC is vested with the responsibility of day-to-day solid waste
collection and disposal. The PMC organizes the collection and transportation through a team of
its own conservancy workers and a fleet of vehicles and dumper-placers. The waste is also
collected with the help of rag pickers by carrying out door-to-door collection in certain areas;
these rag-pickers are not the employees of PMC, but they make their livelihood by salvaging
29
recyclable waste from collection points and dump yards and they are also paid Rs.10 per month
by each household.
Table 2.7 summarizes the quantity of solid waste generated in the PMC, by source. The
greatest generators of waste are households, followed by commercial establishments and
hotels/restaurants. Figure 2.6 presents the constituents of municipal solid waste. Consistent with
Table 2.7 which shows that households are the largest generators of garbage, Figure 2.6 confirms
that a majority of municipal solid waste is fermentable matter.
Figure 2.6: Constituents of Municipal Solid Waste
ate % Total %
65%8%
7%
4%
6%
10% Fermentable
Matter
Paper
Plastic, Rubber,
Leather and
Synthetic
Metal
Glass
Inert material
Literate
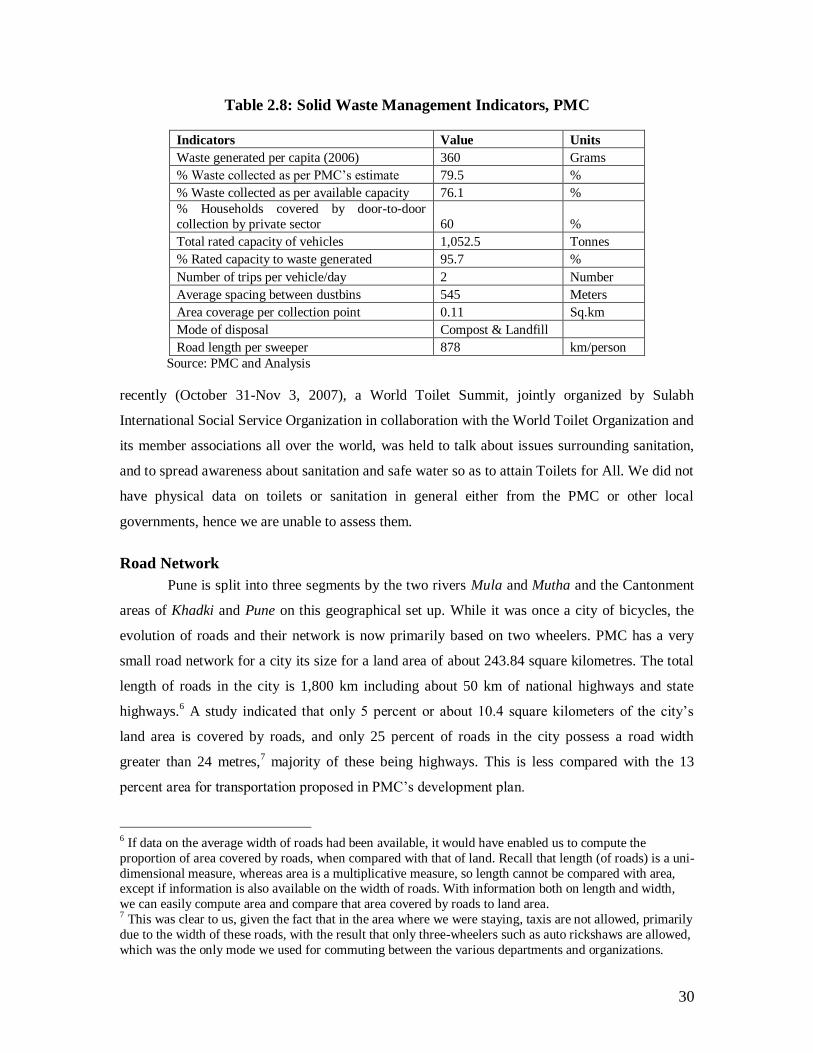
Table 2.8 summarizes some indicators for solid waste management in PMC. It
demonstrates that the solid waste collection efficiency is less than complete (that is, less than 100
percent), required of all class I cities. It does appear that either the number of workers has to
increase in order to ensure greater area coverage, or the average spacing between dustbins has to
be decreased, to ensure greater collection efficiencies. Given both these options have financial
implications; if their management were to be outsourced, it is less likely to be financially
burdensome for the PMC.
Over 2.6 billion people, representing 40 percent of the world’s population do not have
access to toilets. While 63 percent of the country’s households do not have access to a toilet, in
urban areas, 26 percent of the population does not have access to a toilet. In fact, in New Delhi
30
Table 2.8: Solid Waste Management Indicators, PMC
Indicators Value Units
Waste generated per capita (2006) 360 Grams
% Waste collected as per PMC’s estimate 79.5 %
% Waste collected as per available capacity 76.1 %
% Households covered by door-to-door
collection by private sector 60 %
Total rated capacity of vehicles 1,052.5 Tonnes
% Rated capacity to waste generated 95.7 %
Number of trips per vehicle/day 2 Number
Average spacing between dustbins 545 Meters
Area coverage per collection point 0.11 Sq.km
Mode of disposal Compost & Landfill
Road length per sweeper 878 km/person
Source: PMC and Analysis
recently (October 31-Nov 3, 2007), a World Toilet Summit, jointly organized by Sulabh
International Social Service Organization in collaboration with the World Toilet Organization and
its member associations all over the world, was held to talk about issues surrounding sanitation,
and to spread awareness about sanitation and safe water so as to attain Toilets for All. We did not
have physical data on toilets or sanitation in general either from the PMC or other local
governments, hence we are unable to assess them.
Road Network
Pune is split into three segments by the two rivers Mula and Mutha and the Cantonment
areas of Khadki and Pune on this geographical set up. While it was once a city of bicycles, the
evolution of roads and their network is now primarily based on two wheelers. PMC has a very
small road network for a city its size for a land area of about 243.84 square kilometres. The total
length of roads in the city is 1,800 km including about 50 km of national highways and state
highways.6 A study indicated that only 5 percent or about 10.4 square kilometers of the city’s
land area is covered by roads, and only 25 percent of roads in the city possess a road width
greater than 24 metres,7 majority of these being highways. This is less compared with the 13
percent area for transportation proposed in PMC’s development plan.
6 If data on the average width of roads had been available, it would have enabled us to compute the
proportion of area covered by roads, when compared with that of land. Recall that length (of roads) is a uni-
dimensional measure, whereas area is a multiplicative measure, so length cannot be compared with area, except if information is also available on the width of roads. With information both on length and width,
we can easily compute area and compare that area covered by roads to land area. 7 This was clear to us, given the fact that in the area where we were staying, taxis are not allowed, primarily
due to the width of these roads, with the result that only three-wheelers such as auto rickshaws are allowed,
which was the only mode we used for commuting between the various departments and organizations.
31
Table 2.9: Municipal Road Length, PMC
Surface Type Length (in kms)
Percentage of Municipal
Road Length
Municipal Roads
Concrete 32 2
Black-topped 1202 69
WBM (Water Bound Macadam) 258 15
Gravel and Earthen 258 15
Total Road Length 1750 100
Other Agencies’ Roads(NH/SH/PWD Roads) 50
Grand Total 1,800*
* This does not include the extent of kaccha roads in the newly added villages. Source: PMC and Pune CDP
While only a meager 2 percent of municipal roads is made of concrete (which is the most
superior form of road surface), more than two-thirds are black-topped. It is surprising that even in
a million-plus city such as the PMC, about 15 percent of municipal roads are gravel or earthen
(Table 2.9).
Slums
As per the secondary information collected from PMC, there are 564 slums in Pune, of
which 353 are declared and 211 are undeclared slums. With growing economic activity, the slum
population has been increasing at a tremendous rate. Table 2.10 indicates that the growth of the
slum population was higher than that of the total population every decade. During 1961-71, the
annual growth in slum population was about 10 per cent against the total growth in population at
3.5 per cent. This trend continued further but at a lower pace and picked up again in 2001. In
terms of proportion of the population living in slums, it has also increased from 15 per cent in
1961 to 40 percent in 2001. This growth in the composition of slum population could be
attributed to non-availability of housing stock at affordable costs, leading to the emergence of a
large number of slums.8
8 It is relevant to ask whether slums are also places where households Below Poverty Line (BPL) live.
Surveys of some urban slums in India indicate that the mean income of population living in slums ranges
between 9 and 16 percent above the poverty line. Surveys also indicate that 40-50 percent of slum
households live just below the poverty line while 11 percent live just above it. The remaining 30-40 percent of slum dwellers lives well above the poverty line. Conversely, it is estimated that only 40-60 percent of the
urban poor live in slums or squatter settlements. The balance lives on pavements (close to sources of
income), overcrowded tenements, or commute daily to and from peri-urban areas. This fragmented pattern
of location of urban poor makes it difficult to target programs without risk of some leakage of benefits to
the non-poor.
32
Table 2.10: Comparative Growth of City and Slum Populations Over Time, PMC
Year
Total
Population
Slum
Population
% Slum
Population
City Population
Annual growth
(%)
Slum
Population Growth
(%)
1961 606,777 92,101 15.18 2.19 9.63
1971 856,105 239,701 28 3.5 10.04
1981 1,203,363 377,000 31.33 3.46 4.63
1991 1,691,430 569,000 33.64 3.46 4.2
2001 2,538,473 1,025,000 40.38 4.14 6.06
Sources: Census of India and PMC Environmental Status Report (ESR) 2004-05.
Street Lights
The provision and maintenance of streetlights is an obligatory function of the respective
local bodies in the Pune UA. The electricity department of the local bodies is responsible for
installation, replacement, repairs, operation and maintenance of streetlights in the city. In the case
of PMC, there are about 100,200 street light poles (as per CDP). For a total road length of about
1,800 km (or 1,800,000 metres) in the PMC limits, the average spacing of streetlight poles works
out to about 18 meters (1,800,000 metres/100,200 street lights), which is better when compared
with the international norm of 30 meters (India Infrastructure Report 1996).
The next chapter summarizes the expenditure needs of the various local governments,
comparing them with actual expenditures on each of the services whose physical levels of the
services are discussed above. Then we will be in a position to anecdotally determine whether
there is some relationship between spending and the physical level of services.
33
CHAPTER 3: EXPENDITURE NEEDS
In the case of Pune which consists of five local governments, it was not possible to adopt
an econometric approach to estimate expenditure needs, as in the case of Delhi. Moreover, time-
series data for a reasonably long period of time was not available for all the local governments.
Hence we had to adopt a structured case study approach in the case of Pune as well, in which we
rather computed expenditure gaps by comparing actual expenditures of the local governments
over time, to relevant norms for various services.
In this chapter, we summarize expenditure gaps for water supply, sewerage, solid waste
and sanitation, municipal roads and street lighting, comparing the Pune UA ULBs’ actual
expenditures on these services, with those generally accepted as norms for them. Finally, we
compare the total expenditure needs with the total actual spending on these services, to arrive at
gaps. The chapter concludes by summarizing caveats.
Water Supply
When the objective is to assess actual expenditures for the provision of any given service,
it is necessary to compare it with some benchmark expenditure required to meet a certain physical
level of the service. For doing this, we examined and studied various norms for the provision of
the relevant services. After a detailed examination during our field visits and of existing studies
relating to this area, we found that very few studies deal with ideal expenditure norms. Our
discussion with officials in all cities indicated that while a physical requirement of 135 liters per
capita daily (LPCD) (proposed by the National Commission on Urbanization) is broadly followed
with respect to water supply, no expenditure norms are actually used. For other services such as
solid waste, sanitation/sewerage, roads and street lights, no expenditure or financial norms were
being followed in any of the cities where we visited.
Based on our discussion, we found one study which summarizes various norms for most
public services with which we are concerned, a National Institute of Urban Affairs (NIUA)
Working Paper, by Mathur et.al. (2007). For water supply, solid waste, and sewerage/sanitation,
we used norms summarized in Mathur et.al. (2007). These are national norms for these services
expressed in per capita terms.
This paper by Mathur et al (2007) also summarizes state-specific norms adopted by State
Finance Commissions (SFCs) by some states whose cities are included in this study. While
Maharashtra is one of these, estimation of expenditure needs on the basis of simple projections
does not take into account the needs of the future and also assumes that existing deficiencies will
continue. Further, the state-specific norms summarized by Mathur et. al (2007) are also not
34
disaggregated for various public services such as water supply, sanitation and so forth. In many
cases, actual allocations by states for these services are summarized as norms. Given we are not
interested in actual spending by the states, but in a desired norm, we decided to use the national
norms which are disaggregated for various public services and for which expenditures are stated
separately for the cost of provision and of operations and maintenance (O&M) in (2004-05
constant prices) summarized by Mathur et.al. (2007).
Given that there are five local governments in the Pune UA, for all services including
water supply, we used different norms for cities of different sizes, which correspond to the size of
the five local governments. For PMC and PCMC, for water supply, the norm we use is
summarized in Mathur et.al. (2007) and is based on a 1995 study by NIUA on the costs of urban
infrastructure. Given that PMC and PCMC are large cities, with Census 2001 population of 2.5
million and 1.01 million respectively, we used the norm suggested by the 1995 NIUA study of
Rs.1,043.06 per capita (in 2004-05 prices) for the cost of provision of water supply in large cities,
and the costs of O&M to be Rs.315.93 (in 2004-05 prices) per capita in large cities, in order to
meet an average of 115-210 litres per capita daily (LPCD).9
The remaining local governments in the Pune UA are much smaller than the municipal
corporations, and it is unfair to apply the same norm for the cantonment boards as for the
municipal corporations. For all services, for the smaller ULBs, we used the norms corresponding
to small cities summarized in Mathur et al (2007), for PCB, KCB, and DCB, which had Census
2001 populations of 80,000, 77,000 and about 47,000 respectively (as described in Chapter 1).
Given the fact that we had data on revenue expenditures (in the case of PMC, O&M and
revenue expenditure in the case of PCMC, expenditure on maintenance and repairs, establishment
and contingencies in the case of KCB and PCB, O&M and monies paid to Maharashtra Industrial
Development Corporation (MIDC) in the case of DCB) on water supply, we compared these with
the per capita O&M requirement of Rs.315.93 (expressed in the NIUA study in 2004-05 prices
per capita) recommended for water supply. Since all our data are in real terms with 1999-00 as
the base, we converted the O&M norm from 2004-05 prices as the base, to 1999-00 as the base.
In per capita terms, this norm for water for large cities turns out to be Rs.355.45 in 1999-00
prices.
Further, we had data on estimated (not actual) capital expenditures on water supply by
the PMC, (not for the other ULBs), hence we used norms for the cost of provision of water supply
9 It is interesting to note from the NIUA (1995)’s norms that the per capita requirements both for cost of
provision and O&M keep declining with size of city, reflecting scale economies. For instance, the norm
summarized by this study for metropolitan areas is Rs.372.37 per capita for the cost of provision of water
supply, and Rs.139.83 for meeting the costs of O&M per capita, both lower than they are for large cities.
35
in large cities (which is Rs.1,043.06 (in 2004-05 terms, per capita), Rs.1,173.52 in 1999-00
prices), to compare against the estimated cost of provision in the PMC. We deflated both the
capital (cost of provision) and O&M norms for smaller cities and for the PMC/PCMC using the
price index for water, gas and electricity for Pune district. All the five ULBs in the Pune UA are
located in Pune district, so such a computation is certainly reasonable.
Table 3.1 summarizes the various norms we have used for water supply, for cities of
varying sizes, for the cost of provision and O&M, in 1999-00 prices. For ULBs other than the
PMC, we did not have any data on capital expenditure on any of the services including for water
supply, so the norm for the cost of provision of water supply (and other services) for smaller
cities was not used.
Table 3.1: Norms for Water Supply Used, by City Size
Size of city
Capital/O&M Norm
Large cities (Rs. Per Capita, in
1999-00 Prices)
Small cities (Rs. Per Capita, in
1999-00 Prices)
Capital Rs.1,173.52 Rs.1,000.13
O&M Rs.355.45 Rs.290.80
Source: NIUA (1995) study on “Costs of Urban Infrastructure” and Authors’ Computations.
As described in an earlier chapter, the PMC supplies water to its residents. The PCMC
has its own network to provide water supply to its residents. The PCB buys all its water in bulk
from the PMC and distributes it through their network to the residents. The KCB partly buys
water from the PMC and partly from the MIDC (Maharashtra Industrial Development
Corporation (MIDC)) in bulk and distributes to residents through its network. DCB buys water
directly and only from the MIDC.
Table 3.2 summarizes the per capita expenditures on, and expenditure gaps, when
compared with the relevant norms (summarized in Table 3.1) for water supply by all local
governments in the Pune UA for the years for which data are available. It is clear that PMC is the
highest spender on water supply in per capita terms, when compared with the other local bodies.
Even without comparison to a norm, local governments such as the PCB spend abysmally low on
a basic service such as water supply, spending on average less than Rs.15 per capita on O&M.
When compared with the relevant norms summarized in Table 3.1, it becomes very clear that
PMC is the only local government that spends just about the right amount, and is in fact, left with
a positive expenditure gap of about Rs.40 (in constant 1999-00 terms) per capita, as far as water
supply is concerned. This means that PMC spends on average Rs.40 above the recommended
norm for O&M expenditures on water supply.
36
Table 3.2: Summary of O&M/Revenue Expenditures on Water Supply, All Local
Bodies, Pune UA
Local Body Year
Per capita (Revenue/O&M) Exp
on Water Supply (Rs. Per
Capita, in 1999-00 prices)
Exp. Gap, WS, O&M
(Rs. Per Capita, in 1999-
00 prices)
PMC 1999-2000 429.04 73.59
PMC 2000-2001 426.59 71.14
PMC 2001-2002 377.10 21.65
PMC 2002-2003 383.80 28.35
PMC 2003-2004 346.22 -9.23
PMC 2004-2005 399.90 44.45
PMC 2005-2006 399.42 43.97
PCMC 2004-2005 163.81 -191.64
PCMC 2005-2006 154.46 -200.99
PCB 2001-2002 8.82 -281.98
PCB 2002-2003 5.84 -284.96
PCB 2003-2004 2.95 -287.85
PCB 2004-2005 5.40 -285.40
PCB 2005-2006 51.31 -239.49
KCB 1999-2000 44.46 -246.34
KCB 2000-2001 38.90 -251.90
KCB 2001-2002 34.29 -256.51
KCB 2002-2003 40.78 -250.02
KCB 2003-2004 34.38 -256.42
KCB 2004-2005 38.70 -252.10
KCB 2005-2006 78.69 -212.11
DCB 2003-04 191.59 -99.21
DCB 2004-05 251.06 -39.74
Average, all 169.89 -146.21
Average, PMC 394.58 39.13
Source: PMC, PCMC, PCB, KCB, DCB, and Authors’ Computations.
When all local governments are included, on average, there is a gap of nearly Rs.146 per
capita, on water supply O&M expenditure alone, when compared with the respective norms
recommended for O&M expenditure on water supply. It is not quite clear what the cause of the
gap in spending is in PCB and KCB. While we do know that water tax is a flat 4 percent of the
annual rental value (ARV) of property in these two local governments, we did not have data on
actual revenues from water supply from the local body budgets. We of course had data on this for
PMC from Pune’s City Development Plan, which is prepared for funding from the JNNURM, and
hence is usually inflated. Given that all our actual expenditures and revenues are from the
budgets, we refrain from comparing the water revenue from the CDP to expenditures in the
budget.
37
Further, we note that the ARV itself is flawed as a method of property tax assessment
since it tends to freeze rental values (especially where there is rent control), and always
underestimates the true value of property. Hence 4 percent of the ARV might form a very small
portion of expenditures on water in the case of the smaller ULBs, this could partly explain their
low spending on the service.
According to Pune’s CDP, PMC’s cost recovery through direct user charges (excluding
taxes and other water income) is about 93 percent as far as water supply operations are
concerned. However, the growth in the number of house service connections is just about 1
percent against high population growth and 12 percent growth in assessed properties indicating
large numbers of illegal and irregular connections in the PMC. Pune’s CDP also refers to the low
collection performance of water revenues at just around 15 percent of the demand.
In the PCMC, on the other hand, the CDP indicates that the growth in the number of
house service connections is high, averaging about 12 percent indicating reasonable service
coverage and reach. However, the problem there is the low collection efficiency at 44 percent.
These anomalies have to be corrected for complete cost recovery on the service, to enable
the ULBs to spend more in accordance with the norms, and deliver better levels of the service.
We had information on only PMC’s estimated capital expenditures on water supply for a
few years, which on average, was Rs.1,236 (in constant 1999-00 terms) (Table 3.3), when
compared against the norm specified by the NIUA (1995) study for the (capital) cost of provision
of water supply being Rs.1,174 (Table 3.1) (in 1999-00 prices) for large cities.
Table 3.3: PMC’s Capital Expenditure and Expenditure Gaps, Water Supply
Year
Per Capita Capital Expenditure,
Water Supply (Rs. Per Capita, in
1999-00 prices)
Exp.Gap, WS, Capital
(Rs. Per Capita, in
1999-00 prices)
1999-2000 555.77 -617.75
2000-2001 899.36 -274.16
2001-2002 NA NA
2002-2003 1,229.36 55.84
2003-2004 2,027.72 854.20
2004-2005 NA NA
2005-2006 1,472.23 298.71
Average 1,236.89 63.37
Source: PMC and Authors’ Computations
These estimated capital expenditures on water supply by the PMC are very close to the
recommended norm. However, the expenditures are estimated, not actual, hence difficult to
judge.
38
Solid Waste and Sanitation
We performed a similar exercise for other services as we did for water supply, to arrive at
expenditure gaps. For solid waste, we relied upon an Operations and Research Group (ORG)
(1989) study which suggested norms for waste collection and transportation. For sanitation, we
relied on the NIUA (1995) study for norms. Given the actual expenditures of the ULBs were
combined for solid waste and sanitation, we had to combine the norms for these services as well.
In the case of each of these services, we made an attempt to distinguish between ULBs of various
sizes.
The national norm suggested by ORG (1989) is Rs.60-183 per capita (in 2004-05 prices)
for waste collection (depending on the quantity of waste collected) and Rs.165 per capita for
transportation of the waste. This assumes average waste generation level of 380 grams per capita
per day.10
In PMC, the average waste generation is about 360 grams per capita per day (see
Chapter 2). Given its compatibility with ORG’s assumptions, we used the upper end of ORG’s
estimates for norms relating to solid waste for PMC and PCMC. The norm for solid waste alone
(generation, collection and transportation) in the two municipal corporations is Rs.348 per capita
(in 2004-05 prices), which is Rs.282.27 per capita (in 1999-00 prices).
For the three cantonment boards, for solid waste, we used the lower end of the norm
summarized above, i.e., Rs.60 per capita, and included the cost of transport, Rs.165 per capita,
making for a total of Rs.225 per capita for solid waste management in the smaller ULBs (in 2004-
05 prices) or Rs.164.05 in 1999-00 prices.
The actual expenditures on solid waste in all the ULBs (except the PMC) were combined
with that on sanitation, whereas the norms on solid waste were separate (from the ORG (1989)
study), and the norms for sanitation and sewerage were combined in the NIUA (1995) study.
Hence our approach was to divide the norm from the NIUA (1995) study on sewerage and
sanitation equally and separate them out. Then we added the norm on sanitation with that for
solid waste, to arrive at norms which would be comparable to the combined actual expenditure by
all ULBs on solid waste and sanitation.
For sewerage/sanitation, the norm suggested by the NIUA (1995) study is Rs.214.77 per
capita (in 2004-05 prices) for the cost of provision, and Rs.36.82 (in 2004-05 prices) for O&M,
both for large cities. In 1999-00 prices, these respectively turn out to be Rs.174.28 and Rs.29.88
per capita. Given that we would like to separate sewerage from sanitation, and add sanitation to
solid waste, we divided equally the sewerage/sanitation norm for O&M expenditures (from the
10 The approach used by ORG (1989) to arrive at these norms, relies on the estimation of waste collected,
and estimates vehicle demand based on transport options in terms of trucks, compactors or matador and
trips, with the compactor being the most expensive.
39
NIUA (1995) study) of Rs.29.88 and took Rs.14.94 per capita each for sewerage and sanitation.
We added Rs.14.94 to the norm for solid waste, which is Rs.282.27 per capita (also in 1999-00
prices). This gave us a norm of Rs.297.21 for solid waste and sanitation for PMC and PCMC per
capita (in 1999-00 prices). This norm applies to the costs of O&M of sewerage, and both capital
and O&M of solid waste (since in the case of solid waste it is difficult to separate the capital from
O&M expenditures). We arrived at norms for solid waste and sanitation for all ULBs, using the
appropriate city sizes for generation of solid waste per capita. The smaller city norm for solid
waste and sanitation based on a similar method turns out to be Rs.183.32 (Rs.164.05 per capita
for solid waste (for collection and transportation) and Rs.19.27 per capita for sanitation (O&M),
in 1999-00 prices).
Table 3.4: Summary of Revenue Expenditures and Expenditure Gaps on Solid
Waste and Sanitation, Pune UA
Local Body Year
Per capita Exp on SWM &
Sanitation (Rs. Per Capita,
in 1999-00 prices)
Exp. Gap, SWM & Sanitation
(Rs. Per Capita, in 1999-00
prices)
PMC 1999-2000 126.55 -170.67
PMC 2000-2001 128.56 -168.66
PMC 2001-2002 122.77 -174.44
PMC 2002-2003 141.45 -155.76
PMC 2003-2004 135.42 -161.79
PMC 2004-2005 132.01 -165.20
PMC 2005-2006 129.85 -167.36
PCMC 2003-2004 162.68 -134.53
PCMC 2004-2005 171.39 -125.82
PCMC 2005-2006 166.71 -130.51
PCB 2001-2002 319.66 136.34
PCB 2002-2003 338.59 155.27
PCB 2003-2004 284.57 101.25
PCB 2004-2005 352.62 169.30
PCB 2005-2006 291.94 108.62
KCB 1999-2000 153.22 -30.10
KCB 2000-2001 140.98 -42.34
KCB 2001-2002 123.12 -60.20
KCB 2002-2003 123.42 -59.90
KCB 2003-2004 125.51 -57.81
KCB 2004-2005 143.33 -39.99
KCB 2005-2006 153.38 -29.94
DCB 2003-2004 214.71 31.39
DCB 2004-2005 229.87 46.55
Average, all 183.85 -46.93
Average, PMC 130.94 -166.27
Source: PMC, PCMC, PCB, KCB, DCB, and Authors’ Computations.
40
We compared the norms thus constructed, to the actual expenditures of the local bodies on solid
waste and sanitation. Table 3.4 summarizes the actual per capita expenditures on these urban
services by the various ULBs and the expenditure gap, when actual per capita expenditures are
compared with the norms summarized above.
On average, there is a clear shortfall in spending on these basic services, when compared
against the norms. Even a large municipal corporation like the PMC is unable to spend adequately
on solid waste and sanitation. The average expenditure gap by the PMC alone is roughly Rs.167
per capita, that too on O&M for sewerage, taking an account of a spending norm of Rs.14.94 in
per capita terms (1999-00 prices) on sewerage. The required expenditure on solid waste, taking
into account both capital and O&M expenditures, is of course the larger component, being
Rs.282.27 in per capita terms (1999-00 prices). This means that the PMC is unable to spend
according to the recommended norms for a city of its size, to the extent of Rs.167 per capita, or
nearly an additional Rs.447 million on solid waste and sanitation, at the average population of the
PMC we projected for the period 1999-2005.
While the per capita spending of all ULBs (including the PMC) on solid waste and
sanitation is well above than what it is for PMC alone, the other ULBs, with the exception of PCB
and DCB, also fall short of the required expenditures on solid waste, to attain 100 percent solid
waste collection efficiency. Clearly, even PCMC is unable to spend adequately on solid waste and
sanitation, in comparison with the recommended norms. It is not quite clear what the cause of the
low spending is.
Indeed when compared against the norms summarized above, cantonment boards such as
PCB and DCB spend well above the norms specified. On average, the PCB has a positive
expenditure gap of Rs.134 per capita (in 1999-00 prices) with respect to solid waste and
sanitation, whereas DCB exhibits a positive expenditure gap of Rs.39 per capita. While both of
them are cantonment boards, one probable reason for the apparently adequate level of spending is
that solid waste and sanitation expenditure in these two ULBs refers to establishment and
contingencies. Having said this, the differences in spending across these two ULBs could directly
be a function of scale economies; given PCB is a much larger local government, when compared
with DCB (see Chapter 1).
While the norm refers to collection of solid waste and its transportation, actual
expenditure on solid waste consists of revenue expenditure for the PMC, O&M and revenue
expenditure in the case of PCMC, and O&M in the case of DCB (it is worth noting that capital
expenditures were not available for any service (except for water supply) for the PMC or other
local governments).
41
Sewerage/Drainage
As described earlier, for sewerage/drainage, we used the norm developed by NIUA
(1995) for the cost of O&M on sewerage/sanitation and divided the norm equally between
sewerage and sanitation. The sanitation part of the norm was added to that on solid waste, as
explained in the previous section, and the norm for sewerage was used for comparison against
actual expenditures on sewerage/drainage. The norm summarized by NIUA (1995), is Rs.36.82
per capita for O&M on sewerage/sanitation in large cities (in 2004-05 prices). We converted this
to 1999-00 prices, using the appropriate price index, and the O&M norm turns out to be Rs.29.88.
Table 3.5: Summary of O&M Expenditures and Expenditure Gaps on
Sewerage/Drainage, All Local Governments, Pune UA
Local Body Year
Per capita Exp on
Sewerage/Drainage (Rs. Per
Capita, in 1999-00 prices)
Exp. Gap, Sewerage/Drainage
(Rs. Per Capita, in 1999-00
prices)
PMC 1999-2000 76.13 61.19
PMC 2000-2001 109.87 94.93
PMC 2001-2002 131.69 116.75
PMC 2002-2003 139.76 124.82
PMC 2003-2004 65.69 50.75
PMC 2004-2005 67.20 52.26
PMC 2005-2006 194.09 179.15
PCMC 2003-2004 25.67 10.73
PCMC 2004-2005 23.59 8.65
PCMC 2005-2006 28.72 13.78
PCB 2001-2002 34.17 14.90
PCB 2002-2003 14.48 -4.79
PCB 2003-2004 3.43 -15.84
PCB 2004-2005 16.58 -2.69
PCB 2005-2006 11.25 -8.02
KCB 1999-2000 28.33 9.06
KCB 2000-2001 76.65 57.38
KCB 2001-2002 34.82 15.55
KCB 2002-2003 35.74 16.47
KCB 2003-2004 28.37 9.10
KCB 2004-2005 24.47 5.20
KCB 2005-2006 18.60 -0.67
Average, all 54.06 36.76
Average, PMC 112.06 97.12
Average, PCB 15.98 -3.29
Average, KCB 35.28 16.01
Source: PMC, PCMC, PCB, KCB, DCB, and Authors’ Computations.
The relevant norm for sewerage is half of this (with the other half having been allocated to
sanitation), Rs.14.94 per capita. We compared actual expenditures on sewerage against this norm
42
for the larger ULBs (PMC and PCMC). For the smaller ULBs, the sewerage norm turns out to be
Rs.19.27 (in 1999-00 prices).
The comparisons of actual expenditures with norms for sewerage/drainage O&M
expenditures for all local governments in the Pune UA are summarized in Table 3.5. On average,
when the entire UA is taken into account, there is a positive gap as far as sewerage/drainage
O&M expenditure is concerned. Clearly, the PMC is the highest spender per capita on sewerage,
followed by KCB, PCMC and then the PCB.11
It is surprising that even cantonment boards such
as KCB are in a position to spend more per capita on this service, when compared with a
municipal corporation like PCMC.
On average, it is only the PCB that spends below the norm on sewerage O&M, the
expenditure gap on this service being Rs.3.29 per capita. If we were to translate the per capita
expenditure gap on this service by the PCB to total terms, at the average population of the PCB
we have projected for the time period 2001-2005 (which is 79,538), the per capita Rs.3.29
expenditure gap (see Table 3.5) translates to an additional Rs.2,61,679 for sewerage O&M alone.
While the physical level of the service corresponding to this expenditure norm is not suggested by
the NIUA (1995) study, we assume that this level of spending would be required for 100 percent
coverage of population with sewerage networks.
Table 3.6: Summary of Capital Expenditures and Expenditure Gaps on
Sewerage/Drainage, PMC
Year
Per Capita Capital
Expenditure on Drainage (Rs.
Per Capita, in 1999-00 prices)
Exp.Gap, Drainage, Capex
(Rs. Per Capita, in 1999-00
prices)
1999-2000 173.71 86.57
2000-2001 241.26 154.12
2001-2002 NA NA
2002-2003 255.26 168.12
2003-2004 303.83 216.69
2004-2005 NA NA
2005-2006 675.83 588.69
Average 329.98 242.84
Source: PMC and Authors’ Computations.
Data on capital expenditure for drainage was available just from the PMC. Hence we
compared this to norms for capital expenditure on drainage in large cities, which was Rs.214.77
per capita (in 2004-05 prices), which turns out to be Rs.174.28 per capita in 1999-00 prices. The
story is promising as far as PMC’s spending on capital projects on sewerage/drainage is
11 Data on sewerage/drainage were not available from the DCB, hence excluded from Table 3.5
43
concerned. On average, taking into account the entire period of our study and the years for which
the data were available, we find positive expenditure gaps in the case of PMC’s capital
expenditures on sewerage/drainage (Table 3.6), against a norm of Rs.174.28 per capita (in 1999-
00 prices).
So there appears to be no great problem as far as spending on O&M or capital
expenditure by the PMC (or most other ULBs) is concerned. Adequate spending on capital
projects relating to sewerage by the PMC is possibly one reason why most (95 percent) of its area
is covered by sewerage networks (see Table 2.4, Chapter 2).
Municipal Roads
In the case of municipal roads and street lights, nationally recommended expenditure
norms were not readily available. Mathur et.al (2007) is silent regarding these services.12
Based
on our consultations with cities and various local governments, for these services, no state-
specific or city-specific norms are being used. Hence we used expenditure norms developed by
PricewaterhouseCoopers (2000) for these services for towns of various sizes, for a study they did
for the Government of Chhattisgarh. These norms basically refer to the Zakaria committee norms
for O&M expenditure, updated to 2000-01 prices. These norms for municipal roads, for towns
with population greater than 20 lakhs (PMC’s size), population between 5-20 lakhs (PCMC’s
size), those with population between 0.5-1 lakh (PCB and KCB’s sizes) and for towns with 0.2-
0.5 lakh population (DCB’s size) are respectively Rs.43.45, Rs.35.55, 23.71 and Rs.21.73 per
capita (in 2000-01 prices). In 1999-00 prices, these norms respectively are Rs.39.02 (for PMC’s
size), Rs.31.93 (for towns of PCMC’s size), Rs.21.29 (for towns of KCB and PCB’s sizes) and
Rs.19.51 (for towns of DCB’s size). Municipal roads are one service for which we had data on
O&M expenditure for all the years for which we sought information. We compared the norms for
roads to actual expenditures on the service. The comparisons of the actual expenditure to the
relevant norms are summarized in Table 3.7.
On average, all local governments in the Pune UA appear to spend adequately on
municipal roads. Surprisingly, the low spender here both in terms of the relative average and in
comparison with the O&M norm is the PMC itself. This comes as a surprise indeed because a
very small proportion of PMC’s land area is covered by roads (see Chapter 2). On average, there
is a shortfall of Rs.2 per capita (in 1999-00 prices) with respect to O&M expenditure on
municipal roads by the PMC. At PMC’s average population over our study period (1999-00 to
12 We tried very hard, but were unable to get a copy of the NIUA (1995) draft report on the costs of urban
infrastructure.
44
2005-06), this translates to a total additional expenditure gap of nearly Rs.5.35 million on roads
alone (in 1999-00 prices).
Table 3.7: Summary of O&M Expenditures and Expenditure Gaps for Municipal
Roads, All Local Governments, Pune UA
Local Body Year
Per capita Exp on Roads (Rs. Per
Capita, in 1999-00 prices)
Exp. Gap, Roads (Rs. Per
Capita, in 1999-00 prices)
PMC 1999-2000 46.53 7.51
PMC 2000-2001 38.71 -0.31
PMC 2001-2002 36.66 -2.36
PMC 2002-2003 40.91 1.89
PMC 2003-2004 28.47 -10.55
PMC 2004-2005 30.14 -8.88
PMC 2005-2006 37.74 -1.28
PCMC 2001-2002 59.63 27.70
PCMC 2002-2003 59.24 27.31
PCMC 2003-2004 40.50 8.57
PCMC 2004-2005 55.81 23.88
PCMC 2005-2006 51.43 19.50
PCB 2001-2002 209.10 187.81
PCB 2002-2003 354.79 333.50
PCB 2003-2004 162.21 140.92
PCB 2004-2005 215.07 193.78
PCB 2005-2006 345.72 324.43
KCB 1999-2000 139.60 118.31
KCB 2000-2001 164.14 142.85
KCB 2001-2002 133.19 111.90
KCB 2002-2003 178.40 157.11
KCB 2003-2004 153.95 132.66
KCB 2004-2005 82.39 61.10
KCB 2005-2006 125.34 104.05
DCB 2003-04 91.30 71.79
DCB 2004-05 42.80 23.29
Average, all 116.87 89.23
Average, PMC 37.02 -2.00
Average, PCMC 49.24 17.31
Average, PCB 257.38 236.09
Average, KCB 139.57 118.28
Average, DCB 67.05 47.54
Sources: PMC, PCMC, PCB, KCB, DCB, and Authors’ Computations.
A much smaller municipal corporation such as the PCMC is able to meet the norms for
O&M expenditure on roads, and indeed spends above the norm, to the extent of Rs.17.31 per
capita, on average.
45
The biggest surplus spenders on O&M of municipal roads are the PCB, KCB and DCB,
which spent on average, respectively Rs.236, Rs.118 and Rs.48 more per capita for O&M on their
municipal roads, than is suggested by the PWC norm. This is understandable because capital
expenditure on their municipal roads is met by the Ministry of Defence, Government of India.
Hence it is understandable that they have more resources to spend on the O&M of these roads. On
the other hand, the municipal corporations are hard-pressed for funds, however rich even with
octroi, hence cannot spend enough. Given the PCMC spent on average, more per capita on
municipal roads’ O&M, does this suggest that roads in PCMC are maintained better than they are
in PMC? Well, this is debatable. While we had some data on PMC’s road network, we did not
have any on PCMC’s to enable us to make an assessment there.
Street Lights
As described in the previous section on roads, we did not have national norms with
respect to spending on street lights. Hence we used the PWC norms, which are the inflation-
adjusted norms of the Zakaria Committee for towns in Chhattisgarh of various sizes. For street
lights, these norms respectively are Rs.59.26 (for towns the size of PMC), Rs.56.29 (for towns of
PCMC’s size), Rs.45.44 (for towns of PCB and KCB’s size), and Rs.42.47 (for towns of DCB’s
size), all in per capita terms, and in 2000-01 prices. These per capita norms in 1999-00 prices
respectively are, Rs.75.99, Rs.72.19, Rs.58.27, and Rs.54.46, for towns of the sizes we are
concerned with here.
Data were not available from the KCB and PCB for any year on street lights expenditure
(O&M or capital projects). We had data on this from PCMC and DCB for a couple of years, and
PMC for a number of years. Table 3.8 summarizes the differences between actual and required
O&M real expenditures on street lights in all the local governments from which data were
available, in per capita terms (in constant 1999-00 prices).
Surprisingly again, it is the largest municipal corporation, the PMC, which is the low
spender on street lights (O&M) as well. On average, there is a shortfall of Rs.18 per capita (in
real 1999-00 terms) as far as spending on street lights by the PMC is concerned. While the
installation of street lights in the PMC area meets even international norms (see Chapter 2), since
street lights are usually an indicator of safety, low spending would mean that either the lighting is
either of good quality and does not need to be replaced often, but it could also mean that not
enough defective street lights are replaced, or that the PMC is unable to afford enough
engineers/technicians to fix defective lights. If the latter were to be the case, low spending on
street lighting would cast doubt on the PMC’s ability to provide safety to its residents.
46
Table 3.8: Summary of O&M Expenditures and Expenditure Gaps for Street
Lights, All Local Governments, Pune UA
Local Body Year
Per capita Exp on Street
Lights (Rs. Per Capita, in
1999-00 prices)
Exp. Gap, Street
Lights (Rs. Per Capita,
in 1999-00 prices)
PMC 1999-2000 46.00 -29.99
PMC 2000-2001 62.97 -13.02
PMC 2001-2002 56.24 -19.75
PMC 2002-2003 56.32 -19.67
PMC 2003-2004 54.30 -21.69
PMC 2004-2005 61.98 -14.01
PMC 2005-2006 70.71 -5.28
PCMC 2004-2005 77.58 5.39
PCMC 2005-2006 73.89 1.70
DCB 2003-2004 43.01 -11.45
DCB 2004-2005 71.15 16.69
Average, all 61.29 -10.10
Average, PMC 58.36 -17.63
Average, PCMC 75.74 3.55
Average, DCB 57.08 2.62
Sources: PMC, PCMC, DCB, and Authors’ Computations. Note: No data were available from the PCB and KCB for expenditures on street lighting.
The PCMC’s spending on street lights meets the norms, indeed, and given that it is an
area that is increasingly inhabited by households (rather than persons, see Chapter 1), its picture
as a safe place to live is likely to encourage more in-migration into the area. While DCB’s
spending during one year is below the norm, it is well above the norm during the most recent year
for which data were available. Hence on average, it is adequate, taking into account the norm. We
did not have information on the average spacing between street lights in the other ULBs, hence
difficult to match the spending with the physical level of the service.
Total Expenditure
Total expenditures include all revenue and O&M expenditures on the relevant services,
and spending on “other” services such as public health, primary education, slums, city planning,
pensions and so forth. In addition to this, the ULBs also have debt payments (not included here).
We examined total expenditures per capita for all ULBs during 1999-00 to 2005-06, on the
relevant services, namely, water supply, sanitation & solid waste, sewerage, municipal roads and
street lights, and examined this with and without PMC and PCMC. The descriptive statistics are
summarized in Table 3.9.
47
Table 3.9: Per Capita Total Expenditure, Local Governments, Pune UA
Total Per Capita Expenditure, All Local Governments, Rs. Per Capita, in 1999-00 Prices
1999-
2000
2000-
2001
2001-
2002 2002-2003
2003-
2004 2004-2005
2005-
2006
Average 2,649.35 2,223.03 2,433.50 3,618.99 3,189.25 3,359.15 4,210.29
Maximum 3,572.57 2,814.28 3,361.55 7,892.95 7,842.09 8,152.24 9,188.89
We find that on an average Pune Urban Agglomeration is capable of raising revenues of
the order of Rs 1,929,957,268 in 99-00 prices which is 61% higher than the actual revenues. If
translated to per capita terms the difference between per capita revenue and per capita revenue
capacity, on an average, amounts to Rs.355. The highest average revenue capacity is recorded for
PMC and the lowest for DCB, whereas in per capita terms the highest value is recorded for
18 For our revenue capacity estimations we have considered a scenario where there is no octroi. We would
be interested to know the revenue potential of a ULB in the absence of octroi keeping in mind the future
policy initiatives of the state in favour of abolition of octroi to eliminate its distortionary effect on the economy. It is clear from Table 4.9 that on an average there is a loss of 43% of revenue if we do not
consider octroi in the total revenues. For PCMC the magnitude of loss is the maximum, as high as 79%
which amounts to Rs 2355 in per capita terms. The loss of the cantonment boards on this account is lower
as recoded in Table 4.9.
19Time periods for the data available for all the municipalities are not the same. The averages for each
municipalities are calculated on the basis of the available data across time. The average across all the
ULBS are calculated across all the ULBs taking the entire dataset.
20
With octroi the average ratio is much higher, which is around 4%.
58
KCB21
and the lowest for PMC. The case for PCMC needs special mention. The difference in
actual revenues and revenue capacity, both in absolute and per capita terms are the highest in
PCMC. This is because of the dominant role played by octroi in this ULB. If we do not consider
octroi the revenue GCP ratio is even less than 1% which is why the revenue capacity estimates
generated exceeds the actual revenue by a huge margin (Rs. 1397 in 99-00 prices in absolute per
capita terms and 230% increase in relative terms)22
.
The next and final chapter makes an assessment of the fiscal health of the ULBs
of the Pune UA taking into account both revenue capacities and expenditure needs, reiterates data
caveats and contains concluding remarks.
21 KCB however raises more than what we have estimated by our revenue capacity. Their revenue GCP
ratio is as high as 4% even without octroi. It is interesting to note that population in KCB has been falling
for the past few years, so the per capita revenues are very high. However looking at the ratio of urban
revenues and the non agricultural component of GDP for the state of Maharashtra, which ranges between 1-
2% in the recent years, it seems logical not to use a ratio a rate higher than 3% for the municipalities.
22 Considering the difference in the revenue raising sources and the functioning of the Cantonment Boards
and the other municipalities in Pune another way of estimating the revenue capacity would be to apply
differential rates for different municipalities. But at the policy level this might lead to complications, so we
refrain from doing such analysis.
59
Appendix
Figure 4.1: Components of Own Source Revenue for Pune ULBs for 2004-05 (99-00 Prices)
0
500
1000
1500
2000
2500
3000
3500
All
ULB
s
Conto
nmen
t boar
ds
PM
C & P
CMC
All
ULB
s
Conto
nmen
t boar
ds
PM
C & P
CMC
All
ULB
s
Conto
nmen
t boar
ds
PM
C & P
CMC
All
ULB
s
Conto
nmen
t boar
ds
PM
C & P
CMC
All
ULB
s
Conto
nmen
t boar
ds
PM
C & P
CMC
All
ULB
s
Conto
nmen
t boar
ds
PM
C & P
CMC
In R
s.
Per capita property tax
Per capita octroi
Per capita other tax
Per capita total tax revenue with
octroi
Per capita total tax revenue
without octroi
Per capita total non-tax revenue
Per capita own source revenue
with octroi
Per capita own source revenue
without octroi
60
Figure 4.2: Components of Total Revenue for the year 2004-05 (in Constant 1999-00 Prices)
0
500
1000
1500
2000
2500
3000
3500
All ULBs
Con
tonm
ent B
oards
PMC &
PCM
C
All ULBs
Con
tonm
ent B
oards
PMC &
PCM
C
All ULBs
Con
tonm
ent B
oards
PMC &
PCM
C
In R
s.
With octroi per capita
ow n source revenue
Without octroi per
capita ow n source
revenue
Per capita grant
Total per capita
revenue w ith octroi
Total per capita
revenue w ithout octroi
61
Figure 4.3: Average Proportions of Tax & Non Tax Revenue in Own Source Revenue (2004-05)
0%
10%
20%
30%
40%
50%
60%
70%
80%
All
ULB
s
Cont
onmen
t boar
ds
PMC &
PCM
C
All
ULB
s
Cont
onmen
t boar
ds
PMC &
PCM
C
All
ULB
s
Cont
onmen
t boar
ds
PMC &
PCM
C
All
ULB
s
Cont
onmen
t boar
ds
PMC &
PCM
C
All
ULB
s
Cont
onmen
t boar
ds
PMC &
PCM
C
In P
erc
en
tag
e
Proportion of property tax out of own
source revenue with octroi
Proportion of property tax out of own
source revenue without octroi
Proportion of octroi out of own source
revenue
Proportion of other tax out of own
source revenue with octroi
Proportion of other tax out of own
source revenue without octroi
Proportion of total tax revenue out of
own source revenue with octroi
Proportion of total tax revenue out of
own source revenue without octroi
Proportion of total non tax revenue out
of own source revenue with octroi
Proportion of total non tax revenue out
of own source revenue without octroi
62
Figure 4.4: Average Proportions of Own Source Revenue & Grants in Total Revenue (2004-05)
0%
20%
40%
60%
80%
100%
120%
All ULBs
Contonm
ent Board
s
PMC &
PCM
C
All ULBs
Contonm
ent Board
s
PMC &
PCM
C
In P
erc
ent
age
Proportion of
ow n source
revenue in total
revenue w ith
octroiProportion of
ow n source
revenue in total
revenue w ithout
octroiProportion of
total grants in
total revenue
w ith octroi
Proportion of
total grants in
total revenue
w ithout octroi
63
CHAPTER 5: ASSESSMENT OF FISCAL HEALTH
Fiscal health of a city reflects its ability to manage its expenditure needs with the
available handles to raise finances. Generally we treat the gap between the revenue capacity and
the total expenditure need as an indicator of fiscal health of a municipality. For convenience in
comparability the per capita measures are preferred.
These measures, referred to as fiscal gaps, give an idea about a municipality’s ability to
meet the minimum requirements in terms of service delivery if the maximum potential for its
revenues are realized. The minimum requirements in terms of service delivery are generally
measured by the total expenditure need which is estimated by summing over the existing financial
norms for each of the services delivered by the ULB. In a way fiscal gaps indicate whether the
maximum revenue potentials are sufficient to finance the minimum expenditures (expressed in
terms of norms) required to provide the services in a particular ULB.
In this chapter we would first present our estimates on fiscal gaps and also the revenue
expenditure norm gaps (the gap between actual revenues and total expenditure need) for the
ULBs of Pune. We would also give some plausible explanations in support of some of our results
which seem to be puzzling. The concluding section spells out the data caveats and some
limitations of the study.
Estimates of Fiscal Gaps
Pune urban agglomeration is an interesting combination of ULBs consisting of
Cantonment boards and municipalities dominated by residential and industrial activities. In what
follows we would attempt to analyse the fiscal health of the ULBs in Pune urban agglomeration.
Table 5.1: Fiscal Gaps in Pune ULBs (in Constant 1999-00 prices)
28 The gap of PCMC can be justified on the ground of their overdependence on Octroi as the component of
revenue and the difference is calculated on the basis of total revenue without octroi. 29 Details on this head is not available for all the municipalities.
30
Slum rehabilitation, medical treatment & nutritional food for children, medical aid programme for
workers, building and land, building regulation, town planning & city development, fire brigrade, removal
for encroachment, park, zoo and fisheries, sports and activity, cultural centre, vegetable market, meat, fish market & slaughter house, ward development, grants for public institution, dearness allowance, allowance
for PMC employee, allowance for city planning board, slum area development board, improvement of
children and women, conservation of forest, grants for development of Pune District, matching grants from
Finance Commission, ESCROW board, allowance for youth development scheme.
68
It is clear that for these categories in table 5.2 norms31
cannot be defined, neither for
individual heads nor in terms of aggregates. Table 5.3 shows the detailed heads of the two
cantonments boards. It seems that the shares of other expenditures which are excluded in
the study are even higher. This makes our task difficult. We are not in a position to judge
whether the surplus figures recorded are adequate to finance these other expenditures or not.
Also, it is beyond the scope of our study to say anything about the expenditure gaps for the
services on account of which the other expenditures are incurred.
Table 5.3: Details of Other Expenditures, 2005-06, PCB and KCB
Heads Percentages
KCB PCB
General administration 4% 3%
Public works (Construction and Maintenance) 17.21% 10.29%
Public convenience (fire, dak bungalows, rest houses and sarais,
market & slaughter, pounds, agriculture, public garden, tree trending,
forests etc. and reward for destruction of wild animals) 10.65% 12.57%
Hospital and Dispensaries 17.90% 10.91%
Other Medical Services (family planning, vaccination, registration of
births and deaths in the cantonment area, epidemics etc.) 14.35% 4.45%
Public Institution (primary & secondary education, library and pension
contributions) 18.11% 15.55%
Other contributions to Charitable & Medical Institutions 4.07% 0.00%