86
Policy Pathway Improving the Fuel Economy of Road Vehicles A policy package
| Date post: | 14-Jun-2018 |
| Category: |
Documents |
| Upload: | nguyenminh |
| View: | 214 times |
| Download: | 0 times |
PolicyPathway
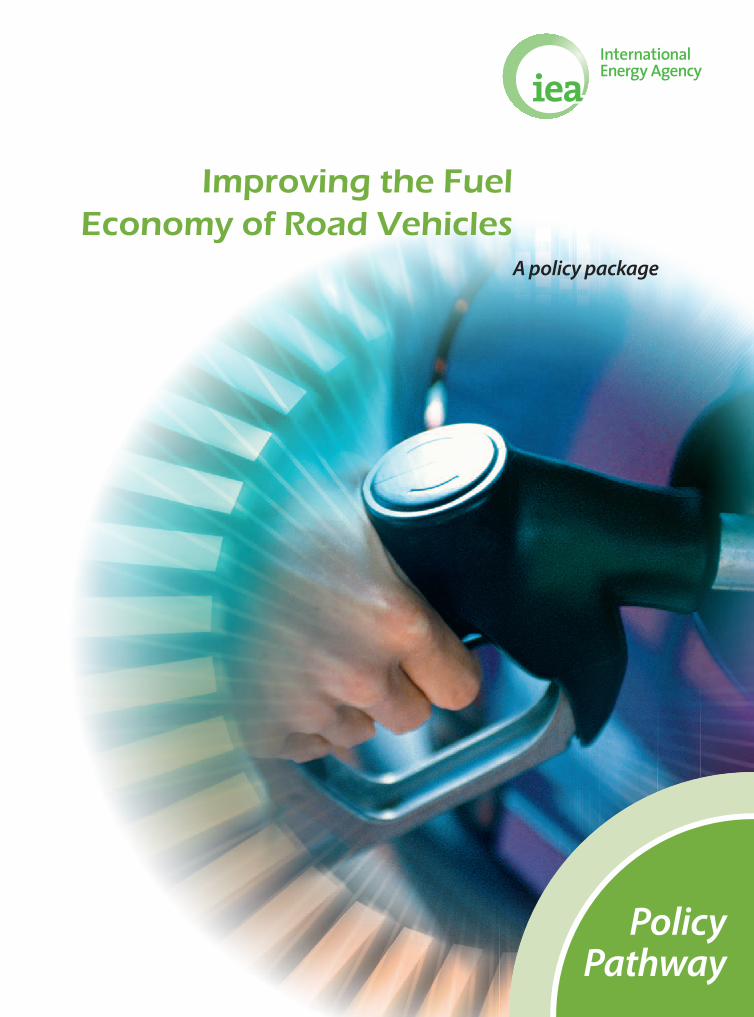
Improving the Fuel Economy of Road Vehicles
A policy package

© O
EC
D/IE
A, 2
012

1Policy Pathway ImprovIng the Fuel economy oF road vehIcles
the iEa Policy Pathway series
policy pathway publications provide details on how to implement specific recommendations drawn from the IEA 25 Energy Efficiency Policy Recommendations. Based on direct experience, published research, expert workshops and best-practice country case studies, the series aims to provide guidance to all countries on the essential steps and milestones in implementing specific energy efficiency policies. policy pathways have been published on:
z �Energy�Management�Programmes�for�Industrygaining through saving
z Joint�Public-Private�Approaches�for�Energy�Efficiency�Finance��policies to scale-up private sector Investment
z Monitoring,�Verification�and�Enforcement��Improving compliance within equipment energy efficiency programmes
z Energy�Performance�Certification�of�Buildings��a policy tool to Improve energy efficiency
the policy pathways series is designed for policy makers at all levels of government and other relevant stakeholders who seek practical ways to develop, support, monitor or modify energy efficiency policies. the pathways can also provide insight into the specific policy context(s) of different countries, so that each country derives the maximum benefit from energy efficiency improvements.
POLICYPATHWAY
� E
VALUATE �
� PLAN �
� IMPLEM
ENT
�
� M
ON
ITOR �
Improving the Fuel Economy of Road Vehicles
A policy package
© O
EC
D/IE
A, 2
012
INTERNATIONAL ENERGY AGENCY
The International Energy Agency (IEA), an autonomous agency, was established in November 1974. Its primary mandate was – and is – two-fold: to promote energy security amongst its member
countries through collective response to physical disruptions in oil supply, and provide authoritative research and analysis on ways to ensure reliable, affordable and clean energy for its 28 member countries and beyond. The IEA carries out a comprehensive programme of energy co-operation among its member countries, each of which is obliged to hold oil stocks equivalent to 90 days of its net imports.The Agency’s aims include the following objectives:
Secure member countries’ access to reliable and ample supplies of all forms of energy; in particular, through maintaining effective emergency response capabilities in case of oil supply disruptions.
Promote sustainable energy policies that spur economic growth and environmental protection in a global context – particularly in terms of reducing greenhouse-gas emissions that contribute to climate change.
Improve transparency of international markets through collection and analysis of energy data.
Support global collaboration on energy technology to secure future energy supplies and mitigate their environmental impact, including through improved energy
effi ciency and development and deployment of low-carbon technologies.
Find solutions to global energy challenges through engagement and dialogue with non-member countries, industry, international
organisations and other stakeholders.IEA member countries:
Australia Austria
Belgium Canada
Czech RepublicDenmark
FinlandFrance
GermanyGreece
HungaryIreland
ItalyJapan
Korea (Republic of)LuxembourgNetherlandsNew Zealand NorwayPolandPortugalSlovak RepublicSpainSwedenSwitzerlandTurkeyUnited Kingdom
United States
The European Commissionalso participates in
the work of the IEA.
Please note that this publicationis subject to speci� c restrictionsthat limit its use and distribution.
The terms and conditions are available online at http://www.iea.org/termsandconditionsuseandcopyright/
© OECD/IEA, 2012International Energy Agency
9 rue de la Fédération 75739 Paris Cedex 15, France
www.iea.org

3
table of contents
Policy Pathway ImprovIng the Fuel economy oF road vehIcles
Foreword . . . . . . . . . . . . . . . . . . . . . . . . . . . . . . . . . . . . . . . . . . . . . . . . . . . . . . . . . . . . . . . . . . . . . . . . . . . . . . . . . . . . . . . . . . 4
Acknowledgements . . . . . . . . . . . . . . . . . . . . . . . . . . . . . . . . . . . . . . . . . . . . . . . . . . . . . . . . . . . . . . . . . . . . . . . . . . . . . . . . 5
Executive summary . . . . . . . . . . . . . . . . . . . . . . . . . . . . . . . . . . . . . . . . . . . . . . . . . . . . . . . . . . . . . . . . . . . . . . . . . . . . . . . . 6
Introduction . . . . . . . . . . . . . . . . . . . . . . . . . . . . . . . . . . . . . . . . . . . . . . . . . . . . . . . . . . . . . . . . . . . . . . . . . . . . . . . . . . . . . . . 9
What policy package is needed to improve the fuel economy of road vehicles? . . . . . . . . . . . . . . . . . . . . . . . 14
Why are policies needed? 14
What are the elements of the policy package? 15
The policy status quo: introducing the fuel economy readiness index 38
How to deliver effective fuel economy policies: the policy pathway . . . . . . . . . . . . . . . . . . . . . . . . . . . . . . . . . . 40
Plan 41
Implement 60
Monitor 62
Evaluate 64
Conclusions . . . . . . . . . . . . . . . . . . . . . . . . . . . . . . . . . . . . . . . . . . . . . . . . . . . . . . . . . . . . . . . . . . . . . . . . . . . . . . . . . . . . . . 66
Annexes . . . . . . . . . . . . . . . . . . . . . . . . . . . . . . . . . . . . . . . . . . . . . . . . . . . . . . . . . . . . . . . . . . . . . . . . . . . . . . . . . . . . . . . . . . 68
Case study 1: European Union CO2 passenger car regulation 68
Case study 2: Japanese HDV fuel economy standards 72
References . . . . . . . . . . . . . . . . . . . . . . . . . . . . . . . . . . . . . . . . . . . . . . . . . . . . . . . . . . . . . . . . . . . . . . . . . . . . . . . . . . . . . . . . 79
© O
EC
D/IE
A, 2
012

4 Policy Pathway ImprovIng the Fuel economy oF road vehIcles
Foreword
Improving energy efficiency is key to ensuring energy security, climate change mitigation, economic growth and quality of life. The IEA has developed the 25 Energy Efficiency Policy Recommendations to assist countries in delivering the full potential of improved energy efficiency. Among sectors, transport represents the greatest challenge but also the greatest opportunity to improve energy efficiency. Road transport has the highest dependency on oil compared with any other sector, and therefore, any improvements in energy efficiency can deliver great benefits in terms of increased energy security, economic performance, mobility for citizens and reduced carbon emissions.
Transport and mobility are also intrinsic human needs that will continue to grow as populations grow and emerging economies prosper. Without optimising energy efficiency in every mode of transport and across the entire transportation system, the resource requirements will be vast.
Governments have an important role to play in putting a policy framework in place that can balance the need for sufficient mobility for their citizens while
conserving scarce resources. One crucial step is to implement a mix of policies to ensure that the most efficient technologies available are deployed in road vehicles.
This policy pathway assists policy makers setting out to implement or enhance policies to improve the fuel economy of light-duty road vehicles (LDVs) and heavy-duty road vehicles (HDVs). It highlights a package of policies, such as fuel economy labelling, standards and fiscal measures, which are needed to advance the deployment of technologies outlined in the IEA companion report technology roadmap: Fuel economy of road vehicles (IEA, 2012a) and to assist in behavioural change. This step-by-step guide and case studies of policies to improve the fuel economy of road vehicles should be useful for policymakers seeking to discover the lessons learned from other countries around the world in fuel economy policy making.
Maria van der HoevenIEA Executive Director
© O
EC
D/IE
A, 2
012
5Policy Pathway ImprovIng the Fuel economy oF road vehIcles
acknowledgements
This publication was prepared by the IEA Directorate of Sustainable Energy Policy and Technology (SPT).
The main authors of the report were Kazunori Kojima (previously of the IEA and now at Toyota Motor Corporation) and Lisa Ryan of the Energy Efficiency Unit, IEA. Tsuneki Matsuo (Ministry of Land, Infrastructure, Transport and Tourism (MLIT) of Japan) made substantial contributions to earlier drafts of the report. We are also grateful for the inputs of François Cuenot and Lew Fulton of the Energy Technology Perspectives Division, IEA. The IEA Deputy Executive Director, Ambassador Richard H. Jones, and Stephen Gallogly and Shinji Fujino of the IEA Directorate for Global Energy Dialogue provided helpful review comments. This policy pathway was project managed by Lisa Ryan; the Policy Pathway series is managed by Sara Pasquier, in the IEA Energy Efficiency Unit.
The team would like to thank the following individuals for their leadership and guidance: Bo Diczfalusy, Director of the IEA Directorate for Sustainable Energy Technology Policy; Philippe Benoit, Head of the IEA Energy Efficiency and Environment Division; Robert Tromop, Head of the IEA Energy Efficiency Unit; and Nigel Jollands, former Head of the IEA Energy Efficiency Unit.
The IEA would like to thank participants in the workshop hosted by the IEA in May 2011 on heavy-duty truck fuel economy1 and in the workshop hosted by the International Transport Forum in February 2010 that included a session on light-duty vehicle fuel economy. Many of these participants also provided review comments on the final report as part of an extensive consultation and review process in developing this publication. We particularly thank the following people for their review and contributions to the document:
1. www.iea.org/work/workshopdetail.asp?WS_ID=518
Rosemary Albinson, BP, United Kingdom
Yutaka Fukunaga, Nissan Motor, Japan
Mr. Sandeep Garg, Bureau of Energy Efficiency, India
Duleep Gopalakrishnan, ICFI, United States
Hui He, the International Council of Clean Transportation
Stephan Herbst, Toyota Europe, Belgium
Nikolas Hill, AEAT, United Kingdom
Kaoru Horie, Honda R&D Co., Ltd, Japan
Jon Real, Department of Infrastructure and Transport, Australia
Mike Small, Energy Efficiency Conservation Authority, New Zealand
David Vance Wagner, the International Council of Clean Transportation
The resulting document is the IEA interpretation of these workshops, with additional information incorporated to provide a more complete picture, and does not necessarily represent the views of all the workshop participants and reviewers.
This publication was edited by Jonas Weisel and has benefitted from the inputs of Marilyn Smith, Muriel Custodio, Cheryl Haines, Astrid Dumond, Angela Gosmann and Rebecca Gaghen in the IEA Communications and Information Office. The graphics and layout were designed by Bertrand Sadin and Corinne Hayworth (previously of the IEA).
We are particularly grateful to Toyota Motor Corporation for their support for this work.
© O
EC
D/IE
A, 2
012

6 Policy Pathway ImprovIng the Fuel economy oF road vehIcles
the transport sector consumes approximately one-fifth of global primary energy. This sector is highly dependent on oil and will account for nearly all future growth in oil use (IEA, 2012a). Without policy intervention, the demand for oil for the transport sector is forecast to increase. A reduction in transport energy consumption can, therefore, provide significant benefits for energy security, economic development and climate change, as well as reducing individual user fuel costs. Road vehicles represent approximately three-quarters of transport energy use, so policies to reduce energy demand in transport should begin by targeting LDVs and HDVs.
countries in all parts of the world need to improve the fuel economy of road vehicles. Current technologies for conventional gasoline and diesel vehicles can reduce the fuel consumption of new vehicles by half over the next 20 years. The necessary technologies are already cost-effective in that the fuel savings outweigh the additional costs over vehicle life; however, they are still not deployed widely enough. Significant improvements in fuel economy can be achieved in the next five to ten years if countries implement the necessary policies very soon. The policy pathway checklist (Table ES-1) outlines the four main phases and ten critical steps for countries to take to improve vehicle fuel economy.
this policy pathway provides information and key steps for the development and effective implementation of policies to improve the fuel economy of road vehicles. The IEA 25 Energy Efficiency Policy Recommendations include a policy package made up of fuel economy labelling, standards, and fiscal measures to improve the fuel efficiency of LDVs and HDVs (IEA, 2008 and 2011a). To date, fuel economy policies (including fuel economy labelling, standards and fiscal measures) for LDVs have been introduced in most OECD countries, the European Union and China. Only two countries have implemented HDV standards: the United States and Japan.
the scope of this policy pathway is on policies to improve the tested fuel efficiency rather than
the in-use operation of the new lDV and hDV fleets. Fuel-efficient technologies are commercially available to significantly improve fleet fuel economy but are not yet widely enough deployed. Policies are needed to encourage the deployment of efficient technologies in new vehicles. This report complements the technology roadmap: Fuel economy of road vehicles, which outlines the technical options, potentials, and costs to improve fuel economy in the near, medium and long term. The policy pathway takes up where the roadmap leaves off, describing the implementation steps of the policies needed to deploy the technologies identified there.
Policies to improve road vehicle fuel economy should encourage transformation of the new vehicle market by addressing market failures, information gaps and the higher upfront costs associated with more innovative technologies. It is impractical and costly to improve the efficiency of existing vehicles, and vehicle stocks turn over only every 10 to 15 years, so policies must focus on improving the efficiency of the new entrants to the vehicle stock. An integrated approach to achieving this goal typically combines three policy elements that are shown to be effective in addressing the above barriers:
z information measures such as fuel economy and/or CO2 (carbon dioxide) emissions labelling;
z vehicle fuel economy and CO2 emission standards; and
z fiscal measures such as vehicle taxes and tax incentives and fuel taxes.
The best mix and prioritisation of policies depend on a particular country’s circumstances, including the overarching policy setting, infrastructure and market and behavioural failures that need to be addressed. High-quality fuel economy measurement information and testing data are common to all three policy instruments.
Executive summary
© O
EC
D/IE
A, 2
012

7Policy Pathway ImprovIng the Fuel economy oF road vehIcles
the provision of high-quality information on vehicle fuel economy to prospective vehicle purchasers should be central to any strategy to encourage improvements in fleet average fuel economy. Vehicle fuel economy labelling should draw the public’s attention to fuel efficiency and prompt changes in buyer behaviour, while increasing pressure on manufacturers to make more investments in technology development in this area. Labelling is a prerequisite to successful implementation of fuel economy standards and fiscal measures. The information should be clear and easily interpreted by customers, and available in vehicle showrooms as well as on the Internet. Different approaches to label design are available, and each has strengths and weaknesses outlined in this policy pathway. Countries that do not have vehicle certification and vehicle testing policies, should make use of internationally established testing and certification processes that best suit the supply chains that feed their vehicle markets, taking into account the applicability of one country’s test cycles to another country’s driving conditions.
Vehicle fuel economy standards are an important policy element to overcome market failures for most countries. Fuel economy standards require vehicle manufacturers to improve the fuel economy of vehicles to meet specified targets (either for individual models or as a corporate fleet average). Key elements of fuel economy standards include target values, measurement approach, monitoring and assessing compliance, and evaluation of policy effectiveness. Several technical approaches may be taken to designing fuel economy standards, and this policy pathway discusses the types and characteristics of different fuel economy standards for LDVs and HDVs around the world. Important considerations include the relationship to other aspects of vehicle performance such as safety policies, cost-effectiveness of the standards, likely market trends, and competitive neutrality among manufacturers. Fuel efficiency standards function more effectively when implemented as part of an integrated policy package including fuel economy labelling and fiscal measures.
Fiscal measures can have a strong influence on vehicle-purchasing behaviour. Fuel prices can have an important impact on the type of vehicles purchased and their use. Using fuel taxes, policy makers can encourage consumers to consider fuel economy when purchasing a vehicle. However, for reasons of social equity and political acceptability, policy makers may not be able to increase fuel taxes to the levels needed to effect a change in purchasing behaviour. Taxes at the point of vehicle purchase can also send a powerful signal to consumers to purchase more fuel-efficient cars. Many countries have realigned their vehicle tax systems to favour low-emitting or fuel-efficient vehicles, with strong impacts on the market for more fuel-efficient vehicles. Such measures can motivate manufacturers to improve fuel efficiency beyond the target values required in a fuel economy standard and induce consumers to purchase fuel-efficient vehicles. The challenge is to design the vehicle tax alignment with fuel efficiency in a way that is at least revenue neutral (if not revenue-raising, depending on the previous tax situation) vis-à-vis the old vehicle tax system so that government budgets do not lose revenue. In some countries without the technical capacity to enforce fuel economy standards or without domestic vehicle manufacturers, a combination of vehicle fuel economy labelling with fiscal measures may be the primary policy instruments to improve the fuel economy of the vehicle fleet.
a four-step plan for success
This publication proposes a policy pathway in four phases to support the development of policies to improve fuel efficiency of road vehicles. In particular,
© O
EC
D/IE
A, 2
012

8 Policy Pathway ImprovIng the Fuel economy oF road vehIcles
case studies of the EU passenger car CO2 emissions regulation and Japanese HDV fuel economy standards offer insights to the critical steps needed in implementing these kinds of policies. Every country setting has different policy contexts and political appetites for change, different infrastructure and vehicle stock dynamics. In particular, gathering sufficient information, carefully considering the design of policy options, and being realistic in terms of costs, timeframes, and technology level will enable governments to successfully implement fuel efficiency policies.
z Plan: this is the longest phase in developing fuel economy policies. In this phase, the public authority collects information on the status quo prior to policy making; selects the mix and scope of the fuel economy policies; secures resources; establishes the measurement method, target values and form of the fuel economy standards; and determines the design of the fuel economy labelling and fiscal measures.
z implement: public authority certifies and oversees vehicle fuel economy test values; vehicle manufacturers publish fuel economy results as labels and in other media; the public authority informs the public about fuel economy and the fiscal measures in place.
z Monitor: public authority monitors the data from certification and conducts audits to check for compliance with the fuel economy labelling and standards measures. The production vehicles are also checked to ensure the fuel economy matches that of the test vehicles.
z Evaluate: public authority analyses and assesses the compliance test data to check whether any enforcement proceedings are required; evaluates the impacts of the fuel economy policies; and if necessary, revises the policies to take account of developing technologies and policy design flaws or gaps.
Phases Critical steps
PlAn
Decide scope, type and schedule of policies
Decide measurement method
Secure resources
Design policies
IMPlEMEntCertify fuel economy
Make information accessible to public
MonItoRCheck compliance with fuel economy policies
Publish monitoring data
EvAluAtEEvaluate and enforce policies
Revise policies
table ES1 Policy pathway checklist for fuel efficiency policies
1
2
3
4
5
6
7
8
9
10
© O
EC
D/IE
A, 2
012

9Policy Pathway ImprovIng the Fuel economy oF road vehIcles
introduction
A reduction in fuel consumption in the transport sector is vital to realise low-carbon and energy-secure economies. The transport sector accounts for about a fifth of global final energy consumption (IEA, 2012b). Transport fuel consumption is also expected to continuously increase; if no further policies are adopted in the coming decades it is estimated that transport energy use could increase by up to 70% in 2050.2
However, under another scenario the average fuel consumption per kilometre of new LDVs could be halved through fuel economy improvements by 2030, using available, cost-effective technologies.3 Similar percentage improvements may be achievable for trucks. For cars, reaching a 50% cut in fuel consumption and CO2 emissions is consistent with targets that the IEA has established in co-operation with the Global Fuel Economy Initiative (GFEI).4
Improving the fuel economy of current internal combustion engine (ICE) vehicles is possible using already available cost-effective technologies but policies are needed to drive the deployment of fuel-efficient technologies. Considerable policy attention should be focused on this in the next decade, to start the necessary turn over of inefficient vehicle stocks while also developing the market for zero-tailpipe emissions vehicles (e.g. electric vehicles, fuel-cell vehicles).
This report is published in tandem with the technology roadmap: Fuel economy of road vehicles, which sets out the global targets and the portfolio of technologies available to reach target improvements for cars and trucks in the coming decades (Box 1). The policy pathway takes up from the last part of the technology roadmap, which outlines the policies needed to ensure deployment of fuel-efficient vehicles.
2. Estimates include passenger cars, freight trucks, buses, and powered two- and three-wheelers.
3. The Intergovernmental Panel for Climate Change estimates that CO2 emissions in 2050 must be halved compared with 2000 to limit the long-term global average temperature rise to between 2.0°C and 2.4°C.
4. More information on GFEI in Box 4.
Box�1 IEA�technology Roadmap:Fuel Economy of Road Vehicles
the Iea roadmap on fuel economy of internal combustion engines is part of the Iea series technology roadmaps. this roadmap explores the potential improvement of existing technologies to enhance the average fuel economy of motorised vehicles; the roadmap’s vision is to achieve a 30% to 50% reduction in fuel use per kilometre from new road vehicles (including 2-wheelers, ldvs and hdvs) around the world in 2030, and from the stock of all vehicles on the road by 2050. this achievement would contribute to significant reductions in ghg emissions and oil use, compared to a baseline projection. different motorised modes are treated separately, with a focus on ldvs, hdvs and powered two-wheelers. a section on in-use fuel economy also addresses technical and nontechnical parameters that could allow fuel economy to drastically improve over the next decades. technology cost analysis and payback time show that significant progress can be made with low or negative cost for fuel-efficient vehicles over their lifetime use. even though the latest data analysed by the Iea for fuel economy between 2005 and 2008 showed that a gap exists in achieving the roadmap’s vision, cutting the average fuel economy of road motorised vehicles by 30% to 50% by 2030 is achievable, and the policies and technologies that could help meet this challenge are already deployed in many places around the world.
© O
EC
D/IE
A, 2
012
10 Policy Pathway ImprovIng the Fuel economy oF road vehIcles
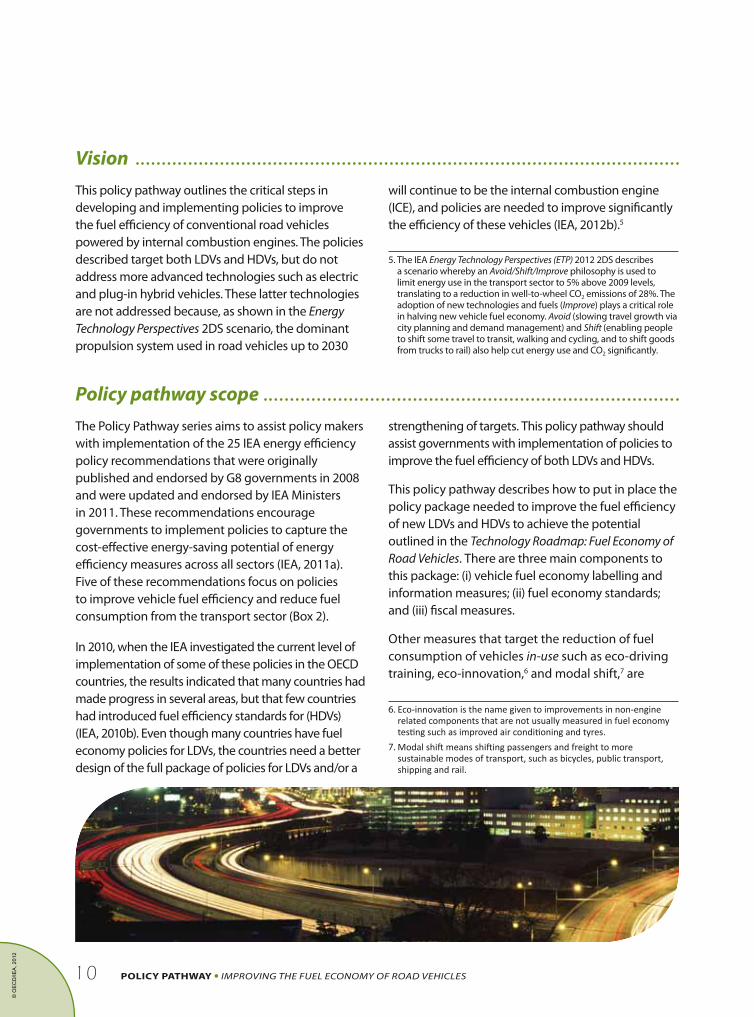
This policy pathway outlines the critical steps in developing and implementing policies to improve the fuel efficiency of conventional road vehicles powered by internal combustion engines. The policies described target both LDVs and HDVs, but do not address more advanced technologies such as electric and plug-in hybrid vehicles. These latter technologies are not addressed because, as shown in the energy technology perspectives 2DS scenario, the dominant propulsion system used in road vehicles up to 2030
will continue to be the internal combustion engine (ICE), and policies are needed to improve significantly the efficiency of these vehicles (IEA, 2012b).5
5. The IEA energy technology perspectives (etp) 2012 2DS describes a scenario whereby an avoid/shift/Improve philosophy is used to limit energy use in the transport sector to 5% above 2009 levels, translating to a reduction in well-to-wheel CO2 emissions of 28%. The adoption of new technologies and fuels (Improve) plays a critical role in halving new vehicle fuel economy. avoid (slowing travel growth via city planning and demand management) and shift (enabling people to shift some travel to transit, walking and cycling, and to shift goods from trucks to rail) also help cut energy use and CO2 significantly.
Vision�
Policy�pathway�scope�The Policy Pathway series aims to assist policy makers with implementation of the 25 IEA energy efficiency policy recommendations that were originally published and endorsed by G8 governments in 2008 and were updated and endorsed by IEA Ministers in 2011. These recommendations encourage governments to implement policies to capture the cost-effective energy-saving potential of energy efficiency measures across all sectors (IEA, 2011a). Five of these recommendations focus on policies to improve vehicle fuel efficiency and reduce fuel consumption from the transport sector (Box 2).
In 2010, when the IEA investigated the current level of implementation of some of these policies in the OECD countries, the results indicated that many countries had made progress in several areas, but that few countries had introduced fuel efficiency standards for (HDVs) (IEA, 2010b). Even though many countries have fuel economy policies for LDVs, the countries need a better design of the full package of policies for LDVs and/or a
strengthening of targets. This policy pathway should assist governments with implementation of policies to improve the fuel efficiency of both LDVs and HDVs.
This policy pathway describes how to put in place the policy package needed to improve the fuel efficiency of new LDVs and HDVs to achieve the potential outlined in the technology roadmap: Fuel economy of road vehicles. There are three main components to this package: (i) vehicle fuel economy labelling and information measures; (ii) fuel economy standards; and (iii) fiscal measures.
Other measures that target the reduction of fuel consumption of vehicles in-use such as eco-driving training, eco-innovation,6 and modal shift,7 are
6. �Eco-innovation�is�the�name�given�to�improvements�in�non-engine�related�components�that�are�not�usually�measured�in�fuel�economy�testing�such�as�improved�air�conditioning�and�tyres.
7. �Modal�shift�means�shifting�passengers�and�freight�to�more�sustainable�modes�of�transport,�such�as�bicycles,�public�transport,�shipping�and�rail.
© O
EC
D/IE
A, 2
012

11Policy Pathway ImprovIng the Fuel economy oF road vehIcles
Box 2
z Mandatory vehicle fuel efficiency standards
governments should adopt and regularly update fuel-efficiency standards for road vehicles.
Fuel-efficiency standards should:
a) Introduce and regularly strengthen mandatory fuel-efficiency standards for light-duty vehicles.
b) establish testing procedures for measuring fuel efficiency of heavy-duty vehicles and adopt fuel-efficiency standards for those vehicles.
c) harmonise or increase the comparability of vehicle fuel-efficiency test methods.
z Measures to improve vehicle fuel efficiency
In addition to mandatory vehicle fuel efficiency standards, governments should adopt measures such as labelling, incentives and taxes to boost vehicle efficiency and accelerate the market penetration of new efficient vehicle technologies.
measures should include:
a) vehicle fuel economy labels.
b) vehicle taxes to encourage the purchase of more fuel-efficient vehicles.
c) Infrastructure support and incentive schemes for very low co2-emitting and fuel-efficient vehicles.
z Fuel-efficient non-engine components
governments should adopt measures to reduce the negative impact on fuel efficiency of vehicle components, such as replacement tyres and mobile air-conditioning systems, that are often excluded from vehicle fuel-efficiency testing and requirements.
to improve the performance of non-engine components, governments should:
a) adopt new international test procedures for measuring the rolling resistance of tyres, and establish labelling and maximum rolling resistance limits for road-vehicle tyres.
b) adopt measures to promote proper tyre inflation levels. this should include mandatory fitting of tyre-pressure monitoring systems on new road vehicles.
c) Introduce energy efficiency requirements for mobile air-conditioning systems or include mobile air-conditioning systems’ energy efficiency in fuel-economy testing.
z Improving vehicle operational efficiency through eco-driving and other measures
governments should ensure that measures to increase the operational efficiency of light and heavy-duty vehicles, such as eco-driving, are a central component of government initiatives to improve energy efficiency and reduce co2 emissions.
governments should adopt a range of measures to improve vehicle operational efficiency, including:
a) making eco-driving a required element of driver training.
b) requiring manufacturers to provide in-car feedback instruments in new cars.
z Transport system efficiency
governments should enable policies that increase the overall energy efficiency of national, regional and local transport systems and promote shifts of passengers and freight to more efficient modes.
to achieve these objectives, government should adopt transport policies that ensure:
a) users pay the economic, environmental and energy security-related costs of the transport system.
b) the transport infrastructure necessary to support the most energy, economically efficient and environmentally benign transport modes is built and maintained.
c) urban and commercial development planning takes into account the likely implications for transport and energy demand.
Transport�sector�portion�of�IEA�25�Energy�Efficiency�Policy��Recommendations�in�2011
© O
EC
D/IE
A, 2
012
12 Policy Pathway ImprovIng the Fuel economy oF road vehIcles
Box�3
not within the primary scope of this report. The technical factors that affect in-use fuel economy and their potential benefits are covered in the technology roadmap: Fuel economy of road vehicles. More information on a wide range of fuel economy policies can be found on the Global Fuel Economy
Initiative (GFEI) web portal (see Box 4). This policy pathway describes the experiences of countries in implementing policies to improve the fuel efficiency of LDVs and HDVs, and outlines the critical steps for policy makers to design and implement fuel economy policies as a policy package.
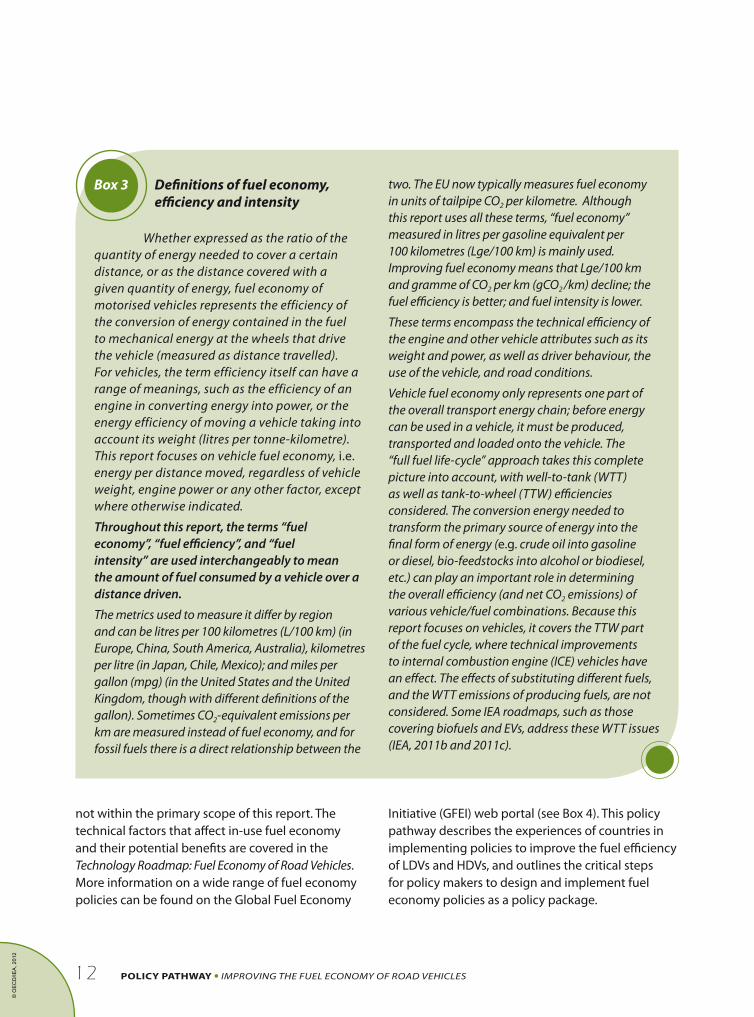
Definitions�of�fuel�economy,�efficiency�and�intensity�
Whether expressed as the ratio of the quantity of energy needed to cover a certain distance, or as the distance covered with a given quantity of energy, fuel economy of motorised vehicles represents the efficiency of the conversion of energy contained in the fuel to mechanical energy at the wheels that drive the vehicle (measured as distance travelled). For vehicles, the term efficiency itself can have a range of meanings, such as the efficiency of an engine in converting energy into power, or the energy efficiency of moving a vehicle taking into account its weight (litres per tonne-kilometre). this report focuses on vehicle fuel economy, i.e. energy per distance moved, regardless of vehicle weight, engine power or any other factor, except where otherwise indicated.
Throughout this report, the terms “fuel economy”, “fuel efficiency”, and “fuel intensity” are used interchangeably to mean the amount of fuel consumed by a vehicle over a distance driven.
the metrics used to measure it differ by region and can be litres per 100 kilometres (l/100 km) (in europe, china, south america, australia), kilometres per litre (in Japan, chile, mexico); and miles per gallon (mpg) (in the united states and the united Kingdom, though with different definitions of the gallon). sometimes co2-equivalent emissions per km are measured instead of fuel economy, and for fossil fuels there is a direct relationship between the
two. the eu now typically measures fuel economy in units of tailpipe co2 per kilometre. although this report uses all these terms, “fuel economy” measured in litres per gasoline equivalent per 100 kilometres (lge/100 km) is mainly used. Improving fuel economy means that lge/100 km and gramme of co2 per km (gco2 /km) decline; the fuel efficiency is better; and fuel intensity is lower.
these terms encompass the technical efficiency of the engine and other vehicle attributes such as its weight and power, as well as driver behaviour, the use of the vehicle, and road conditions.
vehicle fuel economy only represents one part of the overall transport energy chain; before energy can be used in a vehicle, it must be produced, transported and loaded onto the vehicle. the “full fuel life-cycle” approach takes this complete picture into account, with well-to-tank (Wtt) as well as tank-to-wheel (ttW) efficiencies considered. the conversion energy needed to transform the primary source of energy into the final form of energy (e.g. crude oil into gasoline or diesel, bio-feedstocks into alcohol or biodiesel, etc.) can play an important role in determining the overall efficiency (and net co2 emissions) of various vehicle/fuel combinations. Because this report focuses on vehicles, it covers the ttW part of the fuel cycle, where technical improvements to internal combustion engine (Ice) vehicles have an effect. the effects of substituting different fuels, and the Wtt emissions of producing fuels, are not considered. some Iea roadmaps, such as those covering biofuels and evs, address these Wtt issues (Iea, 2011b and 2011c).
© O
EC
D/IE
A, 2
012

13Policy Pathway ImprovIng the Fuel economy oF road vehIcles
Box�4 The�Global�Fuel��Economy�Initiative��
In march 2009, the Iea and three partner agencies – the International transport Forum (ItF), the united nations environment programme (unep) and the FIa Foundation, later joined by the International council on clean transportation (Icct) in 2012 – launched the global Fuel economy Initiative (gFeI). the initiative’s overall objective is to make all ldvs worldwide 50% more fuel-efficient by 2050 than average efficiencies in 2005. the initiative seeks to achieve this primarily by improving international understanding of the potential for greater fuel economy and the cost of achieving it, and by providing guidance and support in the development of policies to promote fuel-efficient vehicles. the initiative’s activities include:
z developing improved data and analysis on fuel economy around the world; monitoring trends and progress over time; and assessing the potential for improvement.
z Working with governments to develop policies that encourage greater fuel economy in the vehicles produced or sold in their countries; and
helping make policies more consistent across countries so as to lower the cost and maximise the benefits of improving vehicle fuel economy.
z Working with stakeholders, including car manufacturers, to better understand the potential for fuel economy improvement and soliciting their input and support in working towards improved fuel economy.
z supporting regional awareness initiatives to provide consumers and decision makers with the information they need to make informed choices.
a source of substantive information closely related to this policy pathway can be found in the gFeI tool kit, which provides practical guidance coupled with examples of auto fuel economy policies and approaches in use around the world. the toolkit can be found at:
www.unep.org/transport/gfei/autotool/
more information on the gFeI is available at: www.50by50campaign.org. a three-year work plan (2012-15) has been released, highlighting forthcoming analysis and activities.
© O
EC
D/IE
A, 2
012

14 Policy Pathway ImprovIng the Fuel economy oF road vehIcles
what policy package is needed to improve the fuel economy of road vehicles?
Significant fuel economy improvements in road vehicles can be realised with technologies that are currently available but not yet widely deployed. Policies are needed to scale-up the deployment of the most fuel-efficient technologies in road vehicles.
Public policy intervention to enable increased deployment of fuel-efficient vehicles is justified because the total societal benefits of more fuel-efficient vehicles significantly outweigh the costs of improvement.8 Even at an individual level, the increased cost of fuel-efficient technology is generally more than compensated by the fuel savings to the driver. However, barriers in the form of market and behavioural failures9 exist to the purchase of fuel-efficient vehicles and translate into a slow turnover of vehicle stocks compared to fuel supply price dynamics. To design effective policy packages for fuel-efficient vehicles, governments must understand the behavioural contexts and the market failures that the policies aim to address.
A first market failure occurs through lack of information on fuel economy, which makes it difficult for consumers to choose more fuel-efficient vehicles. Even with information available, if it is unclear and consumers do not understand the benefit, they cannot be expected to purchase fuel efficient vehicles or be motivated to pay additional costs for more fuel-efficient vehicles.
8. Societal benefits include climate change mitigation, fuel savings, energy security, and reduced air pollutant emissions.
9. Market failures arise when one or more of the conditions necessary for markets to operate efficiently are not met. In the context of vehicle fuel economy, a market failure would imply that more fuel is being consumed to drive a given distance than a rational allocation of resources would justify, in light of consumer and producer preferences. Imperfect competition, incomplete markets (incomplete property rights and externalities), imperfect information and asymmetric information are typical examples of market failures. Behavioural failure describes bounded rationality, among other things, where actors do not make choices rationally from the point of view of society, leading to sub-optimal outcomes for society.
A second market failure occurs when consumers have insufficient incentive to purchase fuel-efficient vehicles if fuel prices are kept too low (negative price externalities).
A third market failure relates to split incentives, where manufacturers pay the cost of developing new technologies, yet vehicle owners gain the fuel savings. Although vehicle manufacturers should be able to pass-through technology costs to the vehicle purchaser, they may not always be able to do so and still remain competitively priced. Also if manufacturers increase prices but purchasers do not value more fuel-efficient vehicles, manufacturers will lose market share. Awareness of this potential outcome reduces the motivation of manufacturers to invest in fuel-efficiency technologies.
Another barrier, which is not a market failure but is important nonetheless, relates to the uncertainty involving vehicle fuel economy, because the level of future fuel prices is difficult to predict. This uncertainty prevents consumers from precisely estimating the benefit gained by purchasing a fuel-efficient vehicle, even when the fuel efficiency of each vehicle is displayed. Fleet operators, for example, may not know, prior to purchase, how long and how much they would use vehicles, because they cannot anticipate future freight volume. Consumers cannot predict the future price of gasoline or gas oil. These uncertainties may encourage consumers to demand a shorter than necessary payback period or set too high a discount rate (Greene et al., 2009).10
10. The discount rate is an interest rate used in discount cash flow analysis. It reflects the idea that money available now is worth more than in the future because of interest rates and the risk associated with the future. The higher the discount rate, the less something is valued in the future. The payback period (PBP) is related to the discount rate; a higher discount rate leads to a shorter PBP. So if fuel economy has a high discount rate and a short PBP, this means that vehicle purchasers are only willing to pay for additional costs relating to the improved fuel economy if the fuel savings are high enough to pay back the additional costs in a short time.
Why�are�policies�needed?
© O
EC
D/IE
A, 2
012

15Policy Pathway ImprovIng the Fuel economy oF road vehIcles
What�are�the�elements�of�the�policy�package?
Policy intervention could address some potential behavioural failures. One behavioural failure involves the low priority that users of passenger vehicles give to fuel efficiency, even though fuel-efficient vehicles benefit consumers through reduced spending on fuel consumption (Greene et al., 2009). Consumers might not take fuel costs fully into consideration during vehicle purchase and be reluctant to pay additional costs for fuel efficiency improvement. There is evidence of high discount rates in vehicle purchasing in many countries where purchasers value the future fuel savings less than would be expected. This appears to be less important in developing countries (Duleep, 2012).
Regional differences exist in how vehicle purchasers value vehicle fuel economy. In developing countries, evidence suggests consumers value vehicle fuel economy more highly than in developed countries. In India, the Bureau of Energy Efficiency estimates that passenger car purchasers seek an average payback period of two to three years (Garg, 2012). This payback period is longer than in developed countries, because of the tighter budgetary constraint facing many
vehicle owners and a resulting greater value placed on fuel economy. In developed countries fuel economy is often viewed as only one possible characteristic among several such as safety or comfort.
Most commercial operators expect a payback of less than 18 months11 for the cost of fuel efficiency improvements for HDVs, even though commercial vehicles tend to be owned by the first purchaser for longer periods, such as eight years. Shorter payback periods are demanded when uncertainty around fuel prices is higher. Manufacturers in this case are not willing to invest in fuel-efficient vehicles with a longer payback period. Thus, even for HDVs, most of which are used as commercial vehicles, government intervention is essential to drive uptake of more fuel-efficient vehicles.
If government intervention is justified to require and encourage better fuel economy in vehicles, the challenge is to design policies and incentives that favour societal least-cost strategies.
11. Discussion between participants at IEA workshop on HDV fuel economy, Michelin Bibendum, Berlin, May 20-21, 2011.
The policy package needed to improve vehicle fuel efficiency comprises three main components which should be considered as policy options in an integrated vehicle fuel efficiency portfolio:
z information measures, i.e. vehicle fuel economy labelling and public awareness measures;
z vehicle fuel economy standards; and
z fiscal measures such as vehicle tax incentives, fuel taxes and user charges.
Theoretically governments should implement a combination of these three components; however, all three components are not appropriate in all cases. In most countries, fuel economy labelling and alignment of fiscal incentives with the labels should
be implemented. Fuel economy standards are most appropriate in countries with vehicle manufacturing and large markets that have the potential to influence the type of vehicles developed and brought to market.
A common element in all three components of the policy package is the measurement of vehicle fuel economy. Without reliable and replicable fuel economy testing and results, policies to improve fuel economy cannot be put in place. Policies are also needed that ensure good fuel quality (low sulphur levels) to enable use of the most advanced engines.
© O
EC
D/IE
A, 2
012

16 Policy Pathway ImprovIng the Fuel economy oF road vehIcles
vehicle fuel economy information and labelling
The provision of information on vehicle fuel economy is a crucial part of the policy package needed to improve the fuel economy of vehicles. Vehicle fuel economy labelling can influence vehicle purchaser behaviour and can also be a motivational tool for manufacturers to improve vehicle fuel efficiency beyond fuel economy standard target values.
Clear, relevant information on vehicle fuel economy enables vehicle purchasers to know the fuel economy performance of different vehicle models and/or understand the implications in terms of fuel costs. Both new and used vehicles can be affixed with fuel economy labels. Many countries have introduced labelling of fuel economy for new LDVs to encourage the public to value fuel efficiency and enable consumers to easily compare vehicles among different types and different brands. There are fewer examples of HDV fuel economy labelling; in Japan, HDVs already meeting the 2015 legal requirements display a fuel economy label signifying they are eligible for fiscal incentives, in the United States the voluntary SmartWay Technology programme awards the SmartWay label to HDVs meeting the programme
specifications. HDVs are very heterogeneous in their type and usage, and therefore, engine performance is normally listed without the full vehicle.
The term “labelling” is used here in the broad sense and describes the provision of a summary of the vehicle fuel economy performance used for raising industry and public awareness. This summary may be presented as an actual label, attached to the vehicle in car dealer showrooms, or a version of the “label” may be included more generally in any sales or advertising literature on vehicles in any communication medium.
Different approaches are taken to vehicle labelling in terms of the metrics, amount and type of information provided, and graphical presentation. A detailed discussion of the options in designing vehicle fuel economy labelling is provided in a recent study for the EU Commission (Brannigan et al., 2011). The design and policy options specific to European Union fuel economy labelling are summarised and reproduced in Table 1. These considerations are relevant for all countries looking at vehicle fuel efficiency policies.
table 1 Options in the design of fuel economy labels
Presentation Efficiency ratings Comparison method
z Decide format – e.g. follow the format of the label for white goods and tyres
z Minimum font size/dimensions z Standardised colours across a
region z Other design
z Ratings A-G z Stars/numerical scores z Continuous
z Absolute z Relative z Combination – can provide
both absolute and relative comparisons
Differentiation of vehicle types Updating the ratings Mandatory information
z None z Engine types z Fuel types
z Static z Dynamic
z Taxation z Annual running costs z Lifecycle running costs
Source: adapted from Brannigan et al., 2011.
© O
EC
D/IE
A, 2
012

17Policy Pathway ImprovIng the Fuel economy oF road vehIcles
Figure 1 Graphical rating label: UK car label
Vehicle fuel economy labels usually fall into one of three types, depending on how the information is provided:
z graphical rating from A to G, similar to white goods style labels (Figure 1) in relative or absolute terms;
z direct information disclosure, by providing the value of the CO2 emissions or fuel economy (Figure 2); or
z relative vehicle performance compared to the fuel economy standard (Figure 3).
Each approach has advantages and disadvantages. Although the rating-style label may provide a very clear message to vehicle purchasers, the metrics used may be unclear and even controversial, depending on how the ratings are awarded. Simple information disclosure may be more transparent but may be difficult for consumers to relate to. For this reason, many fuel economy labels include not only the fuel economy measured in testing but also the annual fuel costs associated with operating the vehicle. Portraying the vehicle fuel economy relative to the fuel economy standard may be useful for consumers to compare vehicles with each other, but is difficult for vehicle purchasers to understand the actual performance that can be expected from the vehicle.
Graphical rating labels. Eye-catching labelling can draw the public’s attention to fuel efficiency and add an environmentally-friendly expectation from purchasers for each vehicle (Figure 1). A rating-style label requires the policy maker to establish categories (usually A to G) for CO2 emissions or fuel economy, where a rating of A is awarded for the best-performing vehicle to G for the worst performing. Different criteria may be used to award this rating, and purchasers may not know the values behind the rating. The format of these labels is familiar to consumers in many countries, where they are also used to rate the energy performance of white goods. Such a label encourages people to compare vehicles in terms of fuel efficiency or environmental effects without any complicated calculation. In this method,
the colouring is important. The colour of the label for most fuel-efficient vehicles should be the one that most people associate with being eco-friendly.
Source: VCA, 2012.
The European Union has required passenger car CO2 emissions labelling since 2001 in all member states; however, member states are free to choose the design of the label.12 Many European countries have selected the graphical rating format.
12. EU Directive 1999/94/EC.
Fuel EconomyCO
2emission f gure (g/km)
Make/Model:
Fuel Type:
Engine Capacity (cc):
Transmission:
Fuel Consumption:
Drive cycle
Urban
Extra-urban
Combined
Litres/100km Mpg
Carbon dioxide emissions (g/km):Important note: Some specifications of this make/model may have lower CO
2emissions than this.
Check with your dealer.
* A new 1st year VED rate will be applied to vehicles registered for the first time on or after April 2010.
** The standard 12 month VED rate for all registered cars in this band is shown for the purposes of comparison. Note, figures quoted reflect the current rate only, and may be subject to change
in the future.
<=100<=100 AA
101-110101-110 BB
111-120111-120 CC
121-130121-130 DD
131-140131-140 EE
141-150141-150 FF
151-165151-165 GG
166-175166-175 HH
176-185176-185 II
186-200186-200 JJ
201-225201-225 KK
226-255226-255 LL
256+256+ MM
Environmental Information
A guide on fuel economy and CO2
emissions which contains data for all new passenger car models is
available at any point of sale free of charge. In addition to the fuel efficiency of a car, driving behaviour
as well as other non-technical factors play a role in determining a car’s fuel consumption and CO2
emissions. CO2
is the main greenhouse gas responsible for global warming.
VED band and CO2
Fuel cost (estimated) for 12,000 milesA fuel cost figure indicates to the consumer a guide price for comparison purposes. This figure is calculated byusing the combined drive cycle (town centre and motorway) and average fuel price. Re-calculated annually, thecost per litre as at Mar 2012 is as follows - petrol 139p, diesel 147p, LPG 74p.
VED for 12 monthsVehicle excise duty (VED) or road tax varies according to the CO
2emissions and fuel type of the vehicle.
Standard rate**1st Year rate*
To compare fuel costs and CO2
emissions of new cars,visit http://carfueldata.direct.gov.uk/
© O
EC
D/IE
A, 2
012

18 POLICY PATHWAY IMPROVING THE FUEL ECONOMY OF ROAD VEHICLES
The disadvantage of the graphical rating label is that it may not be very transparent and may even be controversial in some cases where the metric chosen can have a substantial impact on the rating awarded to each vehicle. In some cases the rating is awarded based on how the vehicle performs compared with vehicles in the same size class. This approach can lead to vehicles with higher absolute fuel consumption or CO2 emissions receiving a higher rating than others with lower values.
Graphical rating systems can be based on absolute or relative values of CO2 emissions or fuel economy. Absolute systems compare the CO2 or fuel economy value of the vehicle to all vehicles on the market. Relative systems compare the value only to other vehicles within the same vehicle class, i.e. to other vehicles similar in size. The consequences of rating a vehicle by different absolute and relative systems can lead to different ratings for the same vehicles in different countries (Table 2). For example, because Germany has introduced a weight-based (relative) rating system, heavier cars such as sport utility vehicles (SUVs) can receive the best rating compared with smaller vehicles, even though the SUV is the highest emitter of the vehicles listed.
An absolute CO2 or fuel economy scale for rating provides the clearest message to vehicle purchasers. Although information about the relative position of
the vehicle in its vehicle segment is useful, the overall fuel economy rating should not be awarded based on the relative position within a vehicle category. Ideally, a combination of both absolute and relative ratings information should be provided in a simple manner.
Direct information disclosure labels. These labels display the actual fuel economy and/or CO2 emissions values. An example of this system is the label used in the United States, where labels for passenger vehicles include the following information: fuel efficiency in the city mode, fuel efficiency in the highway mode, combined fuel efficiency, and estimated annual fuel costs with assumptions on annual mileage and fuel price (Figure 2) (EPA, 2012). The label also rates the vehicle in terms of fuel economy and air pollutant attributes contributing to smog. This label allows consumers to choose a vehicle by carefully considering the benefits. Consumers can easily compare the return on investment of a fuel-efficient vehicle, taking their individual driving conditions into account. Consumers who mainly drive in urban areas, for example, are able to focus on the fuel efficiency in the city mode, not the combined fuel efficiency. In this case, the fuel efficiency on the label should be as close as possible to the fuel efficiency on actual roads, so that consumers can accurately make a calculation.
Table 2 Vehicle CO2 label ratings in six European countries
Tested CO2 emissions (gCO2/km)
FranceUnited
KingdomBelgium Switzerland Germany Spain
Absolute values Relative values
Number of bins 7 13 7 7 7 7
Smart Fortwo MHD 98 A A A A C C
Ford Focus 1.6 TI-VCT 139 C E C B D A
Lexus RX450h 148 D F C A A A
Source: IEA analysis.
© O
EC
D/IE
A, 2
012

19Policy Pathway ImprovIng the Fuel economy oF road vehIcles
Source: EPA, 2012.
The Chinese label for vehicle fuel economy is another example of a direct information disclosure label. It displays three fuel economy values – for urban, good driving and congested city conditions – in litres per 100 km.
One disadvantage to providing such clear information on the fuel economy label is that, because a gap exists between the fuel economy tested on the chassis dynamometer (listed on the label) and that measured in real-life driving with air conditioning and other equipment, drivers may be misled by the difference. Thus, governments that adopt this kind of a label could consider modifying fuel efficiency information reported on the label to better reflect on-road fuel economy or at least advise consumers that their driving behaviour will affect the fuel economy they achieve. This modification could involve providing an indication of the difference between the tested value and the on-road fuel economy through collected data. The approach should be consistent for all vehicles, however, so that the comparability of chassis dynamometer testing is not compromised.
Another disadvantage to the provision of direct information is that, because consumers of passenger vehicles often do not set a high priority on fuel efficiency, they do not pay attention to
detailed information. They could, therefore, be annoyed to see a label with so many numbers.
Relative vehicle fuel economy performance labels. An alternative, simpler design is exemplified by the Japanese label, which is a voluntary label and is only awarded to vehicles with better fuel efficiency than the average for that vehicle class and is illustrated with one number (Figure 3). This type of label compares the vehicle to other similar vehicles in the same class and informs the public whether the vehicle has better fuel economy than the average for that class.
The label provides the public with an expectation that a vehicle with this label is good for the environment. The label, however, does not provide consumers with useful information on the relative fuel economy they can expect from that vehicle. Also with this method, although consumers can easily compare between vehicles with and without a label, they cannot easily compare among vehicles with a label.
Source: MLIT, 2010a.
Figure 2 Direct information disclosure label: US EPA fuel economy label
Figure 3 Relative vehicle performance label: Japanese fuel economy label
© O
EC
D/IE
A, 2
012

20 Policy Pathway ImprovIng the Fuel economy oF road vehIcles
Box�5
In summary, the choice of approach to labelling and the metrics used depends on the objectives of policymakers and can have a significant influence on the message given to consumers. If the objective is to improve fuel efficiency incrementally within a vehicle
class but without changing the proportion of vehicles sold in each vehicle class, policymakers can use vehicle labels with a rating based on the performance of the vehicle relative to other vehicles in the same vehicle class. This labelling can be confusing and
New�Zealand�fuel�economy�label�-�developing�a�rating�system�based�on�different�test�cycles
new Zealand does not have a vehicle manufacturing industry and imports new and used passenger vehicles. In 2007 a regulation was adopted that required from 2008 that all new cars, and all cars manufactured since 2000 and imported after February 2005 into new Zealand, must display information about the vehicle’s fuel economy when the vehicle is offered for sale. the regulation requires motor vehicle dealers to attach a fuel economy label to a vehicle when it is exposed for sale. Internet sales are also included with the fuel economy rating, in the form of text, being required for all internet sales including private sales.
new entrants to new Zealand’s light vehicle fleet are around 50% new and 50% second hand imported vehicles. new vehicle fuel economy information is based on tests on the european combined drive cycle, while imported used vehicles usually have been tested on the Japanese domestic drive cycle. due to the differences between the two test methods, new Zealand developed an algorithm to align the results of the two methods and to disclose the information in a common star rating format.
For new vehicles, the fuel economy value in litres per 100 km is disclosed on the label. used vehicles only have the star rating. another feature of the labelling scheme is the user-friendly way information is populated on websites. a seller only has to enter the vehicle plate number or chassis number or vIn number for the information to be automatically populated onto an advertisement. this demonstrates a practical low cost solution to fuel economy
labelling for countries without the vehicle testing and enforcement infrastructure to introduce a new test system. It could also be used as a model for countries introducing minimum fuel economy standards and related fiscal measures without developing a new driving cycle and certification system.
source: eeca, 2012.
Source: New Zealand Transport Agency, 2012. 13
13. http://labeling.fuelsaver.govt.nz/index.html
Figure 4 New Zealand fueleconomy label
*****************
**********
**************
*****************
© O
EC
D/IE
A, 2
012
21Policy Pathway ImprovIng the Fuel economy oF road vehIcles
misleading for consumers, however, because large, more fuel-consuming vehicles may be given a better rating than some smaller, more fuel-efficient vehicles, simply because they perform relatively better than vehicles of similar size in their class (see the German labelling example in Table 3).
In New Zealand and the United Kingdom, fuel economy labels are required on used as well as new vehicles. In the United Kingdom, fuel economy labels are displayed on vehicles manufactured since 2001, while in New Zealand they are required on cars imported since 2005 (see Box 5). Fuel economy labelling is important for used cars, as in many countries sales of used cars are much higher than new cars; for example in the United Kingdom, sales of used cars totalled 6.8 million while new cars amounted to 1.9 million in 2011. In New Zealand, fuel economy labels are developed using an algorithm allowing a comparison of test results using the European and Japanese driving cycles.
A combination of the direct disclosure method with a comparative rating is likely to be the most useful for vehicle purchasers. They provide purchasers with a rating for the vehicle fuel economy as well as clear information on the fuel economy or the running costs of the vehicle to better enable comparison between vehicles. Examples are the US EPA, United Kingdom and New Zealand labels (in Figures 1, 2 and 4).
Fuel economy standards
In countries where consumers do not value fuel economy highly when purchasing vehicles, the introduction of mandatory fuel efficiency standards is an effective way to improve vehicle fuel efficiency. These standards require manufacturers to improve the annual average fuel efficiency of new vehicles up to target values set by governments. Such standards have been implemented for LDVs, covering 70% of global emissions (ICCT, 2012). For example, the European Union introduced CO2 regulations for passenger cars that would reduce the average CO2 emissions of all new vehicles from 153 gramme per kilometre (g/km) in 2008 to 130 g/km by 2015 (EU, 2009). Standards for light commercial vehicles (LCVs) are also under
consideration in most OECD regions. Fuel efficiency standards for HDVs have been introduced only in Japan and the United States to date (IEA, 2010a).
Fuel economy standards typically set legal maximum limits for vehicle fuel use per kilometre of driving (or the inverse – kilometres or miles per litre or gallon) tested over a driving test cycle. Vehicle fuel economy standards historically have not been set as individual vehicle minimum energy performance standards, as is the case for appliances and equipment, where every product sold must meet the minimum standard. As described in more detail in the technology roadmap: Fuel economy of road vehicles, the fuel efficiency of each vehicle is affected by various factors, such as vehicle weight, engine size, aerodynamics, and tyre-rolling resistance. Although some air pollutant emissions can be removed through a technical solution such as a catalytic converter, the reduction in fuel consumption and the related reduction in CO2 is more directly related to the physical vehicle and engine characteristics. The fuel efficiency of heavier, larger vehicles is worse than that of lighter vehicles with the same technologies. Therefore fuel economy standards are set as a fleet-wide average for each manufacturer to allow for a mix of vehicle types on the market. The US CAFE (corporate average fuel economy) standards are one of the most recognised versions of this policy.
This approach gives substantial flexibility to manufacturers in achieving the target, because they can choose whether to meet their target value through significantly improving the fuel efficiency of certain kinds of vehicles or through improving most vehicles’ fuel efficiency by a small amount. Mandatory standards encourage manufacturers to prioritise the improvement of fuel efficiency in vehicle development. Standards also address market failures described earlier, including split incentives and high discount rates for vehicle purchasers, by obliging all manufacturers to meet a minimum standard of fuel efficiency of vehicles sold. A comparison of fuel economy standards for LDVs and HDVs worldwide shows an array of different target values, fuel economy units, test methods, and scope (Tables 3 and 4).
© O
EC
D/IE
A, 2
012

22 Policy Pathway ImprovIng the Fuel economy oF road vehIcles
Country or region
Target year
Standard type
Unadjusted fleet target/
measureStructure
Targeted fleet
Driving test cycle
United States/California (enacted)
2016 Fuel
economy/GHG
34.1 mpg** or
250 gCO2/mi
Footprint-based***** corporate average
Cars/Light trucks
United States test combined cycle
United States (Supplemental Notice of Intent)
2025 Fuel
economy/GHG
49.6 mpg*** or
163 gCO2/mi
Footprint-based corporate average
Cars/Light trucks
United States test combined cycle
Canada (enacted)
2016 GHG 153 (141)****
gCO2/km Footprint-based corporate average
Cars/Light trucks
United States test combined cycle
European Union (enacted)European Union (proposed)
20152020
CO2 130 gCO2/km95 gCO2/km
Weight-based corporate average
Cars/SUVs New European Driving cycle (NEDC)
Australia (voluntary)
2010 CO2 222 gCO2/km Fleet average
Cars/SUVs/light
commercial vehicles
NEDC
Japan (enacted)Japan (proposed)
20152020
Fuel economy
16.8 km/L20.3 km/L
Weight-class based corporate average
Cars Japanese test cycle JC08
China (proposed)*
2015 Fuel
consumption 6.9 L/100 km
Weight-class based per vehicle and corporate average
Cars/SUVs NEDC
South Korea (proposed)
2015 Fuel
economy/GHG
17 km/L or 140 gCO2/km
Weight-based corporate average
Cars/SUVs United States test combined cycle
table 3 Global snapshot of LDV fuel economy (as of August 2011)
Source: adapted from ICCT, 2012a,““Global Comparison of Light-Duty Vehicle Fuel Economy/GHG Emissions Standards”.
* In China the State Council has recently approved a plan that would tighten the fuel economy standards in 2015 to 6.9 L/100 km and in 2020 to 5.0L/100 km (State Council, 2012).** Assumes manufacturers fully use A/C credit.*** Proposed CAFE standards by NHTSA.**** In April 2010, Canada announced a target of 153 g/km for MY 2016. Fuel economy in brackets is estimated target for 2016, assuming that during 2008 and 2016 the fuel efficiency of the LDV fleet will achieve an annual improvement rate of 5.5% (the same as the United States). ***** Footprint-based means that the fuel economy standard is based on the size of the vehicle: the product of the vehicle track width and the wheelbase (distance between the two axes).
© O
EC
D/IE
A, 2
012

23Policy Pathway ImprovIng the Fuel economy oF road vehIcles
Mandatory fuel efficiency standards help to develop and maintain a level playing field among manufacturers, as all are required to meet a fuel economy target. This is especially important for manufacturer innovation and the creation of new efficiency solutions. Manufacturers should be able to rely on the set up of the market to adopt new solutions, and rest assured that others will not increase their market share by producing cheaper, poor performing vehicles. Under voluntary agreements, if one manufacturer decides to ignore fuel efficiency to maximise profits, other manufacturers are forced to follow suit so as not to lose their competitiveness in the market (Box 6). Fuel economy regulations provide more
certainty to policymakers about vehicle fuel economy; however, their design, stringency, and form determine how much improvement in fuel economy is actually achieved. Mandatory fuel economy standards provide regulatory certainty to manufacturers, which is important because manufacturers take approximately ten years to develop a brand-new vehicle (Bastard, 2010). If these standards are compared to fiscal policy instruments such as taxes based on CO2 values or fuel efficiency, it is evident that fuel economy standards are more likely to be fixed for longer periods. Because of various restrictions, including the necessity to make revenue stable, governments cannot determine the tax rate for a long period. The fiscal incentives in
table 4 Global snapshot of HDV fuel economy standards
Source: ICCT, 2011.
Note: green text illustrates planned schedule.
Country or region
Regulation type
2010 2011 2012 2013 2014 2015 2016 2017 2018
Japan Fuel EconomyRegulation implemented
starting MY 2015
United States
GHG/Fuel efficiency
Standard proposal
Final ruleRegulation implemented
starting MY 2014 (mandatory DOT programme starts 2016)
CanadaGHG/Fuel efficiency
Standard proposal
Final ruleRegulation implemented
starting MY 2014
ChinaFuel
consumption
Test procedure finalised
Industry standard proposal
Standard proposal
Final ruleRegulation implemented
starting MY 2015
European Union
GHG Technical studiesTest
procedure finalised
Mandatory efficiency reporting and regulator development
CaliforniaEnd-user purchase
requirements
Requirements for tractors and trailers
(MY 2011+)
Additional requirements for existing tractors and trailers (<MY 2010)
Additionalrequirements
for existing tractors and
reefers (<MY 2010)
© O
EC
D/IE
A, 2
012

24 Policy Pathway ImprovIng the Fuel economy oF road vehIcles
EU�experience�with�passenger�car�CO2�emissions�voluntary�agreements
the european commission’s decision to change its co2 regulation for automobiles from a voluntary agreement to mandatory standards indicates the limitations of voluntary agreements. although the european automobile manufacturers’ association (acea), the Japan automobile manufacturers’ association (Jama), and the Korean automobile manufacturers’ association (Kama) committed to achieving a target of 140 gco2/km emissions for the average new passenger vehicle sold in the european union by 2008/09, they did not achieve this goal. From 2000 to 2008, the average co2 emission decreased only from 172 gco2/km to 153 gco2/km. Based on this result, in 2007, the european commission recognised the limitations in progress on co2 emission reduction with voluntary commitments. In 2009, the european commission adopted a mandatory regulation: “setting emission performance standards for new passenger cars as part of the community’s integrated approach to reduce co2 emissions from light-duty vehicles” (eu, 2009).
Box�6
Japan, for example, have been amended every two or three years. As a consequence, manufacturers are more likely to focus on short-term investment for improving fuel efficiency in a superficial manner according to the amendment of tax rates. Therefore forward-looking fuel economy standards are needed, which can motivate manufacturers to achieve mid- and long-term technology innovation (Anderson et al., 2010).
Fuel economy standards have several weaknesses that should be addressed by complementary policies
such as fuel economy labelling and fiscal measures. First, standards may not be appropriate in some countries (Box 7). Second, unless the standards are stringent and well designed, fuel economy improvement may not actually occur as a result of the policy. When fuel economy standards are based on political expediency or are blocked by strong interest groups, the targets may be set at the most feasible level rather than the optimal level necessary to meet an overall energy consumption reduction strategy. Sometimes there may be a temptation to design fuel economy standards that favour the national car industry. Trade-offs are often necessary between economic efficiency and political feasibility in determining the policy implemented. Thirdly, even when fuel economy standards are set to an ambitious level, they cannot motivate manufacturers to improve fuel efficiency more than target values. Complementary policies are necessary to encourage manufacturers to introduce more advanced vehicles to the market.
© O
EC
D/IE
A, 2
012

25Policy Pathway ImprovIng the Fuel economy oF road vehIcles
Governments will implement fuel economy standards for cars or trucks most effectively when they design them using the dominant international testing practices that shape the vehicle supply chains in their markets. The characteristics of each policy element and the current policy and
market context in their country must be factored in when establishing fuel economy standards. The policymaker needs to decide both the level of the fuel economy standard and the type of approach to be taken. The next sections describe different approaches to setting the standard.
Box�7 Considerations�for�small�countries�and�those�without�vehicle�manufacturers
government intervention for the improvement of fuel efficiency is essential in all countries. In small market countries, however, particularly those without vehicle manufacturers, a fuel economy standard may not be the most appropriate policy measure to improve the fuel efficiency of the vehicle fleet.
one reason is that non-manufacturing and small countries have less technical capacity to test vehicles, and therefore, will have difficulty developing and enforcing any fuel economy standards. a fiscal measure with the accompanying vehicle labels would be simpler to implement and administer. even though testing is required to establish vehicle labels, countries could use an existing certification system from another country to provide labels for each vehicle sold.
another reason is that non-manufacturing countries tend to be technology takers and may have little influence on the vehicle technologies developed by manufacturers. the main advantage of fuel efficiency standards is to allow manufacturers to make a mid- or long-term plan for research, development and production decisions. a small country and one without manufacturers is not likely to drive technology decisions and product development strategies for manufacturers.
there is even a risk that manufacturers will pull products from the market in small countries rather than adapt to the standards. however, well-designed fuel economy standards may still be worthwhile to ensure that imported vehicles at least meet a minimum threshold of fuel economy performance.
thus, the introduction of fuel economy labeling (see the new Zealand example in Box 5), combined with measures such as the introduction of sliding-scale vehicle taxes or fee/rebate (“feebate”) systems based on rated fuel economy or co2 emissions could be sufficient for countries without manufacturers to give strong incentives to consumers to purchase the most efficient vehicles on the market.
In choosing a policy instrument, the following points should be considered. does the country have the technical capacity to set and enforce fuel economy standards? If yes, then standards can be put in place, preferably aligned with test procedures and standards already existing in other countries. the corresponding fiscal and information measures should still be implemented to ensure that lower-emitting vehicles sell. If the technical capacity does not exist, then clear fuel economy labeling combined with the good design of vehicle taxes based on the co2 emissions or fuel economy values can have a strong influence on ensuring manufacturers deliver better vehicles to the market.
© O
EC
D/IE
A, 2
012

26 Policy Pathway ImprovIng the Fuel economy oF road vehIcles
Form of the standard
The form of the standard includes approaches to the design of fuel economy target values, the stringency of the target, the timing of introduction, and compliance issues.
Fuel economy standards are mainly set as fuel economy targets based on the average of the total fleet of vehicles sold (sometimes called CAFE). Fleet-average fuel economy standards provide flexibility to manufacturers to achieve the target across the sales mix rather than with each individual vehicle sold. The targets for both LDVs and HDVs are calculated based on each vehicle’s fuel economy weighted by its sales volume. Within this general approach are two main categories of possible approaches to the way standards are set:
z absolute target value across all vehicles and all manufacturers regardless of size, weight, etc. of the vehicle fleet. This value may be represented as:
z a single target for all manufacturers; or
z a uniform percentage improvement for all manufacturers. In this case each manufacturer would have a separate target.
z attribute-based target values across all vehicles for each manufacturer, where the target varies depending on the average weight or size of the vehicles sold by a manufacturer. The different ways to align the targets with vehicle attributes are:
z continuous function or curve: target values are estimated as a continuous function of vehicle attributes.
z target value in each category: where vehicles are separated into discrete categories by vehicle attribute and manufacturers must meet separate standards for their vehicles in that category – i.e. no corporate averaging across categories but within each class.
China is a notable exception; Chinese fuel economy standards set maximum fuel consumption for each vehicle per weight class (Figure 5). Heavier
vehicles are permitted to have worse fuel economy than lighter vehicles. Three phases of standards have entered into force in China for automatic and manual transmission cars (in force 2005, 2008, 2015 for Phases 1, 2, and 3 respectively). China chose a weight-based limit-value approach for several practical reasons. During the time of the creation of the fuel consumption standards, the Chinese car market was highly fragmented, with more than 100 manufacturers, many offering only one or two models, which would make a fleet-average approach redundant. In addition, as vehicle sales figures in China have historically been kept secret, a sales-weighted average value is difficult to estimate. Every vehicle manufactured is required to meet the standard for its weight class without exceptions or a credit system to allow vehicles that exceed compliance to offset those that do not (Wagner et al., 2009). Concern has arisen that a shift to heavier vehicles is underway in China and that the system of less stringent fuel economy targets for heavier vehicles assists this process (ICFI, 2009; Eads, 2010). Phase 3 standards will be based on a fleet-average standard system.
absolute target values
A fixed target value for fuel economy that is not based on any vehicle attribute is set for each manufacturer.
Single target value
This approach imposes the same fleet target value on all manufacturers. Each manufacturer has to improve the average fuel efficiency of the vehicles they sell up to the target value. For over three decades (since 1975), this option was used in the United States for LDVs, although it has recently been changed to an attribute-based approach. The advantage of the single-standard approach is to ensure the improvement of the average fuel efficiency of each company’s fleets, and thereby the total fleet, regardless of a possible shift in the sales mix over time.
© O
EC
D/IE
A, 2
012

27Policy Pathway ImprovIng the Fuel economy oF road vehIcles
Phase III(corporate
averagestandard)2012-15
Phase II(limit
values)2006-09
Phase I(limit
values)2004-05
Figure 5 Chinese fuel economy standards for new LDVs
Source: ICCT, 2012b.
Note: from 2016 there is no differentiation between manual and automatic transmission vehicles.
Uniform percentage improvement
This approach requires each manufacturer to improve its fleet-average fuel efficiency by the same percentage rather than meet the same numerical target. This method can be applied to all the manufacturer’s sales or could be applied to each category for a category-based attribute standard (see next subsection). This option ensures significant improvement from all manufacturers, regardless of their starting point or relative position in the market.
attribute-based target value
This approach imposes an individual target value on each manufacturer according to a vehicle attribute such as the average weight or size of its vehicles. This option has been adopted for LDVs in several countries and regions, including Japan, the European Union and the United States.
Target values by continuous function or curve
In this approach, a continuous function (or a limit or target curve) is derived that describes the relationship between CO2 emissions or fuel economy and a vehicle attribute. The fuel economy target for each manufacturer is determined from the sales-weighted average of the attribute.
In the European Union, for example, the target value of each manufacturer is determined based on the average weight (mass) of the vehicles that it sells, weighted by the sales of each model. In the EU scheme, the manufacturer’s targets shift depending on the vehicle weight, according to a pre-defined fleet-average vehicle weight versus fuel economy “target value curve” (Figure 6). The slope of this curve is the key factor in determining whether an incentive exists to sell heavier vehicles. A relatively flat curve means that heavier vehicles are not given much leeway with their targets.
© O
EC
D/IE
A, 2
012

28 Policy Pathway ImprovIng the Fuel economy oF road vehIcles
Target values in each category
In this approach, governments establish categories (or “bins” as commonly called) based on a particular vehicle attribute. They then set target fuel economy values in each category by equalising marginal fuel economy improvement costs across all categories and require manufacturers to meet target values in all categories.
Japan has introduced this option with regard to both LDVs and HDVs (Figure 7). If marginal emission abatement costs are equal in each vehicle category, this system can be fair and cost-effective. Japan sets target values according to vehicle weight for LDVs and gross vehicle weight for HDVs (METI and MLIT, 2007). The new United States Corporate Average Fuel Economy standards are based on vehicle footprint size.
Comparison of different standard forms
Single-target value and uniform percentage improvement schemes can be perceived to discriminate between manufacturers. In the single target value scheme, manufacturers selling larger or heavier (and typically less fuel efficient) vehicles must make greater changes to meet a
given standard.14 The same target value for all manufacturers would impose higher marginal compliance costs on manufacturers selling larger vehicles. Economic theory would suggest that, to be economically efficient, a policy should be designed so that all actors face equal marginal abatement costs. In this regard a single target value could cause inefficiency (Anderson et al., 2010).
Uniform Percentage Improvement (UPI) schemes could be unfair for manufacturers that have already made significant efforts to improve fuel efficiency, because they would have to spend additional resources (possibly with higher marginal abatement costs) for further improvement of fuel efficiency than manufacturers that have made few efforts previously. Under this scheme, if new manufacturers enter a market, governments may be challenged to decide a target value for new manufacturers that do not have a known (base year) average fuel efficiency. The advantage of single-target approaches is that the target is simple to communicate and provides few loopholes.
14. The average fuel efficiency of manufacturers selling mainly small vehicles should normally be better than that of manufacturers selling mainly large vehicles even when manufacturers have the same technology level, because fuel efficiency is inversely proportional to an increase in vehicle weight.
Figure 6 Attribute-based continuous target value curve (European Union)
Vehicle weight
Average CO emissions2
Target value
Current trend
CO
va
lue
2
130 g/km
160 g/km
1 372 kg(Average vehicle weight
of all new vehicles)
This graph shows the limit value curve of
fuel efficiency standards for passenger
vehicles in the European Union. The target
value varies according to the average
vehicle weight of each manufacturer. If a
manufacturer’s average vehicle weight is
2 000 kg, for example, the target value of
CO emissions is 157 g/km.2
This curve pursues the goal that the fleet
average CO emissions of all new vehicles
will be less than 130 g/km. The target value
of a manufacturer whose average vehicle
weight is 1 372 kg is 130 g/km, because
when this curve was set, the average vehicle
weight of all new vehicles was 1372 kg.
The slope is set for creating an incentive
to reduce vehicle weight. The regulation
of the European Commission is described
in detail in the annex (EU, 2009).
2
© O
EC
D/IE
A, 2
012

29Policy Pathway ImprovIng the Fuel economy oF road vehIcles
Figure 7 Target value in each category (Japan)
25
20
15
10
5
0
500 700 900 1 100 1 300 1 500 1 700 1 900 2 100 2 300 2 500
Fue
leco
no
my
(km
/L)
Vehicle weight (kg)
Vehicle weight (kg)
Fue
leff
icie
ncy
1 1951 081 1 310
Target value
Manufacturer B
Manufacturer A
Attribute-based schemes can provide greater fairness among manufacturers compared with a single-value target, because the targets are linked to a particular vehicle attribute. Regardless of the average weight or size of their vehicles, manufacturers with the same technology level are required to make similar efforts to improve fuel efficiency, with similar marginal compliance costs. A list of possible attributes is detailed later on in the “How to” section under step 4. design policies.
One of the main drawbacks of attribute-based systems is that the average fuel economy of new vehicles can still increase if the vehicle sales mix shifts towards bigger and/or heavier vehicles. For both continuous-curve and category-based standards, company targets must be based on a previous year’s fleet attributes. If the standard for each company shifts each year because the vehicle fleet attributes have changed, very little certainty would exist regarding the total fleet-average fuel economy. It could also implicitly encourage manufacturers to increase the size or weight of vehicles to take advantage of less stringent targets. An example of the risks associated
with attribute-based targets is demonstrated in the EU CO2 emissions regulation. The target for the whole European fleet is 130 g per km (g/km), and a continuous-curve has been established that would deliver that target if the average vehicle mass remains at 1 372 kg. If cars become heavier than this value, then the standards that the companies are required to meet based on the curve is collectively higher than 130 g/km. The solution is to fix the standard based on an historical average weight of vehicles for the purpose of calculating the emissions target.
The main difference between attribute-based continuous curves and category-based standards is flexibility. Continuous curve-based standards can give more flexibility to manufacturers, allowing them to improve fuel efficiency more cost-effectively. Category-based standards tend to require each manufacturer to improve the fuel efficiency of vehicles in each category. This scheme could cause inefficiency in terms of improvement of average fuel efficiency, because it may not be cost-effective for manufacturers to improve their fuel efficiency in categories where fuel economy-improving technologies may not be
© O
EC
D/IE
A, 2
012

30 Policy Pathway ImprovIng the Fuel economy oF road vehIcles
available. Improvement of average fuel efficiency would thus be more costly than under a continuous curve standard. For category-based standards, target values need to be determined based on detailed technology analysis to equalise marginal abatement costs among categories. As a result, the costs for government developing these standards may be greater than under an attributed-based approach.
Some inequalities or loopholes may exist depending on how the target value curve is set for the continuous curve scheme, or if differences exist in applicable technologies and marginal costs for improving fuel efficiency along the curve.
In a comparison of different options for design standards, the attribute-based continuous curve design probably provides the best option to leave enough flexibility for manufacturers while ensuring the target is reached (Table 5).
The disadvantage of the single-target value and uniform percentage improvement (UPI) is more difficult to alleviate. These options could cause unfairness among manufacturers and cost-ineffectiveness. Given that fuel efficiency standards may require manufacturers to invest substantial fiscal and human resources in fuel efficiency improvement, fairness among manufacturers an important issue. In general, attributed-based and category-based standards seem more reasonable options than single-target value and uniform percentage improvement.
Stringency of the target
Setting the target value to be reached can be difficult because the policy maker must find a balance between the interests of society in delivering an improvement in vehicle fuel economy and cost-effectiveness for both the regulator and for industry (Box 8). Benefit-cost analyses can give
Single target value Attribute-based
Absolute values UPI Continuous curve Categories
Certainty of improvement of average fuel efficiency of all fleets
Certain Certain Relatively certain* Uncertain(increase in average vehicle weight or size will possibly worsen average fuel efficiency)
Fairness Unfair (because of difference in sales mix of each manufacturer)
Potentially unfair(because of difference in previous efforts of each manufacturer)
Fair(takes account of sales mix of each manufacturer)
Fair(takes account of sales mix of each manufacturer)
Flexibility for manufacturers to choose methods for the improvement of fuel efficiency
Good Good Good Limited(in case where narrow range of technologies available)
* Only true under the conditions that it is based on historical attributes and the base year for attributes is not updated regularly.
table 5 Characteristics of different options for fuel efficiency standards
© O
EC
D/IE
A, 2
012

31Policy Pathway ImprovIng the Fuel economy oF road vehIcles
quantitative estimates of the relative societal and individual benefits of improved fuel economy and the costs of the standard to the regulator and manufacturers for different stringency levels of the target. Consultation with both industry and civil society is useful to gain insights into the feasibility and impacts of different target levels.
It a target is too stringent, some manufacturers may face high costs, which may cause a reduction of competitiveness and perhaps ultimately a loss in jobs. This occurs when vehicle purchasers do not fully value the savings from fuel-efficient technology and manufacturers bear a significant portion of the incremental costs of new technology. Ideally, the costs of the additional technology should be passed through to the vehicle purchaser and then recouped through fuel savings from the vehicle in operation during its lifetime use.
Conversely, if the target is weak, energy security and environmental goals will not be met. A restructuring of the industry towards the development and manufacture of more fuel-efficient vehicles will not happen, and energy consumption will not be reduced in the long term either.
A carefully staged approach that gives manufacturers longer term certainty on testing standards and fuel efficiency stringency levels while achieving durable progress toward efficiency targets is preferable to a too lax or too aggressive policy pathway. The essence of good policy design here is in getting the balance between certainty and progressive change just right.��
Timing
In many cases, fuel economy standards should be introduced as a phased process. Less stringent targets may be introduced initially in the near term,
Design�features�of�standards�to�improve�flexibility�and�effectiveness
several features can be included in the design of fuel economy standards to increase manufacturer flexibility and, therefore, increase cost-efficiency for manufacturers. one such feature is to allow banking of credits between years. manufacturers that surpass their targets in a given year can bank the fuel economy credits and use them in a later model year. this feature is usually limited to about three years. Banking encourages early investment in fuel economy, but should be carefully monitored so that the stringency of the target is not diminished.
Fuel economy credit trading permits manufacturers to trade, i.e. sell and purchase, fuel economy credits between each other. this mechanism enables the equalisation of marginal abatement costs across the standards so that manufacturers with higher technology costs
can purchase credits from manufacturers with lower costs. again, careful monitoring is required to ensure that the integrity of the standards is not lessened and that competition between manufacturers is not distorted.
another feature considered by policy makers is the introduction of super credits for vehicles with new or advanced technology. For example in the european union co2 emissions regulation, car manufacturers are awarded extra credits for vehicles emitting less than 50 gco2/km, i.e. 1 low-emitting vehicle is counted as 3.5 vehicles in 2012, 2.5 cars in 2014, and 1.5 cars in 2016. this feature can stimulate the market for more advanced technologies at an early stage. careful consideration is needed, because market distortion may occur if some technologies are favoured over others. also, if too many additional credits are awarded for advanced vehicles, the fuel economy targets for the rest of the vehicle fleet may be substantially weakened.
Box�8
© O
EC
D/IE
A, 2
012

32 Policy Pathway ImprovIng the Fuel economy oF road vehIcles
and more stringent targets announced with sufficient lead time to enable manufacturers to develop more advanced vehicles and gain experience with their production. Regulators may also need to build capacity and resources to be able to implement the fuel economy standards.
Given that the cycle of vehicle model change is typically about 4 to 5 years for LDVs (METI and MLIT, 2007) and 5 to 10 years for HDVs (METI and MLIT, 2006), a lead time of 6 to 10 years for LDVs and 7 to 15 years for HDVs may be required to set more stringent, long-term targets. Such a timeframe allows manufacturers to change all vehicle models at least once. Such sufficient lead-time aligns with one important purpose of the fuel efficiency standards, i.e. to encourage manufacturers to develop mid- or long-term plans. Shorter timeframes can be used for less stringent, phase-in targets.
Recent examples of fuel economy target-setting in Australia, the United States and the European Union have shown that shorter-term, less-stringent targets can be set much sooner, nearer three years. In addition, policymakers should also take into account amendments to other related regulations regarding other emissions, such as nitrogen oxide (NOx) policies, which also affect fuel efficiency when timing a fuel economy regulation. Consultation with manufacturers and stakeholders is important to determine any concerns.
Compliance
Governments need to check manufacturer compliance in meeting standards and impose penalties for non-compliance. The penalties for non-compliance effectively provide a maximum value for the amount that manufacturers will be willing to invest in improving fuel economy. If the penalty is low, manufacturers may choose not to comply and simply pay the fine. Governments must also continuously monitor the improvement of average fuel efficiency and the shift of sales mix in the market and set new target values and adopt new
schemes, if necessary. Compliance is increasingly an international issue where countries with the same test regimes can exchange vehicle test results.
Fiscal measures
Fiscal measures represent the third component of the policy package to improve the fuel economy of road vehicles. Typical fiscal measures include vehicle taxes, fuel taxes and user charges (i.e. road pricing), and are used to influence the types of vehicle purchased and their use by consumers through price signals. Because user charges more directly affect the use of the vehicle rather than the fuel efficiency of the vehicle itself, they are not included in the main scope of this work.
Vehicle taxes
Most countries require taxes to be paid by vehicle owners, either annually or at the time of purchase. Vehicle taxes can be aligned with fuel efficiency or CO2 emissions values of vehicles to make fuel-efficient vehicles more fiscally attractive, strongly encouraging consumers to buy such vehicles and requiring manufacturers to improve their fuel efficiency. In the current economic context, policy makers have to take the overall state of public finances into account when deciding whether to introduce new tax incentives. One advantage of vehicle tax incentives is that they are relatively easy to adopt at no extra cost, if they are designed properly and if vehicle taxes are already implemented.
In the past, vehicle taxes were based on vehicle technical characteristics such as engine capacity or power, vehicle mass, or a combination of the three. Over the last five years, however, many countries have switched their vehicle tax system to be based on vehicle CO2 emissions and/or fuel economy (Table 6). This focus provides direct fiscal incentives to more fuel-efficient vehicles that can encourage manufacturers to accelerate the improvement of fuel efficiency and motivate the public to purchase such vehicles.
© O
EC
D/IE
A, 2
012

33Policy Pathway ImprovIng the Fuel economy oF road vehIcles
Vehicle taxes in many countries in Europe are directly linked to vehicle CO2 emissions, while in Japan vehicle owners to pay taxes based on a vehicle’s fuel efficiency level compared to target values for each vehicle class. Vehicle tax policies in China and India are less directly linked to CO2 emissions and fuel economy and both countries
primarily link vehicle taxes to vehicle engine size. In the United States, vehicle tax disincentives in the form of the Gas Guzzler taxes only apply to a very limited number of models in the market (ICCT, 2012), however tax incentives may be available for advanced vehicle technologies such as hybrid and electric vehicles in some states.
table 6 Vehicle tax schemes based on fuel efficiency or CO2 emissions
Country Name of tax Frequency CO2 or fuel efficiency Comments
Austria Vehicle registration tax One-off Fuel efficiency
Flat rate for diesel (petrol) vehicles using more than 10 (11) L/100 km
Canada Green levy One-off Fuel efficiency
Gradually increasing taxes for vehicles with low fuel efficiency
Denmark Passenger car fuel consumption tax
Recurrent Fuel efficiency
Different, progressive rates for petrol- and diesel-driven cars
Finland Car tax – passenger cars One-off CO2 Tax as % of retail value: (0.1 x gCO2/km) + 4%
France Tax on vehicle registration for high CO2 emitters
One-off CO2 Bonus – Malus system
Germany Motor vehicle tax Recurrent CO2 EUR 2 per gCO2/km above 120 g/km (until 2011)
Ireland Vehicle registration tax One-off CO2 Same, progressive rates for all car categories
Ireland Motor vehicle tax Recurrent CO2 Same, progressive rates for all car categories
Norway Motor vehicle registration tax
One-off CO2 Same, progressive rates for all car categories
Spain Tax on vehicle registration One-off CO2 Same, progressive rates for all car categories
Sweden Motor vehicle tax Recurrent CO2 Different, fixed rates for petrol- and diesel-driven cars
United Kingdom
Vehicle excise duty Recurrent CO2 Different, progressive rates for petrol- and diesel-driven cars
Source: OECD/EEA, 2011.
Note: One-off = payment made once at the time of vehicle purchase; Recurrent = annual payment.
© O
EC
D/IE
A, 2
012

34 Policy Pathway ImprovIng the Fuel economy oF road vehIcles
In some countries, vehicle taxes are combined with a rebate to customers purchasing lower-emitting/fuel-consuming vehicles, which is sometimes called a feebate. For example, in France, purchasers of a vehicle with a CO2 emission value between 91 g/km and 105 g/km received EUR 300 as a bonus in 2011 and up to EUR 5 000 for electric vehicles (IEA, 2011b). Partly as a result, average emissions of new vehicles registered in France decreased from 149 gCO2/km at the end of 2007 to about 130 gCO2/km in the first seven months of 2010 (IEA, 20112c).
In most cases, when the basis for vehicle tax estimation is switched to vehicle fuel and CO2 emissions performance, the objective is to keep the measure revenue neutral so that the government budget neither loses revenue or adds undue costs to society. A balance should be achieved between providing a high enough incentive to encourage a market shift to vehicles with better fuel economy and ensuring a stable flow of revenue from vehicle taxes for the treasury. The latter is more difficult when a rebate or bonus is provided to customers.
These incentives can sometimes offset the higher cost of more fuel-efficient vehicles and can affect consumer choice by giving a powerful expectation that a vehicle that is eligible to receive incentives is good for the environment. A study of the relationship between vehicle taxes, fuel prices and vehicle sales and CO2 emissions found that vehicle circulation and fuel taxes seem to have the most significant effect on consumer vehicle purchasing behaviour, since higher vehicle circulation taxes appear to reduce total new vehicle sales and reduce the overall CO2 emissions intensity of the new car fleet. The study found that an increase in circulation taxes of 10% could result in a short term decrease in fleet CO2 emissions of 0.2% in the short run and 1% in the long run, while an increase in petrol prices of 10% could lead to a reduction in CO2 emissions of approximately 0.3% on average for the fleet and up to nearly 1.6% in the longer term (Ryan et al., 2009).
Analysis of vehicle sales data in five countries following the introduction of vehicle tax incentives for lower CO2-emitting vehicles has shown a significant increase in vehicles sales in the lower CO2-emitting bands and a significant decrease of vehicle sales in the highest CO2-emitting bands.15 The CO2-differentiated vehicle taxes in Figure 8 were introduced or strengthened at the following times: Denmark 2007, France 2008, Ireland 2008, Norway 2007 and United Kingdom 2010 (strengthened), and a superficial examination of the data indicates a correlation between vehicle tax incentives and a market shift to lower-emitting vehicles. In many countries, however, the timeframe of these changes coincided with the beginning of the recession of recent years, so the amount of the shift to lower-emitting vehicles attributable to the vehicle tax change is difficult to establish.
15. The study featured Denmark, Ireland, the Netherlands, Norway, and the United Kingdom. IEA, 2012c (forthcoming).
© O
EC
D/IE
A, 2
012

35Policy Pathway ImprovIng the Fuel economy oF road vehIcles
Fuel taxes
Vehicle tax incentives affect only consumer choice of vehicles and cannot affect consumer driving behaviour after purchase. Fuel taxes may be able to affect both consumer vehicle choice and driving behaviour. Most countries have introduced a tax on fuel, however on the other end of the scale there remain other countries which still subsidise fuel prices. Comparison of fuel efficiency among countries is difficult, but more fuel-efficient vehicles tend to prevail in countries with higher fuel prices and taxes (Sterner, 2007; NRC, 2010).
Fuel prices and taxes, in combination with vehicle taxes, have played an important role in determining the proportion of diesel sales and fleet CO2 emissions. They also can have a very important effect on the use of the car fleet and can help address the rebound effect (Box 9). Of the five countries analysed in Figure 8, motorists
in the United Kingdom pay the highest price and tax for petrol and diesel. France and Norway have similarly high prices and taxes for petrol and diesel. Denmark and Ireland have the lowest petrol prices, and Denmark has the lowest price for diesel. Overall, fuel prices peaked in 2008 and decreased between 2008 and 2009, while average CO2 emissions of the car fleet continued to drop, mainly due to the economic recession. If these prices are compared with vehicle use, Table 7 shows that passenger cars in Denmark and Ireland (with the lowest fuel prices of the countries examined) drove the highest annual kilometres, while cars in France, Norway and the United Kingdom drove less. Over the period 2005- 09, while fuel prices rose annual vehicle kilometres driven fell in all five countries. While other factors such as land-use planning and public transport alternatives are also important, fuel prices are likely to play a role.
Figure 8 Average new passenger car CO2 emissions
120
130
140
150
160
170
180
2005 2006 2007 2008 2009
Denmark
Ireland
France
United Kingdom
Norway
EU 25
CO
em
issi
on
s(g
CO
/km
)2
2
Source: Eurostat and Norwegian government.
© O
EC
D/IE
A, 2
012

36 Policy Pathway ImprovIng the Fuel economy oF road vehIcles
Confounding factors such as the economic situation, current fuel prices and infrastructure changes can confuse the context in which fuel economy policies are developed. Indeed, the financial crisis that began in 2007 had a very serious effect on the global economy. The crisis severely affected vehicle sales. In 2008, car sales dropped significantly in OECD countries. In Ireland, a country that suffered a significant recession, vehicle sales dropped by 63%.
In France, which suffered less, vehicle sales actually increased. Since 2010, however, there has been significant restructuring in the vehicle manufacturing industry and worldwide production of vehicles is more or less back to normal. Econometric analysis is required to disentangle the causality of these different factors on car purchases and fuel efficiency.
table 7 Average kilometres travelled by private cars
2005 2006 2007 2008 2009
Denmark 16 720 16 478 16 468 16 275 16 097
Ireland 17 234 16 860 16 575 16 376 16 376
France 13 260 13 085 13 029 12 798 12 798
United Kingdom 14 497 14 094 14 271 13 950 13 547
Norway 13 108 13 306 13 916 13 835 13 606
Source: IEA data.
Rebound�effect
a weak point associated with fuel efficiency policies (standards, vehicle tax policies, or anything else that results in more efficient vehicles being sold) involves so-called “rebound effects”. In the transport context this is where consumers may drive more as response to reduced costs of driving (thus this can occur either from improved efficiency or from lower fuel prices or both). rebound effects can offset part of the fuel savings and reduced co2 emissions normally expected from an improvement in vehicle fuel efficiency.
the extent of this rebound effect to reductions in fuel cost is not well understood and seems to vary depending on a range of factors. most
research suggests that rebound effects are quite low – on the order of 10% to 20% more driving for a doubling of fuel economy (or halving of fuel use per kilometre). higher rebound effects also seem likely in developing countries, were mobility needs are less well met, but little research has been done in this context.
to prevent significant rebound effects, governments may choose to introduce vehicle use-based policies. Increased fuel taxes could be used, for example, to offset lower fuel costs and function as a deterrent against an increase in driving.
Box�9
© O
EC
D/IE
A, 2
012

37Policy Pathway ImprovIng the Fuel economy oF road vehIcles
Complementary policies
This policy pathway focuses on improving vehicle fuel efficiency by addressing the efficiency of vehicles coming into the fleet. The targeted improvements can be enhanced by policies that influence the in-use efficiency of vehicles; how vehicles are driven, how they are used in relation to other modes, correct loading and improved freight logistics measures all complement the vehicles essential technical
efficiency. Fiscal incentives can also be extended to the use of the vehicle. In some countries fuel-efficient vehicles receive discounts on motorway tolls or are exempted from congestion taxes.
Policy makers should consider the role for complementary policies to support the public response to new vehicle standards and labelling and also to assist drivers to maximise the benefits of their new efficient vehicles.
Policies�for�improving�in-use�fuel�economy�
Eco-driving
policies to promote eco-driving usually have two main goals: helping concerned drivers who already have an interest in energy saving, and motivating a broader audience to drive in an eco-friendly manner. communication campaigns that directly or indirectly advertise practical tips for eco-driving can widely inform the public about eco-driving, helping drivers to have an eco-friendly behavior and to realise the importance of eco-driving. some eco-driving techniques, such as moderate acceleration, are also useful for both reducing fuel consumption and improving safety.
In-car feedback instruments, such as gear-shift indicators, cruise controls, and onboard fuel efficiency computers that show real-time and average fuel efficiency, can more directly support eco-driving. one option is to expand the use of these devices for eco-driving among professional drivers. the average number of miles driven in a year by professional drivers greatly exceeds that of a private driver, which means that a professional driver’s improvement in driving behaviour has therefore a greater impact on saving fuel consumption. Japan, for example, subsidises fleet operators for purchasing an eco-driving management system (ems) and successfully saving energy and reducing co2 emissions.
eco-driving can also be part of training courses to qualify for a driver’s license. If many drivers practice
eco-driving from the beginning of their driving careers due to a training course, that would lead to a considerable reduction in fuel consumption. In all cases of eco-driving training, refresher courses should be provided, because the effect can wear off (eu, 2006).
Modal shift: using more sustainable transportation modes
modal shift describes the shift from private motorised vehicles to more sustainable modes of transport such as public and non-motorised transport. to motivate the public to use more sustainable transportation modes, governments need to make them more attractive by improving the public transport offering, its convenience and prices. governments should also take co-benefits into account. Inducing motorists to use public transportation, for example, reduces traffic congestion, air pollution and noise. In some european countries, local governments prohibit private cars from entering city centres, making these cities more attractive as tourist attractions.
urban sprawl makes it difficult for governments and private companies to provide public transportation service to citizens and encourages citizens in suburban areas to use their own vehicles. governments should, therefore, adopt land use planning policies, such as zoning, to prevent sprawl.
policies that reduce urban parking options can also make it less attractive to drive into urban areas. park-and-ride facilities can encourage drivers to leave their cars outside the city centre.
Box�10
© O
EC
D/IE
A, 2
012

38 Policy Pathway ImprovIng the Fuel economy oF road vehIcles
Most OECD countries receive a score above or equal to 5, showing a good and/or improving policy framework to improve fuel economy in the coming decade. Only a handful of countries score zero, mainly some oil-producing countries heavily subsidising gasoline prices. This index and the way it is calculated is intended to inform countries of their potential for
improvement, and will evolve over time as more detailed data becomes available across a wider range of countries, and to reflect trends in policy adoption and implementation.
For the purpose of the technology roadmap: Fuel economy of road vehicles and the policy pathway to Improve the Fuel economy of road vehicles, the IEA has developed a vehicle fuel efficiency policy progress indicator that gauges whether a country has an effective mix of the three elements of the policy package in place to promote fuel economy improvement in the coming years. The IEA fuel economy readiness index is a scoring system that combines the implementation of four key policies to incentivise fuel economy: fuel tax, CO2-based vehicle purchase taxation, labelling scheme, and fuel economy standards for light and heavy duty vehicles. Figure 9 presents the results of this analysis with a depiction of the level of fuel economy policies currently implemented in countries worldwide.
For each country, scores have been attributed depending on the present status of fuel-economy policies implementation. The individual policies forming the fuel economy readiness index have different maximum scores depending on the potential impact of the policy on fuel economy improvement (Table 8). The fuel tax scale is based on gasoline retail prices mid-2010 rated by GIZ (GIZ, 2011). Other scales are based on IEA analysis. The scoring system highlights the importance of fuel taxes and fuel economy standards as policies to improve fuel economy.
The�policy�status�quo:�introducing�the�fuel�economy�readiness�index
table 8 Fuel Economy readiness index scoring system
PolicyScore
0 1 2 3
Fuel tax High subsidy Low subsidy Low tax High tax
Status of fuel economy standard implementation
No standard Proposed for light vehicles
Enacted for light vehicles
Enacted or proposed for
light and heavy vehicles
CO2- or efficiency-based vehicle registration or ownership tax
No Yes
Availability of fuel economy labels No Yes
© O
EC
D/IE
A, 2
012

39Policy Pathway ImprovIng the Fuel economy oF road vehIcles
This document and any map included herein are without prejudice to the status of or sovereignty over any territory, to the delimitation of international frontiers and boundaries and to the name of any territory, city or area.
Few policies for fuel economyimprovement are in place
Some progress has been made inimplementing fuel economy policies
Relevant policiesto improve fuel economy
are in place
Figure 9 Fuel economy readiness index status, 2010
Source: IEA analysis.
© O
EC
D/IE
A, 2
012

40 Policy Pathway ImprovIng the Fuel economy oF road vehIcles
The policy pathway to improve vehicle fuel efficiency involves four stages – Plan, Implement, Monitor and Evaluate – under which fall ten critical steps. These steps cover the early-stage decision-making on the type of policy to be applied through to compliance checking and evaluation of policy effectiveness. The approach below is based on country experiences and the decisions that paved the way for successful implementation of labelling, fuel efficiency standards, and fiscal measures for both LDVs and HDVs. More attention is devoted to fuel efficiency standards, because it is the more technically difficult policy. Some critical elements common to all three are the measurement and certification of fuel economy, and the planning and allocation of resources.
Policy makers are likely to find themselves in one of two country situations:
z countries with a substantial existing or developing vehicle manufacturing base;
z countries which are importers of vehicle technologies with little or no local manufacturing.
At one level the policy considerations are identical for both situations. Consumers need good information and the right price signals to encourage purchase of more fuel-efficient vehicles. There is a compelling need to align vehicle tests and procedures with developing international practices dominated by Japanese, US and European testing standards, to minimise trade threats from misalignments, ensure access to world markets for manufacturers and ensure consumers can access developing international technologies.
However there are also differences for policy makers in the two situations; in the first case, the capacity to adopt vehicle standards will be largely shaped by the rate at which local industry can adapt and the economics of the changes. Where there is no significant local manufacturing base, the policy context can be simpler, and will be shaped by the present and anticipated future mix of imports, and the developing international and country of origin policies for vehicle fuel efficiency.
Policy makers should ensure a clear understanding of the domestic and international context under which they are operating, and consult widely with industry, consumers and international bodies to ensure clear understanding of the context within which they will be developing these policies.
how to deliver effective fuel economy policies: the policy pathway
Decide scope,type and
schedule of policies
Decidemeasurement method
Secure resources
Design policies
1
2
3
4
Certify fuel 5
Make informationaccessible to public 6
Check compliancewith fuel economypolicies
7
Publish monitoring data8
Evaluate and enforce policies
9
Revise policies10
EV
A
LUATE
PLAN
I M PLEMEN
T
MO
NITO
R
POLICY PATHWAYImproving the Fuel Economyof Road Vehicles
© O
EC
D/IE
A, 2
012

41Policy Pathway ImprovIng the Fuel economy oF road vehIcles
1 decide scope, type and schedule of policies
Gather information
Governments should gather information on transport statistics, such as fuel used by road transport, vehicle population, and size, weight, and fuel economy by vehicle category. It is useful to understand both household vehicle use patterns and freight sector dynamics as well as the various substitutes and alternative modes and their projected contribution to the transport systems.
This information provides policy makers with the requisite evidence to establish the baseline fleet-average fuel economy, to understand which parts of the vehicle fleet need most improvement and to be able to tailor policies accordingly. The GFEI has helped several countries to develop their baseline average fuel economy. The Initiative has also created a comprehensive tool to assist countries in designing fuel economy-related policies with an ample resource for information.16
Knowing national traffic conditions, such as driving speed and traffic density in different parts of the country (city, countryside and motorway) is also useful for developing measurement methods for vehicle fuel efficiency later in the process.
Ensure a sound understanding of the fiscal and other policy drivers that influence the transport sector and the consumers and other actors in the sector. Fuel distribution systems and pricing and GHG and local air quality policies play a big role in driving transport decisions as do road pricing policies and policies to enhance alternatives to road vehicles.
16. The GFEI toolkit is available at www.unep.org/transport/gfei/autotool/.
Ensure that the vehicle manufacturing, importation and retailing value chain is well understood so that the implications of policy changes can an analysed.
Without the above information it is very difficult to assess the impact of the policies and design them effectively.
Determine scope and type of fuel economy policy measures
Once information is gathered and analysed, the next step is to decide the scope of fuel efficiency policy measures.
Which vehicle types and market segments should be addressed by the policies? In light of significant differences in vehicle size, weight, usage and applicable technologies, LDVs should not be lumped together with HDVs in policy design.
The type of policy measure to be implemented should be determined based on the discussion in the previous sections on the relative merits of fuel efficiency labelling, standards and fiscal measures; a package of all three is likely to be the most effective. Because of limitations in fiscal and human resources, governments may not be able to develop fuel efficiency policy measures for all vehicle categories at one time. Table 9 gives an overview of the objectives and effects associated with each of the three elements of the fuel economy policy package. Policy makers should assess their policy target, scope and timeframe in order to be able to select the appropriate policy measures for their national context.
PlAN
� E
VALUATE �
� PLAN �
� IMPLEM
ENT
�
� M
ON
ITOR �
© O
EC
D/IE
A, 2
012

42 Policy Pathway ImprovIng the Fuel economy oF road vehIcles
All countries should prioritise the provision of information to consumers on the fuel economy of road vehicles. This implies that, as a minimum, governments should introduce fuel economy labelling, preferably for both LDVs and HDVs.
Fuel economy standards are necessary when vehicle purchasers do not value fuel economy or when market failures cause manufacturers to prioritise other vehicle features over fuel economy in vehicle development. The standards ensure that a minimum performance is met by individual vehicles or the fleet on average. Governments without any fuel efficiency standards might develop standards first for LDVs, which are likely to account for the majority of fuel consumption among vehicles and have room for improvement in fuel efficiency due to the market failures noted earlier. Even in countries where trucks currently consume more fuel than passenger vehicles, such as China, the amount of fuel consumption by passenger vehicles will most likely surpass fuel consumption by trucks in the future. Separate fuel efficiency standards are appropriate for heavy-duty
passenger vehicles and heavy-duty trucks. Only the United States and Japan have currently implemented HDV fuel economy standards, but this is a growing trend with many countries considering their introduction (Table 4).
Fiscal measures can encourage the sale of vehicles with better fuel economy more than a minimum fuel economy standard. They can also be implemented more quickly and are more short-term measures. To begin, policy makers should assess what price signals are currently available to vehicle purchasers.
If fuel subsidies are in place, they should be removed as a priority. There is little point in developing progressive policy measures which will be overwhelmed by an overarching regressive price incentive. The first priority will be to design a phase-out for the subsidy with a complementary investment in public transport or other policies that may be needed to avoid a political backlash and ensure vulnerable social groups are not adversely affected.
table 9 Comparison of three elements of fuel economy policy package
Policy measure Objective Outcomes Timing issues
Fuel economy information and labelling
To overcome information gap and raise awareness of fuel economy
Enables the purchase of more fuel-efficient vehicles
Rapid implementation and results
Fuel economy standards To overcome market failure where consumers do not value fuel economy
Provides minimum performance standard for vehicle sold
Longer planning and implementation needed.
Provides long-term goals for manufacturers
Fuel economy fiscal measures
To overcome higher upfront costs of more efficient technologiesTo provide incentives to purchase higher performing vehicles
Encourages market transformationFuel taxes encourage more fuel-efficient vehicle useEncourages purchase of vehicles better than the fuel economy standard
Rapid effect possible
May be difficult to sustain over the longer term
© O
EC
D/IE
A, 2
012
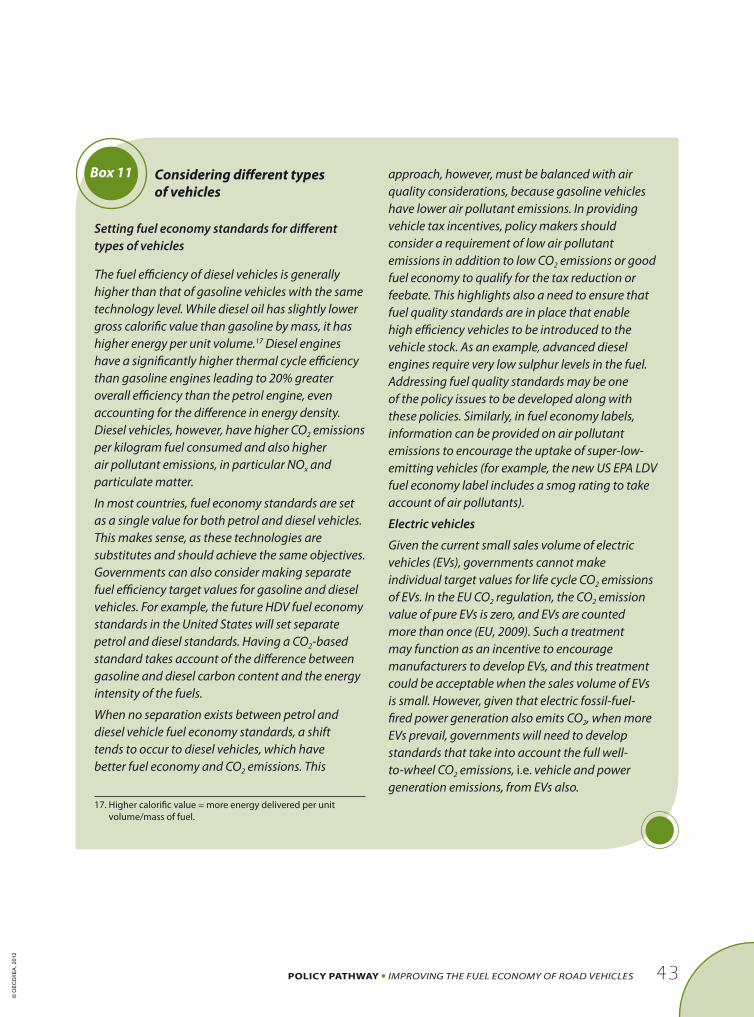
43Policy Pathway ImprovIng the Fuel economy oF road vehIcles
Box�11 Considering�different�types��of�vehicles�
Setting fuel economy standards for different types of vehicles
the fuel efficiency of diesel vehicles is generally higher than that of gasoline vehicles with the same technology level. While diesel oil has slightly lower gross calorific value than gasoline by mass, it has higher energy per unit volume.17 diesel engines have a significantly higher thermal cycle efficiency than gasoline engines leading to 20% greater overall efficiency than the petrol engine, even accounting for the difference in energy density. diesel vehicles, however, have higher co2 emissions per kilogram fuel consumed and also higher air pollutant emissions, in particular nox and particulate matter.
In most countries, fuel economy standards are set as a single value for both petrol and diesel vehicles. this makes sense, as these technologies are substitutes and should achieve the same objectives. governments can also consider making separate fuel efficiency target values for gasoline and diesel vehicles. For example, the future hdv fuel economy standards in the united states will set separate petrol and diesel standards. having a co2-based standard takes account of the difference between gasoline and diesel carbon content and the energy intensity of the fuels.
When no separation exists between petrol and diesel vehicle fuel economy standards, a shift tends to occur to diesel vehicles, which have better fuel economy and co2 emissions. this
17. Higher calorific value = more energy delivered per unit volume/mass of fuel.
approach, however, must be balanced with air quality considerations, because gasoline vehicles have lower air pollutant emissions. In providing vehicle tax incentives, policy makers should consider a requirement of low air pollutant emissions in addition to low co2 emissions or good fuel economy to qualify for the tax reduction or feebate. this highlights also a need to ensure that fuel quality standards are in place that enable high efficiency vehicles to be introduced to the vehicle stock. as an example, advanced diesel engines require very low sulphur levels in the fuel. addressing fuel quality standards may be one of the policy issues to be developed along with these policies. similarly, in fuel economy labels, information can be provided on air pollutant emissions to encourage the uptake of super-low-emitting vehicles (for example, the new us epa ldv fuel economy label includes a smog rating to take account of air pollutants).
Electric vehicles
given the current small sales volume of electric vehicles (evs), governments cannot make individual target values for life cycle co2 emissions of evs. In the eu co2 regulation, the co2 emission value of pure evs is zero, and evs are counted more than once (eu, 2009). such a treatment may function as an incentive to encourage manufacturers to develop evs, and this treatment could be acceptable when the sales volume of evs is small. however, given that electric fossil-fuel-fired power generation also emits co2, when more evs prevail, governments will need to develop standards that take into account the full well-to-wheel co2 emissions, i.e. vehicle and power generation emissions, from evs also.
© O
EC
D/IE
A, 2
012
44 Policy Pathway ImprovIng the Fuel economy oF road vehIcles
As part of this scoping phase, analysis must be undertaken to identify the effect of existing fuel pricing policies and practices. The key issue is whether or not the existing price signal is strong enough to encourage the purchase of more fuel-efficient vehicles.
Taxes associated with vehicles should be aligned with the fuel economy or CO2 emissions of the vehicle. Consideration can be given to further incentives or rebates for advanced vehicles, depending on country priorities for the long term and the budget situation. Penalties through the tax system for worse-performing vehicles may be sufficient to shift the market. Countries without vehicle manufacturers and little technical capacity for standards should consider initially implementing fuel economy labelling and fiscal measures.
consult on policy schedule with stakeholders
Policymakers should consult with stakeholders such as vehicle manufacturers and civil society early in the process to establish clearly the market context and understand the level of technical development required to achieve significant improvements in fuel economy, as well as identifying other issues and concerns.
If a fuel economy certification or measurement system is already in place (set up either domestically or transferred from another country), fuel economy labelling and fiscal measures can be established more rapidly than standards. These measures can be effective quickly and are a good option in the absence and/or in advance of fuel economy standards. This is one of the reasons many European countries introduced vehicle tax incentives for vehicles with better fuel economy and CO2 emissions over the period 2005-08 when no fuel economy or CO2 regulation existed.
Governments may need to give manufacturers sufficient lead-time to implement fuel efficiency standards. Different approaches can be considered:
z a two-step approach. Whereby standards are introduced with easy target values in the near term and more stringent long-term targets, or
z a phase-in approach. Where strong targets are set right from the start, but manufacturers have a phase-in period during which only a specified percentage of the vehicles sold are required to meet the target.
Decide target year aligned with national goals
In developing a schedule, governments should also think of national goals such as energy security or fuel consumption or CO2 emissions targets. If a government has a national goal of reducing CO2 emissions in 2020, the fuel efficiency standards should be aligned with this goal and contribute to its achievement.
Summary of key actions: decide scope, type and schedule of fuel economy policies
z Gather information.
z Determine scope and type of fuel economy policy measures.
z Consult on policy schedule with stakeholders.
z Decide target year aligned with national goals.
© O
EC
D/IE
A, 2
012

45Policy Pathway ImprovIng the Fuel economy oF road vehIcles
2 decide measurement method
To develop fuel efficiency labelling, standards, and fiscal measures, policymakers need to appropriately measure fuel economy. The measured fuel efficiency of vehicles should be repeatable and comparable among vehicles.
Fuel economy should also be measured in a time- and cost-effective manner. A balance is needed between more rigorous, long and costly testing, and less accurate but cost-effective and more frequent testing. Sometimes, rather than develop the infrastructure for fuel economy testing, countries, particularly those without their own car industry, may utilise another country’s internationally recognised existing fuel economy standards and certification process. Deciding suitable measurement methods includes making decisions on whether engine or dynamometer testing will be carried out and developing a test driving cycle. These should be developed as part of international cooperation to minimise the risk of trade problems.
Gather information about traffic conditions
Understanding the driving conditions and types of vehicles on the road will help determine the type of driving that should be reflected in the fuel economy test cycle. With this information, governments can use statistical analysis to develop a driving cycle. If driving and traffic conditions are similar to those found in countries with a test cycle already in use or international test cycles, the existing internationally recognised test cycles should be adopted.
Determine measurement approach
The policy maker should first decide whether chassis or engine dynamometer or computer simulation testing should be used. Information collected on the vehicle fleet will indicate the extent of vehicle diversity on the road. The level of diversity will help determine whether chassis or engine dynamometer testing is appropriate. The more vehicle configurations on the market and in operation, the more costly and onerous the process
of chassis dynamometer testing. Again this is an area where international standards and practices should be adopted to minimise policy design effort, and potential future trade misalignments.
The fuel efficiency of LDVs today is typically measured over a fixed driving cycle on a chassis dynamometer (Figure 10). This method is used, because repeatability and comparability are impossible to maintain when tests are conducted on actual roads. Measured fuel efficiency should, however, be correlated to the fuel efficiency on actual roads to ensure that the improvement of measured fuel efficiency will lead to reduction in fuel consumption in the real world.
The fuel economy of HDVs could be measured on a chassis dynamometer, but this method would be difficult and expensive because of the often large vehicle size and the many different vehicle model configurations. An alternative approach is engine dynamometer testing in addition to some calculations to allow for full-vehicle operation.
Table 10 shows four approaches to measuring fuel economy, with the strengths and weaknesses of each. Numerous configurations of trucks are possible, so measuring the fuel economy of each full vehicle configuration is not realistic. Computer simulation of the whole truck (typically in combination with engine testing on a bench dynamometer) seems to be the option favoured by industry and increasingly by governments, for example in the United States and Japan. The Greenhouse Gas Emissions Model (GEM) simulation tool developed in the United States complements the vehicle modelling tool with engine dynamometer tests. China is planning to use chassis dynamometer tests for main truck families and computer simulations for variants. Chinese policy makers estimate that chassis dynamometer tests of five model families would accurately represent the fleet of HDVs and their operation.
© O
EC
D/IE
A, 2
012

46 Policy Pathway ImprovIng the Fuel economy oF road vehIcles
Figure 10 Chassis dynamometer facilities for measuring the fuel efficiency of LDVs
Seconds0 200 400 600 800 1 000 1 200
Seconds0 200 400 600 800
Seconds0 200 400 600 800 1 000 1 200
Seconds
0 200 400 600 800 1 000 1 200
100
100
120
100
80
80
80
60
60
60
40
40
40
20
20
40
80
20
0
0
0
0
JC08 mode
City cycle
Highway cycle
New European driving cycle (NEDC)
Vehi
cle
spee
d(k
m/h
)Ve
hicl
esp
eed
(km
/h)
Vehi
cle
spee
d(k
m/h
)Ve
hicl
esp
eed
(km
/h)
United States
Europe
Japan
Proportional speed fan
Dilution tunnel
CVS equipment for diesel vehicles
CVS equipmentfor gasoline vehicles
Emissions gas analyserfor diesel vehicles
Emissions gas analyserfor gasoline vehicles
Chassis dynomometer
Power absorption(rolling resistance +airflow resistance)
Variable inertiaflywheel apparatus
Source: JAMA, 2008.
The combined engine dynamometer and computer simulation method is a reasonable approach to measure fuel economy of HDVs in terms of costs and time. It is important that all parameters relevant to fuel efficiency are included in the simulation, otherwise it may not provide an incentive to manufacturers to optimise vehicle design for fuel efficiency. For example, in the Japanese method, tyre-rolling resistance and air resistance are not reflected in the calculated fuel efficiency. In the simulation process converting the fuel economy measured on an engine-based driving cycle to the full vehicle fuel economy, the parameters related to these factors are fixed for each vehicle fuel economy category. Such a shortcoming could cause manufacturers to focus only on technologies that could improve calculated fuel
efficiency. A more advanced measurement method needs to be developed that can evaluate most factors dominating fuel efficiency on actual roads in a cost- and time-effective manner and form the basis of a harmonised international testing regime .
Develop or decide on driving cycle
A driving test cycle is needed over which the test vehicle is operated that is representative of driving conditions in the jurisdiction where the vehicle will be sold (Figure 11). The test cycle should not be changed frequently, because it affects the track records and makes any improvement in vehicle fuel economy hard to assess.
© O
EC
D/IE
A, 2
012

47Policy Pathway ImprovIng the Fuel economy oF road vehIcles
Type of test Part simulated Strengths WeaknessesCountries considering fuel economy type approval of trucks
On-road NoneReal in-use conditions
Possible biases in testing, poor reproducibility
United Kingdom
Chassis dynamometer
RoadGood reproducibility
Very costly testing facility, especially for trucks
China
Engine dynamometer
Road and non-engine components
Good reproducibility
Costly testing facilityJapan, United States, European Union
Computer simulation
All Low testing costs Validation, reliability of modelling software
United States, European Union, Japan, China
table 10 Tests and simulation options for measurement of vehicle fuel economy
Driving cycles must reflect, as much as possible, the prevailing traffic conditions in a country. Given that speed, acceleration, and frequency of stopping considerably affect fuel efficiency, the trend of such parameters on actual roads should be incorporated into the driving cycles.
The data collected on traffic conditions should be statistically analysed to describe typical driving conditions for LDVs and HDVs in different situations. A chassis dynamometer driving cycle can be generated directly from these data (e.g. Figure 11). Because the driving pattern may be different on urban roads, rural roads, and highways, the relative share of these road categories should be reflected in driving cycles using a combination of transient, steady-state and other modes. If most drivers are likely to drive at a low speed and with modest acceleration in urban areas, for example, the driving pattern should be reflected in the corresponding percentage of the driving cycle. Some compromise is usually accepted on how well the test cycle can reflect real-life driving conditions.
There are currently three main chassis driving cycles used internationally to measure the fuel economy of passenger cars – the US combined test cycle, the New European Driving Cycle, and the Japanese JC08 (Table 3). China, India, Chile and Canada have adopted test cycles from other countries, and have slightly adapted them to local circumstances. A global harmonised driving cycle for LDVs is under development under the Working Party 29 of the United Commission for Europe (see Box 12). Once in place, countries can use a version of the harmonised cycle that matches their traffic conditions instead of developing a new driving cycle.
For HDVs, if a chassis driving cycle is not used to measure fuel economy, an engine-based cycle and simulation programme must be developed. One way to achieve this is to develop a vehicle-based chassis dynamometer driving cycle and then use a computer programme to convert the vehicle-based driving cycle to an engine-based operation cycle. In the process, parameters are generated for a computer simulation model to convert engine-based testing back to vehicle operation.
© O
EC
D/IE
A, 2
012

48 Policy Pathway ImprovIng the Fuel economy oF road vehIcles
Figure 11 Example of a driving cycle (LA#4 mode used in the United States)
0
10
20
30
40
50
60
0 200 400 600 800 1 000 1 200 1 400
Test time (seconds)
Ve
hic
lesp
ee
d(m
ph
)
The calculation in the computer simulation includes various parameters, including gear ratio, tyre diameter, tyre-rolling resistance, air resistance, gross vehicle weight, vehicle height and vehicle width. Some of these parameters can be input into the simulation model for each specific vehicle. In the current Japanese method, for example, individual vehicle parameters are used for factors involving a power train, such as gear ratio and tyre diameter. Common parameters are used for other aspects, such as tyre rolling resistance and air resistance. Once the parameters are established for different vehicle configurations, the engine fuel economy can be measured and an estimate made of the fuel economy of the whole vehicle in a given configuration.
For both LDVs and HDVs, information gathering and data analysis require a substantial amount of both human and fiscal resources and time. The European Union, the United States and Japan have already developed their own passenger car driving cycles; other countries beginning to implement fuel
economy policies may find it efficient to choose and adopt an existing cycle or the future worldwide harmonised test cycle (WLTP) most reflecting their own specific traffic conditions.
Summary of key actions: decide the measurement method of fuel efficiency, incorporating specific traffic conditions
z Gather information about traffic conditions. z Determine measurement approach. z Develop driving cycle.�
© O
EC
D/IE
A, 2
012
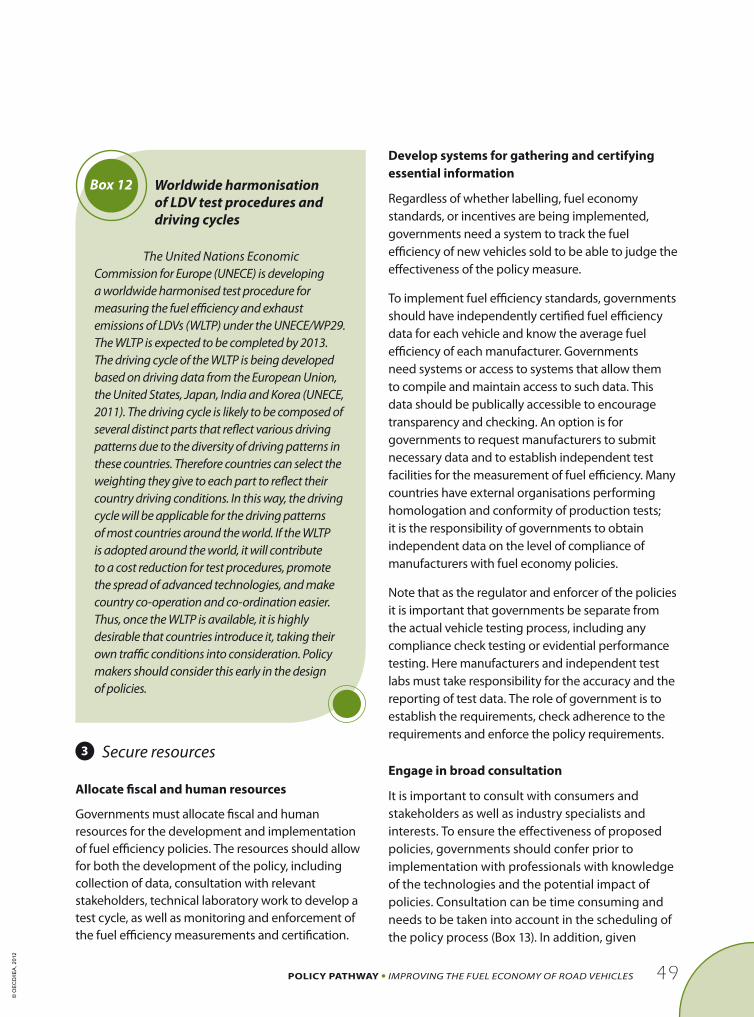
49Policy Pathway ImprovIng the Fuel economy oF road vehIcles
3 secure resources
allocate fiscal and human resources
Governments must allocate fiscal and human resources for the development and implementation of fuel efficiency policies. The resources should allow for both the development of the policy, including collection of data, consultation with relevant stakeholders, technical laboratory work to develop a test cycle, as well as monitoring and enforcement of the fuel efficiency measurements and certification.
Develop systems for gathering and certifying essential information
Regardless of whether labelling, fuel economy standards, or incentives are being implemented, governments need a system to track the fuel efficiency of new vehicles sold to be able to judge the effectiveness of the policy measure.
To implement fuel efficiency standards, governments should have independently certified fuel efficiency data for each vehicle and know the average fuel efficiency of each manufacturer. Governments need systems or access to systems that allow them to compile and maintain access to such data. This data should be publically accessible to encourage transparency and checking. An option is for governments to request manufacturers to submit necessary data and to establish independent test facilities for the measurement of fuel efficiency. Many countries have external organisations performing homologation and conformity of production tests; it is the responsibility of governments to obtain independent data on the level of compliance of manufacturers with fuel economy policies.
Note that as the regulator and enforcer of the policies it is important that governments be separate from the actual vehicle testing process, including any compliance check testing or evidential performance testing. Here manufacturers and independent test labs must take responsibility for the accuracy and the reporting of test data. The role of government is to establish the requirements, check adherence to the requirements and enforce the policy requirements.
Engage in broad consultation
It is important to consult with consumers and stakeholders as well as industry specialists and interests. To ensure the effectiveness of proposed policies, governments should confer prior to implementation with professionals with knowledge of the technologies and the potential impact of policies. Consultation can be time consuming and needs to be taken into account in the scheduling of the policy process (Box 13). In addition, given
Box 12 Worldwide�harmonisation�of�lDV�test�procedures�and�driving�cycles
the united nations economic commission for europe (unece) is developing a worldwide harmonised test procedure for measuring the fuel efficiency and exhaust emissions of ldvs (Wltp) under the unece/Wp29. the Wltp is expected to be completed by 2013. the driving cycle of the Wltp is being developed based on driving data from the european union, the united states, Japan, India and Korea (unece, 2011). the driving cycle is likely to be composed of several distinct parts that reflect various driving patterns due to the diversity of driving patterns in these countries. therefore countries can select the weighting they give to each part to reflect their country driving conditions. In this way, the driving cycle will be applicable for the driving patterns of most countries around the world. If the Wltp is adopted around the world, it will contribute to a cost reduction for test procedures, promote the spread of advanced technologies, and make country co-operation and co-ordination easier. thus, once the Wltp is available, it is highly desirable that countries introduce it, taking their own traffic conditions into consideration. policy makers should consider this early in the design of policies.
© O
EC
D/IE
A, 2
012

50 Policy Pathway ImprovIng the Fuel economy oF road vehIcles
Box 13 Consultation�as�part�of�Indian�fuel�economy�policy�process
the development of fuel economy policies in India built in a process of continuous consultation. this process involved interfacing with the relevant environmental committees, test labs, stakeholders including automotive stakeholders, ngos, and the automobile manufacturers association and having consultation at each level of formulation of policies. such processes proved to be very time-consuming and required allocation of fiscal and human resources for the development and implementation of fuel efficiency policies. however, the benefits have been more widespread acceptance of the fuel economy policies and better understanding of the most effective policies.
source: mr. sandeep garg, energy economist in charge of vehicle fuel efficiency standards at the Indian Bureau of energy efficiency.
that fuel efficiency standards and other policies will affect the market, governments should consult with users to avoid detrimental effects, especially when governments develop fuel efficiency standards for HDVs.
Any consultation process is a way of introducing the policy, learning about the needs of users and about the information, training and support polices that will be needed to complement the core policies.
Summary of key actions: secure resources for the development and implementation of fuel efficiency standards
z Allocate fiscal and human resources.
z Develop system for gathering and certifying essential information.
z Engage in broad consultation.
4 design policies
Each of the three elements in the fuel economy policy package is treated separately in this step.
Fuel economy labelling and information
Decide scope of labelling scheme
Policy makers should decide whether the fuel economy labelling scheme is mandatory or voluntary. A mandatory labelling scheme is preferred to provide objective information on the energy performance of a vehicle, which is relevant for all vehicles.
For one kind of label, endorsement labels, voluntary labelling programmes are more common. Endorsement labels are fuel economy labels that are attached only to the most fuel-efficient vehicles. Because manufacturers have an incentive to attach a label to fuel-efficient vehicles to increase their appeal, even a voluntary scheme can provide some useful information. However, full information is not provided on the fuel economy of all vehicles, and therefore, a mandatory scheme with full information provision is preferable. This approach is more transparent and will raise awareness of fuel economy among consumers over time.
The scope of the labelling scheme also needs to be considered. Fuel economy labelling schemes have been historically limited to new LDVs. The United Kingdom and New Zealand, however, now require the fuel economy labelling of used cars, because data on fuel economy has been available since 2001. Where possible, information should be provided on the fuel economy of new and used vehicles, as they serve as a useful benchmark for comparison between vehicles. Since the fuel economy value for a used vehicle may no longer be the same as that when the vehicle was new, the fuel economy labels of used vehicles can either report the new vehicle value but alert the purchaser to the fact that the value may have changed or a non-numeric representation may be used such as the star method used in New Zealand for used vehicles. HDVs have not been labelled for fuel economy in the past apart from in Japan; however,
© O
EC
D/IE
A, 2
012

51Policy Pathway ImprovIng the Fuel economy oF road vehIcles
with the advent of fuel economy measurement/estimation of the full vehicle, implementing fuel economy labelling of HDVs should be possible.
An important consideration is at which point of the supply chain the obligation for the label will rest. The label can be the responsibility of the retailer, importer/ wholesaler or manufacturer. The decision depends largely in understanding how vehicles find their way to the market in a country. Clearly it’s easier to manage a few points of obligation, such as with the vehicle manufacturers, than an entire vehicle retail sector, but sometimes the retailer is the best point of obligation. Web-based vehicle retailing is an important part of most markets so it is useful to consider how the label can work though this retailing medium.
Select fuel economy label design
Labelling has two main purposes: drawing the public’s attention to vehicle fuel efficiency, and giving information about the benefit of fuel-efficient vehicles. A label should be eye-catching and also informative. Governments must decide how much information to include in a label, and a trade-off may exist between the need to provide a high level of information and the need to achieve clarity.
Policy makers can choose between three types of fuel economy labels that are in common use:
z graphical rating labels, such as those used in many countries in Europe;
z direct information disclosure of detailed fuel economy information including fuel costs (examples in United States, China); and
z relative vehicle performance compared to the fuel economy standard usually presented as a single value in an endorsement label.
When choosing a label design, policymakers should consider the cultural preferences of the consumers (Box 14). If the public tends to make decisions based on numerical analysis, they will expect access to detailed information such as on the US label. In other contexts, focusing on a simple endorsement of more fuel-efficient vehicles could be effective to motivate the public to choose a fuel-efficient vehicle.
Consideration needs to be given to the information provided in the label. If possible, the information should include an estimate of the fuel cost of running the vehicle over a year so that vehicle purchasers understand the implications of the fuel economy value.
Box 14 Test�label�designs�with�stakeholders
a key step in getting the label design right is to trial potential label designs with consumers and industry. the key objective is to ensure the label is effective in conveying the fuel efficiency information in a way that motivates the desired response from consumers and industry.
© O
EC
D/IE
A, 2
012

52 Policy Pathway ImprovIng the Fuel economy oF road vehIcles
align design of fuel economy label with other measures
The design of the fuel economy label should take into account whether fuel economy standards and fiscal measures are in place and should be aligned with both. Fuel economy labelling is a key requirement for effective fuel economy standards and fiscal measures, and should reinforce the policies as a package. If fiscal incentives, such as vehicle tax incentives, are awarded according to criteria different from the label, vehicle purchasers will have difficulty understanding and prioritising the most fuel-efficient vehicles. Similarly vehicle labelling and fuel economy standards should be aligned to support achievement of the standard.
Determine requirements for vehicle promotional and other materials
Policy makers should require manufacturers to make information on fuel economy specified in the label available in other promotional material relating to the sale or rental of the vehicle. This requirement should cover all promotional material relating to the vehicle, especially on the internet that is visual and static or dynamic. Consider a training programme for the vehicle industry so that retailing staff and others in the supply chain understand why the label is important, what it conveys, and learn how to use it to enhance the sales of efficient vehicles. A supportive industry is an important element of ensuring labels are effective.
Fuel economy standards
Decide on form of fuel economy standard
Fuel economy standards are generally based on manufacturer fleet efficiency averages. The current fuel efficiency standards in place in most countries do not impose specific requirements on individual vehicles (except in China).
As noted earlier, policy makers must choose between the two main types of design that are used to set fuel economy standards – absolute target values and attribute-based targets. The major differences between setting fuel economy standards for LDVs
and HDVs are the scope of vehicle category, the measurement method of fuel efficiency, and the attribute-base of the standards.
Fuel economy standards based on attribute-based target values provide more flexibility for vehicle manufacturers, while absolute target values provide more certainty to the policy maker regarding the minimum energy performance of each vehicle. Absolute value targets are difficult to set at a stringent level, however, and are unlikely to provide incentives to manufacturers to develop very low fuel-consuming vehicles, because all vehicles have the same target value. Within attribute-based targets, continuous curve values provide more flexibility than categories (Box 15).
For attribute-based standards, regardless of whether continuous curves or categories are chosen, targets should be based on the historical mix of vehicle attributes. For example, in the EU regulation of CO2 emissions for passenger cars, the manufacturers’ targets have been set based on the 2005 fleet average weight. Even if the average vehicle weight for a particular manufacturer increases, it still has to reach the target based on the 2005 average weight. Otherwise, if the targets shift with the change in attributes from the current vehicle sales, manufacturers could choose to sell vehicles of a higher weight or other attribute to benefit from the less strict standard in that category or along the curve (if continuous curve-based). Another way to remove the incentive to increase vehicle weight is to introduce complementary measures such as carbon and fuel taxes to deter increased fuel consumption (described below in the step entitled “Introduce measures to avoid increasing vehicle weight”).
Policy makers should consider whether any exemptions to the standards should be provided. Exemptions are most likely to be used for special-purpose vehicles such as ambulances, armoured cars and vehicle models manufactured in very small numbers (see Box 16).
© O
EC
D/IE
A, 2
012

53Policy Pathway ImprovIng the Fuel economy oF road vehIcles
Particular considerations for commercial vehicles (LCVs and HDVs)
The same forms of fuel economy standards can be considered for LCVs and heavy commercial vehicles as for light-duty passenger vehicles. Unlike light-duty passenger vehicles, however, manufacturers of commercial vehicles are less likely to deliberately increase vehicle weight to meet less challenging fuel economy targets, and therefore, this issue is less of a concern for policy makers. Freight companies choose trucks with the most suitable size for their business and try to reduce fuel consumption. In a few cases, they might choose vehicles with an increase in the average or gross vehicle weight and worse fuel consumption, but an increase in individual weight may not necessarily lead to an overall increase in fuel consumption. If a company purchased four 10-tonne (t) trucks instead of five 8t trucks, the purchase could lead to less fuel consumption if the overall drive distance were reduced as a result. Thus, continuous curve attributed-based standards would seem reasonable for these vehicles.
HDV manufacturers may not have much flexibility to choose methods to improve their average fuel efficiency, regardless of the types of schemes, because they have fewer applicable improvement technologies as compared to LDV manufacturers. Policies need to provide incentives to develop more
fuel-efficient technologies. The single target and uniform percentage improvement designs pose the same problems for fairness between manufacturers, as they do for passenger vehicles (even though the difference is probably not as great).
Both Japan and the United States have adopted category-based HDV standards. Given the differences in applicable technologies among large- and middle-sized trucks and the measurement method of fuel efficiency using a common value for gross vehicle weight, categories can reasonably be assigned according to gross vehicle weight. As with passenger vehicles, policy makers need to carefully consider how many categories to create. If they create too many categories, the number of vehicle types in each category would be too small to develop appropriate target values. This problem could be more serious for HDVs than for light-duty passenger vehicles, because there are fewer HDV vehicle types. The administrative costs for developing target values would also increase for a larger number of categories.
Box 15 Increasing�flexibility
to alleviate the problem of rigidity in the categories system, Japan allows manufacturers to offset the debit in some categories by using the credit they gain in other categories. this system can offer a flexibility similar to that of attributed-based standards. governments should also be aware that category-based standards require sufficient resources to conduct detailed technology analysis.
Box 16 Special�regulations�for��small�manufacturers
due to a limitation in resources, manufacturers that sell a small number of vehicles may have difficulty in improving fuel efficiency up to the same level as large manufacturers. given that the impact of the improvement of fuel efficiency by small manufacturers is not so large, governments may impose specific regulations on small manufacturers as long as such regulations can fully motivate them to improve their fuel efficiency. In the european union’s co2 regulations, for example, small manufacturers, which make 10 000 to 300 000 vehicles annually, are required to improve their average co2 emissions by 25% compared to their average co2 emissions in 2007 by 2015 (eu, 2009).
© O
EC
D/IE
A, 2
012

54 Policy Pathway ImprovIng the Fuel economy oF road vehIcles
Determine attribute on which to base fuel economy standard
When adopting continuous curve or category-based attribute standards, policy makers need to choose an appropriate attribute or basis for developing reasonable standards.
Two attributes, vehicle weight and footprint, are currently used for designing fuel efficiency standards of LDVs (Table 11). Footprint refers to wheelbase times track width, which indicates vehicle size. The United States uses footprint as an attribute. The European
Union and Japan use vehicle weight as an attribute, and Japan sets target values in each vehicle weight category. Other possibilities for vehicle attributes are engine power and interior volume, but they are not widely used.
Trucks and buses are operated to transport either freight or passengers, and so gross vehicle weight or payload, instead of vehicle weight, is an appropriate basis for target values for HDVs. Japan and the United States create target values in each gross vehicle weight category. When gross vehicle weight is used as a basis, however, fuel efficiency standards do not
table 11 Comparison of strengths and weaknesses associated with different attributes for fuel economy standards
Attribute Strengths Weaknesses Usage
lDV
Weight z Strong relationship between weight and fuel economy
z Could discourage manufacturers from reducing weight
European Union, United States, Japan
Footprint z More closely related to consumer criteria so easier to compare vehicles
z Can encourage manufacturers to reduce vehicle weight
z Not strongly related to fuel economy
z Difficult to set targets United States
hDV
Gross vehicle weight
z Reflects vehicle usage in terms of freight and passenger carrying
z Does not promote a reduction in vehicle weight, because will be offset by an increase in payload and thus would not change gross vehicle weight
Japan, China, United States
Payload z Parameters related to payload or load capacity as basis could be more cost-effective
z Can create an incentive to increase payload
z Potential for unfairness to manufacturers selling vehicles with low payloads United States
LCV
Gross vehicle weight = maximum allowable total weight of vehicle when loaded. Payload = weight vehicle is able to carry but does not include weight of vehicle itself.
© O
EC
D/IE
A, 2
012

55Policy Pathway ImprovIng the Fuel economy oF road vehIcles
give manufacturers an incentive to reduce vehicle weight, because reduction in vehicle weight will be offset by an increase in payload and thus would not change gross vehicle weight. (This problem could be alleviated by market mechanisms, such as fuel prices, that cause consumers to demand manufacturers to increase payload.)
Payload, also called load capacity, could be more an important factor when consumers choose a truck, because freight companies are likely to know the suitable payload of trucks for their own businesses and choose trucks based on it. Using parameters related to payload or load capacity as a basis is more easily understood as it can be related to the main function of the vehicle and is therefore more consumer-friendly. Also, given that an increase in payload might lead to reduction in fuel consumption as a whole, fuel efficiency standards should create an incentive to increase payload. Focusing on fuel consumption per tonne-kilometre, which means the amount of fuel consumption when conveying 1t for 1 km, is one reasonable option as a basis. In this case, fuel consumption per kilometre will be divided by payload and an increase in payload can improve the vehicle fuel efficiency.
Using tonne-kilometre as a basis also allows governments to compare the fuel economy of a broader range of vehicles than using gross vehicle weight, because the actual vehicle body weight is not included (M.J. Bradley and Associates LLC, 2009). Conversely, if manufacturers are discouraged from selling trucks with small payloads to meet target values more easily, those that need trucks with small payloads may have trouble finding suitable trucks. Governments may, therefore, need to carefully consider what characteristic is most appropriate for use across the different vehicle classes to compare fuel economy.
choose target values
Target values should be ambitious enough to motivate manufacturers to make sufficient efforts to improve fuel efficiency. At the same time, to be feasible, target values should be supported by technological analysis and not too ambitious
compared to the current market level. Extensive analysis is needed that includes the technological potential, costs of regulation and savings to the consumer, national short- and long-term energy and climate goals, as well as the political situation. In many cases, political concerns play a role in setting the level of target value. For this reason, a full impact assessment should provide evidence of the impact of different target values on vehicle fleet fuel economy and CO2 emissions and assist in implementing the life-cycle cost-optimal level.18 Countries have different priorities when deciding target values. For example, the European Union focused on the contribution that automobiles could make to CO2 reduction. In principle, the European Union decided target values on political grounds, and then tried to develop the most cost-effective design of fuel efficiency standards. Japan focused on a more technological perspective (Box 17).
18. Life-cycle cost optimal performance level means the energy performance leading to minimum life-cycle cost.
© O
EC
D/IE
A, 2
012

56 Policy Pathway ImprovIng the Fuel economy oF road vehIcles
introduce measures to avoid increasing vehicle weight
As noted above, with regard to LDVs, governments need to consider how to prevent the shift of the sales mix to heavier and larger vehicles if they introduce category-based standards.
Two main deterrents may be used to discourage increasing vehicle weight. The first deterrent is to introduce a standard design that imposes relatively stringent target values on heavier and bigger vehicles. Such a standard will encourage manufacturers to sell smaller vehicles. As shown in the EU case study, careful choice of the slope and/or steps setting the fuel economy value at different attribute levels should be a sufficient incentive to prevent substantial average increases in the attribute.
Of course, a certain number of consumers may still buy bigger and heavier vehicles. However, with careful design of the attribute curve, i.e. a steeper slope or categories, such vehicles will be required to make substantial improvement in fuel efficiency, which should compensate for the shift of the sales mix to bigger vehicles and ensure reduction in fuel consumption as a whole.
The second deterrent for preventing an increase in average vehicle weight is the introduction of taxes based on absolute values of fuel economy or CO2 emissions. These taxes will keep in focus the ultimate goal of reduction in fuel consumption or CO2 emissions of the fleet. Fuel taxes also play a role in encouraging the sale of vehicles with better fuel economy, regardless of any other characteristics.
Box 17 Top�Runner�approach�in�Japan
Japan introduced a method for deciding target values, called the top runner approach (metI and mlIt, 2007). this method, first, determines the most fuel-efficient vehicle in each category, called the top runner. next, the method estimates the technology level in the target year. more specifically, the Japanese government estimates how much each technology will prevail by the target year and how much fuel efficiency will be improved by the introduction of the technology, and then calculates the aggregate improvement rate. the government also evaluates the negative effects on fuel efficiency that would occur by the target year. safety amendments or pollutant regulations, for example, could worsen fuel efficiency. Based on these estimates, the government calculates the future fuel efficiency that the current top runner could reach by the target year in each category. these estimated future fuel efficiencies are then established as the target values of each category.
In this method, target values can be decided at a cost-effective level, because the prevalence rates of each technology are estimated, taking into account the costs of each technology. the top runner approach is based on the premise that the average fuel efficiency in each category could be improved to the current top runner level. commercial vehicles sometimes have special characteristics that meet specific market needs which make it difficult to optimise fuel efficiency. vehicles used in areas with heavy snow, for example, may be less fuel efficient than vehicles used in other areas, because such vehicles would need all-wheel drive. thus, the premise of the top runner approach that the average fuel efficiency should be up to the top runner level may not be realistic in some cases.
governments may need to consider how to address this issue if some manufacturers mainly sell less fuel-efficient vehicles due to specialisation to meet market needs.
© O
EC
D/IE
A, 2
012
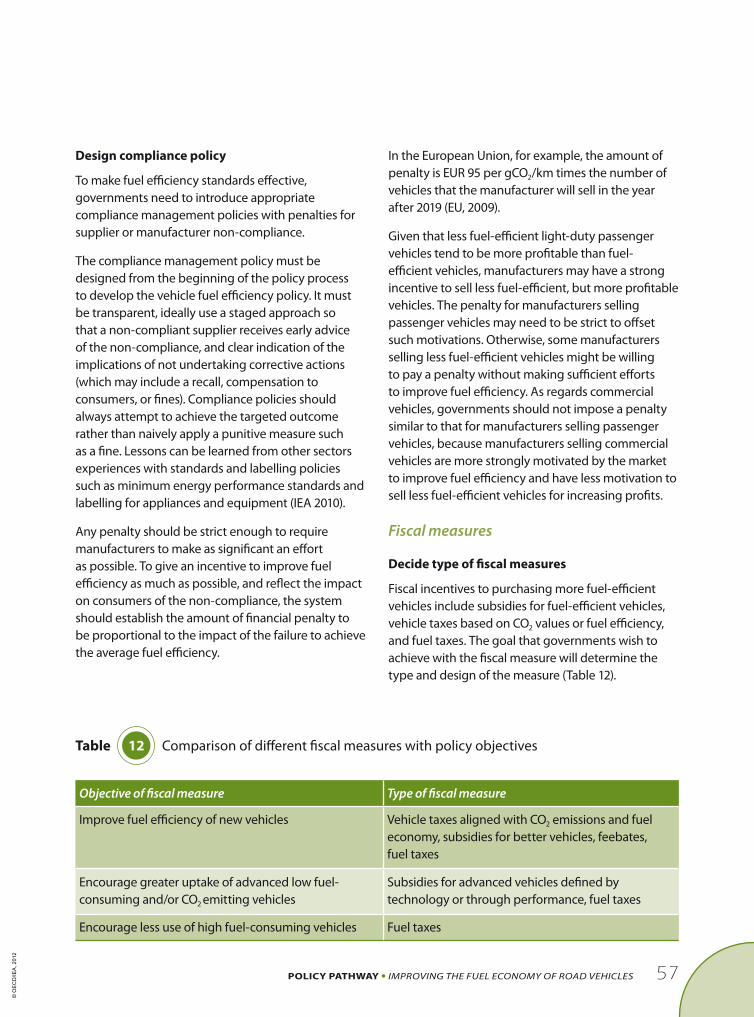
57Policy Pathway ImprovIng the Fuel economy oF road vehIcles
Design compliance policy
To make fuel efficiency standards effective, governments need to introduce appropriate compliance management policies with penalties for supplier or manufacturer non-compliance.
The compliance management policy must be designed from the beginning of the policy process to develop the vehicle fuel efficiency policy. It must be transparent, ideally use a staged approach so that a non-compliant supplier receives early advice of the non-compliance, and clear indication of the implications of not undertaking corrective actions (which may include a recall, compensation to consumers, or fines). Compliance policies should always attempt to achieve the targeted outcome rather than naively apply a punitive measure such as a fine. Lessons can be learned from other sectors experiences with standards and labelling policies such as minimum energy performance standards and labelling for appliances and equipment (IEA 2010).
Any penalty should be strict enough to require manufacturers to make as significant an effort as possible. To give an incentive to improve fuel efficiency as much as possible, and reflect the impact on consumers of the non-compliance, the system should establish the amount of financial penalty to be proportional to the impact of the failure to achieve the average fuel efficiency.
In the European Union, for example, the amount of penalty is EUR 95 per gCO2/km times the number of vehicles that the manufacturer will sell in the year after 2019 (EU, 2009).
Given that less fuel-efficient light-duty passenger vehicles tend to be more profitable than fuel-efficient vehicles, manufacturers may have a strong incentive to sell less fuel-efficient, but more profitable vehicles. The penalty for manufacturers selling passenger vehicles may need to be strict to offset such motivations. Otherwise, some manufacturers selling less fuel-efficient vehicles might be willing to pay a penalty without making sufficient efforts to improve fuel efficiency. As regards commercial vehicles, governments should not impose a penalty similar to that for manufacturers selling passenger vehicles, because manufacturers selling commercial vehicles are more strongly motivated by the market to improve fuel efficiency and have less motivation to sell less fuel-efficient vehicles for increasing profits.
Fiscal measures
Decide type of fiscal measures
Fiscal incentives to purchasing more fuel-efficient vehicles include subsidies for fuel-efficient vehicles, vehicle taxes based on CO2 values or fuel efficiency, and fuel taxes. The goal that governments wish to achieve with the fiscal measure will determine the type and design of the measure (Table 12).
Objective of fiscal measure Type of fiscal measure
Improve fuel efficiency of new vehicles Vehicle taxes aligned with CO2 emissions and fuel economy, subsidies for better vehicles, feebates, fuel taxes
Encourage greater uptake of advanced low fuel-consuming and/or CO2 emitting vehicles
Subsidies for advanced vehicles defined by technology or through performance, fuel taxes
Encourage less use of high fuel-consuming vehicles Fuel taxes
table 12 Comparison of different fiscal measures with policy objectives
© O
EC
D/IE
A, 2
012

58 Policy Pathway ImprovIng the Fuel economy oF road vehIcles
Restructuring the vehicle tax system to favour relatively fuel-efficient vehicles helps achieve the objective to improve the fuel efficiency of the conventional vehicle fleet. The vehicle tax should be aligned with fuel economy standard categories (as in Japan, for example). In many European countries, the vehicle tax is proportionate to the CO2 value of each vehicle, which gives comparative advantages to more fuel-efficient vehicles. This type of incentive can encourage manufacturers to improve fuel efficiency of most vehicles regardless of weight or size. This incentive, on the other hand, may not be sufficient to encourage highly fuel-efficient vehicles, unless the incentive is large. It is very important to align the fuel economy incentives with the information provided to consumers, i.e. through the use of the same fuel economy or CO2 emissions bands.
Another type of vehicle fiscal measure is to provide strong incentives, including tax deductions and subsidies, to significantly advanced vehicles with low CO2 emissions or high fuel efficiency. These rebates or subsidies are widespread in many US states for hybrid and electric vehicles, and also in Japan (Gallagher and Muehlegger, 2011; METI, 2011; DOE, 2011). Given the relatively high costs of such vehicles with innovative technologies, such incentives can offset some of the upfront cost associated with an advanced technology. The incentives may help to increase vehicle sales, leading to cost reduction of these vehicles due to volume efficiency. Careful consideration is needed in awarding subsidies to specific technologies, because the risk of technology lock-in could delay the development of other technologies.19 To avoid technology lock-in, governments should determine the vehicles that are eligible for receiving incentives based on vehicle performance rather than vehicle technology. Also the incentives and eligible vehicles should be constantly shifting to ensure that the most innovative vehicles are favoured over more conventional vehicles.
19. Technology lock-in occurs when regulation or economic forces cause technology in a particular field to be developed along a particular technological path, and where the barriers to switching to another, possibly more efficient path, may be prohibitive due to increasing institutional or economic returns.
Imposing higher fuel taxes can encourage consumers to purchase more fuel-efficient vehicles, drive in an eco-friendly manner and reduce unnecessary driving. Fuel subsidies should first be removed to reduce the incentive to drive higher fuel-consuming vehicles. Higher fuel taxes and prices may be politically difficult and be perceived as unfairly affecting socially-vulnerable groups. In raising fuel taxes, additional measures may be needed, such as ensuring good quality public transport, to provide alternatives to passenger car use. Another concern is that the higher tax could be detrimental to transport-related businesses and the economy in general.
Determine level of fiscal measure
In all three cases of fiscal measures, the level of the incentive or tax is important. High taxes and incentives are usually needed to drive behavioural change, but this approach may not be economically or socially efficient. The amount of the incentives, particularly, needs to be carefully considered so that they continue to raise revenue or at least are budget neutral from a societal point of view, depending on the main goal. If a big incentive causes a shift in the market too rapidly, government’s revenue from vehicle taxes will be significantly reduced. As a consequence, governments may be required to amend the tax system or tax values more frequently, confusing manufacturers and consumers. Recent experience with vehicle tax incentives in France with the bonus/malus scheme showed that consumers reacted very strongly to the bonus or rebate that was awarded to purchasers of low CO2-emitting vehicles, with the result that the scheme was significantly over budget.
Set duration of fiscal measure
By giving notice of the duration of the tax incentive, vehicle manufacturers or dealers can plan their vehicle model mix for the market. If a longer timeframe is given, they are more likely to adjust their marketing and offer to favour more fuel-efficient vehicles. Incentives and other price signals, such as tax deductions and subsidies, should be provided for an extended period for several reasons.
© O
EC
D/IE
A, 2
012

59Policy Pathway ImprovIng the Fuel economy oF road vehIcles
First, if governments offer incentives for a short period, consumers may rush to buy vehicles in that term, curtailing sales volume over the subsequent few years.
Second, in the short term, manufacturers cannot decrease the costs of new technologies due to low volumes and learning effects. Thus, consistent pricing is needed for at least five years to encourage the development of advanced vehicles, which may be difficult to ensure politically over several administrations.
Summary of key actions: design fuel economy policies
Fuel economy labels and information
z Decide scope of labelling scheme.
z Select fuel economy label design.
z Align design of label with other measures.
z Determine requirements for vehicle promotional and other materials.
Fuel economy standards
z Decide form of fuel economy standard.
z Determine attribute on which to base fuel economy standard.
z Choose target values for fuel economy standard.
z Introduce measures to avoid increasing vehicle weight.
z Design compliance policy.
Fiscal measures
z Decide type of fiscal measures.
z Determine level of fiscal measure.
z Set duration of fiscal measure.
© O
EC
D/IE
A, 2
012

60 Policy Pathway ImprovIng the Fuel economy oF road vehIcles
5 certify fuel economy
Decide fuel economy certification process, utilising existing certification schemes
Governments need to certify the fuel efficiency or CO2 emissions value of each vehicle before vehicles go to market by performing laboratory tests on pre-production vehicles. The certification process ensures the fuel economy value of vehicles. The values obtained in the certification process enable monitoring of the fuel economy of the sales mix, the creation of a label, and the award of fiscal subsidies as appropriate. In most countries, the majority of testing is performed by manufacturers at their own facilities. The national certification authority audits the data from this testing and should perform its own testing on some vehicles to confirm the manufacturers’ results. These test data should be made available to the public.
Where possible, this process should be implemented under the existing vehicle certification scheme used for safety and local pollutant homologation. If governments, for example, are already conducting emission tests using a chassis dynamometer for other emissions, such as NOx, hydrocarbons or particulate matter (PM), fuel efficiency or CO2 can be measured and certified at the same time. For HDVs, where only engine dynamometer testing is carried out for air pollutant emissions, additional testing that includes computer simulation is likely to be needed for fuel economy measurement.
Define certification vehicle family
Governments also need to determine so-called “vehicle families” for the purpose of certification, which consists of grouping different versions of vehicles that have the same fuel efficiency. Although
vehicles tend to have various versions with small changes to the fuel economy, measuring the fuel efficiency of all versions is costly and time consuming. This issue is particularly important for HDVs, which have a high number of versions and configurations.
The consequences of vehicle family selection is that, if a few, large families are chosen, less testing is required for manufacturers and public authorities alike. Usually, manufacturers are given free choice on how they select their vehicle families; however, they are required to test the worst-performing vehicle in the family. It is not in the manufacturer’s interest, therefore, to group large numbers of cars with better fuel economy than the one tested in the same vehicle family. As a result, manufacturers will often choose to create more vehicle families with fewer vehicle models in each.
When fewer vehicle families covering a large number of models exist, less information is available for consumers on individual vehicle fuel economy, and distinguishing between vehicle models will be difficult. Manufacturers also have less incentive to improve the fuel economy of different variants of the vehicle model.
Summary of key actions: certify fuel economy
z Decide fuel economy certification process, utilising existing vehicle certification schemes.
z Define certification vehicle family.
IMPlEMENT
� E
VALUATE �
� PLAN �
� IMPLEM
ENT
�
� M
ON
ITOR �
© O
EC
D/IE
A, 2
012
61Policy Pathway ImprovIng the Fuel economy oF road vehIcles
6 make information accessible to public
Governments have several tools to make it easier for the public to access information about fuel efficiency and fiscal incentives.
Require manufacturers to display fuel economy information
Governments should require manufacturers to display vehicle fuel efficiencies in their catalogues and at the showroom. If governments introduce a tax based on CO2 or fuel economy values, the tax value should be highlighted in manufacturer information, which will attract the public’s attention and encourage them to purchase fuel-efficient vehicles. Use of a labelling scheme described in step 4 is the most effective way. To enable the public to easily compare vehicles made by different manufacturers, governments can create printed and web-based comparison guidelines and require retailers and manufacturers to include labels in their catalogues as well as at point of sale.
Publish fuel economy information on government website
A guide should be made available to consumers in various media, but especially on the internet, which allows them to compare the fuel economy of different vehicles. The public authority is usually responsible for putting this information together through the certification and labelling process. Examples of these tools can be found for example in the United Kingdom and the United States.20 The website should also provide information on any related fiscal measures.
Through the labelling process, governments can make the information available to the public in real time and can monitor the information in the country’s context. Public authorities can also gather the data monthly and track whether the policy is making an impact.
20. United States: www.fueleconomy.gov/. United Kingdom: http://carfueldata.direct.gov.uk/search-new-or-used-cars.aspx.
Interactive tools such as web portals, forums, and hot lines can be used to answer requests from the public about fuel economy policies and standards.
time release of information when introducing fiscal incentives
If governments decide to introduce new or amended fiscal incentives for fuel-efficient vehicles, they should publish the information as soon as possible including advance notice of phase-in dates, because some consumers may plan to buy a car a few months beforehand, and their decision-making may be influenced by fiscal incentives.
An alternate approach may be to release the information on fiscal incentives later to avoid adverse effects on the market, such as occurred in France where the bonus/malus scheme was announced in September for implementation the following January. The last month of the calendar year showed a boom in sales of high CO2 emitters that were going to be subjected to a malus, or tax, once the scheme was in place.
The timing of the release of information on fiscal incentives, therefore, should be considered carefully. A balance needs to exist between giving car purchasers and manufacturers the information in advance to prepare for the change, and avoiding a rush of sales of high fuel-consuming vehicles if too big a gap exists between the announcement and the beginning of the fiscal incentive.
Summary of key actions: make information about fuel efficiency and relevant policies accessible to the public
z Require manufacturers to display fuel economy information.
z Publish fuel economy information on government website.
z Time release of information carefully when introducing fiscal incentives.
© O
EC
D/IE
A, 2
012

62 Policy Pathway ImprovIng the Fuel economy oF road vehIcles
MONITOR
� E
VALUATE �
� PLAN �
� IMPLEM
ENT
�
� M
ON
ITOR �
7 check compliance with fuel economy policies
collect data to monitor fuel economy
As part of the fuel economy policy process, governments should annually gather data to monitor the fuel economy of vehicles on the market. These data are necessary to carry out two important tasks:
z check compliance with fuel economy standards and labelling;
z facilitate evaluation of the effectiveness of fuel economy policies.
The data collected should be selected to match the analysis to be performed. A data collection system is needed to collect, at a minimum: vehicle fuel economy data (at individual model level from certification), at least the average fuel efficiency of vehicles of each manufacturer, average fuel efficiency of all new vehicles sold, average fuel efficiency of each category (if governments introduce category-case standards), average vehicle weight, sales volume and the sales mix in the market. Data should be collected from manufacturers and through independent verification testing.
Governments need to collect reliable sales data, by model, in order to monitor compliance and evaluate the effectiveness of the policy. Commercial sales data is confidential in nature and so its secure collection and management should be included within the regulations which promulgate the policy. Enterprises that collect market-place data may also be well placed to provide additional independent sales data to government agencies. An administrative system must be developed to manage these data in a secure central system.
check conformity of vehicles sold
Conformity of Production (CoP) is a compulsory tool to ensure that the vehicle that is mass produced has the same performance as the vehicle that has been homologated and certified. Random vehicles are usually picked out of the production line to be tested in independent test facilities. Other similar tests are also performed over the vehicle’s lifetime to ensure that the performance is maintained over a long period of time.
check compliance with policies
Measuring the level of compliance is crucial to effective standards and labelling programmes. A visible monitoring programme can help encourage compliance. If significant non-compliance exists, resources and even targets may need to be adjusted.
Public authorities have the responsibility to check that manufacturers are in compliance with requirements. Depending on the policies implemented, this checking could mean verifying that manufacturers meet the fuel economy targets set, that mandatory labels are correctly displayed and that the published fuel economy values on labels or elsewhere are correct.
The method of assessing compliance needs to be able to withstand the scrutiny of all stakeholder groups and legal requirements. Manufacturer data should be verified with an independent audit process and independent testing. Labels in vehicle dealerships should be randomly checked for accuracy.
Summary of key steps: check compliance with fuel economy policies
z Collect data to monitor fuel economy.
z Check conformity of vehicles sold.
z Check compliance with policies.
© O
EC
D/IE
A, 2
012

63Policy Pathway ImprovIng the Fuel economy oF road vehIcles
8 publish monitoring data
To fulfil their accountability about the effects of fuel efficiency standards and relevant policies, governments must publish information about the current situation of fuel efficiency and other relevant parameters. In several countries and regions, including the European Union, the United States and Japan, governments have published average fuel economy on their websites over several years, showing the trend (EC, 2010; MLIT, 2011c; EPA, 2010). In addition to the average fuel efficiency, the European Union has published average vehicle weight of new passenger vehicles by fuel, average engine capacity of new passenger vehicles by fuel, and the number of registration of new passenger vehicles by member states (EEA, 2011). Such information disclosure is important to attract the public’s attention and maintain the government’s transparency and credibility.
The publication of information related to manufacturer and vehicle fuel efficiency can affect corporate image, motivating manufacturers to make more efforts to improve. Some governments are publishing a list of the top most efficient vehicle models together with the worst performers. Publishing this information is also part of increasing awareness and motivating the public with an interest in fuel-efficient vehicles to purchase these vehicles.
Summary of key steps: publish monitoring data
z Publish information about trend of average fuel efficiency.
z Publish information on the most fuel-efficient vehicles to attract public’s attention.
© O
EC
D/IE
A, 2
012
64 Policy Pathway ImprovIng the Fuel economy oF road vehIcles
EVAlUATE
� E
VALUATE �
� PLAN �
� IMPLEM
ENT
�
� M
ON
ITOR �
9 evaluate and enforce policies
Evaluate level of compliance and enforce penalties
Based on data collection and monitoring, government agencies can see the level of compliance with the standards and labelling requirements. In cases of significant non-compliance, the authorities should respond appropriately. The agreed-upon system of enforcement and penalties should be followed in a manner that is fair and reasonable and that meets the expectations of all stakeholders – not only those of the manufacturer involved, but also of competitors and wider society.
The objective of compliance processes should be to enhance and achieve the policy objectives rather than becoming a disciplinary or punitive process. Differences may exist between the handling of non-compliance of small and large companies, compliance solutions work best when tailored to the compliance situation. The programme should be protected from increasing non-compliance while also not becoming overly complicated.
Evaluate impacts of fuel economy policies
Policymakers must study the effectiveness of their fuel efficiency policies in achieving their goals. Governments may track the improvement rate of average fuel efficiency, shifts in the sales mix, changes in sales volume, and available technologies for the further improvement of fuel efficiency. In order to do this it is important to estimate at the time of the policy design baseline or reference assessments of the vehicle stock, its composition and analyses of fuel efficiency that would have occurred without implementation of the policy. Policies should be compared with equivalent policies in other countries to evaluate implementation, effectiveness,
and cost. A cost-benefit analysis of the scheme and consultation with stakeholders is essential to help understand experience to date. Criteria to evaluate the policies should be grouped under economic efficiency (manufacturer, administrative and consumer costs), effectiveness, and other priority criteria specific to the country circumstances (such as social or equity issues).
Given budget restrictions and the strong impacts of fiscal incentives, governments may tend to amend fiscal incentives more frequently than fuel efficiency standards, according to shifts in the sales mix and improvements in fuel efficiency. When doing so, governments should carefully evaluate how markets responded to previous fiscal incentives and estimate the impacts of possible new fiscal incentives so as to implement them effectively while maintaining vehicle tax revenue. For evaluation of the design of fuel economy labels, a survey of consumers can reveal whether the current label is easily understood, useful, and effective.
Summary of key actions: evaluate and enforce policies
z Evaluate level of compliance and enforce penalties.
z Evaluate impacts of fuel economy policies.
10 revise policies
change design and mix of fuel economy policies if needed
Evaluation of the current policies can indicate where improvement can be made in the design of labelling, the fuel economy standards, and fiscal measures. At regular intervals, policymakers should consider taking the opportunity to “tweak” current policy, redesign it, or to add a new policy. However, such changes should be gradual and in keeping with the overall framework lest they undermine confidence in the long-term goals.
© O
EC
D/IE
A, 2
012

65Policy Pathway ImprovIng the Fuel economy oF road vehIcles
For fuel economy standards, policymakers may need to consider at least whether they need to change their attribute or basis, change their schemes, improve the measurement method of fuel efficiency (especially the method for HDVs), and introduce several new devices, such as a credit trade system and a banking system. The design of a fuel economy label may be changed to include more information or be made clearer, or labels could become mandatory. Fiscal measures may be adjusted based on the government’s budget and prevalent fuel prices. Of these three policies, fuel economy standards are the most difficult and slow to change, and therefore, changes should not be undertaken lightly.
Develop new target values as technology improves
As technology improves, governments should continuously develop higher target values for fuel economy standards. If most manufacturers have
already achieved fuel efficiency standards before the target year, governments should give manufacturers new target values to guide their research and development. Similarly fuel economy labels and fiscal measures should be adjusted regularly to ensure that the most fuel efficient vehicles are incentivised and promoted.
Summary of key steps: revise fuel economy policies
z Change design and mix of fuel economy policies if needed.
z Develop new target values as technology improves.
© O
EC
D/IE
A, 2
012

66 Policy Pathway ImprovIng the Fuel economy oF road vehIcles
conclusions
Reduction in fuel consumption in the road transport sector is crucial to realising economic, social and energy security benefits as well as transitioning to a low-carbon energy economy, as outlined in the technology roadmap: Fuel economy of road vehicles. Public policies are needed, such as mandatory fuel economy labelling, standards, and fiscal incentives. These policies can affect consumer vehicle choice and motivate manufacturers to improve vehicle fuel efficiency. These policies should, therefore, be designed as a policy package to effectively address market and behavioural failures, including externalities and lack of information.
Policy packages for vehicle fuel economy have already been developed under different schemes in several countries; governments can and should benefit from the experience of other countries with existing policies when developing their own fuel efficiency policy package, and are encouraged to review existing policies in similar countries.
The provision of information to vehicle purchasers is key to raising public awareness and enabling consumers to purchase the most fuel-efficient
vehicles. The information provided should be transparent and readily understandable by consumers.
In the design of standards, governments should be careful to maintain fairness among manufacturers, support cost-effectiveness and enforcement capabilities, and be aware of market needs. Alignment with international standards and testing processes is important for ensuring transparency and minimising trade problems. Target values should be feasible and high enough to require manufacturers to make sufficient efforts to meet them. Governments should also develop a system for implementation, monitoring and evaluation of fuel efficiency standards, because these steps are critical to achieve sustainable improvement of fuel economy.
Fiscal measures are important to affecting market transformation to more fuel-efficient vehicles.
This policy pathway identifies ten key steps for planning, implementing, monitoring, and evaluating fuel efficiency policy measures for governments.
© O
EC
D/IE
A, 2
012

67Policy Pathway ImprovIng the Fuel economy oF road vehIcles
Phases Critical steps Actions
PlA
n
1 Decide scope, type and schedule of policies
• Gather information• Determine scope and type of fuel economy measures• Consult on policy schedule with stakeholders• Decide target year aligned with national goals
2 Decide measurement method
• Gather information about traffic conditions• Determine measurement approach• Develop driving cycle
3 Secure resources• Allocate fiscal and human resources• Develop system for gathering and certifying essential information • Engage in broad consultation
4 Design policies
Fuel economy labelling and information
Fuel economy standards
Fiscal measures
• Decide scope of labelling scheme
• Select fuel economy label design
• Align design of the label with other measures
• Determine requirements for vehicle promotional and other materials
• Decide on form of fuel economy standard
• Determine attribute on which to base fuel economy standard
• Choose target values • Introduce measures
for increasing vehicle weight
• Sign compliance process
• Decide type of fiscal measure
• Determine level of fiscal measure
• Set duration of fiscal measure
IMPl
EMEn
t 5 Certify fuel economy
• Decide fuel economy certification process, utilising existing vehicle certification schemes
• Define certification vehicle family
6 Make information accessible to public
• Require manufacturers to display fuel economy information• Publish fuel economy information on government website• Time release of information when introducing fiscal incentives
Mo
nIt
oR
7 Check compliance with fuel economy policies
• Collect data to monitor fuel economy• Check conformity of vehicles sold• Check compliance with policies
8 Publish monitoring data
• Publish information about trend of average fuel efficiency to fulfil government’s accountability
• Publish information on some of most fuel-efficient vehicles to attract public’s attention
EvA
luAt
E 9 Evaluate and enforce policies
• Evaluate level of compliance and enforce penalties• Evaluate impacts of fuel economy policies
10 Revise policies• Change design and mix of fuel economy policies if needed • Develop new target values as technology improves
table 13 Summary of fuel economy policy pathway critical steps and actions
© O
EC
D/IE
A, 2
012

68 Policy Pathway ImprovIng the Fuel economy oF road vehIcles
On 7 February 2007, the European Commission adopted Communication COM(2007)19 final,21 which outlines a comprehensive strategy to reduce CO2 emissions from new passenger cars. As a part of this strategy, the European Union decided to regulate CO2 emissions from new passenger cars registered in the European Union.22 The fleet average to be achieved in the period 2012-15 by all new passenger cars registered in the European Union is 130 gCO2/km. A second target of 95 gCO2/km is included for 2020. This case study shares the EU experiences in developing and implementing this regulation as steps along the IEA fuel economy policy pathway.
1. decide scope, type and schedule of policies
Before 2007, the Community’s strategy was based on three pillars, as outlined by the Commission in its Communication of 199523 and subsequently supported by the Council and European Parliament.24 This structure allowed for the combination of measures addressing both supply (voluntary commitments) and demand (labelling and taxation). By 2007, however, this strategy was deemed to be not delivering sufficient CO2 reductions.
The 2007 strategy aimed at reaching the Community objective of an equivalent of 120 gCO2/km by 2012
21. Communication from the Commission to the Council and the European Parliament – Results of the review of the Community Strategy to reduce CO2 emissions from passenger cars and LCVs: http://eur-lex.europa.eu/LexUriServ/LexUriServ.do?uri=CELEX:52007DC0019:EN:NOT.
22. Regulation (EC) no 443/2009 of the European Parliament and of the Council of 23 April 2009 setting emission performance standards for new passenger cars as part of the Community’s inte-grated approach to reduce CO2 emissions from light-duty vehicles, http://eur-lex.europa.eu/LexUriServ/LexUriServ.do?uri=OJ:L:2009:140:0001:0015:EN:PDF
23. COM(95) 689 A Community strategy to reduce CO2 emissions from passenger cars and improve fuel economy.
24. Council conclusions of 25 June 1996, European Parliament resolution of 22 September 1997.
through a legislative framework addressing supply-oriented measures. The package of measures listed the following elements:
z objective of 130 gCO2/km for the average new car fleet by means of improvements in vehicle motor technology;
z minimum efficiency requirements for air-conditioning systems;
z compulsory fitting of accurate tyre pressure monitoring systems;
z maximum tyre rolling resistance limits in the European Union for tyres fitted on passenger cars and LCVs;
z use of gear shift indicators, taking into account the extent to which such devices are used by consumers in real driving conditions;
z fuel efficiency progress in LCVs (vans) with the objective of reaching 175 gCO2/km by 2012 and 160 gCO2/km by 2015; and
z increased use of biofuels maximising environmental performance.
All the above listed elements of the 2007 strategy have been mostly implemented by now as analysed in the progress report on implementation of the Community’s integrated approach to reduce CO2 emissions from light-duty vehicles.25
2. decide measurement method
The European Union decided to use the existing passenger vehicle test procedure, which uses a chassis dynamometer with a driving cycle, called the New European Driving Cycle (NEDC).
Because the test procedure used for vehicle type approval is outdated, certain innovative technologies cannot demonstrate their CO2-reducing effects
25. http://eur-lex.europa.eu/LexUriServ/LexUriServ.do?uri=CELEX:52010DC0656:EN:NOT
annexes
Case�Study�1:�European�Union�CO2�passenger�car�regulation
© O
EC
D/IE
A, 2
012
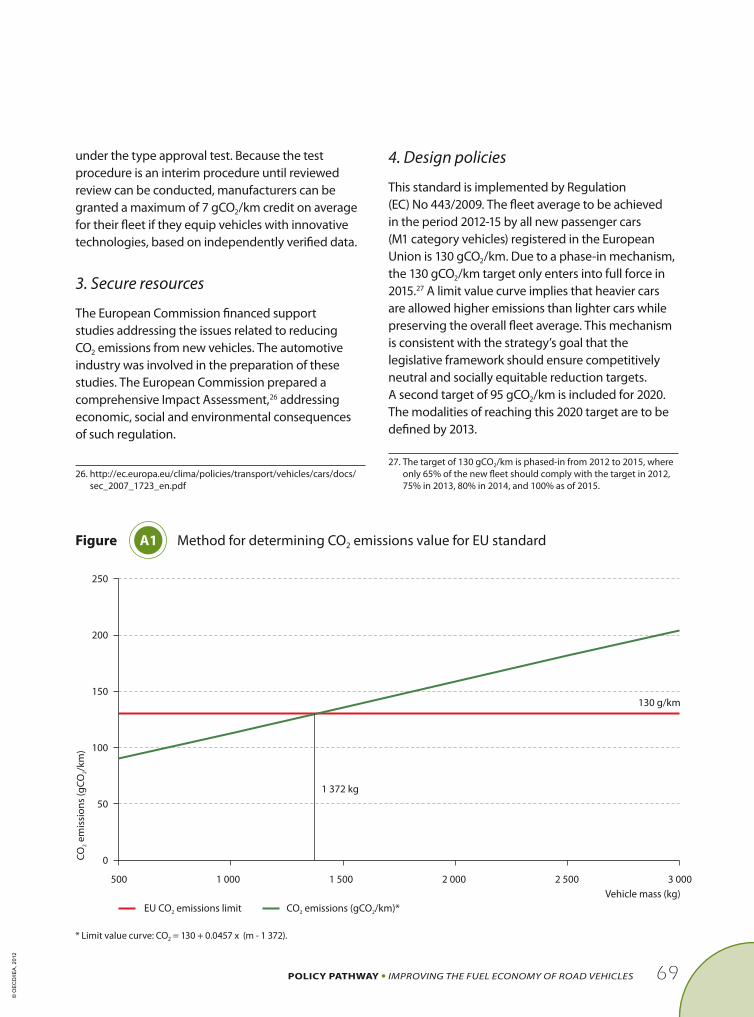
69Policy Pathway ImprovIng the Fuel economy oF road vehIcles
under the type approval test. Because the test procedure is an interim procedure until reviewed review can be conducted, manufacturers can be granted a maximum of 7 gCO2/km credit on average for their fleet if they equip vehicles with innovative technologies, based on independently verified data.
3. secure resources
The European Commission financed support studies addressing the issues related to reducing CO2 emissions from new vehicles. The automotive industry was involved in the preparation of these studies. The European Commission prepared a comprehensive Impact Assessment,26 addressing economic, social and environmental consequences of such regulation.
26. http://ec.europa.eu/clima/policies/transport/vehicles/cars/docs/sec_2007_1723_en.pdf
4. design policies
This standard is implemented by Regulation (EC) No 443/2009. The fleet average to be achieved in the period 2012-15 by all new passenger cars (M1 category vehicles) registered in the European Union is 130 gCO2/km. Due to a phase-in mechanism, the 130 gCO2/km target only enters into full force in 2015.27 A limit value curve implies that heavier cars are allowed higher emissions than lighter cars while preserving the overall fleet average. This mechanism is consistent with the strategy’s goal that the legislative framework should ensure competitively neutral and socially equitable reduction targets. A second target of 95 gCO2/km is included for 2020. The modalities of reaching this 2020 target are to be defined by 2013.
27. The target of 130 gCO2/km is phased-in from 2012 to 2015, where only 65% of the new fleet should comply with the target in 2012, 75% in 2013, 80% in 2014, and 100% as of 2015.
0
50
100
150
200
250
500 1 000 1 500 2 000 2 500 3 000
Vehicle mass (kg)
CO
em
issi
on
s(g
CO
/km
)2
2
CO emissions (gCO /km)*2 2EU CO emissions limit2
1 372 kg
130 g/km
Figure a1 Method for determining CO2 emissions value for EU standard
* Limit value curve: CO2 = 130 + 0.0457 x (m - 1 372).
© O
EC
D/IE
A, 2
012
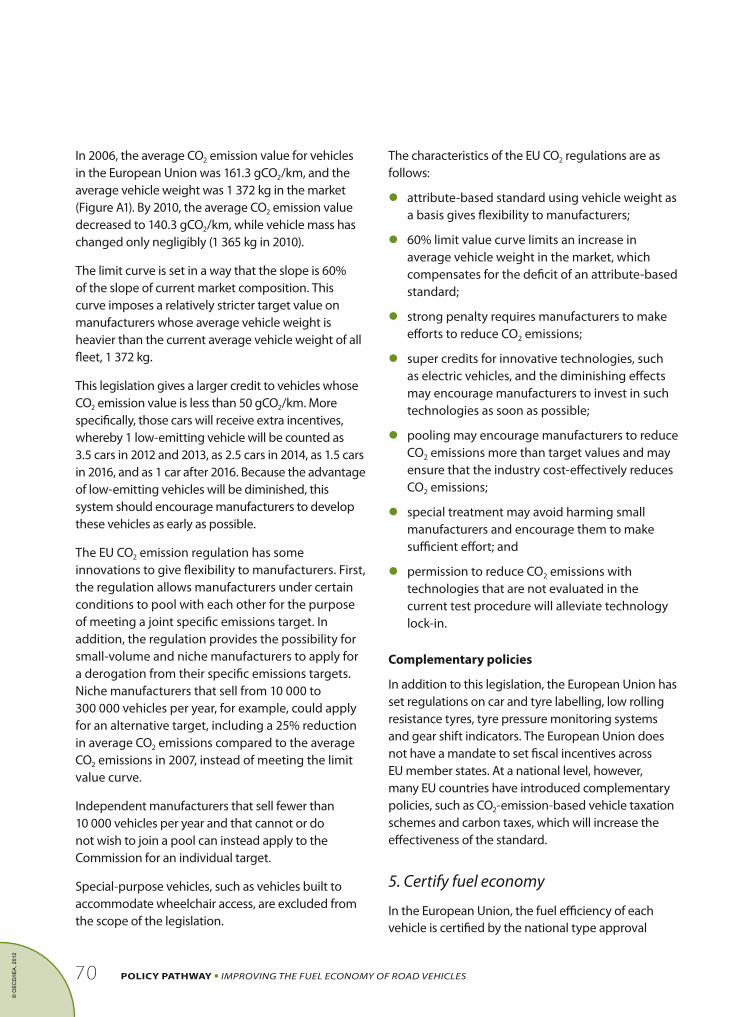
70 Policy Pathway ImprovIng the Fuel economy oF road vehIcles
In 2006, the average CO2 emission value for vehicles in the European Union was 161.3 gCO2/km, and the average vehicle weight was 1 372 kg in the market (Figure A1). By 2010, the average CO2 emission value decreased to 140.3 gCO2/km, while vehicle mass has changed only negligibly (1 365 kg in 2010).
The limit curve is set in a way that the slope is 60% of the slope of current market composition. This curve imposes a relatively stricter target value on manufacturers whose average vehicle weight is heavier than the current average vehicle weight of all fleet, 1 372 kg.
This legislation gives a larger credit to vehicles whose CO2 emission value is less than 50 gCO2/km. More specifically, those cars will receive extra incentives, whereby 1 low-emitting vehicle will be counted as 3.5 cars in 2012 and 2013, as 2.5 cars in 2014, as 1.5 cars in 2016, and as 1 car after 2016. Because the advantage of low-emitting vehicles will be diminished, this system should encourage manufacturers to develop these vehicles as early as possible.
The EU CO2 emission regulation has some innovations to give flexibility to manufacturers. First, the regulation allows manufacturers under certain conditions to pool with each other for the purpose of meeting a joint specific emissions target. In addition, the regulation provides the possibility for small-volume and niche manufacturers to apply for a derogation from their specific emissions targets. Niche manufacturers that sell from 10 000 to 300 000 vehicles per year, for example, could apply for an alternative target, including a 25% reduction in average CO2 emissions compared to the average CO2 emissions in 2007, instead of meeting the limit value curve.
Independent manufacturers that sell fewer than 10 000 vehicles per year and that cannot or do not wish to join a pool can instead apply to the Commission for an individual target.
Special-purpose vehicles, such as vehicles built to accommodate wheelchair access, are excluded from the scope of the legislation.
The characteristics of the EU CO2 regulations are as follows:
z attribute-based standard using vehicle weight as a basis gives flexibility to manufacturers;
z 60% limit value curve limits an increase in average vehicle weight in the market, which compensates for the deficit of an attribute-based standard;
z strong penalty requires manufacturers to make efforts to reduce CO2 emissions;
z super credits for innovative technologies, such as electric vehicles, and the diminishing effects may encourage manufacturers to invest in such technologies as soon as possible;
z pooling may encourage manufacturers to reduce CO2 emissions more than target values and may ensure that the industry cost-effectively reduces CO2 emissions;
z special treatment may avoid harming small manufacturers and encourage them to make sufficient effort; and
z permission to reduce CO2 emissions with technologies that are not evaluated in the current test procedure will alleviate technology lock-in.
complementary policies
In addition to this legislation, the European Union has set regulations on car and tyre labelling, low rolling resistance tyres, tyre pressure monitoring systems and gear shift indicators. The European Union does not have a mandate to set fiscal incentives across EU member states. At a national level, however, many EU countries have introduced complementary policies, such as CO2-emission-based vehicle taxation schemes and carbon taxes, which will increase the effectiveness of the standard.
5. certify fuel economy
In the European Union, the fuel efficiency of each vehicle is certified by the national type approval
© O
EC
D/IE
A, 2
012
71Policy Pathway ImprovIng the Fuel economy oF road vehIcles
authorities, which are government institutions or agencies authorised by the governments. The CO2 emissions are measured as part of the type approval process. The European Union adopted Whole Vehicle Type Approval (WVTA) as a common scheme across the European Union. Certified fuel efficiency by one of the type approval authorities is used as an EU-wide official value. The European Commission periodically organises type approval authorities meetings (TAAM) to exchange and discuss views and experiences of each authority.
6. make information accessible to the public
To help consumers choose vehicles with low fuel consumption when they buy cars, the European Union implemented Directive 1999/94/EC on the CO2 labelling of cars, which requires consumer information to be provided on the fuel economy of passenger cars.28 (Note: this directive was put in place much before the CO2 regulation.) Consumer information, in the form of labels showing a vehicle’s fuel efficiency and CO2 emissions, must be displayed at the car’s point of sale, on posters and other promotional material, and in specific guides.
Information should be provided to the consumer as follows:
z fuel economy label for all new cars to be displayed at the point of sale;
z poster (or a display) showing the official fuel consumption and CO2 emission data of all new passenger car models displayed or offered for sale or lease at or through the respective point of sale;
z guide on fuel economy and CO2 emissions; and
z all promotional literature must contain the official fuel consumption and specific CO2 emission data for the passenger car model to which it refers.
28. http://ec.europa.eu/clima/policies/transport/vehicles/labelling/docs/directive_en.pdf
In addition to meeting the requirements of the labelling directive, several member states have websites to show fuel efficiency and relevant information. The United Kingdom’s website, for example, provides information including fuel efficiency and tax values (UK, 2011). The website is user-friendly and provides guidance with clear language, which may enable users to obtain information without any prior background knowledge.
7. check compliance and publish information
Although the target year for implementation has not yet arrived, the European Union has started monitoring and has published information including the average CO2 value of the entire fleet and each member state (EU, 2010).
8. publish monitoring data
The Regulation (EC) No 443/2009 requires member states to record information for each new passenger car registered in its territory. Every year, each member state should submit to the Commission all the information related to their new registration. The information includes details such as manufacturer name, type, variant, version, make and commercial name, specific emissions of CO2, mass in running order, wheel base and track width. Additional information, such as fuel type, fuel mode and engine capacity are also to be submitted.
The EU Commission publishes online the monitoring data with the European Environment Agency on an annual basis.29
9. evaluate and enforce policies
If the average CO2 emissions of a manufacturer’s fleet exceed its limit value in any year from 2012, the manufacturer has to pay an excess emissions premium for each car registered. This premium
29. Available at www.eea.europa.eu/data-and-maps/data/co2-cars-emission-1.
© O
EC
D/IE
A, 2
012

72 Policy Pathway ImprovIng the Fuel economy oF road vehIcles
amounts to EUR 5 for the first gCO2/km above the limit, EUR 5 for the second gCO2/km, EUR 25 for the third gCO2/km, and €95 for each subsequent gCO2/km. From 2019, the first gCO2/km above the limit value will cost EUR 95.
The regulation has not yet been evaluated, as it only began in 2012.
10. revise standards and complementary policies
The regulation should be reviewed by 2013, based on the impact assessment to be carried out by the European Commission. These processes are mandated by the European Parliament and Council to ensure reductions in CO2 emissions from passenger cars. Moreover, the regulation has a future target value, 95 gCO2/km in 2020.
In 2006, Japan developed the first fuel economy standard for HDVs.
1. decide scope, type and schedule of policies
To help further reduce fuel consumption and CO2 emissions from road vehicles, Japan decided to develop fuel efficiency standards for HDVs, in addition to those for LDVs, because HDVs account for the second largest amount of CO2 emissions in the road transport sector, next to LDVs.
In Japan, the typical model change cycle of HDVs was five to ten years. Japan decided to set a lead-time that would allow manufacturers to change vehicle models one or two times, which would provide sufficient time to achieve improvement in fuel efficiency. The government also decided that the new air pollution regulation would be enforced after 2009 and 2010. Taking these factors into consideration, Japan chose 2015 as the target year. To allow lead-time before 2015, the Japanese government started the discussion in 2003 and finalised the regulation in 2006.
2. decide measurement method
When Japan decided to develop fuel efficiency standards for HDVs, no other government had previously developed a method to measure their fuel efficiency. Thus, Japan compared several possible methods in terms of accuracy, costs, and times, and then decided to adopt a method that was a combination of simulation and an engine-based test (Figure A2).
First, Japan corrected the data to show how the vehicles run on actual roads. The government gathered the data on urban roads and highways, because vehicle usage was significantly different on those two types of roads. Based on the data, Japan developed two driving cycles: urban and highway modes. Then Japan developed a simulation method that could convert a vehicle-based driving cycle to an engine-based operation cycle that defines engine torque and rotation speed for each second. The engine-based test measures fuel consumption under certain engine torque and rotation speeds. With these data, the method can calculate fuel consumption for each second. Then the summation of the fuel consumption for each second indicates the total fuel consumption. Based on it, the method calculates fuel efficiency.
Case�study�2:�Japanese�HDV�fuel�economy�standards
© O
EC
D/IE
A, 2
012

73Policy Pathway ImprovIng the Fuel economy oF road vehIcles
The fuel efficiency of a vehicle is determined as the combined fuel efficiency of two driving modes. More specifically, Japan measures the fuel efficiency of both urban and highway modes and then combines the fuel efficiency of the two modes
with a weighting factor. The weighting factor for these two modes is different among vehicle types because of the difference in their usage and is decided based on the statistical data of each vehicle type on roads (Table A1).
Figure a2 Method for calculating fuel efficiency for Japanese standard
Shift logic
time
Sp
ee
d
Shift position
Test cycle
Engine speed, engine torque
Instantaneous fuel consumption
Fuel consumption
Engine specification
��
Full load engine torqueFrictional engine torque
Running resistance
Fuel consumptionmap by actual test
Vehicle specification
The fuel consumptions of many kindof vehicles can be estimated only bymeasuring a fuel consumption map.
Input data
����
T/M Gear ratioFinal gear ratioTire-rolling radius...
��
Rolling resistanceAerodynamic drag
Engine speed (rpm)
Fuel flow (L/h)
(measured)
Torq
ue
(Nm
)
●
table a1 Weighting factors
Passenger vehicles Trucks
Type Buses, except city buses City buses Trucks, except tractors Tractors
GVW ≤14t >14t ≤20t >20t ≤20t >20t
Weighting factor
City mode 0.9 0.65 1.0 0.9 0.7 0.8 0.9
Highway mode
0.1 0.35 0.0 0.1 0.3 0.2 0.1
Source: Japan Automotive Research Institute.
© O
EC
D/IE
A, 2
012
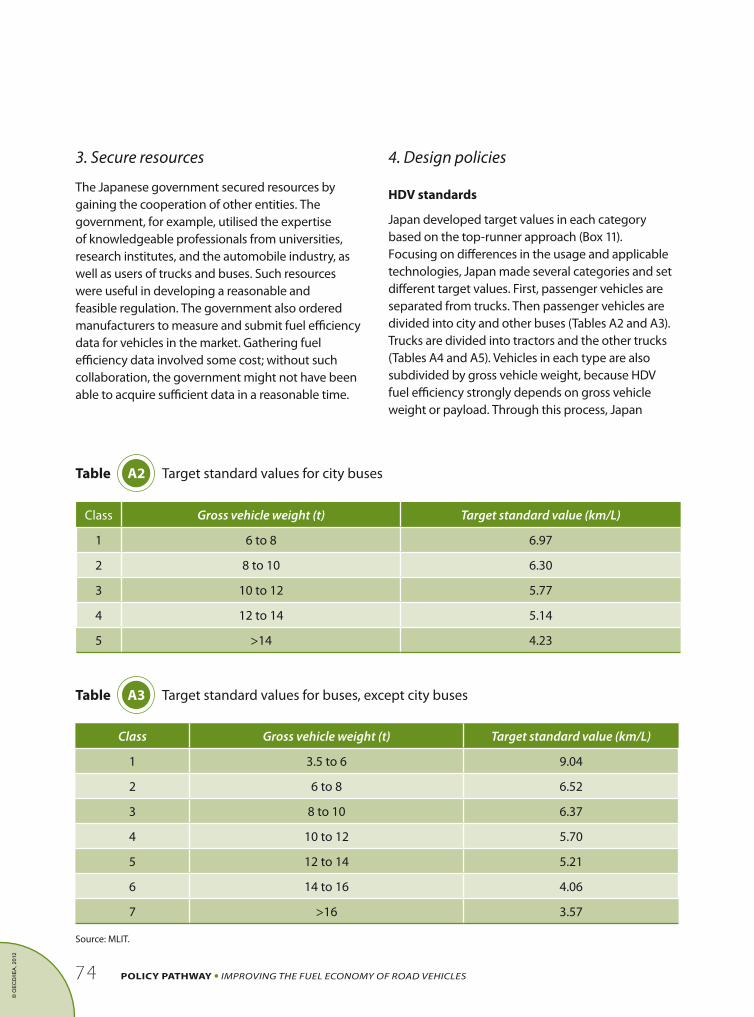
74 Policy Pathway ImprovIng the Fuel economy oF road vehIcles
3. secure resources
The Japanese government secured resources by gaining the cooperation of other entities. The government, for example, utilised the expertise of knowledgeable professionals from universities, research institutes, and the automobile industry, as well as users of trucks and buses. Such resources were useful in developing a reasonable and feasible regulation. The government also ordered manufacturers to measure and submit fuel efficiency data for vehicles in the market. Gathering fuel efficiency data involved some cost; without such collaboration, the government might not have been able to acquire sufficient data in a reasonable time.
4. design policies
hDV standards
Japan developed target values in each category based on the top-runner approach (Box 11). Focusing on differences in the usage and applicable technologies, Japan made several categories and set different target values. First, passenger vehicles are separated from trucks. Then passenger vehicles are divided into city and other buses (Tables A2 and A3). Trucks are divided into tractors and the other trucks (Tables A4 and A5). Vehicles in each type are also subdivided by gross vehicle weight, because HDV fuel efficiency strongly depends on gross vehicle weight or payload. Through this process, Japan
Class Gross vehicle weight (t) Target standard value (km/L)
1 6 to 8 6.97
2 8 to 10 6.30
3 10 to 12 5.77
4 12 to 14 5.14
5 >14 4.23
table a2 Target standard values for city buses
table a3 Target standard values for buses, except city buses
Class Gross vehicle weight (t) Target standard value (km/L)
1 3.5 to 6 9.04
2 6 to 8 6.52
3 8 to 10 6.37
4 10 to 12 5.70
5 12 to 14 5.21
6 14 to 16 4.06
7 >16 3.57
Source: MLIT.
© O
EC
D/IE
A, 2
012

75Policy Pathway ImprovIng the Fuel economy oF road vehIcles
table a4 Target standard values for trucks, except tractors
table a5 Target standard values for tractors
tried to minimise unfairness among manufacturers and vehicles. As the result of this categorization, the number of vehicle types in a few categories is small, which may reduce manufacturer flexibility in
achieving target values. To alleviate this concern, Japan introduced a credit trade system among vehicle categories.
Class Gross vehicle weight (t) Target standard value (km/L)
13.5 to 7.5
payload ≤1.510.83
23.5 to 7.5
payload 1.5 to 210.35
33.5 to 7.5
payload 2 to 39.51
43.5 to 7.5
payload >38.12
5 7.5 to 8 7.24
6 8 to 10 6.52
7 10 to 12 6.00
8 12 to 14 5.69
9 14 to 16 4.97
10 16 to 20 4.15
11 >20 4.04
Class Gross vehicle weight (t) Target standard value (km/L)
1 <20 3.09
2 >20 2.01
Japan also allows manufacturers to compensate for a shortfall in fuel efficiency in some categories by an excess of fuel efficiency in another category. This system may function to give flexibility to manufacturers to achieve their goals. Japan did not introduce a credit trade system among manufacturers, possibly because Japanese manufacturers might not consider this to be reputable behaviour.
labelling
All vehicles whose fuel efficiency is over the target values for 2015 have a label (Figure A3). Although most freight transport companies are conscious of fuel efficiency, this label itself does not seem to have had substantial effects in attracting the public’s attention. The label currently functions mainly as a sign that this vehicle is eligible for fiscal incentives.
© O
EC
D/IE
A, 2
012

76 Policy Pathway ImprovIng the Fuel economy oF road vehIcles
Fiscal incentives
Japan provides a tax deduction for HDVs whose fuel efficiency is over the target values for 2015 and whose NOx and PM emissions meet requirements. Given that fuel efficiency and other emissions are in a trade-off relationship, such integrated requirements could guide manufacturers’ research and development in the right direction.
5. certify fuel efficiency
The central government certifies the fuel efficiency of each vehicle in the type approval process. Only the national laboratory can measure fuel efficiency.
6. make information accessible to public
The Japanese government requires manufacturers to show the fuel efficiency of each vehicle in a catalogue. In addition, the government has a catalogue on its website with the fuel efficiency of all vehicles in the market.
7. check compliance
Even though the fuel efficiency standards have not yet come into force, the Japanese government annually requires manufacturers to submit the information about their own average fuel efficiency and sales volume in each category. Then the government checks the current situation of improvement in fuel efficiency.
8. publish monitoring data
After the regulation was developed in 2006, the Japanese government started collecting data. Since 2007, sufficient data has been available. Table A6 and Figure A4 show the improvement of the fuel efficiency of heavy-duty trucks. Compared to fuel efficiency in 2002, which was used as a base year when deciding target values, fuel efficiency in 2009 was improved in all categories. Although average fuel efficiency in some categories was continuously improved from 2007 to 2009, almost no improvement occurred in other categories in 2007-08 or 2008-09. For example, in a category whose gross vehicle weight (GVW) is 3.7t to 7.5t and payload is less than 1.5 tonne, average fuel efficiency decreased from 2007 to 2008, and then increased from 2008 to 2009. This outcome seems to suggest that the model changes of most vehicles in this category simultaneously occurred in 2008-09. (Given that the new emission regulation has applied to vehicles in this category since 2010, manufacturers changed vehicle models to adjust to the new regulation.)
This trend is different from that of light-duty passenger vehicles whose average fuel efficiency for all fleets is increasing every year in all categories. In the category for vehicles whose GVW is 14t to 16t, the fuel efficiency improvement rate was smaller than the improvement rate in other categories. The sales volume in this category was less than 1 000 vehicles annually from 2007 to 2009, while in some other categories, the annual sales volume was more than 10 000 vehicles. Manufacturers may face difficulty in spending sufficient resources to improve fuel efficiency in categories with small sales volumes. As a result, the Japanese credit trade system plays an important role in allowing manufacturers to cost-effectively meet target values. In addition, average fuel efficiency decreased in 2008 compared to average fuel efficiency in 2007, while fuel efficiency in each category increased. This trend was caused by the shift of the sales mix.
Overall, further efforts are necessary to achieve target values in 2015. In several categories, the current improvement rate would not be sufficient
Figure a3 Japanese HDV fuel efficiency label
© O
EC
D/IE
A, 2
012
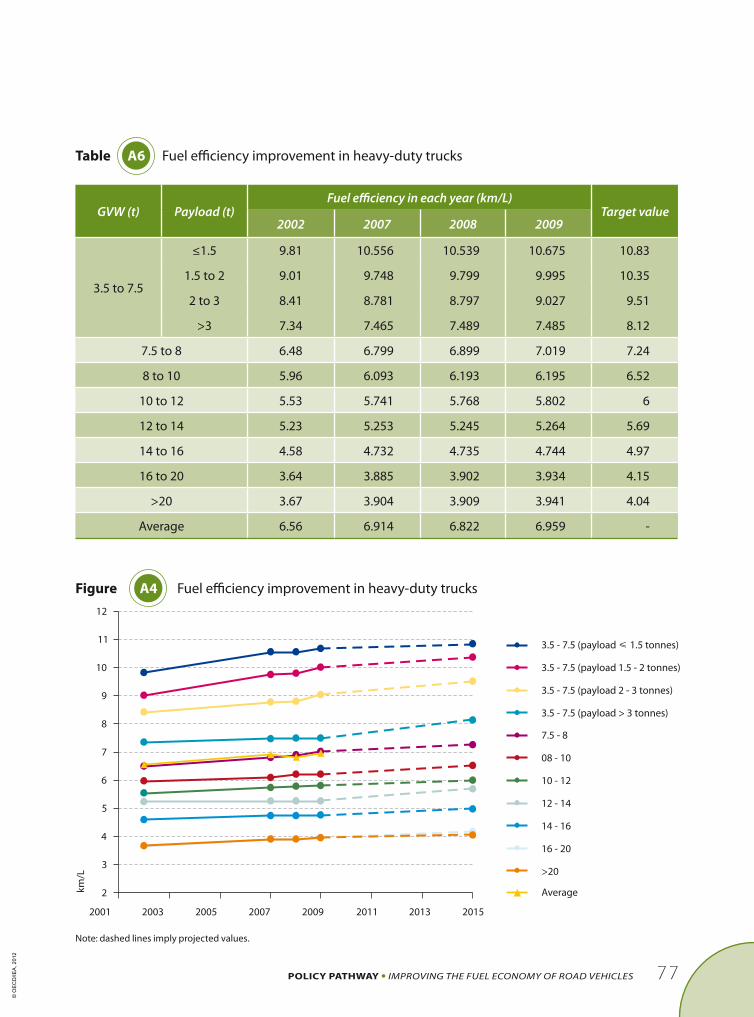
77Policy Pathway ImprovIng the Fuel economy oF road vehIcles
Figure a4 Fuel efficiency improvement in heavy-duty trucks
table a6 Fuel efficiency improvement in heavy-duty trucks
GVW (t) Payload (t)Fuel efficiency in each year (km/L)
Target value2002 2007 2008 2009
3.5 to 7.5
≤1.5 9.81 10.556 10.539 10.675 10.83
1.5 to 2 9.01 9.748 9.799 9.995 10.35
2 to 3 8.41 8.781 8.797 9.027 9.51
>3 7.34 7.465 7.489 7.485 8.12
7.5 to 8 6.48 6.799 6.899 7.019 7.24
8 to 10 5.96 6.093 6.193 6.195 6.52
10 to 12 5.53 5.741 5.768 5.802 6
12 to 14 5.23 5.253 5.245 5.264 5.69
14 to 16 4.58 4.732 4.735 4.744 4.97
16 to 20 3.64 3.885 3.902 3.934 4.15
>20 3.67 3.904 3.909 3.941 4.04
Average 6.56 6.914 6.822 6.959 -
2
3
4
5
6
7
8
9
10
11
12
2001 2003 2005 2007 2009 2011 2013 2015
3.5 - 7.5 (payload 1.5 tonnes)≤
3.5 - 7.5 (payload 1.5 - 2 tonnes)
3.5 - 7.5 (payload 2 - 3 tonnes)
3.5 - 7.5 (payload > 3 tonnes)
7.5 - 8
08 - 10
10 - 12
12 - 14
14 - 16
16 - 20
>20
Averagekm
/L
Note: dashed lines imply projected values.
© O
EC
D/IE
A, 2
012

78 Policy Pathway ImprovIng the Fuel economy oF road vehIcles
to meet the target value, but the sales volume of these categories is likely to be smaller. In categories with relatively large sales volumes, such as the category with 3.7t to 7.5t GVW and is 1.5t to 2t payload, the average fuel efficiency seemed to increase sufficiently. Thus, in Japan, the credit trade system is likely to be an important feature for meeting the targets in 2015.
9. evaluate and enforce policies
In Japan, the amount of penalty was established based, in part, on the country’s unique cultural tradition that manufacturers would be motivated by the shame that they would experience if they failed to meet the requirements. They would, therefore, make as much an effort as possible to avoid paying
any penalty, regardless of the amount. Thus, the penalty amount is only at most one million yen (or approximately EUR 10 000), regardless of the level of shortage of average fuel efficiency, which is much smaller than the penalty of the EU CO2 regulation.
10. revise standards and complementary policies
Japan has not revised the standards yet because the target year has not arrived. When Japan revises the standards, the government may want to consider data such as that shown in Table A6 and Figure A4.
© O
EC
D/IE
A, 2
012

79Policy Pathway ImprovIng the Fuel economy oF road vehIcles
References
Anderson, S., I. Parry, J.M. Sallee, and C. Fischer (2010), automobile Fuel economy standards: Impacts, efficiency, and alternatives, Resources for the Future, Washington DC, USA.
Bastard, L. (2010), “The Impact of Economic Instruments on the Auto Industry and the Consequences of Fragmenting Markets: Focus on the EU Case”, OECD/ITF Joint Transport Research Centre Discussion Papers, oecd/ItF, paris.
Brannigan, C., I. Skinner, G. Gibson, and D. Kay (2011), report on the Implementation of directive 1999/94/ec relating to the availability of consumer Information on Fuel economy and co2 emissions in respect of the marketing of new passenger cars, AEA/R/ED56923 Issue Number 2, DG Climate Action, European Commission, Brussels, December. Available at http://ec.europa.eu/clima/policies/transport/vehicles/labelling/docs/final_report_2012_en.pdf.
DOE (Department of Energy) (2011), “Qualified Plug-In Electric Drive Motor Vehicle Tax Credit”, www.afdc.energy.gov/afdc/laws/law/US/409.
Duleep, K. G. (2012), personal communication.
Eads, G. (2010), 50by50 prospects and progress, report for global Fuel economy Initiative, www.globalfueleconomy.org/Documents/Publications/prospects_and_progress_lr.pdf.
EC (European Commission) (2010), monitoring the co2 emissions from new passenger cars in the european union: summary of data for 2010, Brussels, Belgium.
EEA (European Environment Agency) (2011), monitoring of co2 emissions from passenger cars – regulation 443/2009, www.eea.europa.eu/data-and-maps/data/co2-cars-emission.
EECA (Energy Efficiency Conservation Authority, New Zealand) (2012), personal communication.
Elmer, C.-F. (2009), “Mitigating Transport CO2 Emissions in the United States and Europe: An Assessment of Recent Fuel Economy and Vehicle Emission Regulations”, aIcgs transatlantic perspective.
EPA (Environmental Protection Agency) (2006), Fuel Economy Labeling of Motor Vehicles: Revisions to Improve Calculation of Fuel Economy Estimates, www.epa.gov/oms/cert/mpg/420d06002.pdf.
EPA (2010), “Light-Duty Automotive Technology, Carbon Dioxide Emissions, and Fuel Economy Trends: 1975 Through 2010”, www.epa.gov/otaq/cert/mpg/fetrends/420r10023.pdf.
EPA (2012), Current Window Sticker, www.fueleconomy.gov/feg/ratingsNewSticker.shtml.
EU (European Union) (2006), Eco-driving for Municipal Employees, SMILE, CIVITAS project, www.civitas.eu/docs/malmo%2011-2.pdf.
EU (2009), Regulation (EC) No 443/2009: Setting Emission Performance Standards for New Passenger Cars as Part of the Community’s Integrated Approach to Reduce CO2 Emissions from Light-duty Vehicles, Brussels. Available at http://eur-lex.europa.eu/LexUriServ/LexUriServ.do?uri=OJ:L:2009:140:0001:0015:EN:PDF.
Fuel Economy.co.uk (2011), Example Green Label, www.fuel-economy.co.uk/greenlabel.shtml.
Gallagher, K.S. and E. Muehlegger (2011), “Giving Green to Get Green? Incentives and Consumer Adoption of Hybrid Vehicle Technology”, Journal of environmental economics and management, Vol. 11, pp. 1-15.
Garg, S. (2012), personal communication.
Gillingham, K., R.G. Newell, and K. Palmer (2009), energy efficiency economics and policy, Resources for the Future, Washington DC, USA.
GIZ (2011), International fuel prices 2010/2011: Data Preview – January 2011. Available at: www.gtz.de/de/dokumente/giz2011-international-fuel-prices-2010-2011-data-preview.pdf.
© O
EC
D/IE
A, 2
012

80 Policy Pathway ImprovIng the Fuel economy oF road vehIcles
Goulder, L.H. and I.W.H. Parry (2008), “Instrument Choice in Environmental Policy”, review of environmental economics and policy, Vol. 2, No. 2, pp. 152-174.
Greene, D.L., J. German, and M.A. Delucchi, (2009), “Fuel Economy: The Case for Market Failure,” reducing climate Impacts in the transportation sector, pp. 181-206.
ICCT (International Council on Clean Transportation) (2011), review and comparative analysis of Fiscal policies www.theicct.org/sites/default/files/publications/ICCT_fiscalpolicies_feb2011.pdf.
ICCT (2012a), global passenger vehicle standards update, www.theicct.org/global-passenger-vehicle-standards-update.
ICCT (2012b), personal communication.
ICF International (2009), analysis of vehicle technology and Fuel efficiency in India and china: Final report, Virginia, USA, November.
IEA (International Energy Agency) (2008), energy efficiency policy recommendations: Worldwide Implementation now.
IEA (2010a), energy technology perspectives 2010, OECD/IEA, Paris.
IEA (2010b), transport energy efficiency: Implementation of Iea recommendations since 2009 and next steps, OECD/IEA, Paris.
IEA (2010c), policy pathway: monitoring, verification and enforcement - Improving compliance within equipment energy efficiency programmes, OECD/IEA, Paris.
IEA (2011a), Iea 25 energy efficiency policy recommendations 2011 update, OECD/IEA, Paris.
IEA (2011b), Iea technology roadmap for ev/phev, OECD/IEA, Paris.
IEA (2011c), Iea technology roadmap: Biofuels for transport, OECD/IEA, Paris.
IEA (2012a), technology roadmap: Fuel economy of road vehicles, OECD/IEA, Paris.
IEA (2012b), energy technology perspectives 2012, OECD/IEA, Paris.
IEA (2012c), economic instruments for energy efficiency policy – transport and industry, forthcoming.
JAMA (Japanese Automobile Manufacturers Association) (2008), reducing co2 emissions in the global road transport sector, JAMA, Tokyo, www.jama-english.jp/publications/2008_CO2_RoadTransport.pdf.
Kodjak, D., F. Kamakate, B. Sharpe, and M. Campestrini (2011), “Evolution of Heavy-Duty Vehicle GHG and Fuel Economy Standards The Importance of the 2011 US Rule”, Presented at the Asilomar Conference “Rethinking Energy and Climate Strategies for Transportation,” September 1, California.
METI (Ministry of Economy, Trade, and Industry), MLIT (Ministry of Land, Infrastructure, Transport and Tourism) (2006), Final report of the Joint study group on heavy-duty Fuel economy standards.
METI and MLIT (2007), Final report of the Joint study group on light-duty Fuel economy standards.
METI (2011), “Subsidy for Clean-energy Vehicles”, www.meti.go.jp/policy/automobile/evphv/information/system.html.
M.J. Bradley & Associates LLC (2009), setting the stage for regulation of heavy-duty vehicle Fuel economy & ghg emissions: Issues and opportunities, ITTC, Washington DC and San Francisco.
MLIT (2009), “What is EMS?” www.mlit.go.jp/jidosha/sesaku/environment/shouenergy/ems/ems.pdf.
MLIT (2010a), “The Attachment of Stickers on Fuel Efficient Vehicles”, www.mlit.go.jp/jidosha/sesaku/environment/ondan/sticker.pdf.
MLIT (2010b), “The Tax Deduction for Fuel Efficient and Environmental-friendly Vehicles”, www.mlit.go.jp/jidosha/jidosha_fr1_000005.html.
© O
EC
D/IE
A, 2
012

81Policy Pathway ImprovIng the Fuel economy oF road vehIcles
MLIT (2011a), “Jidousha Nenpi Ichiran” (List of passenger cars’ fuel economy).
MLIT (2011b), “The Policies for Maintaining and Improving Public Transportation”, www.mlit.go.jp/common/000145706.pdf.
MLIT (2011c), “The Top-ten Fuel Efficient Gasoline Vehicles in 2010”, www.mlit.go.jp/common/000139615.pdf.
NHTSA (National Highway Traffic Safety Administration) and EPA (Environmental Protection Agency) (2010), “Light-Duty Vehicle Greenhouse Gas Emission Standards and Corporate Average Fuel Economy Standards; Final Rule”, www.epa.gov/oms/climate/regulations.htm.
NRC (2010), technologies and approaches to reducing the Fuel consumption of medium- and heavy-duty vehicles, p. 159, Committee to Assess Fuel Economy Technologies for Medium- and Heavy-Duty Vehicles, Board on Energy and Environmental Systems Division on Engineering and Physical Sciences, Transportation Research Board, the National Academies Press, Washington DC. www.trb.org/Main/Blurbs/Reducing_Fuel_Consumption_in_Medium_and_HeavyDuty_163229.aspx.
OECD/EEA (2011), oecd/eea database on instruments used for environmental policy and natural resources management, www.oecd.org/env/policies/database.
Ryan, L., S. Ferreira, and F. Convery (2009), “The Impact of Fiscal and Other Measures on New Passenger Car Sales and CO2 Emissions Intensity: Evidence from Europe”. energy economics, Vol. 31, No. 3, pp. 365-374.
State Council (2012), “Development plan for energy-saving and new energy automotive industry (2012-2020)”. Beijing, 18 April. Available at www.chinafinancial.info/state-department-through-the-energy-saving-and-new-energy-automotive-industry-development-plan/.
Sterner, T. (2007), “Fuel Taxes: An Important Instrument for Climate Policy”, energy policy, Vol. 35, pp. 3194–3202.
UK (United Kingdom) (2011), “Car Fuel Data, CO2 and Vehicle Tax Tools”, www.direct.gov.uk/en/Motoring/BuyingAndSellingAVehicle/AdviceOnBuyingAndSellingAVehicle/CalculatethefuelconsumptionCO2andtaxcosts/DG_195357.
UNECE (United Nations Economic Commission for Europe) (2011), “Development of World-wide Light-duty Test Cycle”, http://live.unece.org/fileadmin/DAM/trans/doc/2011/wp29grpe/WLTP-DHC-08-02e.pdf.
UNEP (United Nations Environment Programme) (2012), the chinese automotive Fuel economy policy, www.unep.org/transport/gfei/autotool/case_studies/apacific/china/cs_ap_china.asp#p14.
VCA (Vehicle Certification Agency) (2012), vca’s point of sale (pos) system, www.dft.gov.uk/vca/fcb/point-of-sale-pos-so.asp.
Wagner, D.V., F. An, and C. Wang (2009), “Structure and impacts of fuel economy standards for passenger cars in China”, Energy Policy, Vol. 37, No. 10, pp. 3803-3811, Elsevier, Amsterdam.
© O
EC
D/IE
A, 2
012

International Energy Agency • 9 rue de la Fédération • 75739 Paris Cedex 15, France
Buy IEA publications online:
www.iea.org/books
PDF versions available at 20% discount
Books published before January 2011
- except statistics publications -
are freely available in pdf
Onlinebookshop
Tel: +33 (0)1 40 57 66 90
E-mail: [email protected]
© O
EC
D/IE
A, 2
012

IEA PUBLICATIONS9, rue de la Fédération,75739 Paris Cedex 15
Second editionPrinted in France by Corlet, August 2012
Cover design: IEA. Cover photo credits: © Photodisc Inside photo credits: © GraphicObsession, © Fancy, © Photodisc, © Corbis, © Brand X, © Comstock
© O
EC
D/IE
A, 2
012

Improving the Fuel Economy of Road Vehicle
The transportation sector accounts for approximately one-fifth of global final energy consumption and will account for nearly all future growth in oil use, particularly for road vehicles. The right policy mix can allow countries to improve the fuel economy of road vehicles, which in turn can enhance energy security and reduce CO2 emissions.
Improving the Fuel Economy of Road Vehicles highlights lessons learned and examples of good practices from countries with experience in implementing fuel economy policies for vehicles. The report, part of the IEA’s Policy Pathway series, outlines key steps in planning, implementation, monitoring and evaluation. It complements the IEA Technology Roadmap: Fuel Economy for Road Vehicles, which outlines technical options, potentials, and costs towards improvement in the near, medium and long term.
The Policy Pathway series aims to help policy makers implement the IEA 25 Energy Efficiency Policy Recommendations endorsed by IEA Ministers (2011).
www.iea.org
© O
EC
D/IE
A, 2
012


