Improving the quality of autoclaved aerated concrete panel based on QFD and DOE theory
Xuguang TAN1;Wei XIONG2,* 1Weichai Power Co., Ltd., Weifang, China
2School of Management, Zhejiang University, Hangzhou, China *Correspondence: Wei XIONG:[email protected]
Keywords: Quality Function Deployment, Design of Experiment, Autoclaved Aerated Concrete, Affinity Diagram, Taguchi method.
Abstract. Since the invention of autoclaved aerated concrete (AAC) used for blocks in Sweden in the 1920s, its applications have been expanded to many other areas, including wall panels, floor and roof panels, cladding panels and lintels. AAC production in Europe has slowed down considerably, while the industry is growing rapidly in Asia due to the strong demand in housing and commercial space. China is one of the largest markets in AAC manufacturing and consumption. However, the quality of AAC is unstable and most AAC producers have a low yield procedure in China. In this paper, an integrated methodology combining Quality Function Deployment (QFD) and Design of Experiment (DoE) was proposed to improve the quality of AAC panels. QFD is a useful tool for managing cross-functional design teams and exploring the customer needs. It achieves the maximum custom satisfaction by translating customer requirements to the engineering world. DoE was widely used for the design of multi-factor experiments. It provides adequate information based on limited time and cost. Customer requirements were collected through interviews and grouped by Affinity Diagram. Through construction of the 1st phase and the 2nd phase of QFD matrices, customer requirements were transferred to technical attributes and process procedures. Raw material composition, steam curing method and appropriate arrangement of reinforced steels were identified as the critical processes which affect the quality of AAC panel the most. Design of Experiment (DoE) was adopted to perform a series of experiments to obtain the best combination of raw material and steam curing method. Through application of the proposed methodology to AAC panel manufacturing, the product qualification ratio of AAC panel increased from 50% to 92.8%, higher than the expected 85%.
1 Introduction
Autoclaved aerated concrete is a lightweight construction material and composed of millions of microscopic cells generated during the manufacturing process. It is approximately 1/5 the weight of ordinary concrete with a dry bulk density ranging from 0.4 to 0.8 g/cm3 and a compressive strength
2018 3rd International Conference on Computer Science and Information Engineering (ICCSIE 2018)
ranging from 2 to 7 MPa [1]. It has been successfully used around the world for over 80 years. Advantages of AAC include low density, ease of use, environmental friendly, high compressive strength, good thermal insulation, increased fire resistance and good sound insulation with a high quality reputation comparing with other types of concrete [2-3]. Although chemical compositions of AAC in different places are different due to the variety of mixing proportions, the basic raw materials are common — sand, lime, cement, gypsum, water, aluminum powder and fly-ash in some manufacturers [2, 4]. The aluminum powder was added into the mixing ingredients as a pore-forming agent, which liberates hydrogen gas and forms bubbles. The process of AAC manufacturing is illustrated in Figure 1.
The AAC manufacturing process starts when the sand is ground to the required fineness in a ball mill. Raw materials are then automatically weighed and measured in the mixer along with water and aluminum powder. At the same time, structurally welded, rust treated and dried steel bars are set in the metal mold properly. After mixing, the slurry is poured into metal molds in which the expanding agent reacts with other elements. The mixing results in a chemical reaction that expands the mixture to form small, finely-dispersed air spaces. The molds are sent to a pre-curing room for several hours. Then the semi-solid material is transported to the cutting machine. The cutting machine cuts the molds into the size required for the building elements by using steel wires. The final phase in the production process is steam curing in the autoclave, and then it is packaged and sent for storage.
Figure 1 Manufacturing process of AAC
In China, AAC is identified as the only one type of wall materials to meet 50% the requirement of energy saving without adding other affiliated thermal insulation materials. AAC has a broad application prospect in China as the government is promoting building energy saving and carbon emission reduction [5]. However, it is observed that the product qualification ratio of 5 cm AAC panels was extremely low, which is only 50%. Therefore, it is necessary to investigate the bad performance and improve the quality of 5 cm AAC panels.
2 QFD and DoE methodologies
QFD has for a long time been used as a successful design methodology to improve products’ quality. American Supplier Institute defined QFD as 'A system for translating consumer requirements into appropriate company requirements at each stage from research and product development to engineering and manufacturing to marketing/sales and distribution'. QFD helps designers to utilize the voice of the customers (VOC), or customer requirements, to determine which engineering element or product specification is the most essential. This prioritization helps designers to know which part of the product or process is the most beneficial to focus on during design, resulting in products that better meet customer requirements and generate increased commercial success [6]. It is often combined with other quality tools to improve existing products' quality or to develop new products. Some recent studies on QFD (mainly published in 2014) are selectively summarized. Moldovan[7] successfully applied QFD and knowledge management to
437
understand customer needs and identify critical technical attributes to guide a new product (soft drink) design in a mineral water company. Shad et al. [8] proposed a combination of Analytic Hierarchy Process (AHP), QFD and linear Physical Programming (LPP) for supplier selection under uncertainty conditions to maximize overall customer satisfaction. In this paper, a set of triangular fuzzy numbers were used to address vague linguistic expressions. Rahmana et al. [9] presented an integrative approach of SERVQUAL, Kano model and QFD to improve the quality of simulation-based training on project management. Zaim et al. [10] proposed a combination of Analytic Network Process (ANP) and fuzzy logic to better rank technical attributes during QFD application. In this paper, new equipment which can be used to squeeze the polyethylene pipes to stop the gas flow without damaging the pipes was developed. Iqbal et al. [11] suggested an interesting and important research object. This paper introduced a statistical testing procedure to determine whether the final weight of technical attributes is significantly different and to investigate the robustness of different rating scale. John et al. [12] investigated the awareness of QFD in construction industry in Nigeria and they tried to promote its potential effectiveness in design and building industries in the future. Zhang et al. [13] applied QFD/TRIZ (Theory of Inventive Problem Solving) to improve the design of elastomeric hydraulic reciprocating sealing. In this paper, QFD was used to identify the key elements that affect the sealing efficiency-reinforcement. TRIZ was used to resolve the conflicts of key elements and give the efficiency-reinforcement design solutions.
The DoE methodology was developed originally by Ronald A. Fisher in 1925. However, classical parameter design is too complex to use. Especially, a large number of experiments have to be carried out when the number of the process parameters increases. To solve this task, the Taguchi method uses a special design of orthogonal arrays to study the entire parameter space only with a small number of experiments. Orthogonal array was selected because there was no interaction among factors. The arrays were created using an algorithm developed by Taguchi, which can allow each variable and setting to be tested equally. The selection of a suitable orthogonal array depends on the number of factors and their levels. Taguchi method took the design of experiments from the exclusive world of the statistician and brought it into the world of manufacturing. This method provides a simple, efficient and systematic approach to determine optimum conditions [14]. The method is valuable when the design parameters are qualitative and discrete. It has been widely used in the industry for product development and to process quality improvement. The recent applications on Taguchi DoE (also referred to Taguchi method) are selectively summarized. Mohan and Reddy [15] used Taguchi DoE to evaluate the influence and specific function of eight important factors to enhance the mixed culture bioplastics production. Zirehpour et al. [14] applied Taguchi DoE to investigate the most significant factors in ultra filtration membrane to optimize the treatment of olive oil wastewater. Taguchi DoE was employed to evaluate the effect of aggregate content, sodium hydroxide concentration, curing time and curing temperature on compressive strength of class C ash-based geopolymers [16]. Sivasakthivel et al. [17] proposed Taguchi DoE to optimize the performance of a ground source heat pump system for space heating and cooling application. Rahim et al. [18] applied Taguchi DoE to optimize the residual compressive strength of heated high performance concrete. Yeh and Tsai [19] presented an application of the grey-fuzzy Taguchi method to derive the optimum parameters for the fine-pitch copper (Cu) wire bonding process with multiple quality characteristics.
It is important to note that DoE and QFD are two complementary quality tools. Whereas QFD attempts to identify key product or process variables, DoE can help minimize the number of critical process parameters and optimize them. [20] A great number of studies which explore how to combine QFD with DoE are summarized. Ross [21] proposed the use of DoE in the establishment of relationship matrix, but he did not provide the detailed integration method and process. Sheng et al. [22] presented three integration ways of DoE and QFD, including establishment of relationship
438
matrix, setting of targets and taking customer responses into account during DoE process optimization. Bouchereau and Rowlands [23] suggested Taguchi robust design is particularly useful for establishing the best operating conditions for manufacturing and can thus be integrated in the 3rd QFD phase, the process planning phase. He also suggested that the quality loss function curve can help determine the exact target values in the house of quality. Shi and She [24] studied the problem solving methods including TRIZ and Taguchi methods to overcome traditional QFD’s weakness of not being a problem solving tool. Zheng and Chin [25] suggested QFD-based process quality planning should be closely coupled with design of experiment to clearly identify the linear relationships and correlations among elements of HoQ, to improve the effectiveness of process quality planning. An integrated design process combining QFD, conjoint analysis and Taguchi method was introduced to link marketing and R&D in the case of new product development. Jeang et al. combined QFD and Taguchi method to analyze the produced quality characteristics and to optimize the process parameters for hot-bar soldering process.
3 QFD application
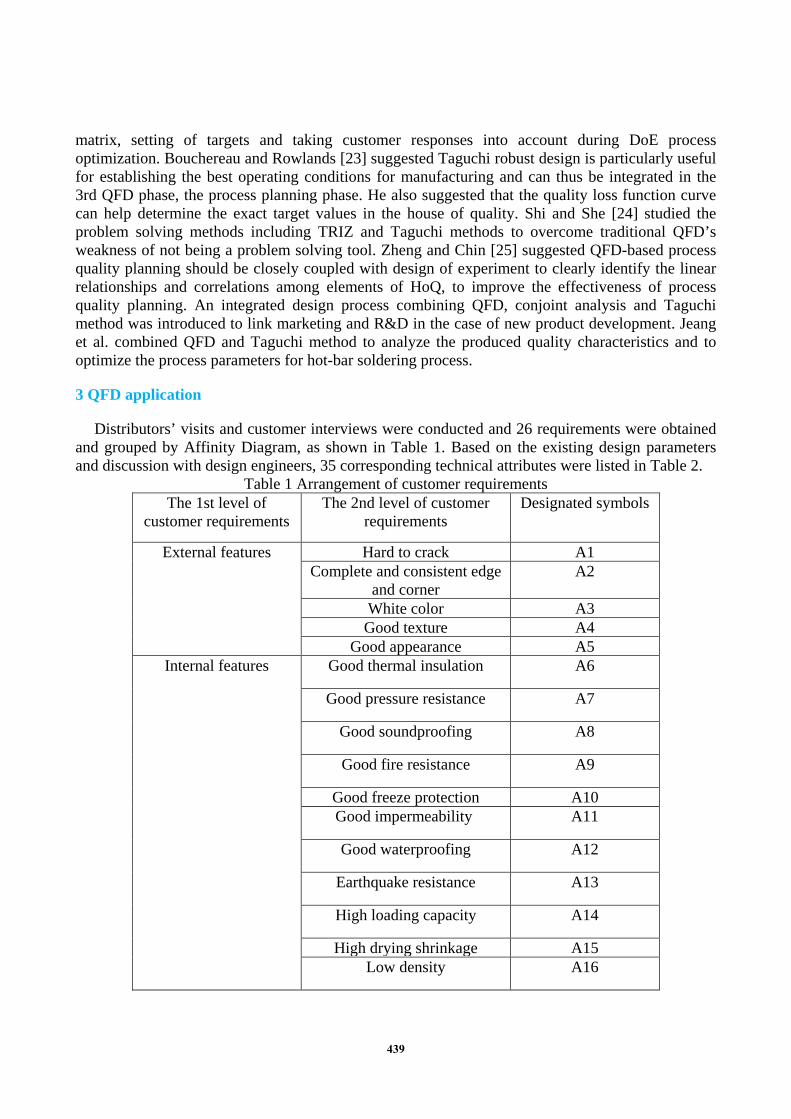
Distributors’ visits and customer interviews were conducted and 26 requirements were obtained and grouped by Affinity Diagram, as shown in Table 1. Based on the existing design parameters and discussion with design engineers, 35 corresponding technical attributes were listed in Table 2.
Table 1 Arrangement of customer requirements The 1st level of
customer requirements The 2nd level of customer
requirements Designated symbols
External features Hard to crack A1 Complete and consistent edge
and corner A2
White color A3 Good texture A4
Good appearance A5 Internal features Good thermal insulation A6
Good pressure resistance A7
Good soundproofing A8
Good fire resistance A9
Good freeze protection A10 Good impermeability A11
Good waterproofing A12
Earthquake resistance A13
High loading capacity A14
High drying shrinkage A15 Low density A16
439
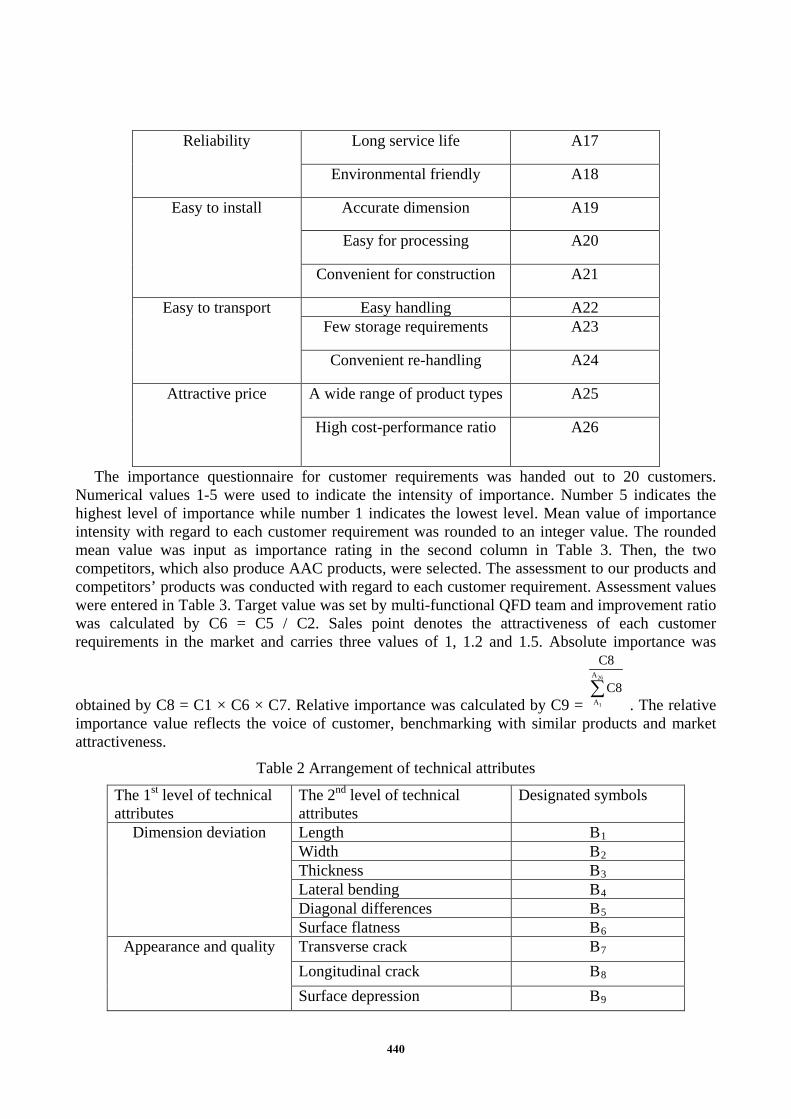
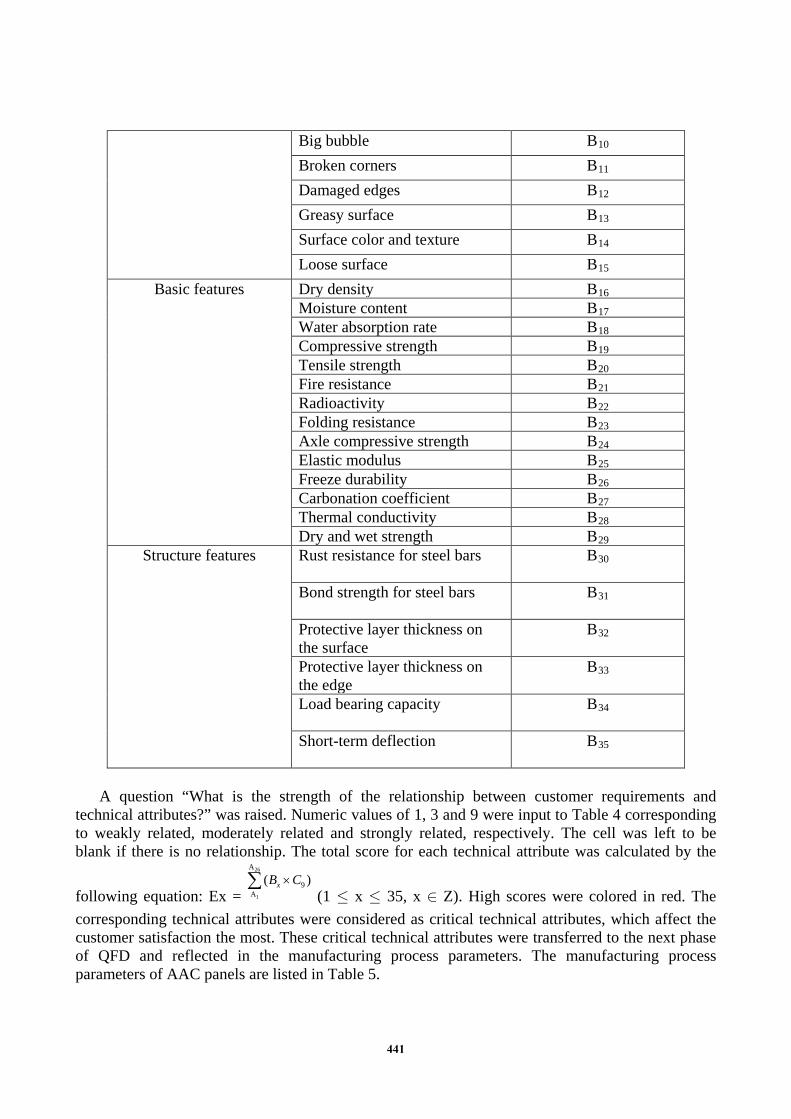
Reliability Long service life A17
Environmental friendly A18
Easy to install Accurate dimension A19
Easy for processing A20
Convenient for construction A21
Easy to transport Easy handling A22 Few storage requirements A23
Convenient re-handling A24
Attractive price A wide range of product types A25
High cost-performance ratio A26
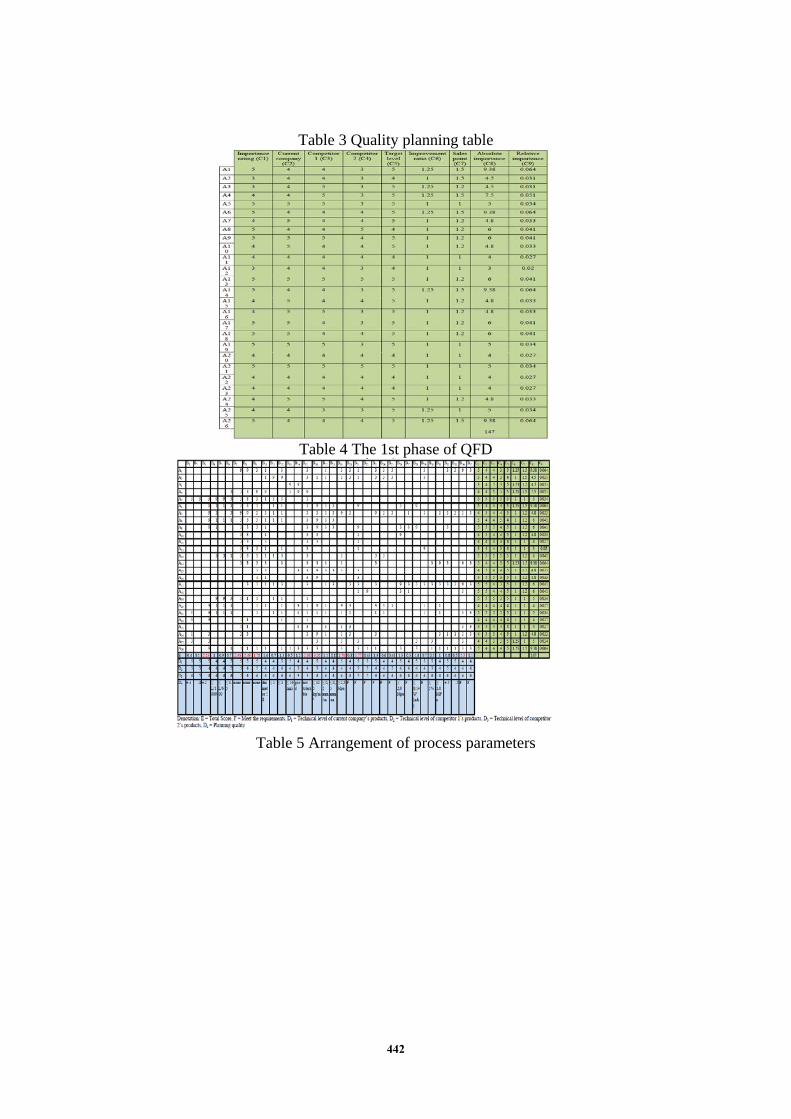
The importance questionnaire for customer requirements was handed out to 20 customers. Numerical values 1-5 were used to indicate the intensity of importance. Number 5 indicates the highest level of importance while number 1 indicates the lowest level. Mean value of importance intensity with regard to each customer requirement was rounded to an integer value. The rounded mean value was input as importance rating in the second column in Table 3. Then, the two competitors, which also produce AAC products, were selected. The assessment to our products and competitors’ products was conducted with regard to each customer requirement. Assessment values were entered in Table 3. Target value was set by multi-functional QFD team and improvement ratio was calculated by C6 = C5 / C2. Sales point denotes the attractiveness of each customer requirements in the market and carries three values of 1, 1.2 and 1.5. Absolute importance was
obtained by C8 = C1 × C6 × C7. Relative importance was calculated by C9 =
26
1
A
A
C8
C8∑ . The relative
importance value reflects the voice of customer, benchmarking with similar products and market attractiveness.
Big bubble B10 Broken corners B11 Damaged edges B12 Greasy surface B13 Surface color and texture B14 Loose surface B15
Basic features Dry density B16 Moisture content B17 Water absorption rate B18 Compressive strength B19 Tensile strength B20 Fire resistance B21 Radioactivity B22 Folding resistance B23 Axle compressive strength B24 Elastic modulus B25 Freeze durability B26 Carbonation coefficient B27 Thermal conductivity B28 Dry and wet strength B29
Structure features Rust resistance for steel bars B30
Bond strength for steel bars B31
Protective layer thickness on the surface
B32
Protective layer thickness on the edge
B33
Load bearing capacity B34
Short-term deflection B35
A question “What is the strength of the relationship between customer requirements and
technical attributes?” was raised. Numeric values of 1, 3 and 9 were input to Table 4 corresponding to weakly related, moderately related and strongly related, respectively. The cell was left to be blank if there is no relationship. The total score for each technical attribute was calculated by the
following equation: Ex =
26
1
A
9A
( )xB C×∑ (1 £ x £ 35, x Î Z). High scores were colored in red. The
corresponding technical attributes were considered as critical technical attributes, which affect the customer satisfaction the most. These critical technical attributes were transferred to the next phase of QFD and reflected in the manufacturing process parameters. The manufacturing process parameters of AAC panels are listed in Table 5.
441
Table 3 Quality planning table
Table 4 The 1st phase of QFD
Table 5 Arrangement of process parameters
442
With technical attributes compared with process parameters, the 2nd phase of QFD was
constructed and demonstrated in Table 6. The strength values of relationship were entered and multiplied by total score for each technical attribute. Critical process parameters such as “Raw material mixing” “Arrangement of reinforced steels” “Autoclave curing” were obtained as guidance for improvement.
Table 6 The 2nd phase of QFD
4 DoE application
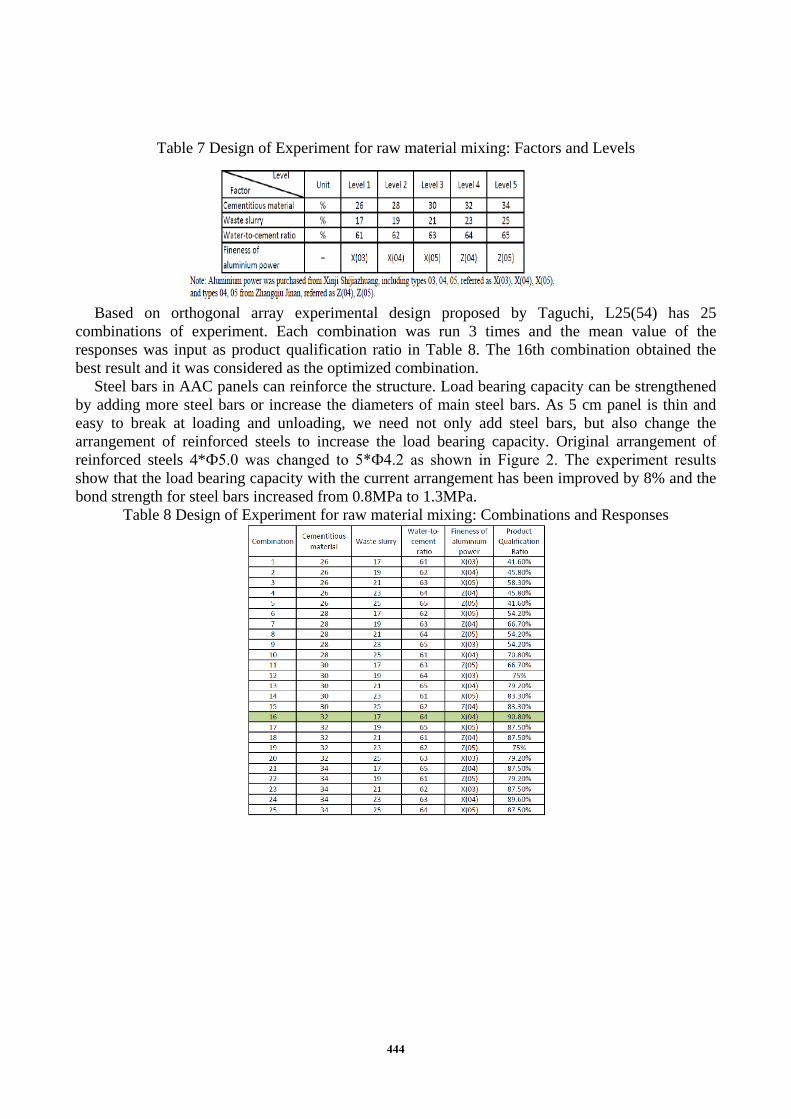
Now the causes of bad performance of 5 cm AAC panels are identified through transferring customers’ perspective to process parameters. Taguchi DoE is proposed to optimize these process parameters with limited time and resources. Raw material composition is affected by six indicators including cementitious material, waste slurry, sand slurry, water-to-cement ratio, C/S and aluminum powder. As cementitious material, waste slurry, sand slurry are mixed by a certain proportion, once the proportion of cementitious material and waste slurry are determined, the amount of sand slurry can be fixed accordingly. Therefore, sand slurry was not taken as a factor in experiment design. C/S ratio is constant and not considered as a factor either. In total, this experiment has 4 factors and 5 levels, as shown in Table 7.
443
Table 7 Design of Experiment for raw material mixing: Factors and Levels
Based on orthogonal array experimental design proposed by Taguchi, L25(54) has 25
combinations of experiment. Each combination was run 3 times and the mean value of the responses was input as product qualification ratio in Table 8. The 16th combination obtained the best result and it was considered as the optimized combination.
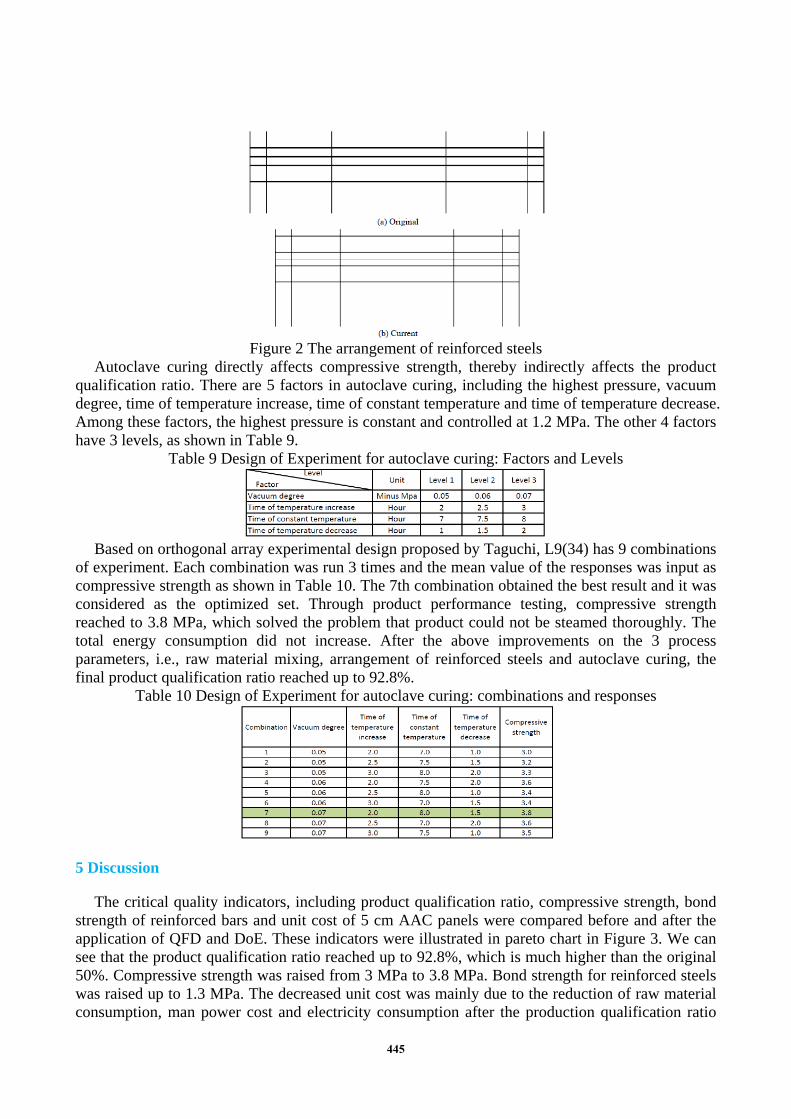
Steel bars in AAC panels can reinforce the structure. Load bearing capacity can be strengthened by adding more steel bars or increase the diameters of main steel bars. As 5 cm panel is thin and easy to break at loading and unloading, we need not only add steel bars, but also change the arrangement of reinforced steels to increase the load bearing capacity. Original arrangement of reinforced steels 4*Ф5.0 was changed to 5*Ф4.2 as shown in Figure 2. The experiment results show that the load bearing capacity with the current arrangement has been improved by 8% and the bond strength for steel bars increased from 0.8MPa to 1.3MPa.
Table 8 Design of Experiment for raw material mixing: Combinations and Responses
444
Figure 2 The arrangement of reinforced steels
Autoclave curing directly affects compressive strength, thereby indirectly affects the product qualification ratio. There are 5 factors in autoclave curing, including the highest pressure, vacuum degree, time of temperature increase, time of constant temperature and time of temperature decrease. Among these factors, the highest pressure is constant and controlled at 1.2 MPa. The other 4 factors have 3 levels, as shown in Table 9.
Table 9 Design of Experiment for autoclave curing: Factors and Levels
Based on orthogonal array experimental design proposed by Taguchi, L9(34) has 9 combinations
of experiment. Each combination was run 3 times and the mean value of the responses was input as compressive strength as shown in Table 10. The 7th combination obtained the best result and it was considered as the optimized set. Through product performance testing, compressive strength reached to 3.8 MPa, which solved the problem that product could not be steamed thoroughly. The total energy consumption did not increase. After the above improvements on the 3 process parameters, i.e., raw material mixing, arrangement of reinforced steels and autoclave curing, the final product qualification ratio reached up to 92.8%.
Table 10 Design of Experiment for autoclave curing: combinations and responses
5 Discussion
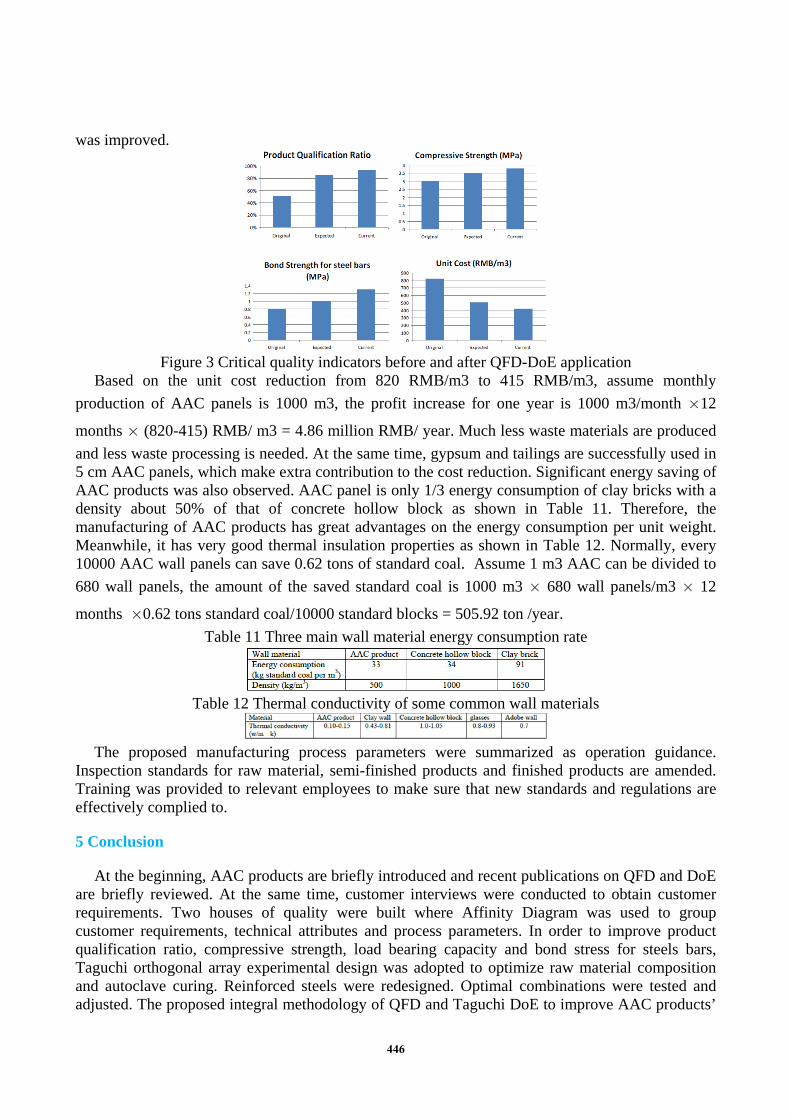
The critical quality indicators, including product qualification ratio, compressive strength, bond strength of reinforced bars and unit cost of 5 cm AAC panels were compared before and after the application of QFD and DoE. These indicators were illustrated in pareto chart in Figure 3. We can see that the product qualification ratio reached up to 92.8%, which is much higher than the original 50%. Compressive strength was raised from 3 MPa to 3.8 MPa. Bond strength for reinforced steels was raised up to 1.3 MPa. The decreased unit cost was mainly due to the reduction of raw material consumption, man power cost and electricity consumption after the production qualification ratio
445
was improved.
Figure 3 Critical quality indicators before and after QFD-DoE application
Based on the unit cost reduction from 820 RMB/m3 to 415 RMB/m3, assume monthly production of AAC panels is 1000 m3, the profit increase for one year is 1000 m3/month ´12
months ´ (820-415) RMB/ m3 = 4.86 million RMB/ year. Much less waste materials are produced and less waste processing is needed. At the same time, gypsum and tailings are successfully used in 5 cm AAC panels, which make extra contribution to the cost reduction. Significant energy saving of AAC products was also observed. AAC panel is only 1/3 energy consumption of clay bricks with a density about 50% of that of concrete hollow block as shown in Table 11. Therefore, the manufacturing of AAC products has great advantages on the energy consumption per unit weight. Meanwhile, it has very good thermal insulation properties as shown in Table 12. Normally, every 10000 AAC wall panels can save 0.62 tons of standard coal. Assume 1 m3 AAC can be divided to 680 wall panels, the amount of the saved standard coal is 1000 m3 ´ 680 wall panels/m3 ´ 12
months ´0.62 tons standard coal/10000 standard blocks = 505.92 ton /year. Table 11 Three main wall material energy consumption rate
Table 12 Thermal conductivity of some common wall materials
The proposed manufacturing process parameters were summarized as operation guidance.
Inspection standards for raw material, semi-finished products and finished products are amended. Training was provided to relevant employees to make sure that new standards and regulations are effectively complied to.
5 Conclusion
At the beginning, AAC products are briefly introduced and recent publications on QFD and DoE are briefly reviewed. At the same time, customer interviews were conducted to obtain customer requirements. Two houses of quality were built where Affinity Diagram was used to group customer requirements, technical attributes and process parameters. In order to improve product qualification ratio, compressive strength, load bearing capacity and bond stress for steels bars, Taguchi orthogonal array experimental design was adopted to optimize raw material composition and autoclave curing. Reinforced steels were redesigned. Optimal combinations were tested and adjusted. The proposed integral methodology of QFD and Taguchi DoE to improve AAC products’
446
quality is very effective based on the results we have achieved. This combination can be further applied to other building material industries. It is worth to notice that based on the features of AAC products, only the 1st phase and the 3rd phase of QFD, product design and process parameter design, were chosen to interpret the voice of customer. Taguchi DoE was used to find the optimized operation conditions for three critical processes during the AAC manufacturing. Taguchi DoE integrated in the 3rd QFD phase was firstly proposed by Bouchereau and Rowlands [23] in 2000, however, no real case study was reported since then. This is the first trial to see how this match works. The factor and level selections for each experiment design are extremely critical and directly affect the success of experiment, so extra experience and skills are required during this process.
References:
[1] Editors: Caijun Shi and Fouad H. Fouad and ACI Committee 229 and ACI Committee 523. (2005). SP-226: Autoclaved Aerated Concrete-Properties and Structural Design. ACI Special Publication, 226.
[2] Balkema, A. A. (1992). Advances in autoclaved aerated concrete. F. H. Wittmann (Ed.). AA Balkema. [3] Holt, E., & Raivio, P. (2005). Use of gasification residues in aerated autoclaved concrete. Cement and concrete
research, 35(4), 796-802. [4] Matsushita, F., Aono, Y., & Shibata, S. (2000). Carbonation degree of autoclaved aerated concrete. Cement and
concrete research, 30(11), 1741-1745. [5] Huang, X. Y., Ni, W., Cui, W. H., Wang, Z. J., & Zhu, L. P. (2012). Preparation of autoclaved aerated concrete
using copper tailings and blast furnace slag. Construction and Building Materials, 27(1), 1-5. [6] Lamers, T. L., David, M., Goodson, K., Ishii, K., & Pruitt, B. L. (2007). Application of a modified quality function
deployment method for MEMS. ASME. [7] Moldovan, L. (2014). QFD Employment for a New Product Design in a Mineral Water Company. Procedia
Technology, 12, 462-468. [8] Shad, Z., Roghanian, E., & Mojibian, F. (2014). Integration of QFD, AHP, and LPP methods in supplier
development problems under uncertainty. Journal of Industrial Engineering International, 10(1), 2. [9] Rahmana, A., Kamil, M., Soemantri, E., & Olim, A. (2014). Integration of SERVQUAL and KANO Model Into
QFD To Improve Quality of Simulation-Based Training on Project Management. Project management, 2(03), 60-73.
[10] Zaim, S., Sevkli, M., Camgöz-Akdağ, H., Demirel, O. F., Yesim Yayla, A., & Delen, D. (2014). Use of ANP Weighted Crisp and Fuzzy QFD for Product Development. Expert Systems with Applications.
[11] Iqbal, Z., Grigg, N. P., Govinderaju, K., & Campbell-Allen, N. (2014). Statistical comparison of final weight scores in quality function deployment (QFD) studies. International Journal of Quality & Reliability Management,31(2), 184-204.
[12] John, R., Smith, A., Chotipanich, S., & Pitt, M. (2014). Awareness and effectiveness of quality function deployment (QFD) in design and build projects in Nigeria. Journal of Facilities Management, 12(1), 6-6.
[13] Zhang, F. Y., Li, T., & Zhang, H. C. (2014, February). Study on the Efficiency-Reinforcement Design for Elastomeric Hydraulic Reciprocating Sealing Based on QFD/TRIZ. In Materials Science Forum (Vol. 770, 312-315).
[14] Zirehpour, A., Rahimpour, A., Jahanshahi, M., & Peyravi, M. (2014). Mixed matrix membrane application for olive oil wastewater treatment: Process optimization based on Taguchi design method. Journal of environmental management, 132, 113-120.
[15] Venkata Mohan, S., & Venkateswar Reddy, M. (2013). Optimization of critical factors to enhance polyhydroxyalkanoates (PHA) synthesis by mixed culture using Taguchi design of experimental methodology. Bioresource technology, 128, 409-416.
[16] Bagheri, A., & Nazari, A. (2014). Compressive strength of high strength class C fly ash-based geopolymers with reactive granulated blast furnace slag aggregates designed by Taguchi method. Materials & Design, 54, 483-490.
[17] Sivasakthivel, T., Murugesan, K., & Thomas, H. R. (2014). Optimization of operating parameters of ground source heat pump system for space heating and cooling by Taguchi method and utility concept. Applied Energy, 116, 76-85.
[18] Rahim, A., Sharma, U. K., Murugesan, K., Sharma, A., & Arora, P. (2013). Multi-response optimization of post-fire residual compressive strength of high performance concrete. Construction and Building Materials, 38, 265-273.
[19] Yeh, J. H., & Tsai, T. N. (2014). Optimizing the fine-pitch copper wire bonding process with multiple quality characteristics using a grey-fuzzy Taguchi method. Microelectronics Reliability, 54(1), 287-296.
[20] Chandra, M. (1993). Total quality management in management development. Journal of Management
447
Development, 12(7), 19-31. [21] Ross, P. J. (1988). The role of Taguchi methods and design of experiments in QFD. Quality Progress, 21(6), 41-47. [22] Sheng, J., He, Z., & Shi, X. (2002). Integration of Design of Experiments into Quality Function Deployment. Asian
Journal on Quality, 3(1), 71-84. [23] Bouchereau, V., & Rowlands, H. (2000). Methods and techniques to help quality function deployment (QFD).
Benchmarking: An International Journal,7(1), 8-20. [24] Shi, G. L., & She, Y. G. (2008). Study on problem-solving theory based on QFD, TRIZ and Taguchi methods.
Systems Engineering and Electronics, 5, 021. [25] Zheng, L. Y., & Chin, K. S. (2005). QFD based optimal process quality planning. The International Journal of