Improving the targeting of zero-rated basic foodstuffs under value added tax (VAT) in South Africa - An exploratory analysis ADA JANSEN, ELIZABETH STOLTZ AND DEREK YU May 2012 Stellenbosch Economic Working Papers: 07/12 KEYWORDS: VALUE ADDED TAX, EXPENDITURE PATTERNS, REGRESSIVITY, ZERO-RATING, EQUITY GAIN, OPTIMAL TARGETING, BASIC FOODSTUFFS, SUB- CATEGORIES OF VEGETABLES, SOUTH AFRICA JEL: H2, H24 ADA JANSEN DEPARTMENT OF ECONOMICS UNIVERSITY OF STELLENBOSCH PRIVATE BAG X1, 7602 MATIELAND, SOUTH AFRICA E-MAIL: [email protected]ELIZABETH STOLTZ DEPARTMENT OF ECONOMICS UNIVERSITY OF WESTERN CAPE SOUTH AFRICA E-MAIL: [email protected]DEREK YU DEPARTMENT OF ECONOMICS UNIVERSITY OF WESTERN CAPE SOUTH AFRICA E-MAIL: [email protected]A WORKING PAPER OF THE DEPARTMENT OF ECONOMICS AND THE BUREAU FOR ECONOMIC RESEARCH AT THE UNIVERSITY OF STELLENBOSCH
Transcript
Improving the targeting of zero-rated basic foodstuffs under value added tax (VAT) in South Africa - An
exploratory analysis
ADA JANSEN, ELIZABETH STOLTZ AND DEREK YU
May 2012
Stellenbosch Economic Working Papers: 07/12
KEYWORDS: VALUE ADDED TAX, EXPENDITURE PATTERNS, REGRESSIVITY, ZERO-RATING, EQUITY GAIN, OPTIMAL TARGETING, BASIC FOODSTUFFS, SUB-
CATEGORIES OF VEGETABLES, SOUTH AFRICA JEL: H2, H24
ADA JANSEN
DEPARTMENT OF ECONOMICS UNIVERSITY OF STELLENBOSCH
PRIVATE BAG X1, 7602 MATIELAND, SOUTH AFRICA E-MAIL: [email protected]
A WORKING PAPER OF THE DEPARTMENT OF ECONOMICS AND THE
BUREAU FOR ECONOMIC RESEARCH AT THE UNIVERSITY OF STELLENBOSCH
Improving the targeting of zero-rated basic foodstuffs under value added tax (VAT) in South Africa - An
exploratory analysis
ADA JANSEN, ELIZABETH STOLTZ AND DEREK YU
ABSTRACT
VAT without any exemptions or zero-rating is regressive. Since the inception of VAT in South Africa, there has been an ongoing debate around the issue of zero-rating to alleviate the burden on poor households. This paper uses vegetables as an example and conducts tax incidence analyses to compare the relative burden of VAT on vegetables for various income groups. It finds that differential treatment of the zero-rating of VAT on various categories of vegetables could be beneficial in terms of relative equity gains. It is suggested frozen vegetables remains zero-rated, whereas canned vegetables and some fresh vegetables items be zero-rated. Keywords: Value added tax, expenditure patterns, regressivity, zero-rating,
equity gain, optimal targeting, basic foodstuffs, sub-categories of vegetables, South Africa
JEL codes: H2, H24
3
1. INTRODUCTION Value Added Tax (VAT) is at present the second most important source of government revenue in South Africa, but as in most countries around the world, its impact on income distribution is controversial. A VAT applied without any exemptions or zero-rating is regressive. Given the country's political history and the extremely skewed distribution of income and wealth, the impact of the tax is even more controversial in South Africa. The mere fact that the rate has been unchanged at 14% since 1993 indicates that the tax is perceived as unfair, which is also clear from the strong resistance by the Congress of South African Trade Unions (COSATU) against any suggestions to increase the flat rate. Since the inception of VAT in 1991, the economic incidence of the tax was questioned and subsequently some additional foodstuffs were zero-rated, after continuous protests particularly from the labour unions. Furthermore, over the years various studies, the majority of which were commissioned by the South African government, investigated the redistributive consequences of VAT and confirmed its regressive impact.1 The variety of studies is indicative of the fact that the impact of VAT on poor households is a politically sensitive and very emotional issue, which is understandable given the extent of poverty and inequality. Given increasing domestic and international food prices, especially since the first half of 2008, and the fact that food prices were a major factor behind the increasing rate of inflation in South Africa at that time2, media reports increasingly focused on the plight of the poor and renewed questions were raised about the regressive impact of VAT on poor households. There was also speculation in the media at that time that the South African government was considering the zero-rating of some additional foodstuffs. Ensor (2008) reported that chicken, sorghum products and baby products were some of the items under consideration for possible additional zero-rating. The government however soon afterwards rejected this possibility (claiming that the rich would gain substantially more from zero-rating than the poor). This paper relates to these concerns about the impact of VAT on poor households. It is certainly not an easy task to target the poor effectively, given that expenditure patterns are intricate and change over time. It should also be kept in mind that the distributional impact of a single tax should not be judged in isolation, but rather be considered as part of the whole tax structure. Moreover, it is total fiscal incidence that really matters and it is generally accepted that the expenditure side of the national budget instead of taxes is a more efficient instrument to cater for the needs of the poor. However, this paper argues that the targeting of the zero-rated basket can be improved to enhance possible equity gains. The paper investigates the current zero-rating of vegetables as a food category as a case study and suggests that small changes to the tax treatment of sub-categories could have a more direct impact on the cost of food for the poor and enhance the equity gain from zero-rating. The first part of the paper focuses on the findings of various studies over the years on the distributional impact of the tax in South Africa. This is followed by some descriptive statistics illustrating the most recent expenditure patterns on vegetables of households across different income groups. Thereafter, using a partial equilibrium approach to tax incidence analyses (and different methodologies), the distributional impact of VAT on different categories of vegetables is illustrated in an attempt to motivate the proposed changes to the zero-rated basket of basic foodstuffs. The final section concludes and makes some recommendations.
1 Hardly any of the findings and recommendations of these studies translated into policy adjustments. 2 Food price inflation is again a major factor, as indicated by the fact that it increased from 11.1% in November to 11.6% in December 2011 (South African Reserve Bank, 2012).
4
2. THE QUEST TO MAKE VAT LESS REGRESSIVE IN SOUTH AFRICA Since the introduction of the general sales tax (GST) on 3 July 1978 the distributional consequences of this first broad-based sales tax in South Africa were under scrutiny, especially from the side of COSATU. This was during a period when the struggle against apartheid escalated and the tax was regarded as just another ‘instrument of discrimination’. This culminated in the first zero-rating of basic foodstuffs on 1 July 1984 (Stoltz, 1987:95 - 96). However, already in 1985 Tait (as discussed in Stoltz (1987)) speculated that the zero-rating would not succeed in relieving the pressure from the poorer households as much as expected. He blamed this on the specific classification of the type of foodstuffs that were targeted. Stoltz (1987) cited the examples of dried beans, canned food and vegetable oil, products which were not zero-rated, despite being generally regarded as “basic”. Smit (1986), in an unpublished study for the Margo Commission, used a social accounting matrix and estimated the tax burden of direct as well as indirect taxes for 1985 (Fourie and Owen, 1993). He based his calculations on a GST rate of 12% and found that the burden of this tax ranged “…from approximately 8.5 per cent of per capita household income for the poorest groups to approximately 4.5 per cent for the richest groups” (Fourie and Owen, 1993:308). This clearly indicates the regressive impact of the tax. In September 1991 a consumption-type of value added tax (VAT) was introduced at a rate of 10% to replace the GST, mainly for its revenue-raising potential and self-policing feature.3 In 1993 the rate was increased to 14%. Right from the start there were concerns about the regressive impact of the tax and as a result additional selected basic foodstuffs, such as maize meal, milk, fruit and vegetables as well as paraffin were zero-rated over time.4 As mentioned earlier, various studies in subsequent years focused on the distributional impact of the tax. The following paragraphs present the main findings of some of the studies chronologically. Fourie and Owen (1993: 313) determined that one-third of the total revenue loss as a result of zero-rating went to households from the poorest three income groups (out of nine groups identified). Despite this, they concluded that zero-rating significantly reduced the tax-burden on the lower-income households. Although the rich logically gained more in absolute terms, because they spent more, it is the relative burden of the tax which really matters when the regressive impact of VAT is considered. Fourie and Owen (1993: 308) furthermore warned: “An increased reliance on such a tax could have significant implications for economic justice and poverty, with obvious political ramifications.” The Katz Commission in its First Interim Report (1994) commented on the possibility of introducing a higher VAT rate on selected luxury goods to mitigate the regressive impact of the tax, but then found that the effect would be “minimal”. The Commission claimed that an “extensive set of luxury goods” and also much higher rates would be required to achieve a meaningful reduction in regressivity. The Commission therefore rejected the introduction of a higher VAT rate on luxury goods, but recommended that targeted poverty relief should be considered instead. It is significant that the Commission (1994: 123) furthermore claimed that “… it might be possible, based on equity considerations, to improve on the present basket of zero-rated goods” and also recommended that “…the revenue authorities should from time to time systematically review the current basket of zero-rated goods, with reference, inter alia, to the distributional aspects.” 3 The GST system suffered from serious evasion, since all tax was collected at the end of the distribution chain. 4 Cnossen (2003: 6) gives a complete list of the zero-rated food items: “… brown bread, maize meal, samp, mealie rice, dried mealies, dried beans, lentils, pilchards/sardinella in tins, milk powder, dairy powder blend, rice, vegetables, fruit, vegetable oil, milk, cultured milk, brown weaten meal, eggs, edible legumes and pulses of leguminous plants.” In addition, illuminated paraffin was added to the list of zero-rated items in 2001 (Republic of South Africa, 2001).
5
Alderman and Del Ninno (1999) in a study for the World Bank on the targeting of the current and proposed zero-rating at that stage, concluded that the zero-rating of fluid milk (which was zero-rated) and meat (for which zero-rating was proposed) could not be justified in terms of equity, neither in terms of its nutritional value. Another interesting finding was that the zero-rating of meat would benefit non-poor urban households relatively more and negatively impact on the calorie intake of rural households. In contrast they found that the zero-rating of maize was well targeted. Their study confirmed the importance not only of proper targeting, but also of the need to consider individual items for zero-rating. What is relevant for the purpose of this paper is that this study at that stage already looked at a sub-category (fluid milk) and also proposed that canned vegetables should be zero-rated. Over the years COSATU as important interest group continually urged government to ensure that VAT is not applied to basic foodstuffs. For example, in a submission to the Portfolio Committee on Finance (1999) the union federation explicitly stated: “The absence of an effective social security system exacerbates the regressivity of VAT and strengthens the case for zero rating VAT on many basic goods and services.” The union based its argument on the objectives of the RDP and also the elections manifesto of the ANC which stated: “There will be special tax exemption on those basic goods which poor families rely upon for survival.” In its submission (1999:3) the union federation furthermore suggested that government should consider zero-rating “…particular tinned foods which are consumed by low income groups” and also claimed that government’s proposals were not based on “…any study or statistical analysis of consumption patterns of the poor.” The union federation also regarded the proposal of the Draft Revenue Laws Amendment Bill to remove the zero-rating in the case of frozen vegetables as “arbitrary…” Watkinson and Makgetla (2002), in a study for the National Labour and Economic Development Institute (NALEDI), also referred to COSATU’s additional concerns that the zero-rating of VAT on basic foodstuffs was not being passed on to consumers. The union federation specifically mentioned zero-rating anomalies in the retail price of bread and pointed out that, except for the 700gm brown loaf, brown bread was generally more expensive than white (but brown bread was zero-rated, whilst white bread was not).5 Calcaterra and Kirsten (2003:4-12) in a study for the meat industry assessed the possible zero-rating of red meat and showed how the tax distorted consumer choices (due to the income and substitution effects). They found that poorer households substituted meat (which was more expensive as a result of the tax) for grain products. They also found that the budget share spent on fruit and vegetables decreased as real income decreased. This is interesting as it suggests that the broad categories of fruit and vegetables may be regarded as normal products, whilst the ensuing analysis shows that when vegetables are divided into sub-categories, a different picture emerges. Their findings also indicated that the introduction of VAT resulted in retail price increases (for the period 1991-1992) that exceeded the inflation rate and that it was most evident for beef, pork and mutton. They furthermore recommended that the impact on prices should be monitored in order to make sure that it is the consumer and not the producer or retailer who really benefits from the rather costly exercise. Cnossen (2003:11-12), an internationally acclaimed tax expert, investigated the incidence of consumption taxes in SADC countries. Whilst acknowledging that exemption6 was a widely used approach to mitigate the regressive impact of VAT in developing countries, he explicitly referred to differential rating as a second-best instrument. However, he claimed that “…using the income tax to address regressivity does not help the really poor who are not subject to this tax.
5 They used data from Statistics South Africa on Consumer Product Prices, October 2001. 6 Studies often use the terms exemption and zero-rating interchangeably. Cnossen (2003:13), however, prefers the term exemption to zero-rating, because he believes it would be “…a greater deterrent to political pressures to increase the number of favoured products.”
6
Accordingly, there is a residual case for exemption…” What is particularly interesting was his comment that policy makers in SADC countries should consider the type of basic foodstuffs that were zero-rated in South Africa as an example to improve the distributional impact of VAT. He therefore by implication acknowledged that zero-rating was an effective tool to address the equity concerns of VAT in South Africa. What is furthermore important for policy makers was Cnossen's recommendation (2003:3) that the “… efficacy of rate- and base-differentiated...” consumption taxes should be regularly examined. Delfin, Kearny, Robinson and Thierfelder (2005) used a computable general equilibrium (CGE) model to determine the distributional implications of possible reforms to VAT in South Africa. They considered what the effect would be of replacing the VAT on agriculture and food with, amongst other things, an increase of other VAT rates. They explained that there was room for changes to the VAT system that would make the incidence of the tax less regressive and explicitly stated (2003:19): “Minor changes to the tax structure can have a substantial impact on the tax burden for low-income households.” This is exactly what this paper intends to demonstrate. Delfin et al. (2003:6) furthermore claimed that the intended benefit from the zero-rating of paraffin in 2001 was not passed on to consumers, but absorbed by suppliers.7 Price Waterhouse Coopers (2007) was commissioned by National Treasury to investigate zero-rating specific merit goods, such as education and health services. Part of the directive was to determine the possible impact of the zero-rating of individual items, such as specific types of meat and fruit (oranges). The findings of this study was presented at a National Tax Symposium in 2008, but unfortunately have not been made available. An unofficial discussion (12 July 2009) with a senior office-bearer of the firm revealed that the recommendations of the report were not considered by National Treasury, due to an explicit policy decision at that time against any further zero-rating (in order to protect the tax base). Furthermore, it was mentioned that the South African Canned Fruit and Vegetable Industry was also putting pressure on government to zero-rate canned foodstuffs. This is significant for the purpose of this paper. It therefore came as no surprise when the Minister of Finance, in the 2008 Medium Term Budget Policy Statement (Republic of South Africa, 2008:42), made it clear that despite pressure, no further foodstuffs would be zero-rated and explicitly stated: “Evidence suggests that existing VAT zero-ratings and exemptions, in almost all cases confer substantially more benefits on middle- and higher-income groups than on lower-income groups”.8 It is particularly this statement that this paper is investigating, by focusing on the meaning of ‘substantially more benefits’. Whilst it is obvious that higher income groups gain more from zero-rating in absolute terms because they spend larger amounts, poorer households gain more in relative terms. This statement by government therefore contrasts the findings of Fourie and Owen (1993) as well as the statement by Cnossen (2003) regarding the efficacy of zero-rating in mitigating the regressive impact of VAT. Moreover, in the recent past and over various budget years, the South African government significantly reduced the tax burden on low and middle income-earners through changes to the individual income tax structure.9 However, these efforts exacerbated the real and perceived inequity of the tax system as the efforts did not reach the poorest of households who are not liable for income tax. It is noteworthy that Fourie and Owen (1993) opposed the argument that
7 Although outside the main focus of this paper, this matter should concern policy makers, as it was also raised by COSATU and mentioned in the study by Calcaterra and Kirsten (2003). 8 The minister also claimed that “…producers and suppliers may capture a large percentage of the benefit of VAT zero-rating.” (Republic of South Africa, 2008). This statement proves that government was aware of the concerns raised by Alderman and Del Ninno (1999), COSATU (1999) and Calcaterra and Kirsten (2003). 9 The South African government granted income tax relief of R63417 million over the budget years 2004-05 to 2009-10 (National Treasury & South African Revenue Service, 2010). None of this reached the really poor.
7
regressivity can best be addressed by changes to the income tax structure. Cnossen (2003:12) also agreed that it “…does not help the really poor.” Despite efficiency arguments against the narrowing of the VAT base through exemptions and zero-rating, it is not a policy that will easily disappear. Bird (2008:12) claimed that “…a country may of course decide that the price is worth paying. After all, fairness is a key issue in designing any tax regime.” Fourie and Owen (1993) mentioned that recommendations to reduce or eliminate zero-rating were rarely followed in practice and stated that, apart from the fact that it would not be politically responsible in the South African context, it could not be implemented as long as the social security system was not effective. This argument still holds as Van der Berg (2009), in a study on the fiscal incidence of social spending in 2006, indicates that even though social spending on the poor has increased, it can only have a limited impact in addressing the large degree of inequality. It can therefore be expected that zero-rating of VAT will remain part and parcel of the structure of VAT in South Africa. However, certain anomalies are part of the present system of zero-rating. A particular case in point is the category of vegetables, which can be broken down into different sub-categories. Canned vegetables, mostly consumed by relatively poorer households, are not included in the zero-rated basket. In contrast, relatively luxurious unprocessed fresh vegetables (for example fresh asparagus and mushrooms) are mostly consumed by relatively richer households, but are zero-rated. The next section of the paper therefore investigates the tax treatment of specific sub-categories of vegetables as an illustrative example of changes that can be made to the zero-rated basket of basic foodstuffs, which may enhance the equity gain from this costly exercise (in terms of loss of tax revenue). 3. INVESTIGATING THE TAX TREATMENT OF THE FOOD CATEGORY OF
VEGETABLES Firstly, this section defines basic foodstuffs, followed by an explanation of the data used in the subsequent analyses. The analyses commence with an investigation of the expenditure patterns of various income groups on different categories of vegetables. Thereafter tax incidence analyses focuses on the equity impact of VAT on different categories of vegetables. The findings are complemented by concentration curves analyses and some indicators of inequality. 3.1 Defining basic foodstuffs It is not easy to select which basic foodstuffs should be considered for possible zero-rating from VAT (Fourie and Owen 1993). According to Cnossen (in Khalilzadeh-Shirazi and Shah, 1991: 81), the definition of essential goods tends to differ between countries. Tait (1988) distinguished between essential and luxury goods in an attempt to reduce the erosion of the tax base when zero-rating is applied. According to him it basically relates to a distinction between processed and unprocessed food. Calcaterra and Kirsten (2003:2) on the other hand, distinguished between basic foods when referring to products that undergo minimal processing, and staple foods that are traditionally linked to the diets of households in poor communities. Given that equity is the main concern, it stands to reason that the equity gain to the poor should be maximised (Fourie and Owen, 1993). Their main consideration in this regard is whether the goods are disproportionately consumed by the poor, and whether it is a crucial part of poor household's budgets. This is in agreement with Cnossen (2003:11), who suggested the following guidelines for rate differentiation: (a) necessities should have an income elasticity of demand of less than one and a price inelastic demand; (b) it should be possible to divide goods into sub-groups, assuming that spending patterns between the poor and the rich are distinctly different. As
8
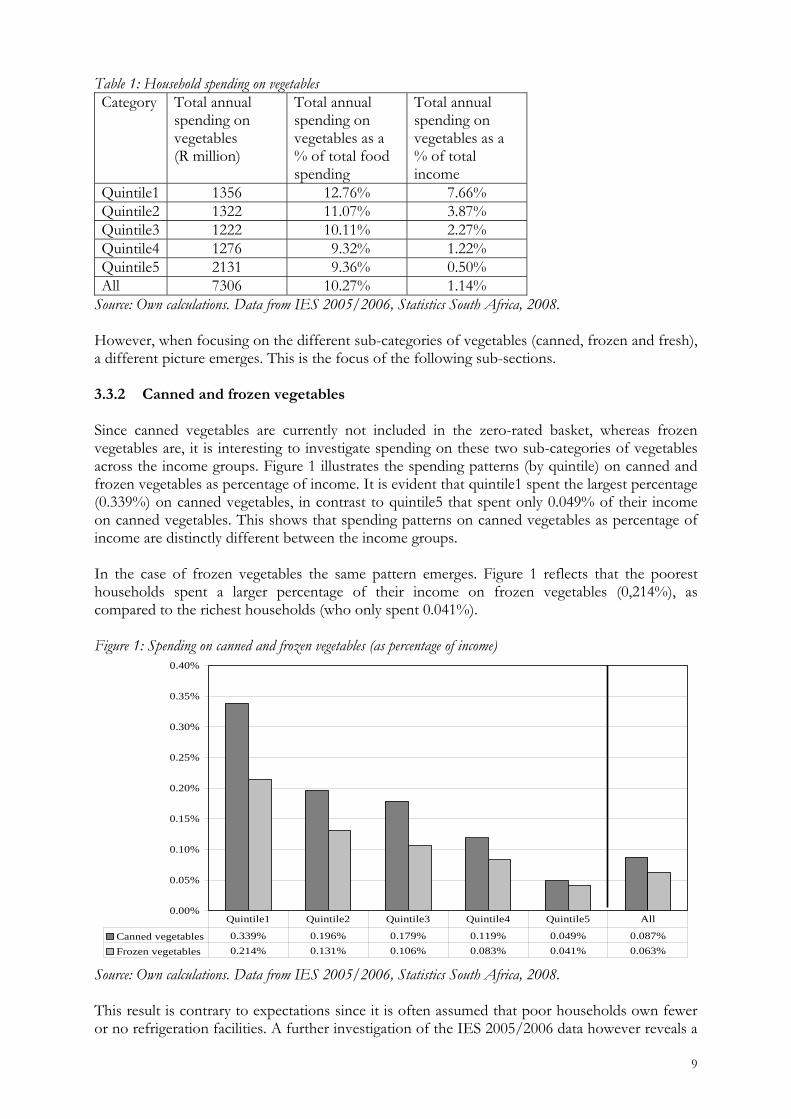
such, goods that ought to be considered for zero-rating would be those consumed proportionately more by the poor. 3.2 Data and analyses The study used data from the Income and Expenditure Survey 2005/2006 (IES 2005/2006), as released by Statistics South Africa (2008). This data include households throughout the country and provides comprehensive information on their expenditure patterns. The population is divided into quintiles, ranging from the poorest 20% of households (quintile1) to the richest 20% (quintile5), based on real per capita income. The analyses have three components. Firstly, household spending patterns on different categories of vegetables are analysed to determine which types of vegetables are disproportionately consumed by the poorest households. Secondly, average tax rates are determined for different categories of vegetables across income groups to investigate the incidence of VAT between income groups. Alternative zero-rating options to maximise the equity gain are then considered. Tax concentration curves provide further empirical evidence in support of the findings from the incidence analysis. Some indicators measuring the relative tax burden on the poor are finally calculated, which also reflects the degree of regressivity of the tax. 3.3 Spending on vegetables This section focuses on spending patterns of households on vegetables across the income distribution spectrum in South Africa. The focus is particularly on the sub-categories of fresh, frozen and canned vegetables. Some of these sub-categories are considered as basic and are currently zero-rated, whilst others are not. 3.3.1 All categories of vegetables Table 1 provides a summary of household spending on vegetables by quintile. It is evident that in absolute terms quintile1 spent a smaller amount on vegetables and fruit than the richest. However, for equity purposes it is more relevant to compare spending as percentage of income. Considering spending on these items as percentage of household income, quintile1 spent a larger percentage (7.66%), as compared to quintile5 who spent only 0.50% of their income on vegetables. This shows that vegetables are relatively more important for poorer households and may explain the inclusion of some of the sub-categories in the zero-rated basket.
9
Table 1: Household spending on vegetables Category Total annual
spending on vegetables (R million)
Total annual spending on vegetables as a % of total food spending
Total annual spending on vegetables as a % of total income
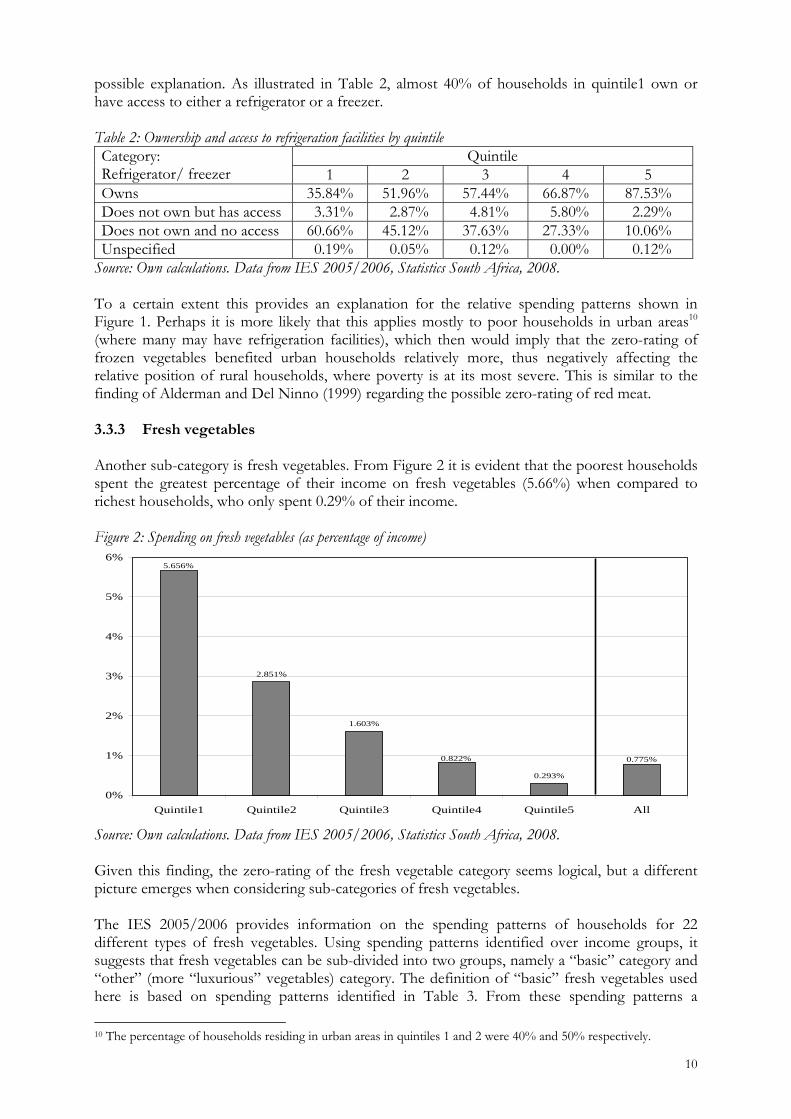
Source: Own calculations. Data from IES 2005/2006, Statistics South Africa, 2008. However, when focusing on the different sub-categories of vegetables (canned, frozen and fresh), a different picture emerges. This is the focus of the following sub-sections. 3.3.2 Canned and frozen vegetables Since canned vegetables are currently not included in the zero-rated basket, whereas frozen vegetables are, it is interesting to investigate spending on these two sub-categories of vegetables across the income groups. Figure 1 illustrates the spending patterns (by quintile) on canned and frozen vegetables as percentage of income. It is evident that quintile1 spent the largest percentage (0.339%) on canned vegetables, in contrast to quintile5 that spent only 0.049% of their income on canned vegetables. This shows that spending patterns on canned vegetables as percentage of income are distinctly different between the income groups. In the case of frozen vegetables the same pattern emerges. Figure 1 reflects that the poorest households spent a larger percentage of their income on frozen vegetables (0,214%), as compared to the richest households (who only spent 0.041%). Figure 1: Spending on canned and frozen vegetables (as percentage of income)
Quintile1 Quintile2 Quintile3 Quintile4 Quintile5 All
Source: Own calculations. Data from IES 2005/2006, Statistics South Africa, 2008. This result is contrary to expectations since it is often assumed that poor households own fewer or no refrigeration facilities. A further investigation of the IES 2005/2006 data however reveals a
10
possible explanation. As illustrated in Table 2, almost 40% of households in quintile1 own or have access to either a refrigerator or a freezer. Table 2: Ownership and access to refrigeration facilities by quintile Category: Refrigerator/ freezer
Quintile 1 2 3 4 5
Owns 35.84% 51.96% 57.44% 66.87% 87.53% Does not own but has access 03.31% 02.87% 04.81% 05.80% 02.29% Does not own and no access 60.66% 45.12% 37.63% 27.33% 10.06% Unspecified 00.19% 00.05% 00.12% 00.00% 00.12%
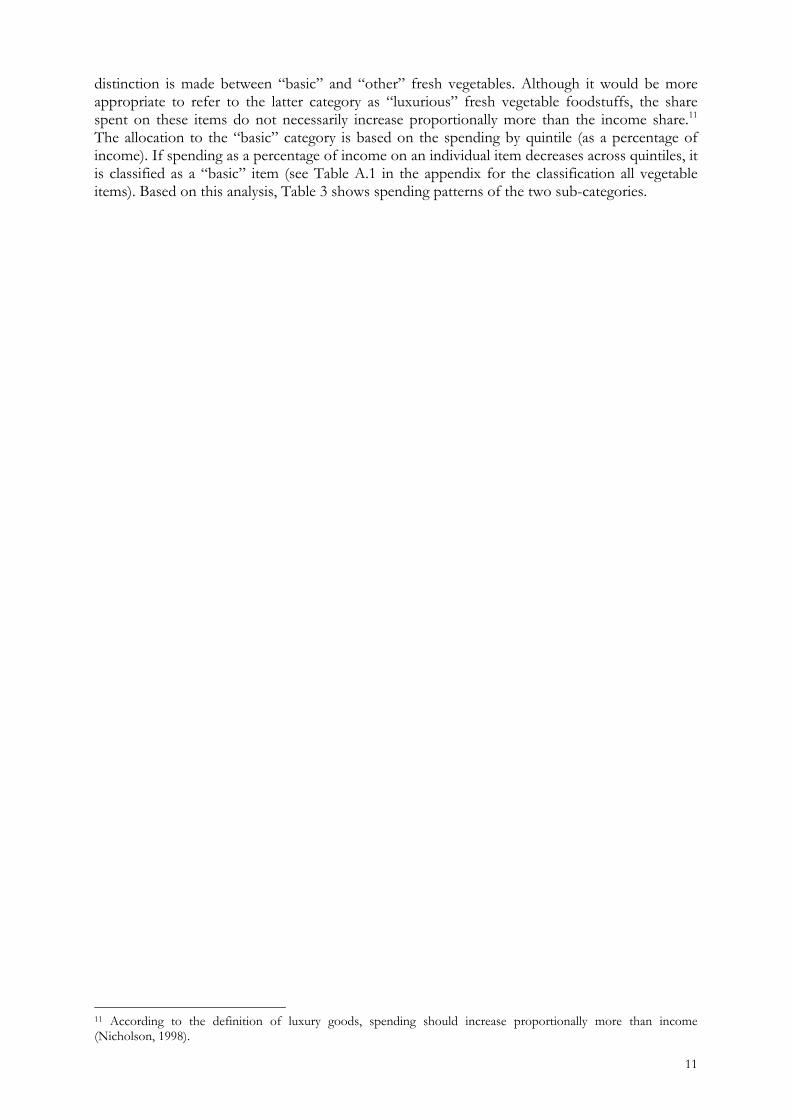
Source: Own calculations. Data from IES 2005/2006, Statistics South Africa, 2008. To a certain extent this provides an explanation for the relative spending patterns shown in Figure 1. Perhaps it is more likely that this applies mostly to poor households in urban areas10 (where many may have refrigeration facilities), which then would imply that the zero-rating of frozen vegetables benefited urban households relatively more, thus negatively affecting the relative position of rural households, where poverty is at its most severe. This is similar to the finding of Alderman and Del Ninno (1999) regarding the possible zero-rating of red meat. 3.3.3 Fresh vegetables Another sub-category is fresh vegetables. From Figure 2 it is evident that the poorest households spent the greatest percentage of their income on fresh vegetables (5.66%) when compared to richest households, who only spent 0.29% of their income. Figure 2: Spending on fresh vegetables (as percentage of income)
2.851%
1.603%
0.293%
0.822% 0.775%
5.656%
0%
1%
2%
3%
4%
5%
6%
Quintile1 Quintile2 Quintile3 Quintile4 Quintile5 All
Source: Own calculations. Data from IES 2005/2006, Statistics South Africa, 2008. Given this finding, the zero-rating of the fresh vegetable category seems logical, but a different picture emerges when considering sub-categories of fresh vegetables. The IES 2005/2006 provides information on the spending patterns of households for 22 different types of fresh vegetables. Using spending patterns identified over income groups, it suggests that fresh vegetables can be sub-divided into two groups, namely a “basic” category and “other” (more “luxurious” vegetables) category. The definition of “basic” fresh vegetables used here is based on spending patterns identified in Table 3. From these spending patterns a
10 The percentage of households residing in urban areas in quintiles 1 and 2 were 40% and 50% respectively.
11
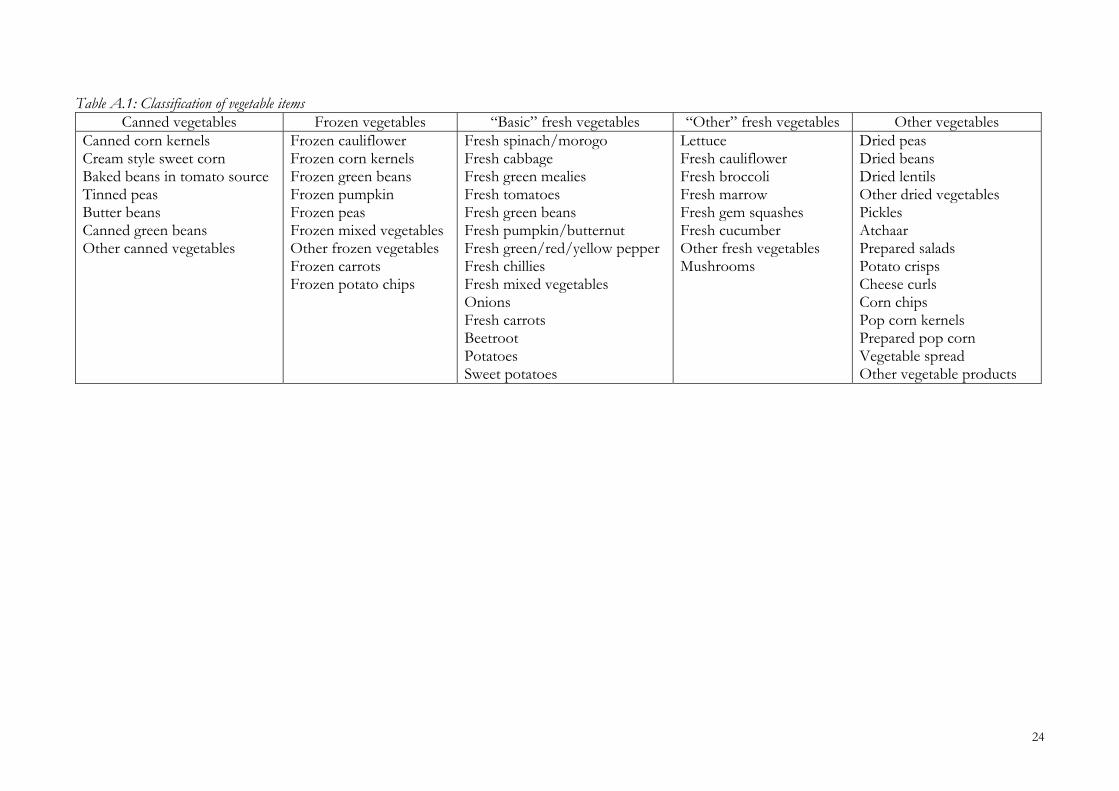
distinction is made between “basic” and “other” fresh vegetables. Although it would be more appropriate to refer to the latter category as “luxurious” fresh vegetable foodstuffs, the share spent on these items do not necessarily increase proportionally more than the income share.11 The allocation to the “basic” category is based on the spending by quintile (as a percentage of income). If spending as a percentage of income on an individual item decreases across quintiles, it is classified as a “basic” item (see Table A.1 in the appendix for the classification all vegetable items). Based on this analysis, Table 3 shows spending patterns of the two sub-categories.
11 According to the definition of luxury goods, spending should increase proportionally more than income (Nicholson, 1998).
12
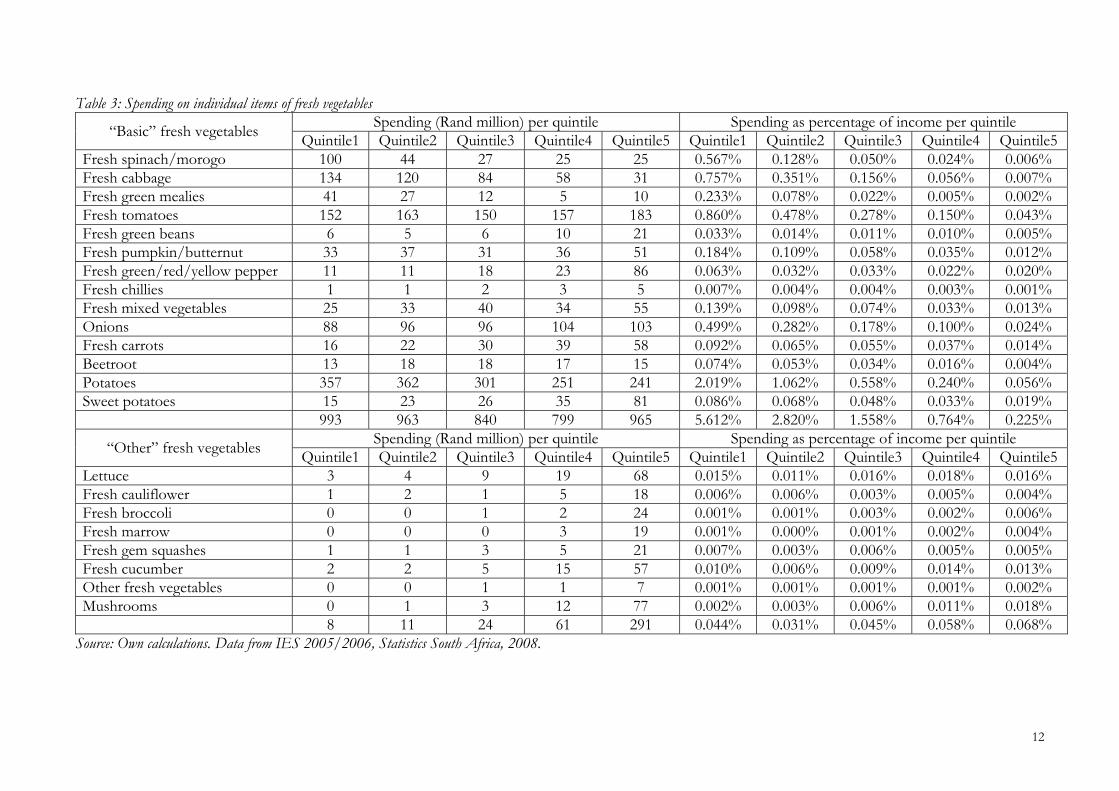
Table 3: Spending on individual items of fresh vegetables
“Basic” fresh vegetables Spending (Rand million) per quintile Spending as percentage of income per quintile
Source: Own calculations. Data from IES 2005/2006, Statistics South Africa, 2008.
13
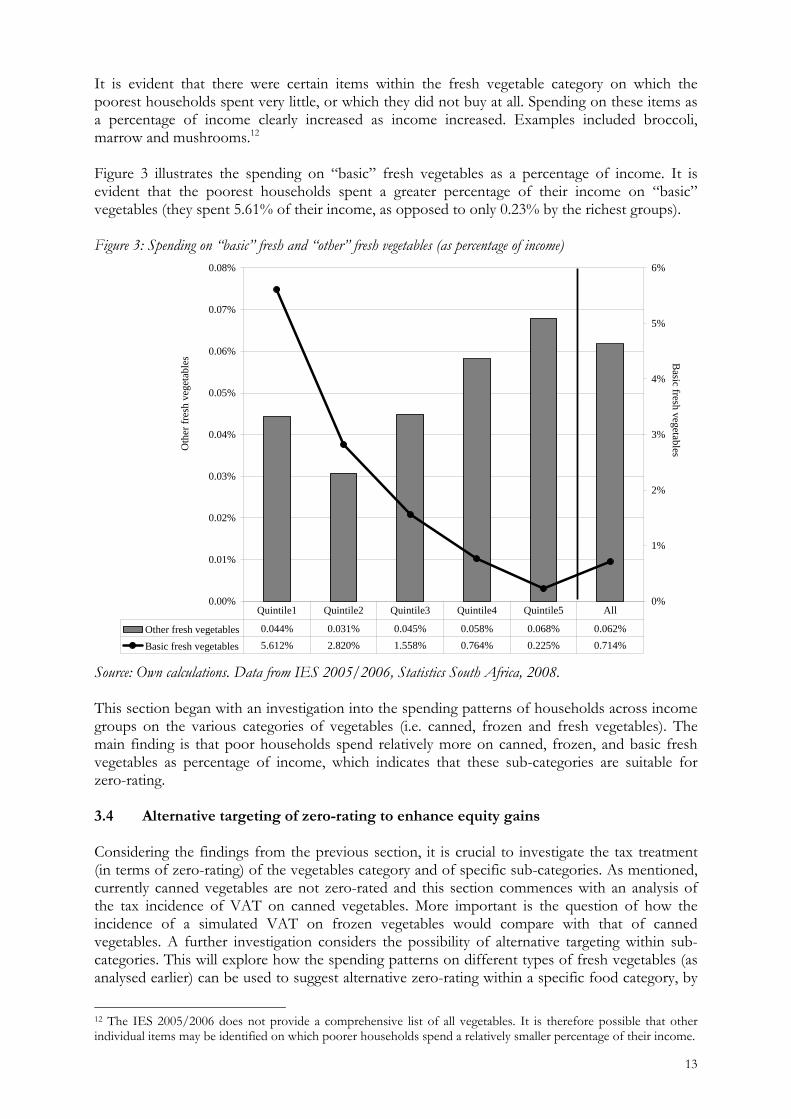
It is evident that there were certain items within the fresh vegetable category on which the poorest households spent very little, or which they did not buy at all. Spending on these items as a percentage of income clearly increased as income increased. Examples included broccoli, marrow and mushrooms.12 Figure 3 illustrates the spending on “basic” fresh vegetables as a percentage of income. It is evident that the poorest households spent a greater percentage of their income on “basic” vegetables (they spent 5.61% of their income, as opposed to only 0.23% by the richest groups). Figure 3: Spending on “basic” fresh and “other” fresh vegetables (as percentage of income)
0.00%
0.01%
0.02%
0.03%
0.04%
0.05%
0.06%
0.07%
0.08%
Oth
er f
resh
veg
etab
les
0%
1%
2%
3%
4%
5%
6%
Basic fresh vegetables
Other fresh vegetables 0.044% 0.031% 0.045% 0.058% 0.068% 0.062%
Quintile1 Quintile2 Quintile3 Quintile4 Quintile5 All
Source: Own calculations. Data from IES 2005/2006, Statistics South Africa, 2008. This section began with an investigation into the spending patterns of households across income groups on the various categories of vegetables (i.e. canned, frozen and fresh vegetables). The main finding is that poor households spend relatively more on canned, frozen, and basic fresh vegetables as percentage of income, which indicates that these sub-categories are suitable for zero-rating. 3.4 Alternative targeting of zero-rating to enhance equity gains Considering the findings from the previous section, it is crucial to investigate the tax treatment (in terms of zero-rating) of the vegetables category and of specific sub-categories. As mentioned, currently canned vegetables are not zero-rated and this section commences with an analysis of the tax incidence of VAT on canned vegetables. More important is the question of how the incidence of a simulated VAT on frozen vegetables would compare with that of canned vegetables. A further investigation considers the possibility of alternative targeting within sub-categories. This will explore how the spending patterns on different types of fresh vegetables (as analysed earlier) can be used to suggest alternative zero-rating within a specific food category, by
12 The IES 2005/2006 does not provide a comprehensive list of all vegetables. It is therefore possible that other individual items may be identified on which poorer households spend a relatively smaller percentage of their income.
14
once again analysing the incidence of a simulated VAT. Finally, an indicator measuring the degree of the tax burden is calculated. This is done to emphasize the empirical findings of the tax incidence analyses. The subsequent analysis follows a partial and static equilibrium approach13, since the focus is only on VAT, while neither secondary effects nor price changes are considered. Conventional tax theory defines tax regressivity (or progressivity) in terms of the average tax rate. Rosen and Gayer (2008: 307) explain that if the average tax rate decreases (increases) with income, the tax is regressive (progressive). Johannes, Nju and Theresia (2006: 11) provide the following formula to calculate the tax payments for the different quintiles. The tax paid is calculated as follows:
Tax et
t
1
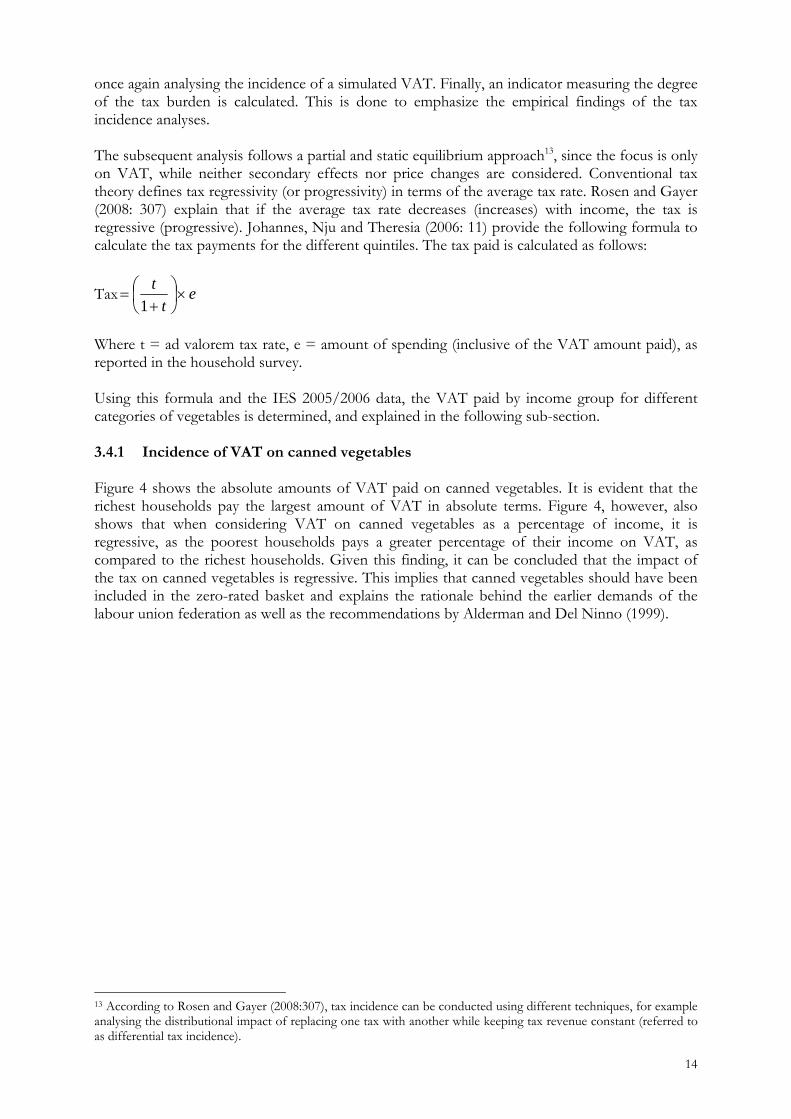
Where t = ad valorem tax rate, e = amount of spending (inclusive of the VAT amount paid), as reported in the household survey. Using this formula and the IES 2005/2006 data, the VAT paid by income group for different categories of vegetables is determined, and explained in the following sub-section. 3.4.1 Incidence of VAT on canned vegetables Figure 4 shows the absolute amounts of VAT paid on canned vegetables. It is evident that the richest households pay the largest amount of VAT in absolute terms. Figure 4, however, also shows that when considering VAT on canned vegetables as a percentage of income, it is regressive, as the poorest households pays a greater percentage of their income on VAT, as compared to the richest households. Given this finding, it can be concluded that the impact of the tax on canned vegetables is regressive. This implies that canned vegetables should have been included in the zero-rated basket and explains the rationale behind the earlier demands of the labour union federation as well as the recommendations by Alderman and Del Ninno (1999).
13 According to Rosen and Gayer (2008:307), tax incidence can be conducted using different techniques, for example analysing the distributional impact of replacing one tax with another while keeping tax revenue constant (referred to as differential tax incidence).
15
Figure 4: VAT on canned vegetables
0
5
10
15
20
25
30
VA
T a
mou
nt p
aid
(R m
illi
on)
0.000%
0.005%
0.010%
0.015%
0.020%
0.025%
0.030%
0.035%
0.040%
0.045%V
AT
as percentage of income
VAT as percentage of income 0.042% 0.024% 0.022% 0.015% 0.006%
VAT amount paid 7 8 12 15 26
Quintile1 Quintile2 Quintile3 Quintile4 Quintile5
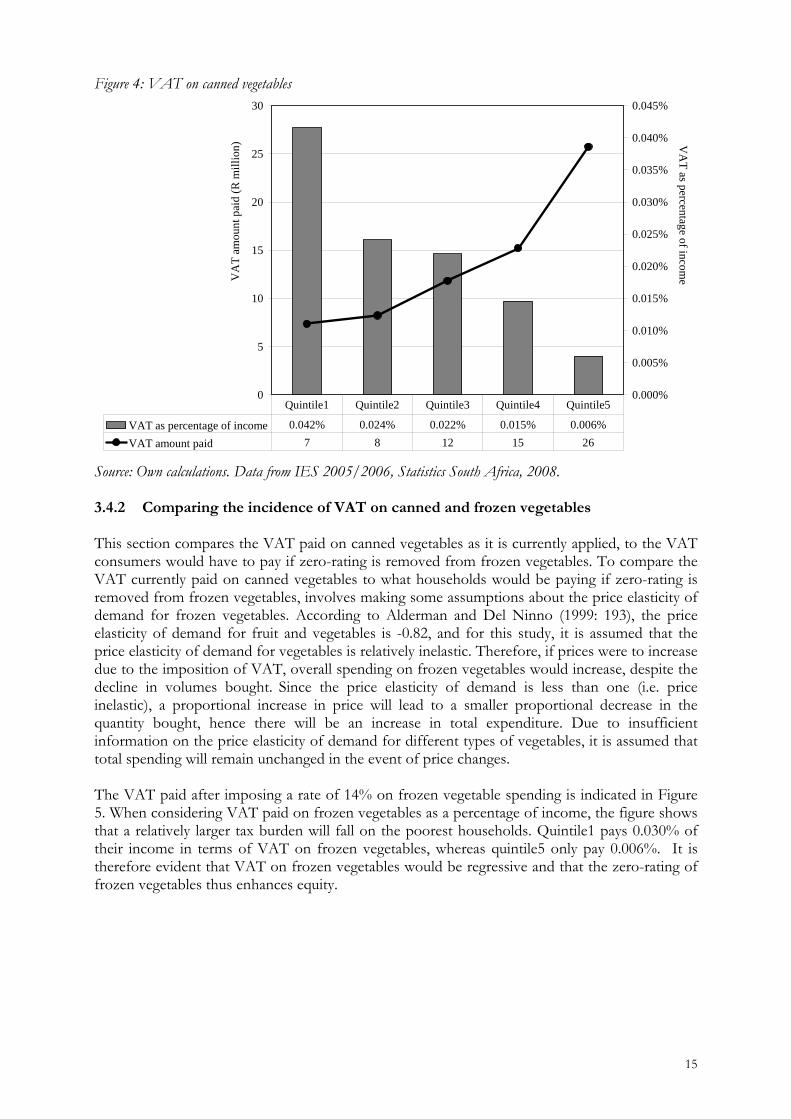
Source: Own calculations. Data from IES 2005/2006, Statistics South Africa, 2008. 3.4.2 Comparing the incidence of VAT on canned and frozen vegetables This section compares the VAT paid on canned vegetables as it is currently applied, to the VAT consumers would have to pay if zero-rating is removed from frozen vegetables. To compare the VAT currently paid on canned vegetables to what households would be paying if zero-rating is removed from frozen vegetables, involves making some assumptions about the price elasticity of demand for frozen vegetables. According to Alderman and Del Ninno (1999: 193), the price elasticity of demand for fruit and vegetables is -0.82, and for this study, it is assumed that the price elasticity of demand for vegetables is relatively inelastic. Therefore, if prices were to increase due to the imposition of VAT, overall spending on frozen vegetables would increase, despite the decline in volumes bought. Since the price elasticity of demand is less than one (i.e. price inelastic), a proportional increase in price will lead to a smaller proportional decrease in the quantity bought, hence there will be an increase in total expenditure. Due to insufficient information on the price elasticity of demand for different types of vegetables, it is assumed that total spending will remain unchanged in the event of price changes. The VAT paid after imposing a rate of 14% on frozen vegetable spending is indicated in Figure 5. When considering VAT paid on frozen vegetables as a percentage of income, the figure shows that a relatively larger tax burden will fall on the poorest households. Quintile1 pays 0.030% of their income in terms of VAT on frozen vegetables, whereas quintile5 only pay 0.006%. It is therefore evident that VAT on frozen vegetables would be regressive and that the zero-rating of frozen vegetables thus enhances equity.
16
Figure 5: VAT on frozen vegetables
0
5
10
15
20
25
30
VA
T a
mou
nt p
aid
(R m
illi
on)
0.000%
0.005%
0.010%
0.015%
0.020%
0.025%
0.030%
0.035%V
AT
as percentage of income
VAT as percentage of income 0.030% 0.018% 0.015% 0.012% 0.006%
VAT amount paid 5 6 8 12 24
Quintile1 Quintile2 Quintile3 Quintile4 Quintile5
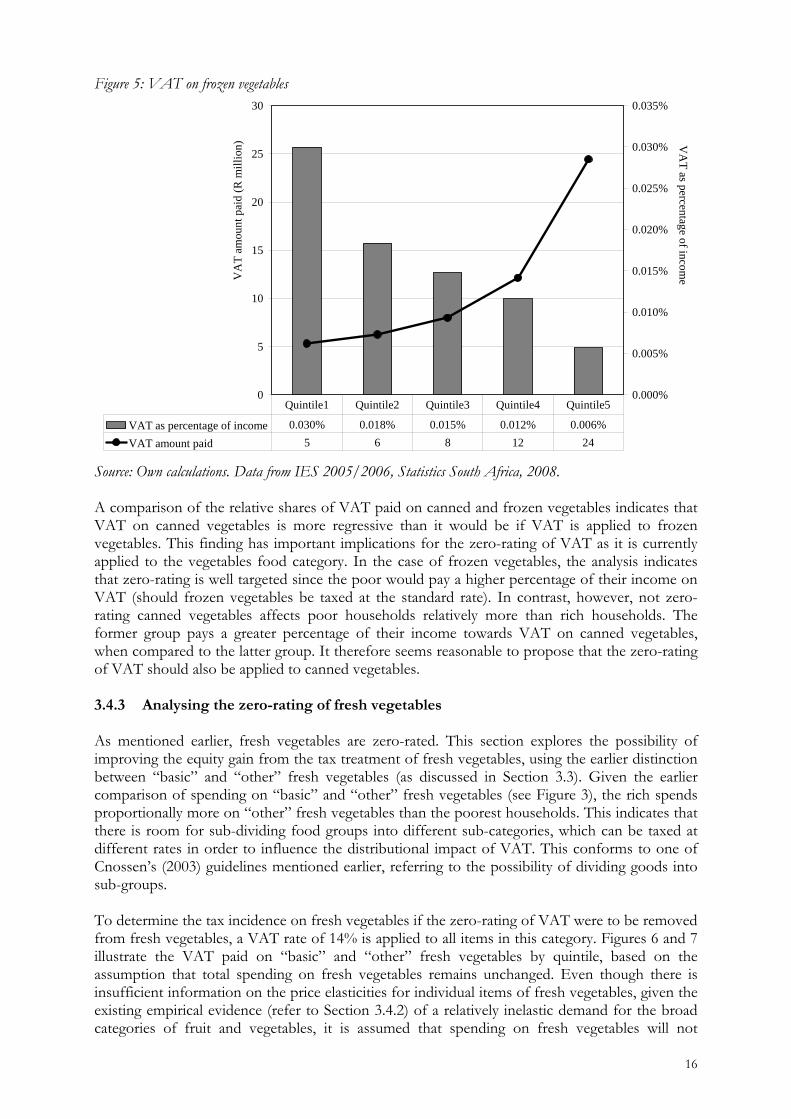
Source: Own calculations. Data from IES 2005/2006, Statistics South Africa, 2008. A comparison of the relative shares of VAT paid on canned and frozen vegetables indicates that VAT on canned vegetables is more regressive than it would be if VAT is applied to frozen vegetables. This finding has important implications for the zero-rating of VAT as it is currently applied to the vegetables food category. In the case of frozen vegetables, the analysis indicates that zero-rating is well targeted since the poor would pay a higher percentage of their income on VAT (should frozen vegetables be taxed at the standard rate). In contrast, however, not zero-rating canned vegetables affects poor households relatively more than rich households. The former group pays a greater percentage of their income towards VAT on canned vegetables, when compared to the latter group. It therefore seems reasonable to propose that the zero-rating of VAT should also be applied to canned vegetables. 3.4.3 Analysing the zero-rating of fresh vegetables As mentioned earlier, fresh vegetables are zero-rated. This section explores the possibility of improving the equity gain from the tax treatment of fresh vegetables, using the earlier distinction between “basic” and “other” fresh vegetables (as discussed in Section 3.3). Given the earlier comparison of spending on “basic” and “other” fresh vegetables (see Figure 3), the rich spends proportionally more on “other” fresh vegetables than the poorest households. This indicates that there is room for sub-dividing food groups into different sub-categories, which can be taxed at different rates in order to influence the distributional impact of VAT. This conforms to one of Cnossen’s (2003) guidelines mentioned earlier, referring to the possibility of dividing goods into sub-groups. To determine the tax incidence on fresh vegetables if the zero-rating of VAT were to be removed from fresh vegetables, a VAT rate of 14% is applied to all items in this category. Figures 6 and 7 illustrate the VAT paid on “basic” and “other” fresh vegetables by quintile, based on the assumption that total spending on fresh vegetables remains unchanged. Even though there is insufficient information on the price elasticities for individual items of fresh vegetables, given the existing empirical evidence (refer to Section 3.4.2) of a relatively inelastic demand for the broad categories of fruit and vegetables, it is assumed that spending on fresh vegetables will not
17
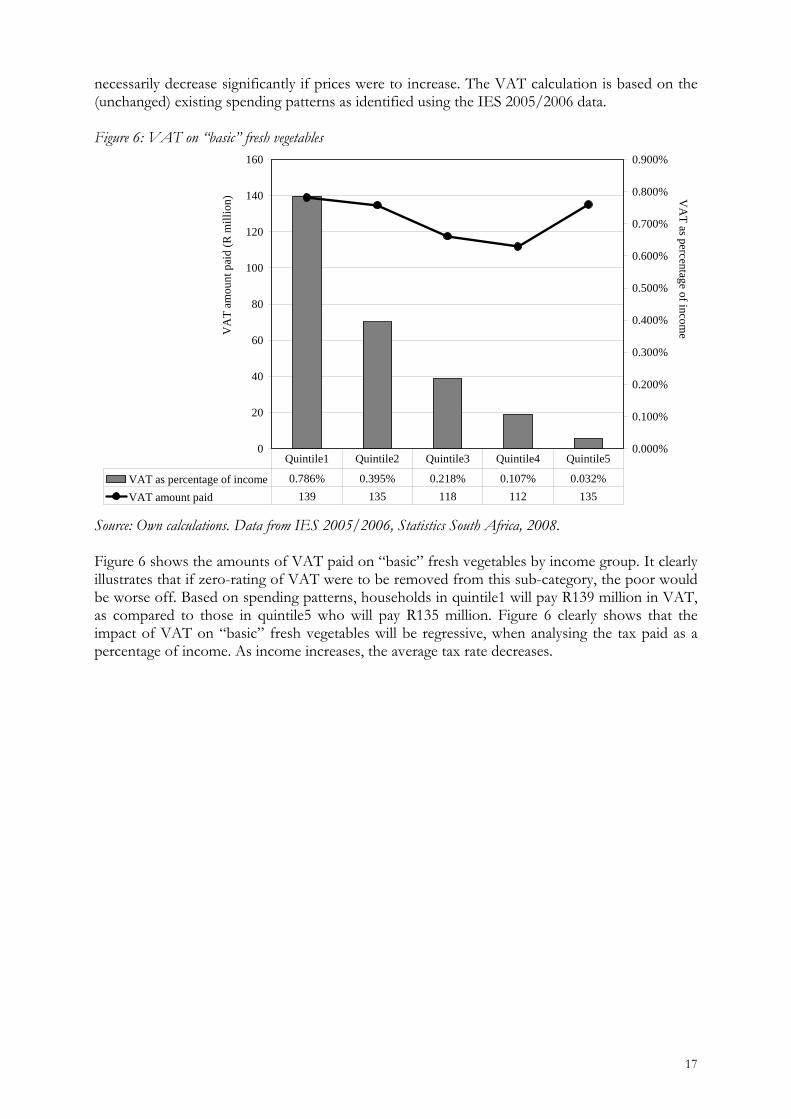
necessarily decrease significantly if prices were to increase. The VAT calculation is based on the (unchanged) existing spending patterns as identified using the IES 2005/2006 data. Figure 6: VAT on “basic” fresh vegetables
0
20
40
60
80
100
120
140
160
VA
T a
mou
nt p
aid
(R m
illi
on)
0.000%
0.100%
0.200%
0.300%
0.400%
0.500%
0.600%
0.700%
0.800%
0.900%
VA
T as percentage of incom
e
VAT as percentage of income 0.786% 0.395% 0.218% 0.107% 0.032%
VAT amount paid 139 135 118 112 135
Quintile1 Quintile2 Quintile3 Quintile4 Quintile5
Source: Own calculations. Data from IES 2005/2006, Statistics South Africa, 2008. Figure 6 shows the amounts of VAT paid on “basic” fresh vegetables by income group. It clearly illustrates that if zero-rating of VAT were to be removed from this sub-category, the poor would be worse off. Based on spending patterns, households in quintile1 will pay R139 million in VAT, as compared to those in quintile5 who will pay R135 million. Figure 6 clearly shows that the impact of VAT on “basic” fresh vegetables will be regressive, when analysing the tax paid as a percentage of income. As income increases, the average tax rate decreases.
18
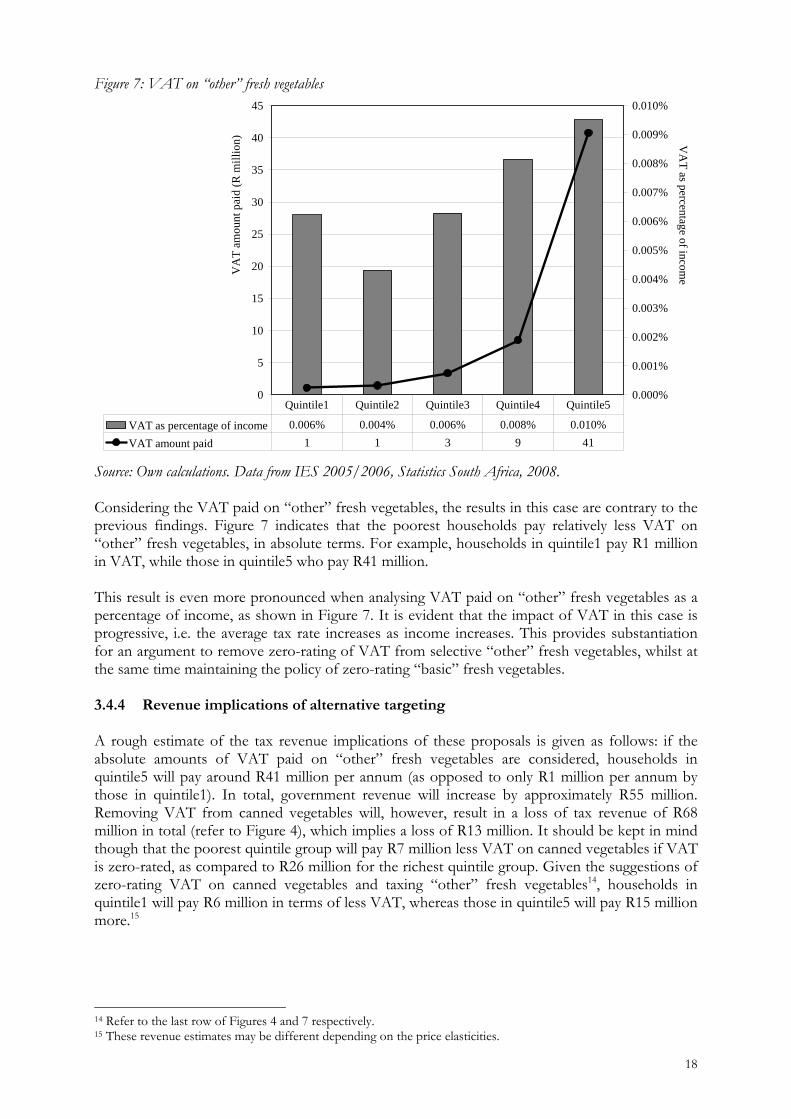
Figure 7: VAT on “other” fresh vegetables
0
5
10
15
20
25
30
35
40
45
VA
T a
mou
nt p
aid
(R m
illi
on)
0.000%
0.001%
0.002%
0.003%
0.004%
0.005%
0.006%
0.007%
0.008%
0.009%
0.010%V
AT
as percentage of income
VAT as percentage of income 0.006% 0.004% 0.006% 0.008% 0.010%
VAT amount paid 1 1 3 9 41
Quintile1 Quintile2 Quintile3 Quintile4 Quintile5
Source: Own calculations. Data from IES 2005/2006, Statistics South Africa, 2008. Considering the VAT paid on “other” fresh vegetables, the results in this case are contrary to the previous findings. Figure 7 indicates that the poorest households pay relatively less VAT on “other” fresh vegetables, in absolute terms. For example, households in quintile1 pay R1 million in VAT, while those in quintile5 who pay R41 million. This result is even more pronounced when analysing VAT paid on “other” fresh vegetables as a percentage of income, as shown in Figure 7. It is evident that the impact of VAT in this case is progressive, i.e. the average tax rate increases as income increases. This provides substantiation for an argument to remove zero-rating of VAT from selective “other” fresh vegetables, whilst at the same time maintaining the policy of zero-rating “basic” fresh vegetables. 3.4.4 Revenue implications of alternative targeting A rough estimate of the tax revenue implications of these proposals is given as follows: if the absolute amounts of VAT paid on “other” fresh vegetables are considered, households in quintile5 will pay around R41 million per annum (as opposed to only R1 million per annum by those in quintile1). In total, government revenue will increase by approximately R55 million. Removing VAT from canned vegetables will, however, result in a loss of tax revenue of R68 million in total (refer to Figure 4), which implies a loss of R13 million. It should be kept in mind though that the poorest quintile group will pay R7 million less VAT on canned vegetables if VAT is zero-rated, as compared to R26 million for the richest quintile group. Given the suggestions of zero-rating VAT on canned vegetables and taxing “other” fresh vegetables14, households in quintile1 will pay R6 million in terms of less VAT, whereas those in quintile5 will pay R15 million more.15
14 Refer to the last row of Figures 4 and 7 respectively. 15 These revenue estimates may be different depending on the price elasticities.
19
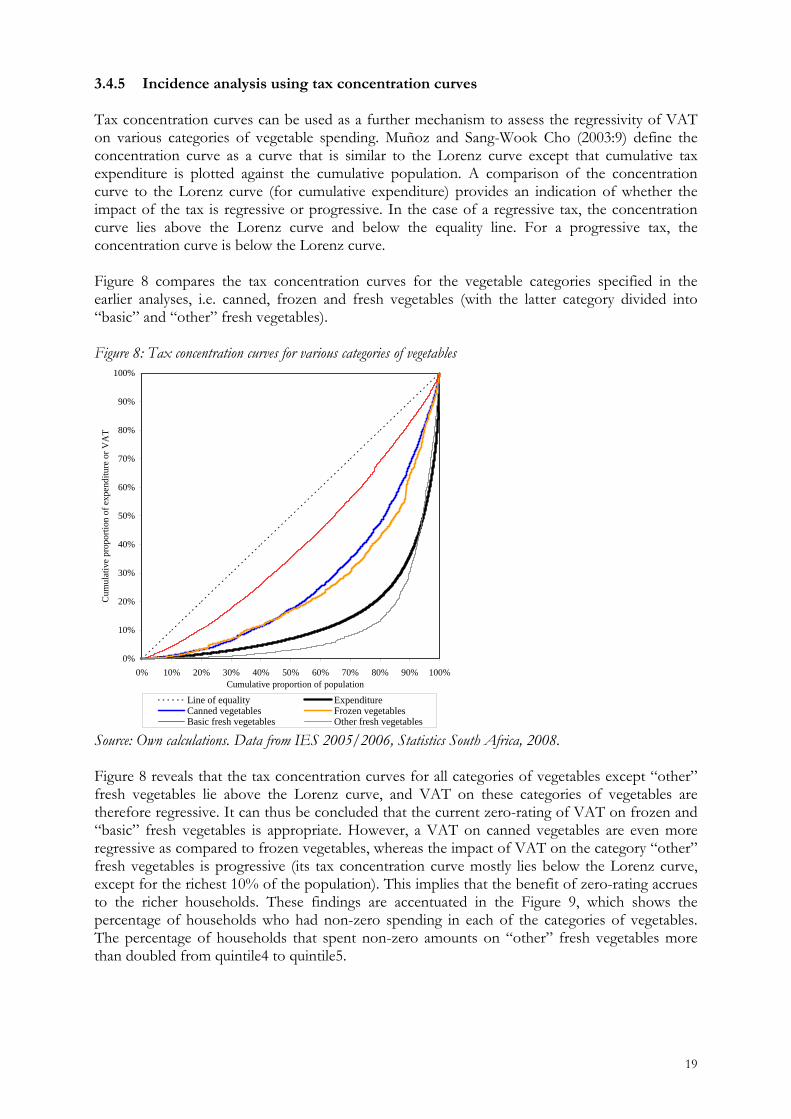
3.4.5 Incidence analysis using tax concentration curves Tax concentration curves can be used as a further mechanism to assess the regressivity of VAT on various categories of vegetable spending. Muñoz and Sang-Wook Cho (2003:9) define the concentration curve as a curve that is similar to the Lorenz curve except that cumulative tax expenditure is plotted against the cumulative population. A comparison of the concentration curve to the Lorenz curve (for cumulative expenditure) provides an indication of whether the impact of the tax is regressive or progressive. In the case of a regressive tax, the concentration curve lies above the Lorenz curve and below the equality line. For a progressive tax, the concentration curve is below the Lorenz curve. Figure 8 compares the tax concentration curves for the vegetable categories specified in the earlier analyses, i.e. canned, frozen and fresh vegetables (with the latter category divided into “basic” and “other” fresh vegetables). Figure 8: Tax concentration curves for various categories of vegetables
0%
10%
20%
30%
40%
50%
60%
70%
80%
90%
100%
0% 10% 20% 30% 40% 50% 60% 70% 80% 90% 100%Cumulative proportion of population
Cum
ulat
ive
prop
orti
on o
f ex
pend
itur
e or
VA
T
Line of equality ExpenditureCanned vegetables Frozen vegetablesBasic fresh vegetables Other fresh vegetables
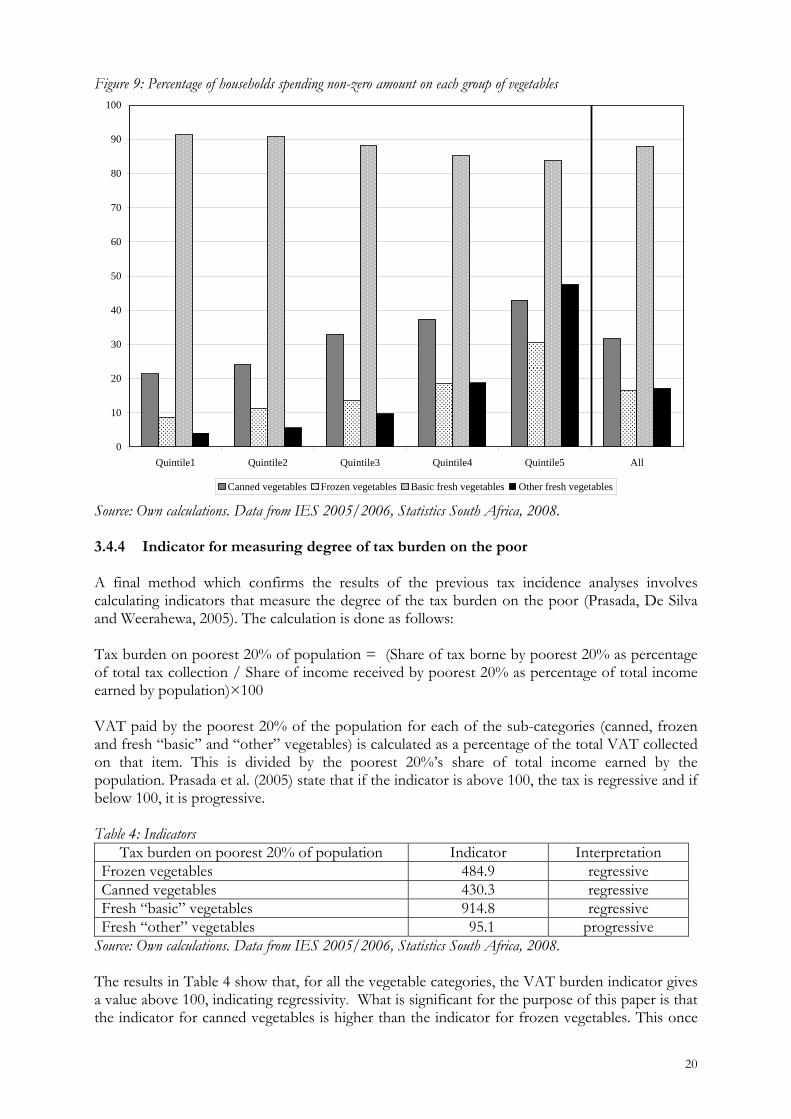
Source: Own calculations. Data from IES 2005/2006, Statistics South Africa, 2008. Figure 8 reveals that the tax concentration curves for all categories of vegetables except “other” fresh vegetables lie above the Lorenz curve, and VAT on these categories of vegetables are therefore regressive. It can thus be concluded that the current zero-rating of VAT on frozen and “basic” fresh vegetables is appropriate. However, a VAT on canned vegetables are even more regressive as compared to frozen vegetables, whereas the impact of VAT on the category “other” fresh vegetables is progressive (its tax concentration curve mostly lies below the Lorenz curve, except for the richest 10% of the population). This implies that the benefit of zero-rating accrues to the richer households. These findings are accentuated in the Figure 9, which shows the percentage of households who had non-zero spending in each of the categories of vegetables. The percentage of households that spent non-zero amounts on “other” fresh vegetables more than doubled from quintile4 to quintile5.
20
Figure 9: Percentage of households spending non-zero amount on each group of vegetables
0
10
20
30
40
50
60
70
80
90
100
Quintile1 Quintile2 Quintile3 Quintile4 Quintile5 All
Canned vegetables Frozen vegetables Basic fresh vegetables Other fresh vegetables
Source: Own calculations. Data from IES 2005/2006, Statistics South Africa, 2008. 3.4.4 Indicator for measuring degree of tax burden on the poor A final method which confirms the results of the previous tax incidence analyses involves calculating indicators that measure the degree of the tax burden on the poor (Prasada, De Silva and Weerahewa, 2005). The calculation is done as follows: Tax burden on poorest 20% of population = (Share of tax borne by poorest 20% as percentage of total tax collection / Share of income received by poorest 20% as percentage of total income earned by population)×100 VAT paid by the poorest 20% of the population for each of the sub-categories (canned, frozen and fresh “basic” and “other” vegetables) is calculated as a percentage of the total VAT collected on that item. This is divided by the poorest 20%’s share of total income earned by the population. Prasada et al. (2005) state that if the indicator is above 100, the tax is regressive and if below 100, it is progressive. Table 4: Indicators
Tax burden on poorest 20% of population Indicator Interpretation Frozen vegetables 484.9 regressive Canned vegetables 430.3 regressive Fresh “basic” vegetables 914.8 regressive Fresh “other” vegetables 095.1 progressive
Source: Own calculations. Data from IES 2005/2006, Statistics South Africa, 2008. The results in Table 4 show that, for all the vegetable categories, the VAT burden indicator gives a value above 100, indicating regressivity. What is significant for the purpose of this paper is that the indicator for canned vegetables is higher than the indicator for frozen vegetables. This once
21
again confirms previous findings that the impact of VAT on canned vegetables is more regressive than what it would be if the zero-rating were removed from frozen vegetables. This strengthens the case for the inclusion of canned vegetables and for the retention of frozen vegetables in the zero-rated basket of basic foodstuffs. A further argument in favour of this proposal emanates from Tait (1988:60). In his exposition on the difficulty of distinguishing between processed and unprocessed food, he argued that even though it seems desirable from an equity and nutritional standpoint to zero-rate fresh food, it is more than likely that canned and frozen food would be bought by working women and factory workers.16 Finally, the indicators for the sub-categories of fresh vegetables support earlier findings that the impact of VAT on “basic” fresh vegetables would be regressive, whereas on “other” fresh vegetables, it would be progressive. 4. CONCLUSIONS AND RECOMMENDATIONS The economic incidence of VAT in South Africa, as well as the specific commodities that should be included in a basket of zero-rated foodstuffs to improve the regressive impact of the tax on the poor, are issues that have been extensively researched over the years. Although it is true that richer households benefit more from zero-rating in absolute terms, it is the relative position of the poor that is of the essence. The main focus of this paper related to the question whether zero-rating in South Africa is appropriately targeted. It accepts that zero-rating is not an optimal solution to the equity concerns of the tax, but that it is here to stay as part of a second-best solution given the socio-political concerns and especially since the more direct social spending targets are not yet fully achieving the invisaged equity objectives. The study used the vegetable category as an example to illustrate that the targeting of zero-rated basic foodstuffs under VAT in South Africa could be improved. The study firstly analysed expenditure patterns of different income groups as well as the incidence of VAT on vegetables as specific food category in South Africa. The findings were that it is possible to divide a specific food category (such as fresh vegetables) into the sub-groups of “basic” versus “other”, and that the spending patterns on the basic category are distinctively different between rich and poor. This opens the door for a policy recommendation to levy the standard rate on “other” fresh vegetables and to keep the zero rating only on “basic” fresh vegetables. Some rough speculations on the tax revenue effects indicate a loss in revenue. However, in this case it is the poorest households that will benefit if these minor tax changes were to be implemented. It also found that the zero-rating of frozen vegetables was well targeted as frozen vegetables were consumed relatively more by poorer households. However, that the impact of VAT on canned vegetables was found to be more regressive than the possible impact should frozen vegetables be taxed. It is therefore recommended that canned vegetables should be included in the zero-rated basket of basic foodstuffs. It is an anomaly that canned vegetables are still not zero-rated, despite earlier requests and the fact that it is a product mostly consumed by relatively poorer households in the community. The findings of this study invite a more in-depth analysis of how appropriately zero-rating is applied to other food categories and suggest that such investigations must be done on a regular basis (as proposed by the Katz Commission (1994) and Cnossen (2003)), since even small changes to the tax treatment as proposed in this paper may affect the relative position of the poorest households in South Africa. A related matter that policymakers should consider (as mentioned by various studies) is whether the intended benefit from zero-rating is really
16 It should also be kept in mind that the South African tax authorities already apply zero-rating to canned fish (such as pilchards).
22
transferred to the end consumer and not absorbed earlier in the distribution chain. If the benefit does not reach the poorest households, zero-rating is an ineffective policy tool. REFERENCES ALDERMAN, H. and DEL NINNO, C. (1999). Poverty issues for Zero Rating Value Added Tax (VAT) in South Africa. South Africa: Poverty and Inequality: Informal Discussion Paper Series 19336. Washington: World Bank. BIRD, R. (2008). Tax challenges facing developing countries. Institute for International Business Working Paper no 12. Toronto: Rotman School of Management, University of Toronto. CALCATERRA, M. and KIRSTEN, J. (2003). An Economic Assessment of Zero Rating of VAT on Red Meat. Pretoria: University of Pretoria. CNOSSEN, S. (2003). The Incidence of Consumption in Member Countries of the South Africa Development Community. Paper prepared for the Southern African Conference on Excise Taxation, Centurion Lake Hotel, Gauteng, South Africa, 11-13 June 2003. COSATU. (1999). COSATU Submission on the Draft Revenue Laws Amendment Bill. Presented to the Portfolio Committees on Finance, 17 September 1999. [Online] Available: http://www.cosatu.org.za/show.php?ID=815 DELFIN, S., KEARNY, M., ROBINSON, S. and THIERFELDER, K. (2005). An Analysis of South Africa’s Value Added Tax. World Bank Policy Research Working Paper 3671. Washington: World Bank. ENSOR L. (2008). VAT relief for the poor considered. Business Day. 6 May 2008. [Online] Available: http://www.businessday.co.za/Articles/Content.aspx?id=47271 FOURIE, F. and OWEN, A. (1993). Value-added Tax and Regressivity in South Africa. South African Journal of Economics, 61(4), 308-319. JOHANNES, T., NJU, A. and THERESIA, A. (2006). The distribution of expenditure tax burden before and after tax reform: The case of Cameroon. AERC Research Paper 161. Nairobi: African Economic Research Consortium. KATZ COMMISSION. (1994). Interim Report of the Commission of Inquiry into certain aspects of the tax structure of South Africa. Pretoria: Government Printer. KHALILZADEH-SHIRAZI, J. and SHAH, A. (1991). Tax Policy in Developing Countries. A World Bank Symposium. Washington: World Bank. MUÑOZ, S. and SANG-WOOK CHO, S. (2003). Social Impact of a Tax Reform: The Case of Ethiopia. Working Paper WP/03/232. Washington: International Monetary Fund. [Online] Available: www.imf.org/external/pubs/ft/wp/2003/wp03232.pdf NATIONAL TREASURY and SOUTH AFRICAN REVENUE SERVICE (2010). 2010 Tax Statistics. [Online] Available: http://www.treasury.gov.za/publications/tax%20statistics/2010/2010%20Tax%20Statistics.pdf NICHOLSON, W. (1998). Microeconomic theory: basic principles and extensions. 7th edition. Chicago: The Dryden Press.
23
PRASADA, P., DE SILVA, R. and WEERAHEWA, J. (2005). An Analysis of Commodity Taxation on the Income Distribution in Sri Lanka. A paper presented during the 4th Poverty and Economic Policy (PEP) Research Network General Meeting, Colombo, Sri Lanka. REPUBLIC OF SOUTH AFRICA. (2001). National Budget Review 2001. Chapter 4: Revenue trends and tax proposals. Pretoria: National Treasury. [Online] Available: http://www.finance.gov.za/documents/national%20budget/2001/review/Chapter%204.pdf. REPUBLIC OF SOUTH AFRICA. (2008). Medium Term Budget Policy Statement 2008. Pretoria: National Treasury. [Online] Available: http://www.treasury.gov.za/documents/mtbps/2008/default.aspx ROSEN, H. and GAYER, T. (2008). Public Finance. 8th edition. New York: McGraw-Hill. SMIT, E. V. D. M. (1986). Die Belastinglas van Direkte en lndirekte Belastings op Huishoudings in die RSA: 'n Beraamde Verdeling tussen Inkomsteklasse en Rassegroepe. Unpublished research report for the Margo Commission and Central Economic Advisory Service. SOUTH AFRICAN RESERVE BANK (2012). Statement of the Monetary Policy Committee. [Online] Available: http://www.resbank.co.za/Lists/News%20and%20Publications/Attachments/4986/03Statement%20by%20the%20Governor%20-%2019%20January%202012.pdf STOLTZ. E. A. P. (1987). 'n Vergelykende studie tussen die algemene verkoopsbelasting (AVB) in die Suid-Afrikaanse belastingstelsel en 'n toegevoegdewaardebelasting (BTW). M. Verhandeling. Stellenbosch: Universiteit van Stellenbosch. STATISTICS SOUTH AFRICA. (2008). Income and Expenditure Survey 2005/2006. Pretoria: Statistics South Africa. TAIT, A. (1988). Value Added Tax. International Practice and Problems. Washington: International Monetary Fund. VAN DER BERG, S. (2009). Fiscal incidence of social spending in South Africa, 2006. Stellenbosch Economic Working Papers: 10/2009. Stellenbosch: Stellenbosch University. WATKINSON, E. and MAKGETLA, N. (2002). South Africa’s food security crisis. Paper for the National Labour and Economic Development Institute (NALEDI). [Online] Available: http://www.sarpn.org/documents/d0000077/P93_safscrisis.pdf
24
Table A.1: Classification of vegetable items Canned vegetables Frozen vegetables “Basic” fresh vegetables “Other” fresh vegetables Other vegetables
Canned corn kernels Cream style sweet corn Baked beans in tomato source Tinned peas Butter beans Canned green beans Other canned vegetables