Page 1
Improving Vehicle Trip Generation
Estimations for Urban Contexts
A Method Using Household Travel Surveys to Adjust
ITE’s Trip Generation Handbook Rates
Christopher D. Muhs, presenting on behalf of:
Kristina M. Currans & Dr. Kelly J. Clifton
Innovations in Travel Demand Modeling
April 29th, 2014
1
Page 2
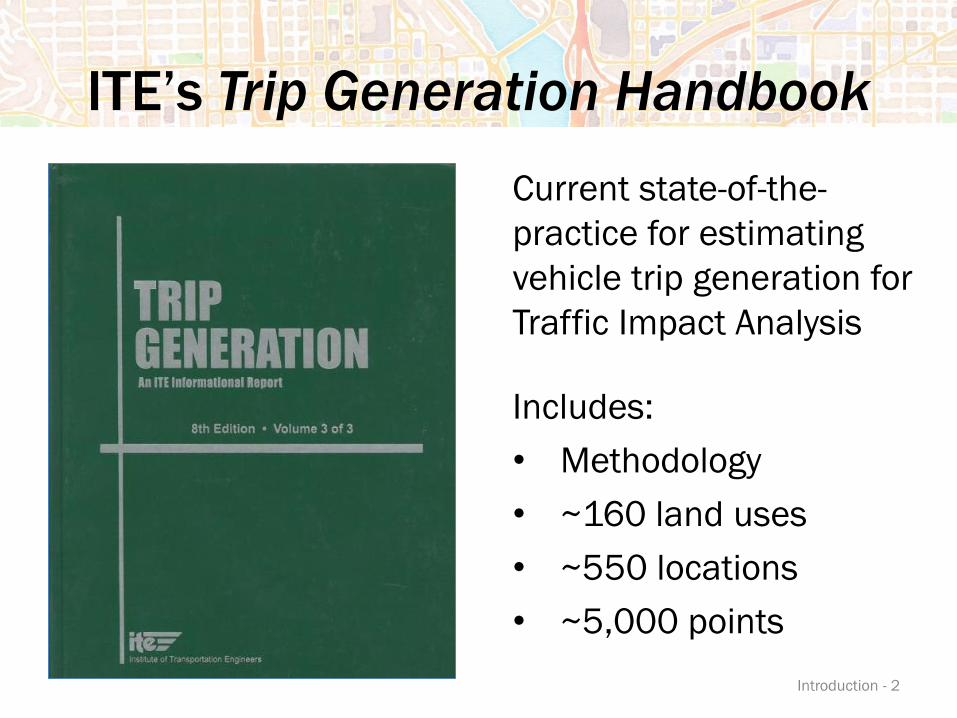
Current state-of-the-
practice for estimating
vehicle trip generation for
Traffic Impact Analysis
Includes:
• Methodology
• ~160 land uses
• ~550 locations
• ~5,000 points
Introduction - 2
ITE’s Trip Generation Handbook
Page 3
Introduction - 3
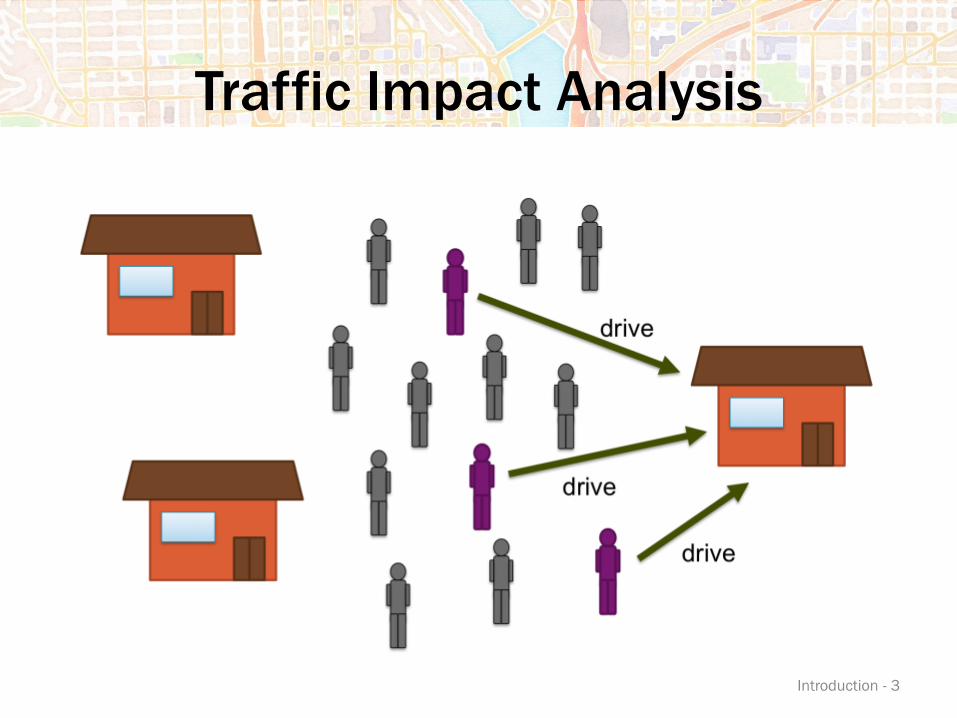
Traffic Impact Analysis
Page 4
4
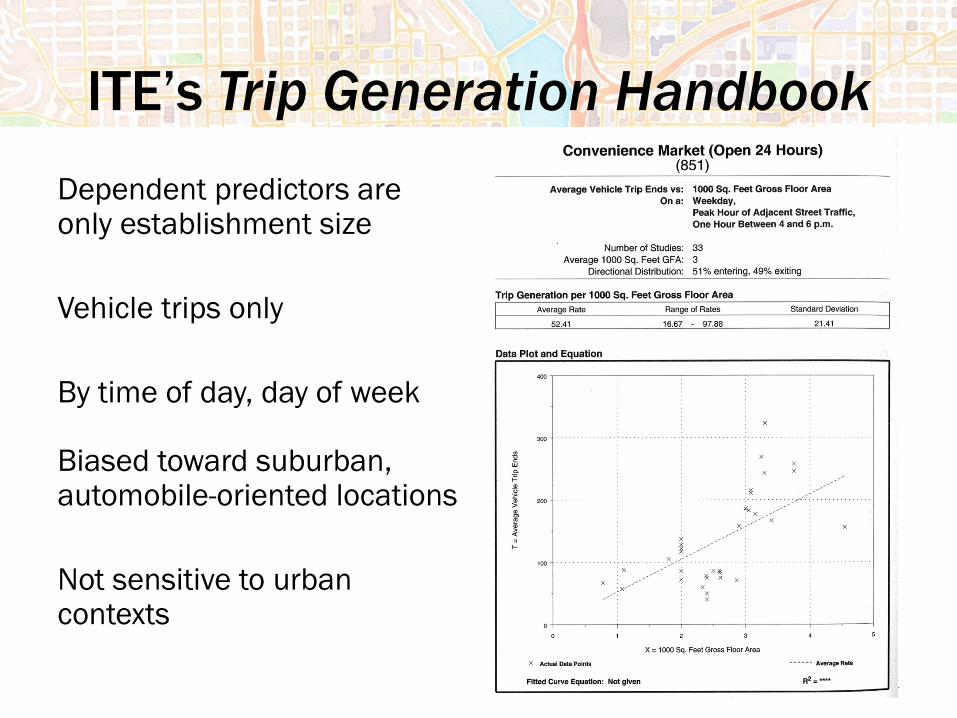
ITE’s Trip Generation Handbook
Dependent predictors are only establishment size
Vehicle trips only
By time of day, day of week
Biased toward suburban, automobile-oriented locations
Not sensitive to urban contexts
Page 5
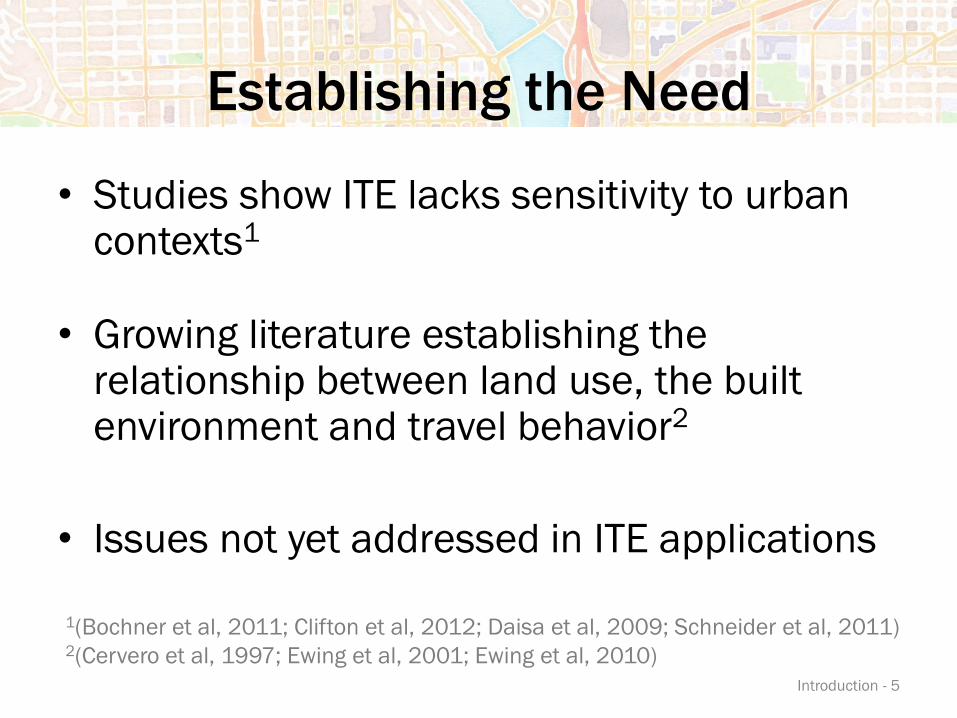
Establishing the Need
• Studies show ITE lacks sensitivity to urban contexts1
• Growing literature establishing the relationship between land use, the built environment and travel behavior2
• Issues not yet addressed in ITE applications
1(Bochner et al, 2011; Clifton et al, 2012; Daisa et al, 2009; Schneider et al, 2011) 2(Cervero et al, 1997; Ewing et al, 2001; Ewing et al, 2010)
Introduction - 5
Page 6
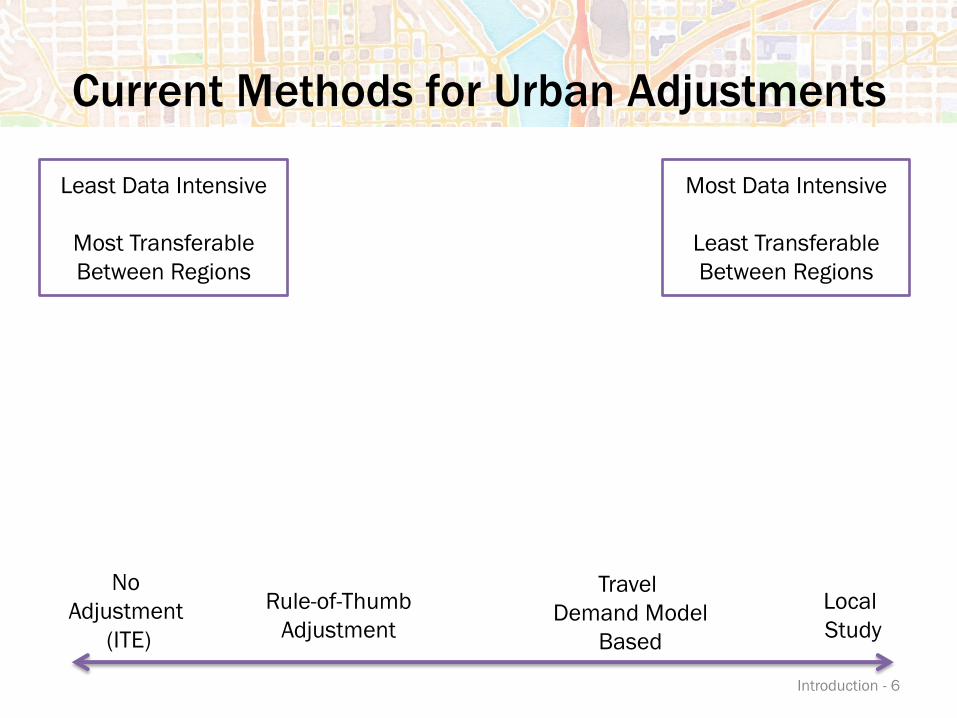
No
Adjustment
(ITE)
Local
Study
Travel
Demand Model
Based
Rule-of-Thumb
Adjustment
Least Data Intensive
Most Transferable
Between Regions
Most Data Intensive
Least Transferable
Between Regions
Introduction - 6
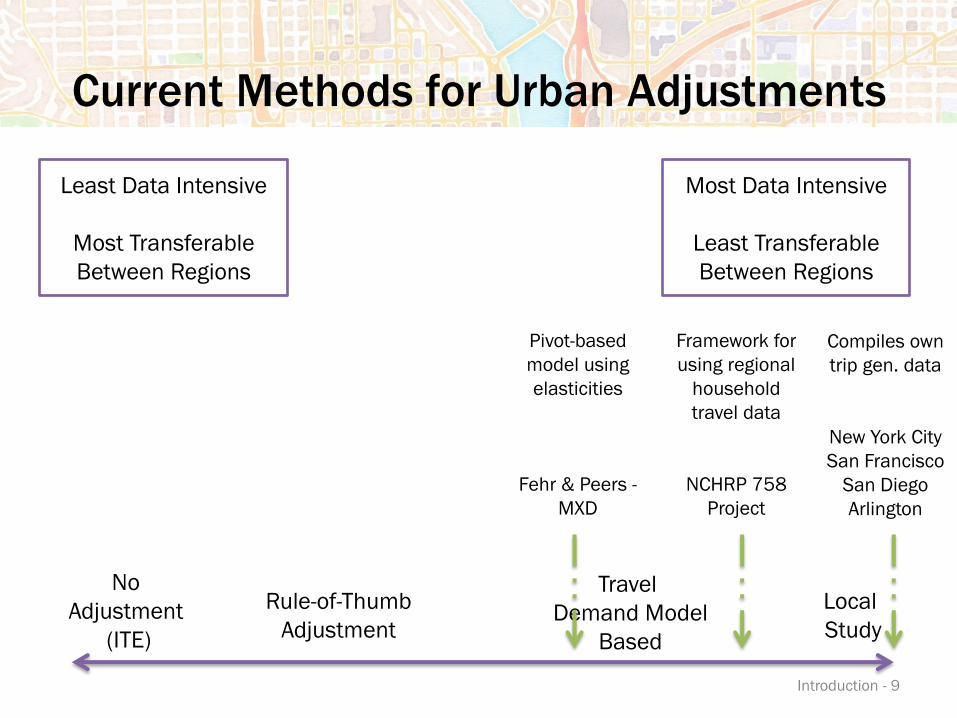
Current Methods for Urban Adjustments
Page 7
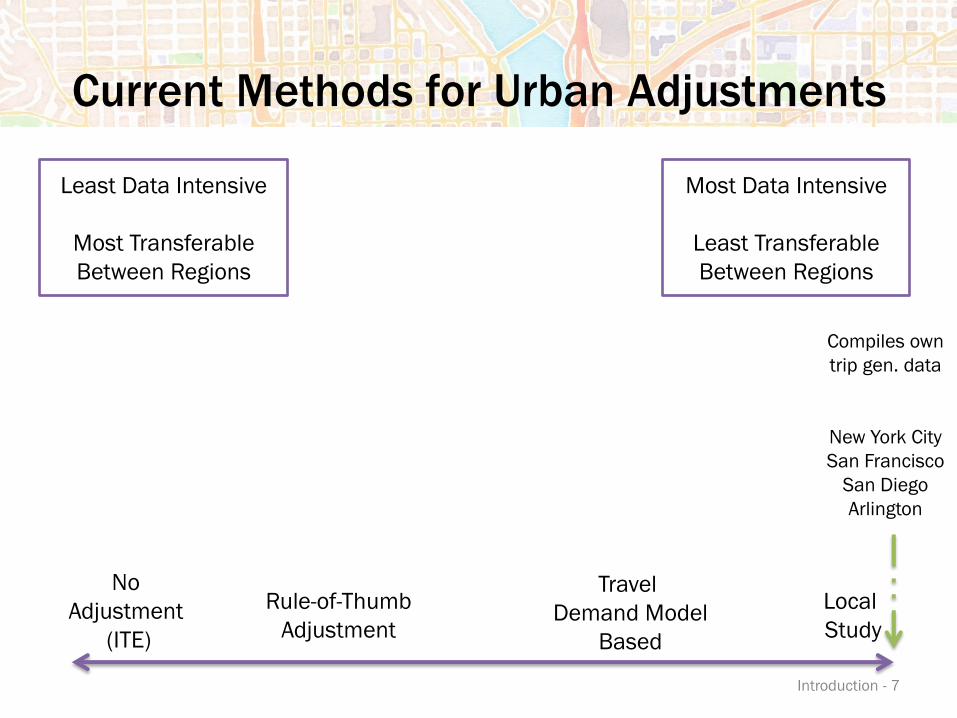
No
Adjustment
(ITE)
Local
Study
Rule-of-Thumb
Adjustment
Introduction - 7
Travel
Demand Model
Based
Compiles own
trip gen. data
New York City
San Francisco
San Diego
Arlington
Current Methods for Urban Adjustments
Least Data Intensive
Most Transferable
Between Regions
Most Data Intensive
Least Transferable
Between Regions
Page 8
No
Adjustment
(ITE)
Local
Study
Rule-of-Thumb
Adjustment
Introduction - 8
Travel
Demand Model
Based
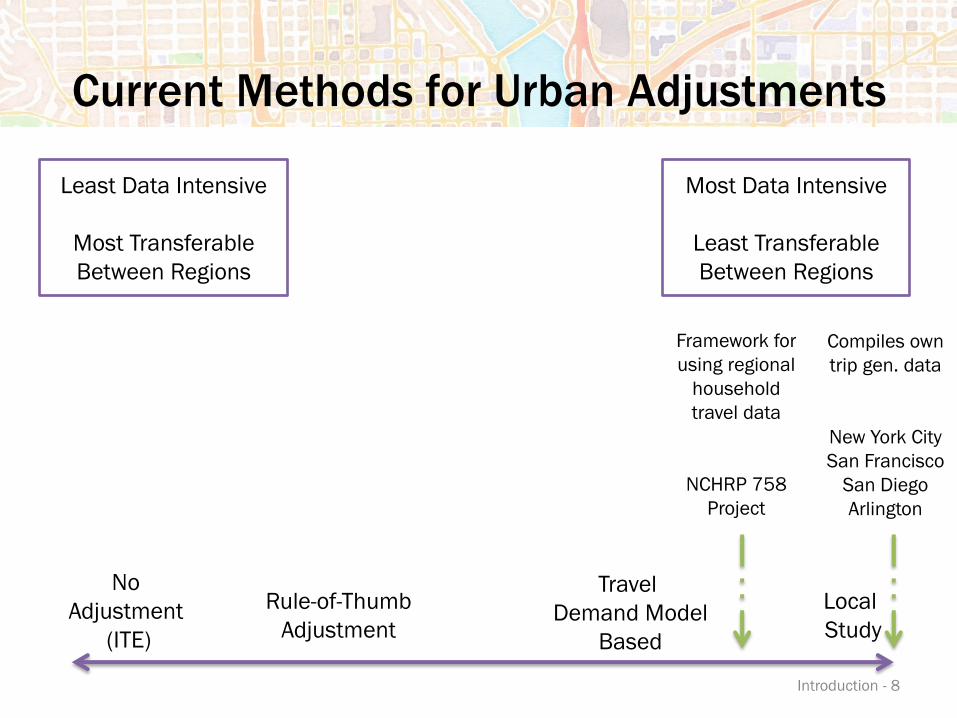
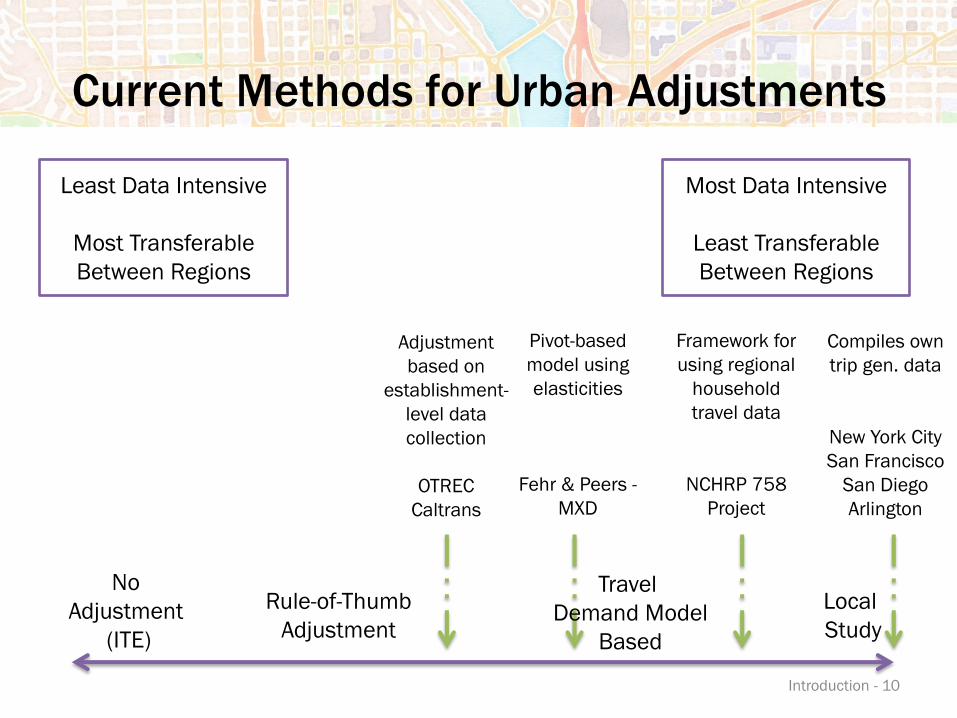
Current Methods for Urban Adjustments
Least Data Intensive
Most Transferable
Between Regions
Most Data Intensive
Least Transferable
Between Regions
Framework for
using regional
household
travel data
NCHRP 758
Project
Compiles own
trip gen. data
New York City
San Francisco
San Diego
Arlington
Page 9
No
Adjustment
(ITE)
Local
Study
Rule-of-Thumb
Adjustment
Introduction - 9
Travel
Demand Model
Based
Current Methods for Urban Adjustments
Pivot-based
model using
elasticities
Fehr & Peers -
MXD
Least Data Intensive
Most Transferable
Between Regions
Most Data Intensive
Least Transferable
Between Regions
Framework for
using regional
household
travel data
NCHRP 758
Project
Compiles own
trip gen. data
New York City
San Francisco
San Diego
Arlington
Page 10
No
Adjustment
(ITE)
Local
Study
Rule-of-Thumb
Adjustment
Adjustment
based on
establishment-
level data
collection
OTREC
Caltrans
Framework for
using regional
household
travel data
NCHRP 758
Project
Compiles own
trip gen. data
New York City
San Francisco
San Diego
Arlington
Introduction - 10
Travel
Demand Model
Based
Pivot-based
model using
elasticities
Fehr & Peers -
MXD
Current Methods for Urban Adjustments
Least Data Intensive
Most Transferable
Between Regions
Most Data Intensive
Least Transferable
Between Regions
Page 11
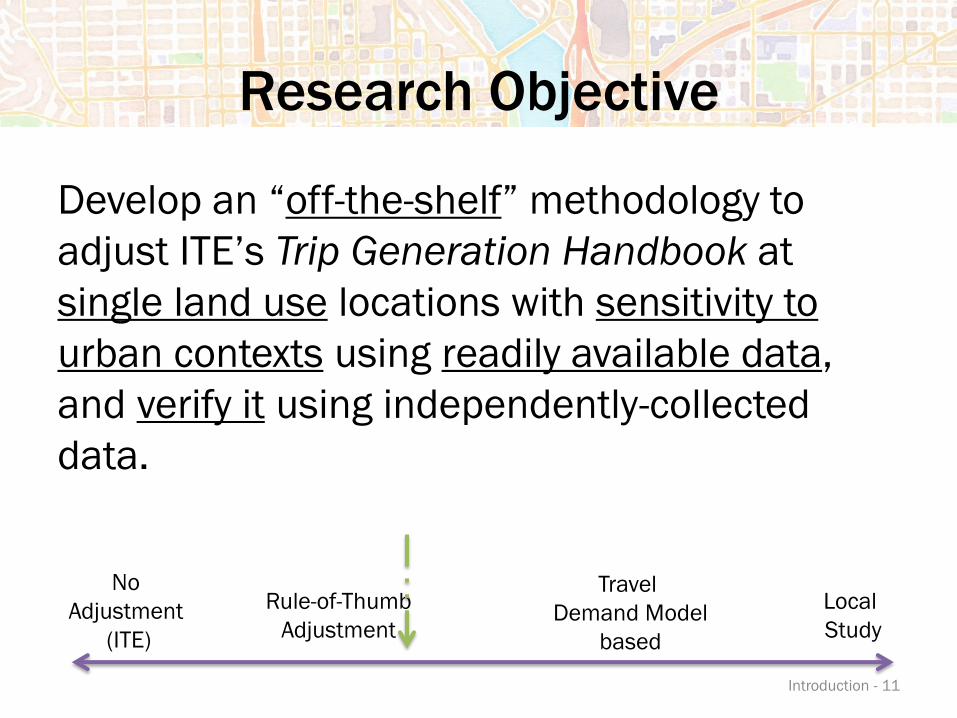
Research Objective
Develop an “off-the-shelf” methodology to
adjust ITE’s Trip Generation Handbook at
single land use locations with sensitivity to
urban contexts using readily available data,
and verify it using independently-collected
data.
No
Adjustment
(ITE)
Local
Study
Travel
Demand Model
based
Rule-of-Thumb
Adjustment
Introduction - 11
Page 12
METHODOLOGY
Methodology - 12
Page 13
Methodology - 13
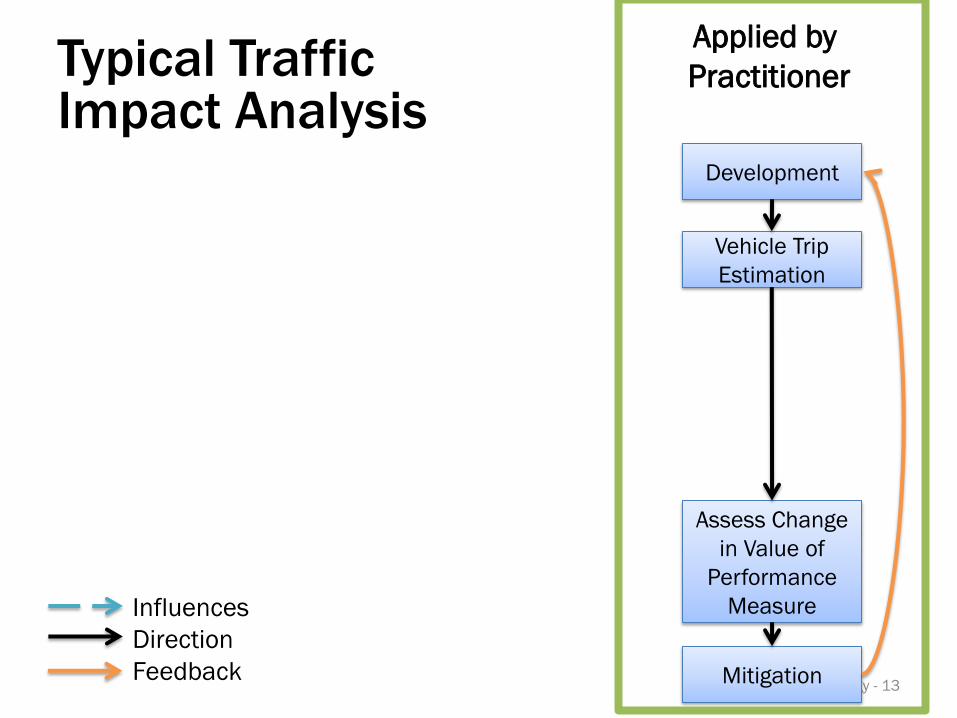
Development
Vehicle Trip
Estimation
Assess Change
in Value of
Performance
Measure
Mitigation
Influences
Direction
Feedback
Applied by
Practitioner Typical Traffic Impact Analysis
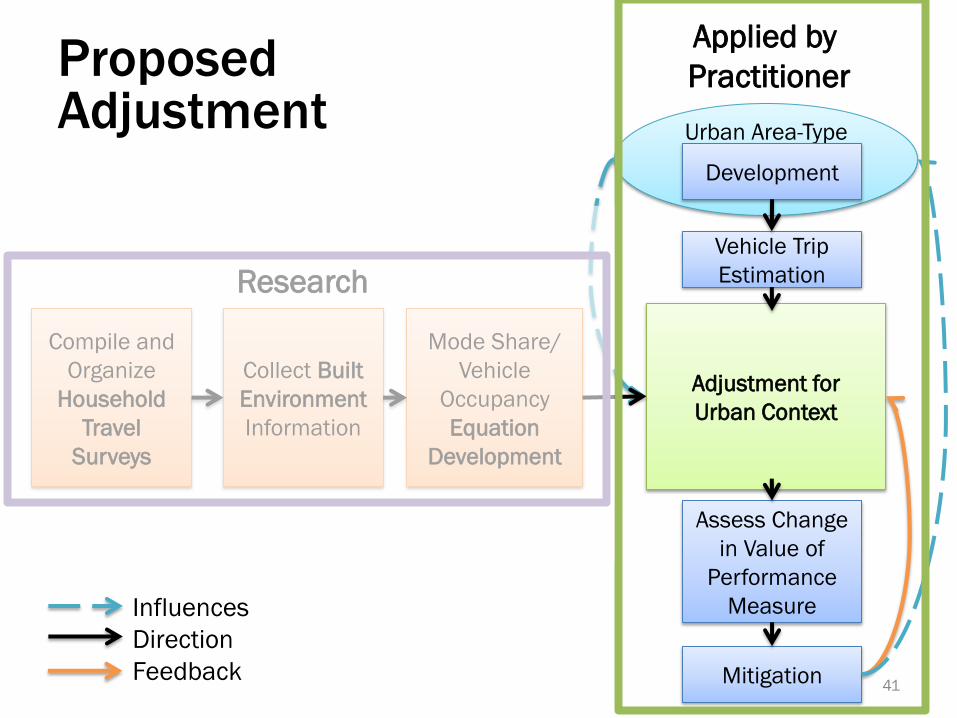
Page 14
Methodology - 14
Adjustment for
Urban Context
Urban Area-Type
Development
Vehicle Trip
Estimation
Assess Change
in Value of
Performance
Measure
Mitigation
Influences
Direction
Feedback
Applied by
Practitioner Proposed Adjustment
Page 15
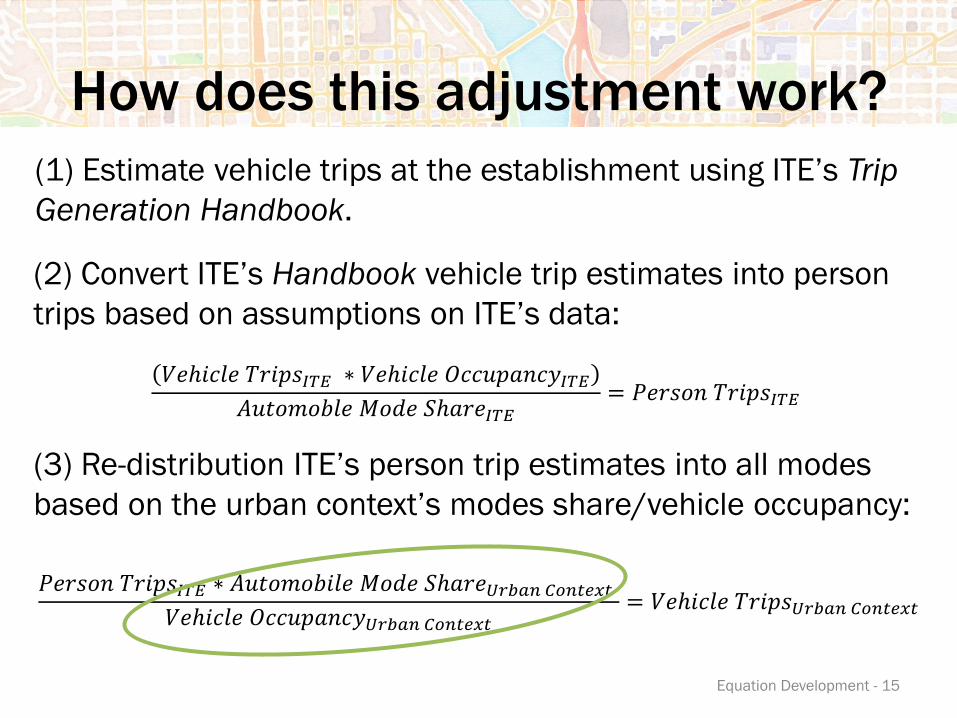
How does this adjustment work?
(2) Convert ITE’s Handbook vehicle trip estimates into person
trips based on assumptions on ITE’s data:
𝑉𝑒ℎ𝑖𝑐𝑙𝑒 𝑇𝑟𝑖𝑝𝑠𝐼𝑇𝐸 ∗ 𝑉𝑒ℎ𝑖𝑐𝑙𝑒 𝑂𝑐𝑐𝑢𝑝𝑎𝑛𝑐𝑦𝐼𝑇𝐸
𝐴𝑢𝑡𝑜𝑚𝑜𝑏𝑙𝑒 𝑀𝑜𝑑𝑒 𝑆ℎ𝑎𝑟𝑒𝐼𝑇𝐸= 𝑃𝑒𝑟𝑠𝑜𝑛 𝑇𝑟𝑖𝑝𝑠𝐼𝑇𝐸
(3) Re-distribution ITE’s person trip estimates into all modes
based on the urban context’s modes share/vehicle occupancy:
𝑃𝑒𝑟𝑠𝑜𝑛 𝑇𝑟𝑖𝑝𝑠𝐼𝑇𝐸 ∗ 𝐴𝑢𝑡𝑜𝑚𝑜𝑏𝑖𝑙𝑒 𝑀𝑜𝑑𝑒 𝑆ℎ𝑎𝑟𝑒𝑈𝑟𝑏𝑎𝑛 𝐶𝑜𝑛𝑡𝑒𝑥𝑡
𝑉𝑒ℎ𝑖𝑐𝑙𝑒 𝑂𝑐𝑐𝑢𝑝𝑎𝑛𝑐𝑦𝑈𝑟𝑏𝑎𝑛 𝐶𝑜𝑛𝑡𝑒𝑥𝑡= 𝑉𝑒ℎ𝑖𝑐𝑙𝑒 𝑇𝑟𝑖𝑝𝑠𝑈𝑟𝑏𝑎𝑛 𝐶𝑜𝑛𝑡𝑒𝑥𝑡
(1) Estimate vehicle trips at the establishment using ITE’s Trip
Generation Handbook.
Equation Development - 15
Page 16
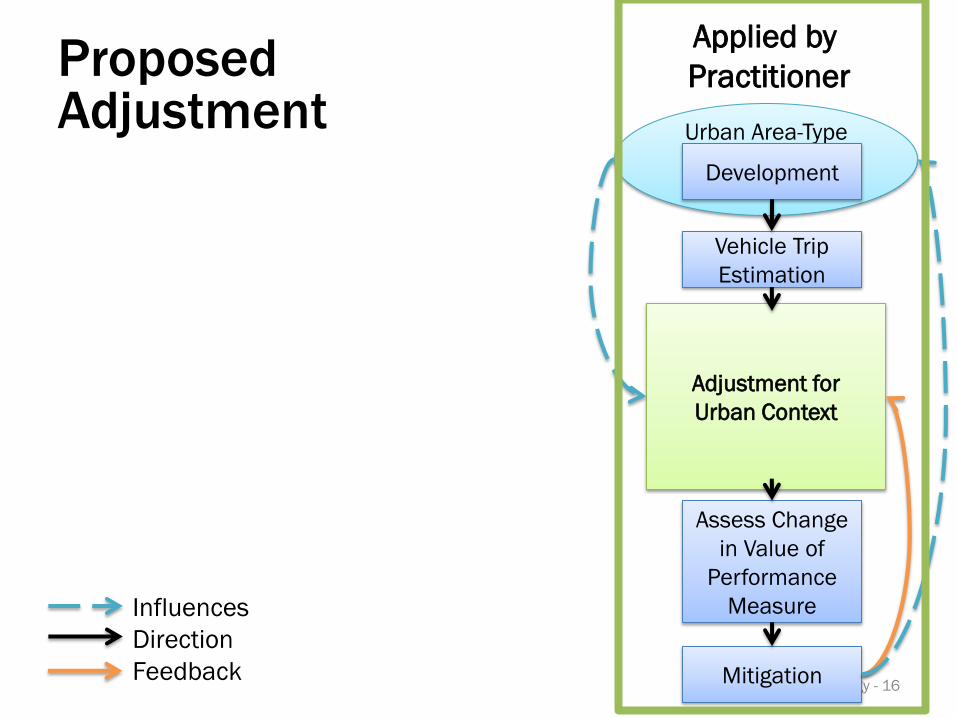
Methodology - 16
Adjustment for
Urban Context
Urban Area-Type
Development
Vehicle Trip
Estimation
Assess Change
in Value of
Performance
Measure
Mitigation
Influences
Direction
Feedback
Applied by
Practitioner Proposed Adjustment
Page 17
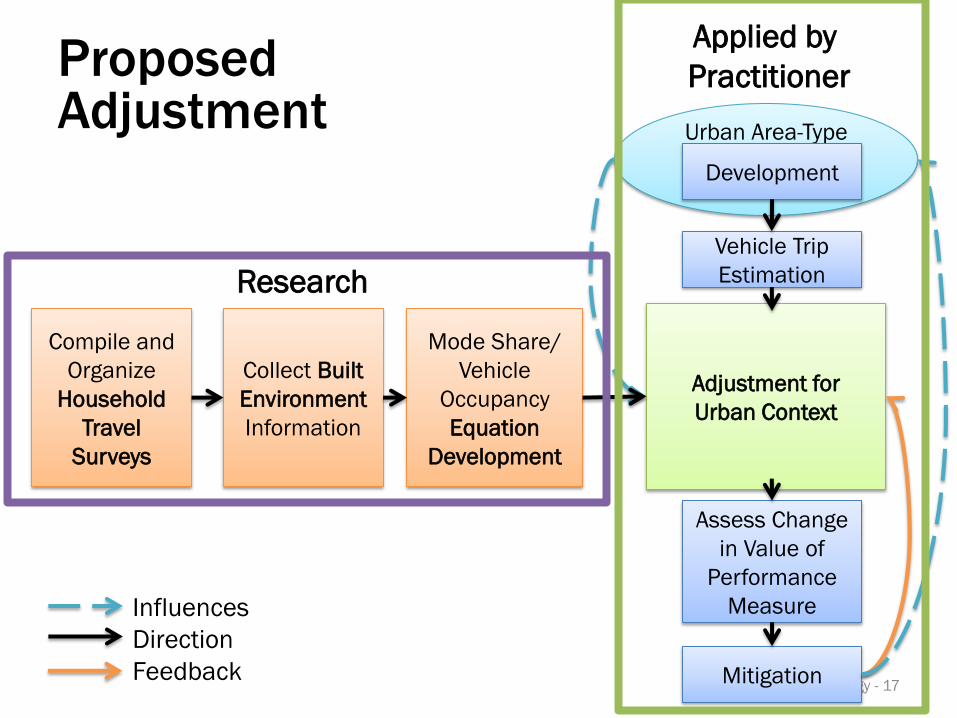
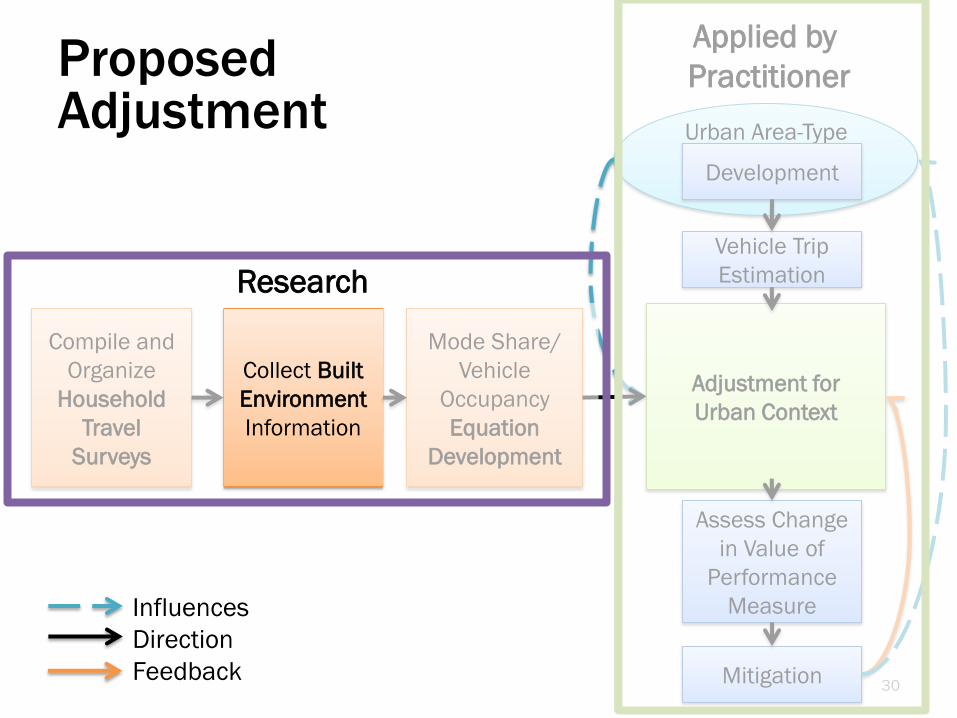
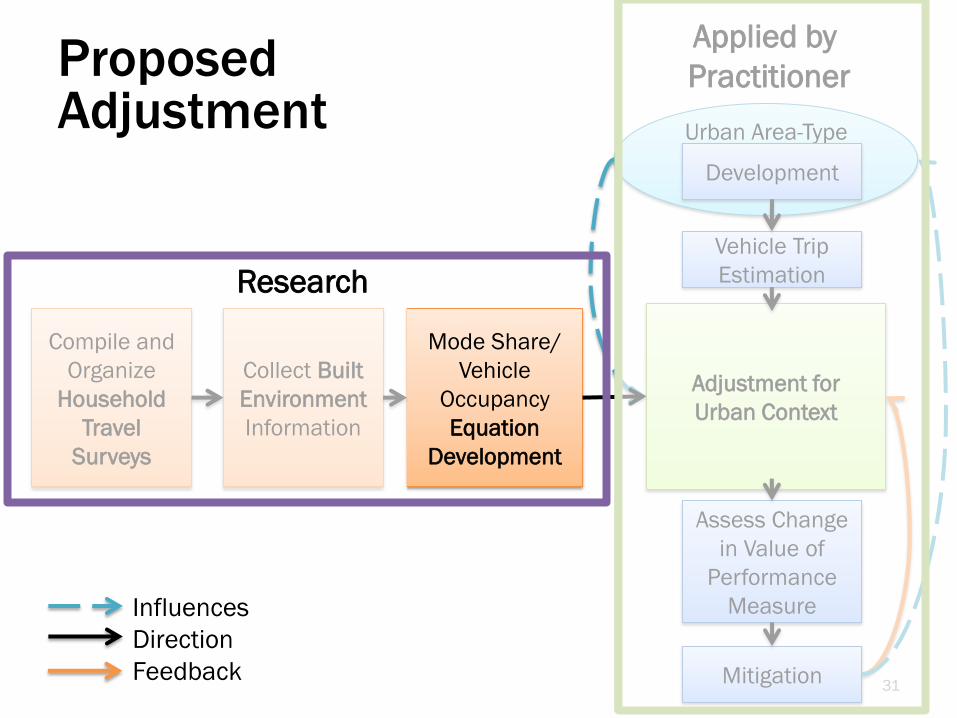
Methodology - 17
Adjustment for
Urban Context
Urban Area-Type
Development
Vehicle Trip
Estimation
Assess Change
in Value of
Performance
Measure
Mitigation
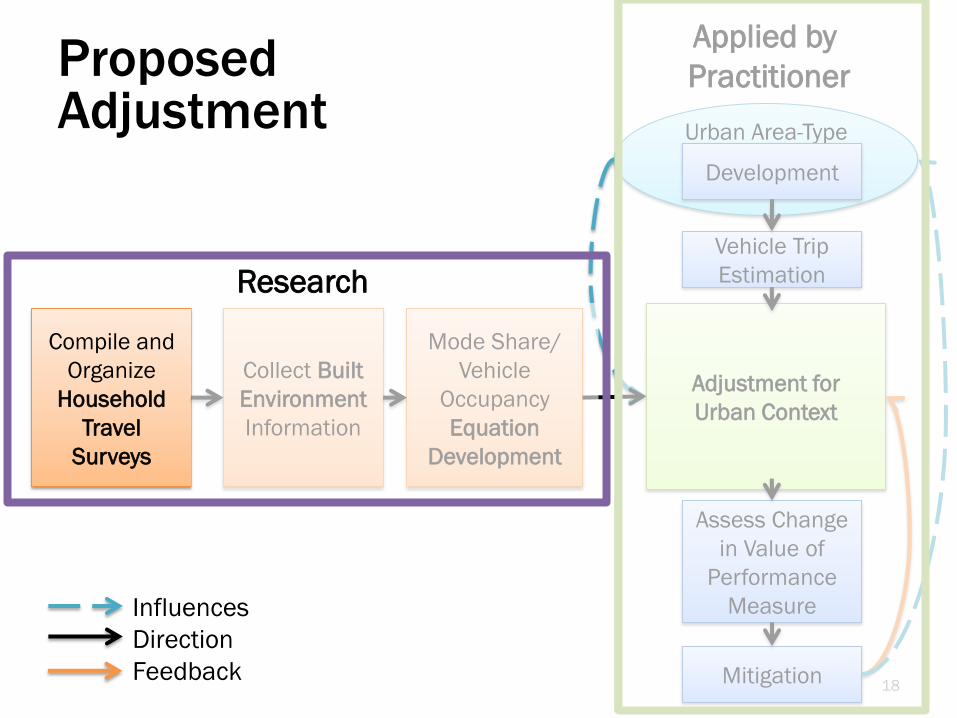
Compile and
Organize
Household
Travel
Surveys
Collect Built
Environment
Information
Mode Share/
Vehicle
Occupancy
Equation
Development
Influences
Direction
Feedback
Research
Applied by
Practitioner Proposed Adjustment
Page 18
18
Adjustment for
Urban Context
Urban Area-Type
Development
Vehicle Trip
Estimation
Assess Change
in Value of
Performance
Measure
Mitigation
Compile and
Organize
Household
Travel
Surveys
Collect Built
Environment
Information
Mode Share/
Vehicle
Occupancy
Equation
Development
Influences
Direction
Feedback
Research
Applied by
Practitioner Proposed Adjustment
Page 19
HOUSEHOLD TRAVEL SURVEYS
Data - 19
Page 20
Data - 20
Traffic Impact Analysis
Page 21
Data - 21
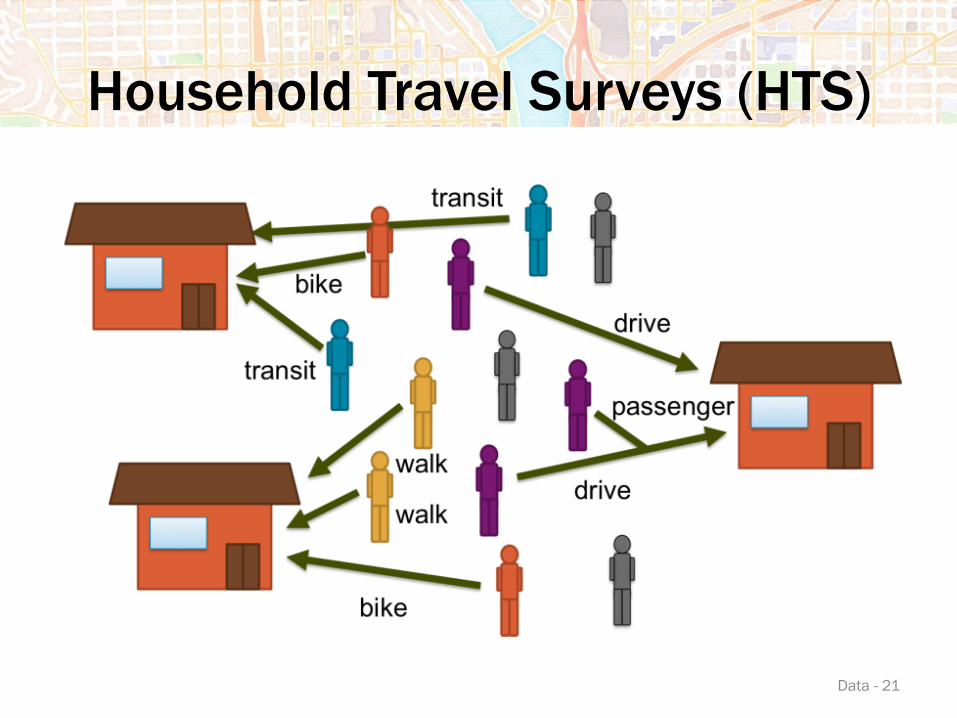
Household Travel Surveys (HTS)
Page 22
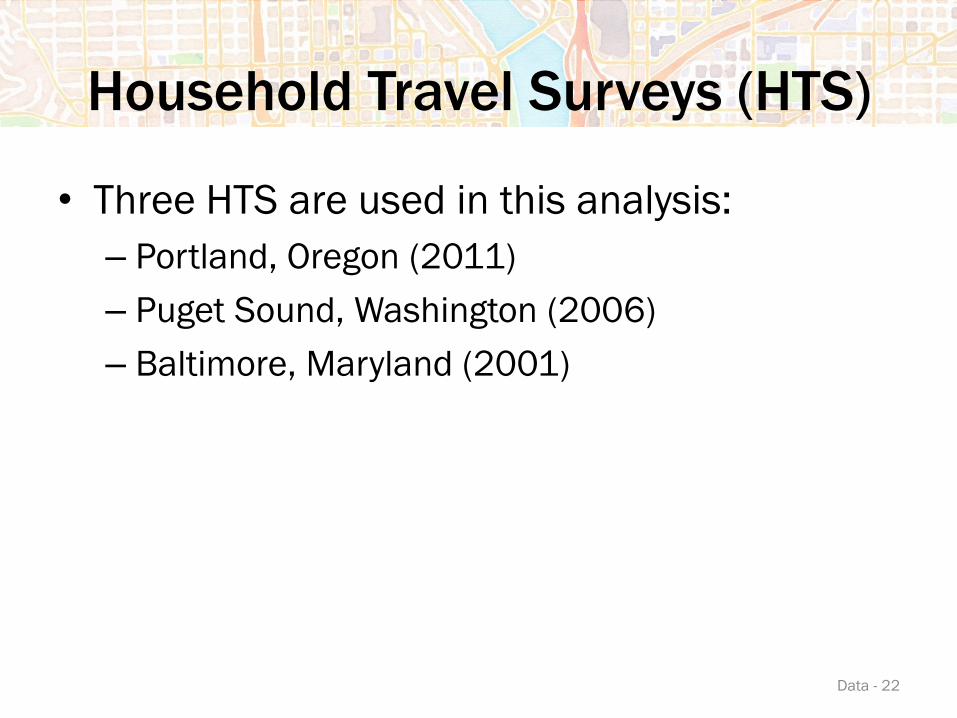
Household Travel Surveys (HTS)
• Three HTS are used in this analysis:
– Portland, Oregon (2011)
– Puget Sound, Washington (2006)
– Baltimore, Maryland (2001)
Data - 22
Page 23
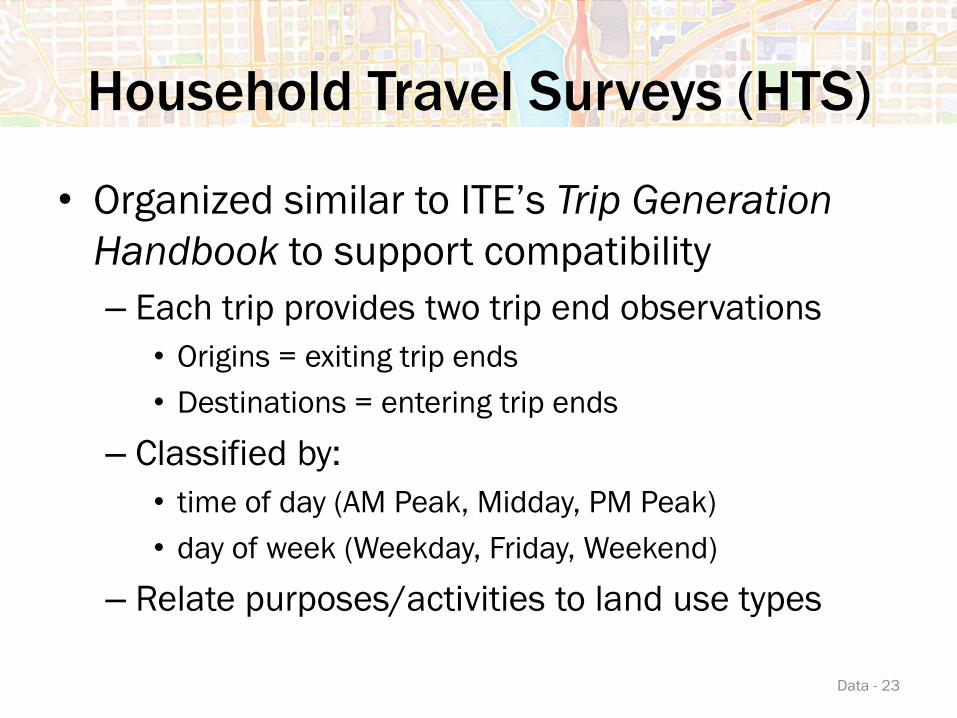
Household Travel Surveys (HTS)
• Organized similar to ITE’s Trip Generation
Handbook to support compatibility
– Each trip provides two trip end observations
• Origins = exiting trip ends
• Destinations = entering trip ends
– Classified by:
• time of day (AM Peak, Midday, PM Peak)
• day of week (Weekday, Friday, Weekend)
– Relate purposes/activities to land use types
Data - 23
Page 24
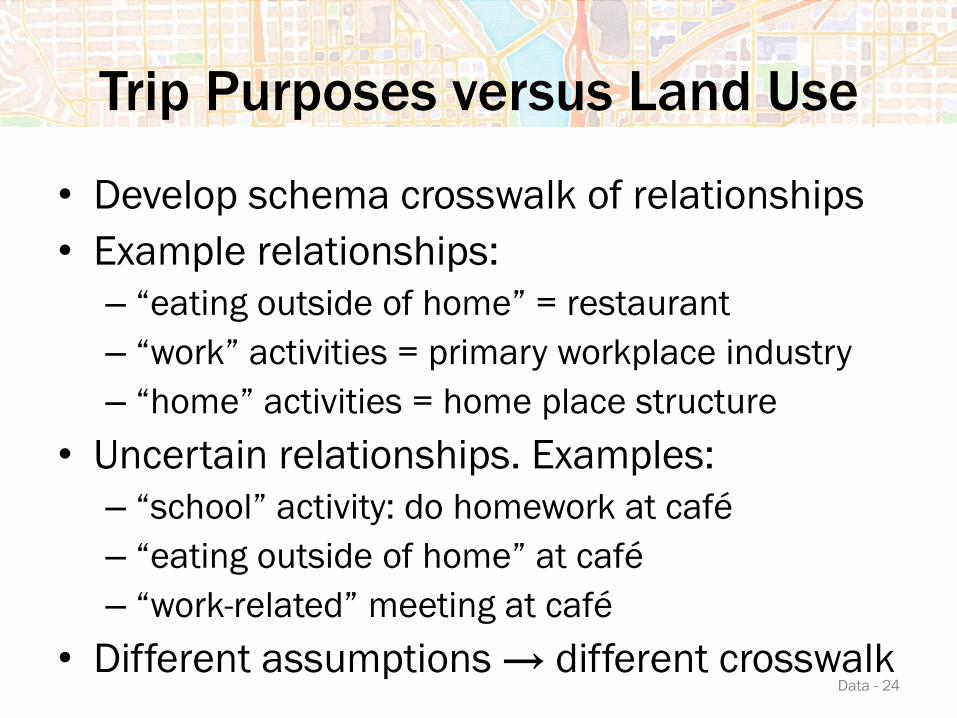
Trip Purposes versus Land Use
• Develop schema crosswalk of relationships
• Example relationships:
– “eating outside of home” = restaurant
– “work” activities = primary workplace industry
– “home” activities = home place structure
• Uncertain relationships. Examples:
– “school” activity: do homework at café
– “eating outside of home” at café
– “work-related” meeting at café
• Different assumptions → different crosswalk Data - 24
Page 25
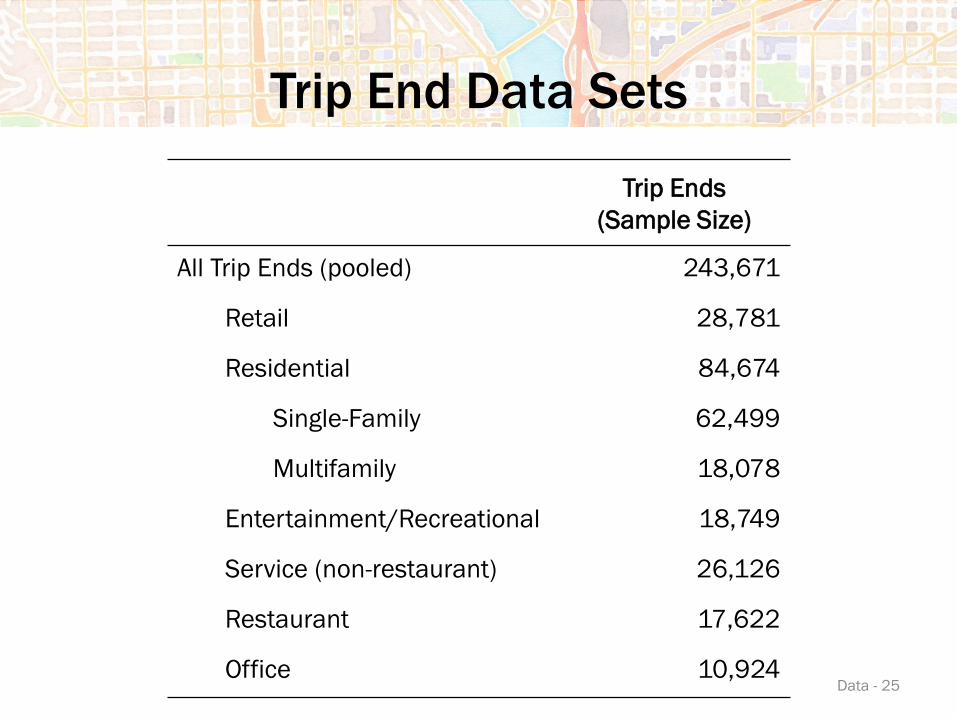
Trip End Data Sets
Trip Ends
(Sample Size)
All Trip Ends (pooled) 243,671
Retail 28,781
Residential 84,674
Single-Family 62,499
Multifamily 18,078
Entertainment/Recreational 18,749
Service (non-restaurant) 26,126
Restaurant 17,622
Office 10,924 Data - 25
Page 26
26
Adjustment for
Urban Context
Urban Area-Type
Development
Vehicle Trip
Estimation
Assess Change
in Value of
Performance
Measure
Mitigation
Compile and
Organize
Household
Travel
Surveys
Collect Built
Environment
Information
Mode Share/
Vehicle
Occupancy
Equation
Development
Influences
Direction
Feedback
Applied by
Practitioner Proposed Adjustment
Research
Page 27
27
Adjustment for
Urban Context
Urban Area-Type
Development
Vehicle Trip
Estimation
Assess Change
in Value of
Performance
Measure
Mitigation
Compile and
Organize
Household
Travel
Surveys
Collect Built
Environment
Information
Mode Share/
Vehicle
Occupancy
Equation
Development
Influences
Direction
Feedback
Applied by
Practitioner Proposed Adjustment
Research
Page 28
BUILT ENVIRONMENT
Data - 28
Page 29
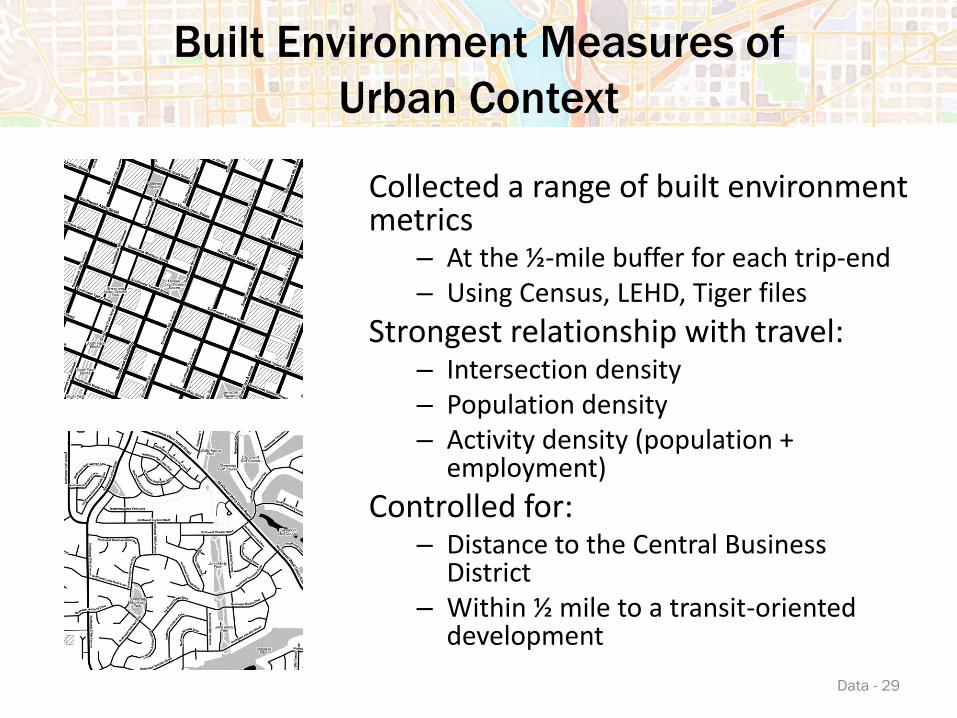
Built Environment Measures of
Urban Context
Collected a range of built environment metrics
– At the ½-mile buffer for each trip-end – Using Census, LEHD, Tiger files
Strongest relationship with travel: – Intersection density – Population density – Activity density (population +
employment)
Controlled for: – Distance to the Central Business
District – Within ½ mile to a transit-oriented
development
Data - 29
Page 30
30
Adjustment for
Urban Context
Urban Area-Type
Development
Vehicle Trip
Estimation
Assess Change
in Value of
Performance
Measure
Mitigation
Compile and
Organize
Household
Travel
Surveys
Collect Built
Environment
Information
Mode Share/
Vehicle
Occupancy
Equation
Development
Influences
Direction
Feedback
Applied by
Practitioner Proposed Adjustment
Research
Page 31
31
Adjustment for
Urban Context
Urban Area-Type
Development
Vehicle Trip
Estimation
Assess Change
in Value of
Performance
Measure
Mitigation
Compile and
Organize
Household
Travel
Surveys
Collect Built
Environment
Information
Mode Share/
Vehicle
Occupancy
Equation
Development
Influences
Direction
Feedback
Applied by
Practitioner Proposed Adjustment
Research
Page 32
ADJUSTMENT DEVELOPMENT
Equation Development - 32
Page 33
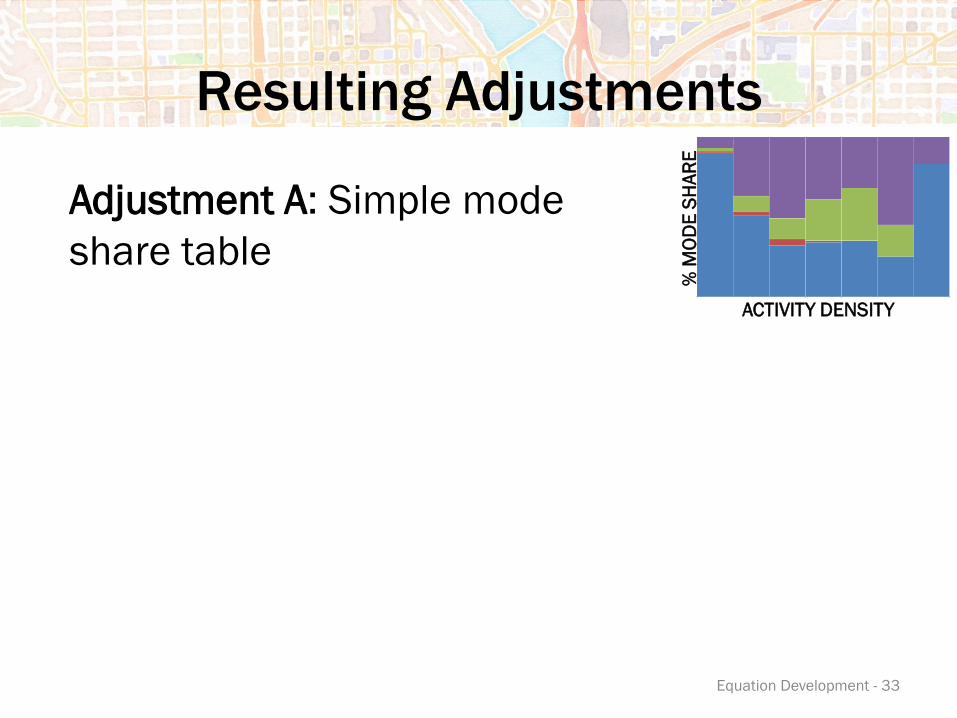
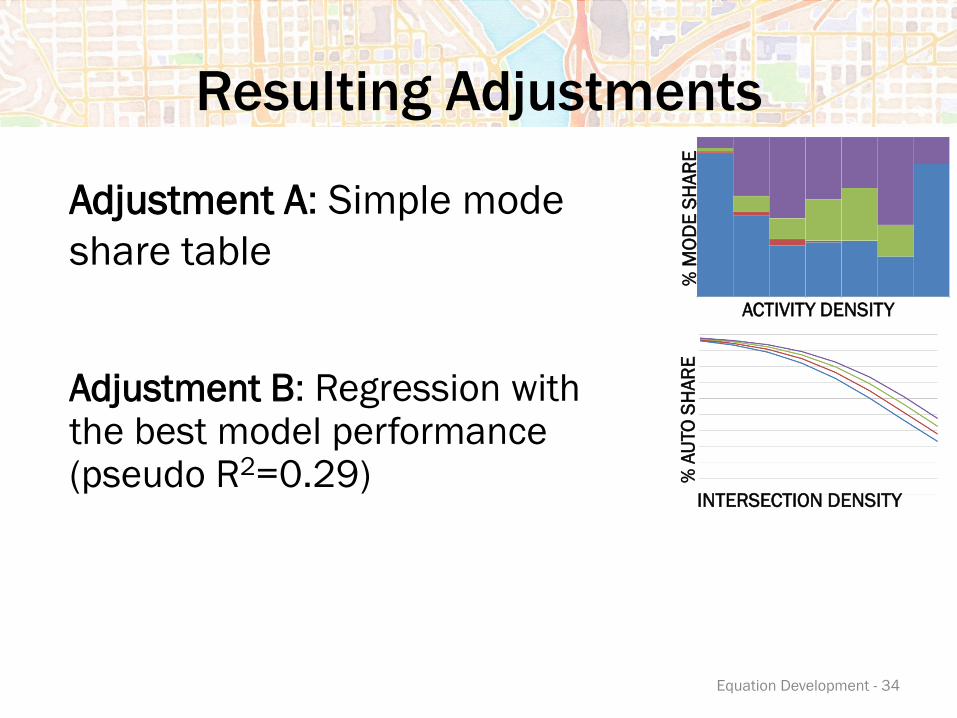
Resulting Adjustments
Adjustment A: Simple mode
share table
ACTIVITY DENSITY
% M
OD
E S
HA
RE
Equation Development - 33
Page 34
Resulting Adjustments
Adjustment A: Simple mode
share table
ACTIVITY DENSITY
% M
OD
E S
HA
RE
INTERSECTION DENSITY
% A
UTO
SH
AR
E
Equation Development - 34
Adjustment B: Regression with the best model performance (pseudo R2=0.29)
Page 35
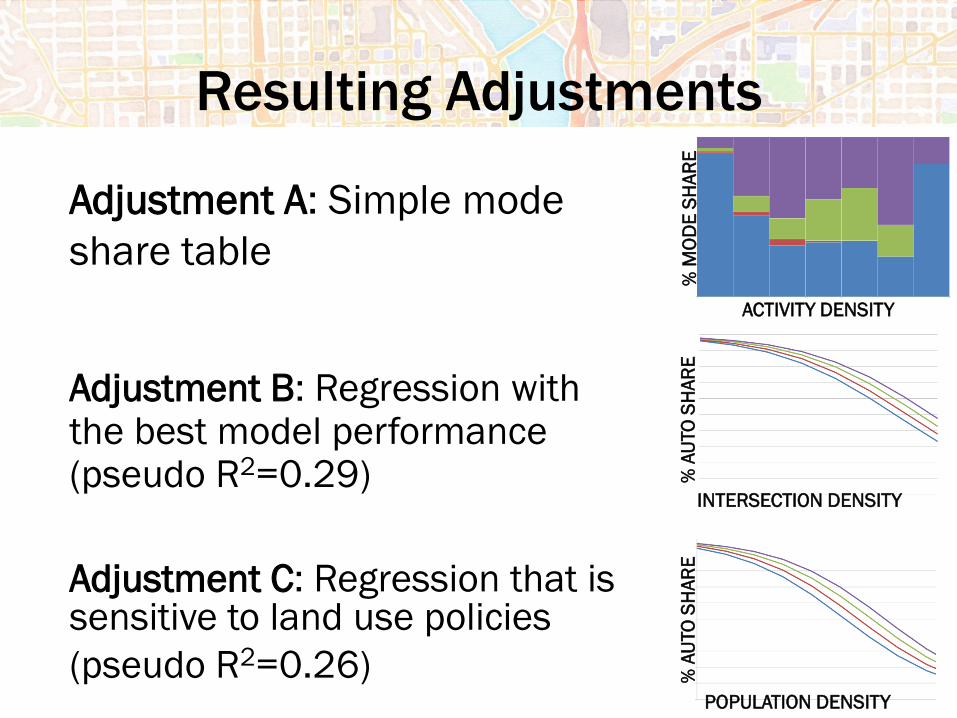
Resulting Adjustments
Adjustment A: Simple mode
share table
ACTIVITY DENSITY
% M
OD
E S
HA
RE
INTERSECTION DENSITY
% A
UTO
SH
AR
E
POPULATION DENSITY %
AU
TO
SH
AR
E
Adjustment C: Regression that is sensitive to land use policies
(pseudo R2=0.26)
Adjustment B: Regression with the best model performance (pseudo R2=0.29)
Page 36
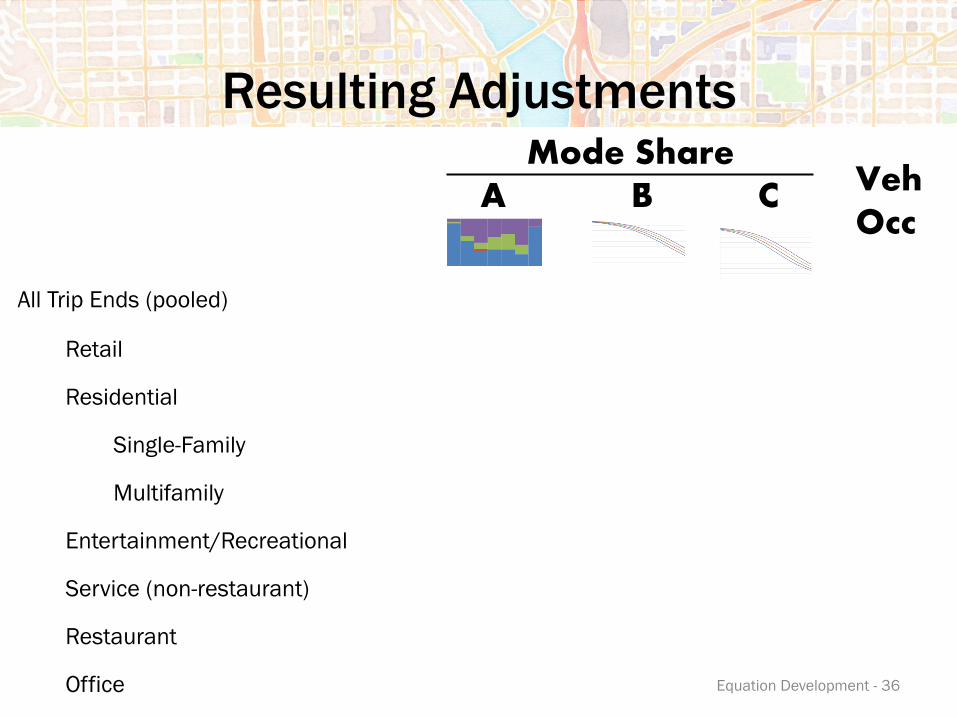
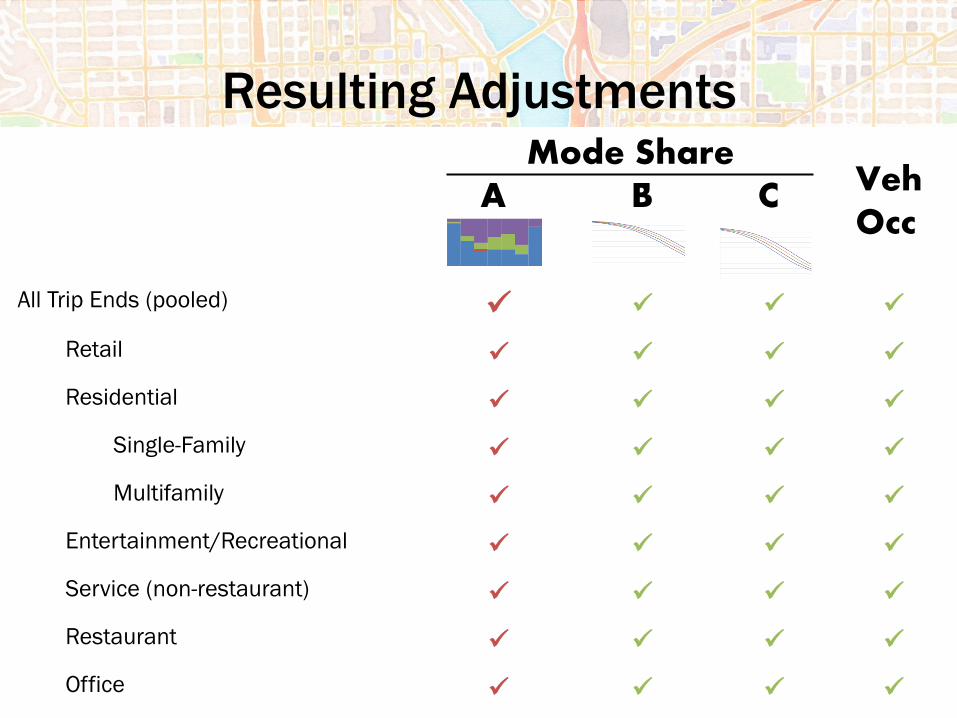
Resulting Adjustments
All Trip Ends (pooled)
Retail
Residential
Single-Family
Multifamily
Entertainment/Recreational
Service (non-restaurant)
Restaurant
Office
A B C Veh Occ
Mode Share
Equation Development - 36
Page 37
Resulting Adjustments
All Trip Ends (pooled)
Retail
Residential
Single-Family
Multifamily
Entertainment/Recreational
Service (non-restaurant)
Restaurant
Office
A B C Veh Occ
Mode Share
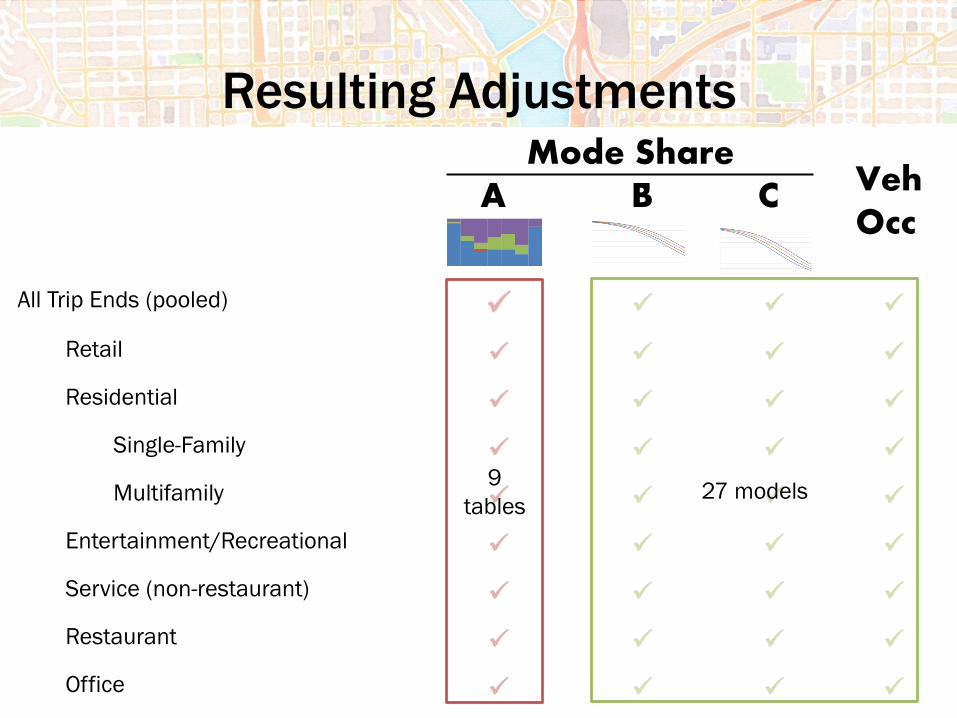
Page 38
Resulting Adjustments
All Trip Ends (pooled)
Retail
Residential
Single-Family
Multifamily
Entertainment/Recreational
Service (non-restaurant)
Restaurant
Office
A B C Veh Occ
Mode Share
9
tables 27 models
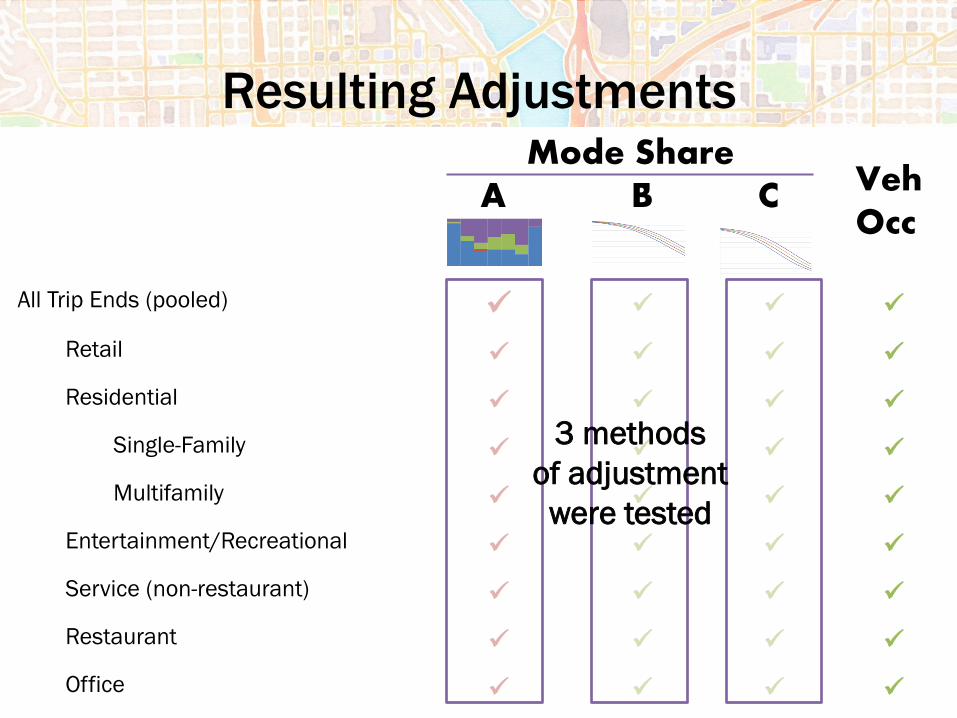
Page 39
Resulting Adjustments
All Trip Ends (pooled)
Retail
Residential
Single-Family
Multifamily
Entertainment/Recreational
Service (non-restaurant)
Restaurant
Office
A B C Veh Occ
Mode Share
3 methods
of adjustment
were tested
Page 40
40
Adjustment for
Urban Context
Urban Area-Type
Development
Vehicle Trip
Estimation
Assess Change
in Value of
Performance
Measure
Mitigation
Compile and
Organize
Household
Travel
Surveys
Collect Built
Environment
Information
Mode Share/
Vehicle
Occupancy
Equation
Development
Influences
Direction
Feedback
Applied by
Practitioner Proposed Adjustment
Research
Page 41
41
Adjustment for
Urban Context
Urban Area-Type
Development
Vehicle Trip
Estimation
Assess Change
in Value of
Performance
Measure
Mitigation
Compile and
Organize
Household
Travel
Surveys
Collect Built
Environment
Information
Mode Share/
Vehicle
Occupancy
Equation
Development
Influences
Direction
Feedback
Applied by
Practitioner Proposed Adjustment
Research
Page 42
VERIFICATION
Verification - 42
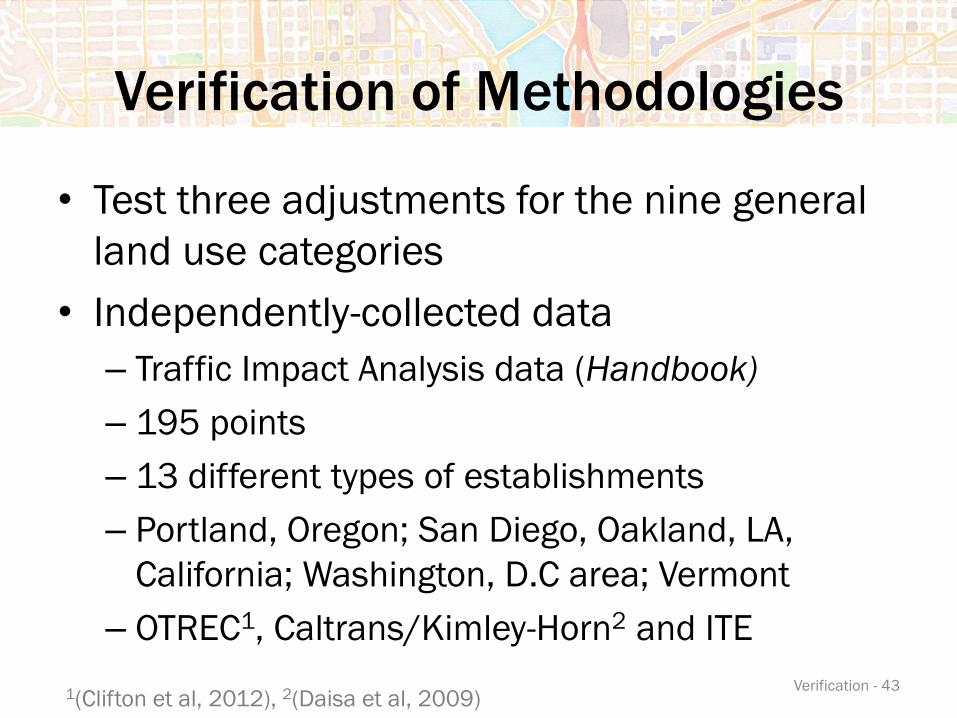
Page 43
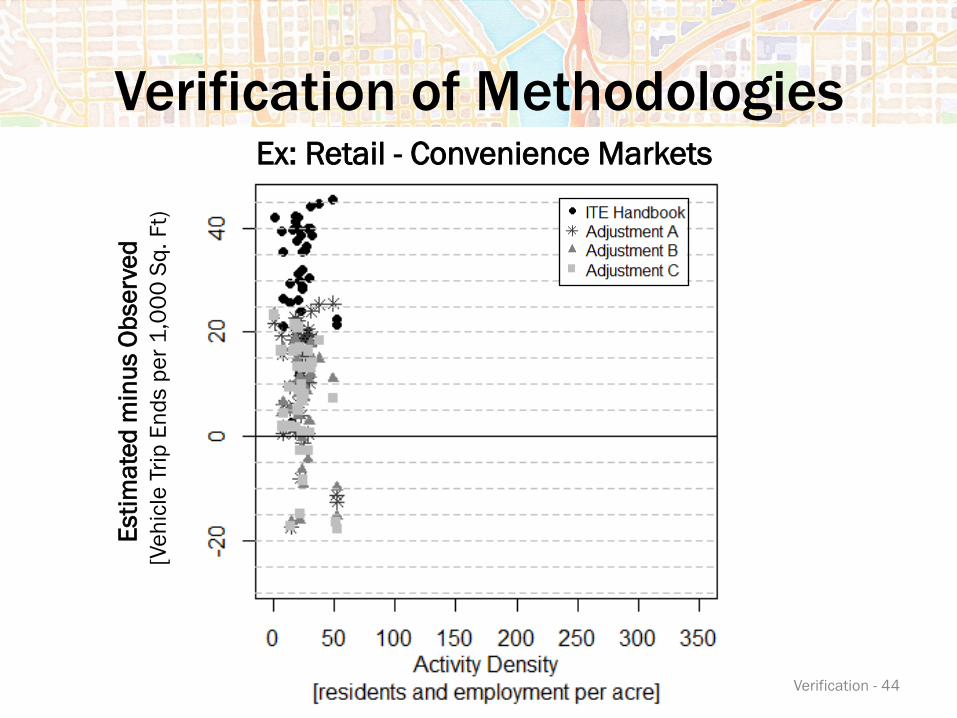
Verification of Methodologies
• Test three adjustments for the nine general
land use categories
• Independently-collected data
– Traffic Impact Analysis data (Handbook)
– 195 points
– 13 different types of establishments
– Portland, Oregon; San Diego, Oakland, LA,
California; Washington, D.C area; Vermont
– OTREC1, Caltrans/Kimley-Horn2 and ITE
1(Clifton et al, 2012), 2(Daisa et al, 2009) Verification - 43
Page 44
Verification of Methodologies
Verification - 44
Ex: Retail - Convenience Markets E
sti
ma
ted
min
us O
bse
rve
d
[Ve
hic
le T
rip
En
ds p
er
1,0
00
Sq
. F
t)
Page 45
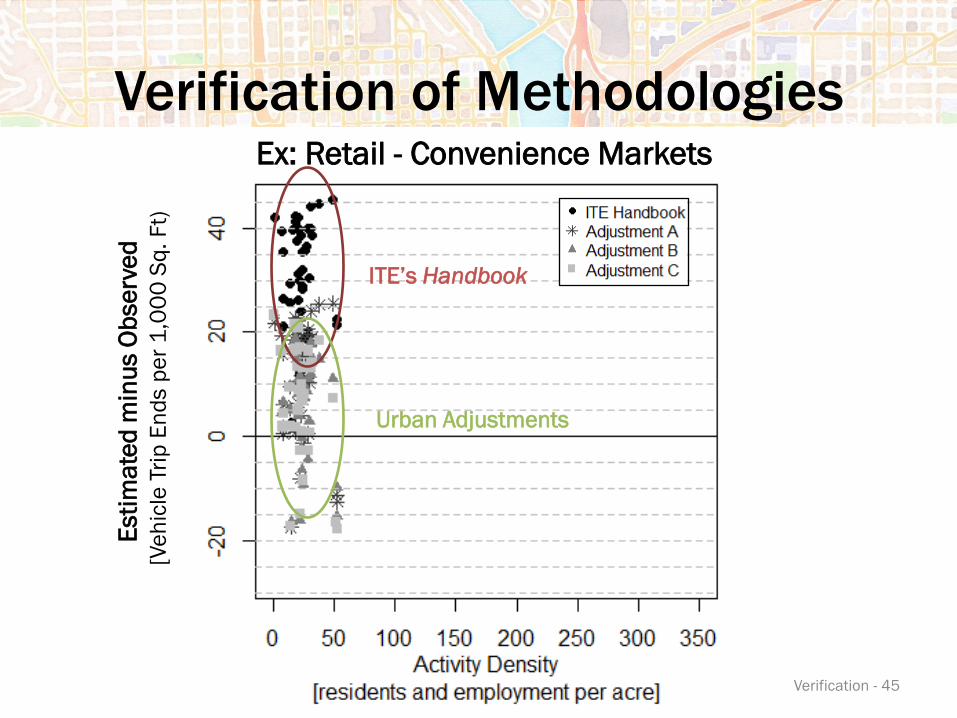
Verification of Methodologies
Verification - 45
Ex: Retail - Convenience Markets E
sti
ma
ted
min
us O
bse
rve
d
[Ve
hic
le T
rip
En
ds p
er
1,0
00
Sq
. F
t)
ITE’s Handbook
Urban Adjustments
Page 46
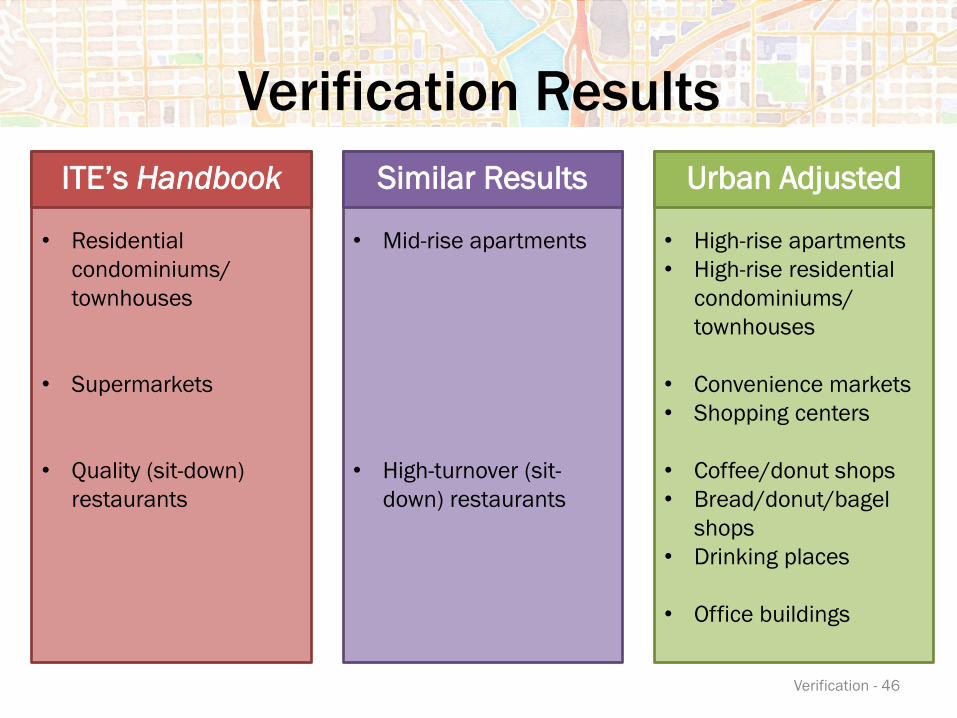
Verification Results
Verification - 46
ITE’s Handbook
• Residential
condominiums/
townhouses
• Supermarkets
• Quality (sit-down)
restaurants
Urban Adjusted
• High-rise apartments
• High-rise residential
condominiums/
townhouses
• Convenience markets
• Shopping centers
• Coffee/donut shops
• Bread/donut/bagel
shops
• Drinking places
• Office buildings
Similar Results
• Mid-rise apartments
• High-turnover (sit-
down) restaurants
ITE’s Handbook Similar Results Urban Adjusted
Page 47
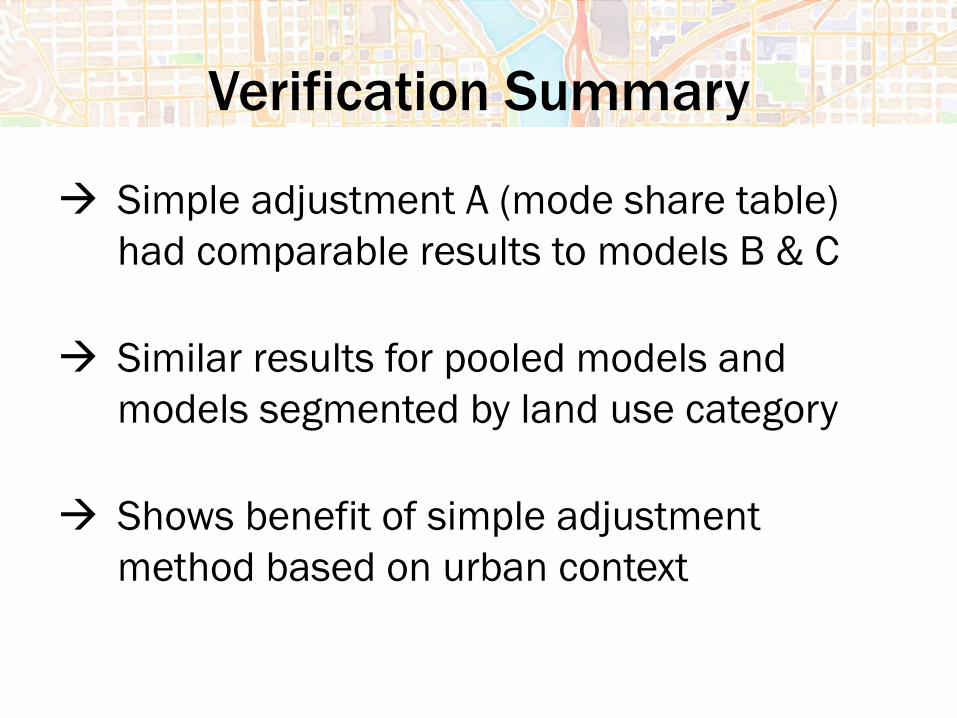
Verification Summary
Simple adjustment A (mode share table)
had comparable results to models B & C
Similar results for pooled models and
models segmented by land use category
Shows benefit of simple adjustment
method based on urban context
Page 48
CONCLUSIONS
Conclusions - 48
Page 49
Discussion and Implications
• Objective was achieved
– an “off-the-shelf” adjustment method was developed that is sensitive to urban contexts, applicable nationally and ready to apply
• Results punctuate the need for considering the urban environment in evaluating the traffic impacts of new development
• Short term: Simple adjustments may benefit estimations as much as complex ones
Conclusions - 49
Page 50
Discussion and Implications
• Application of an HTS urban context adjustment is a band-aid for the traffic impact estimation
• If ITE’s Handbook should remain relevant to wide-spread application, this adjustment is not going to be sufficient in the long run
• More detailed requirements for ITE or Traffic Impact Analysis data collections – Captures urban context
– Person trips, mode share distribution, vehicle occupancy
– Location information
Conclusions - 50
Page 51
Acknowledgements
Data:
• Institute of Transportation Engineers
• Kimley-Horn/Caltrans
• OTREC
• Oregon Department of Transportation
• Puget Sound Regional Council
• National Household Travel Survey – Baltimore Add-on
Funding:
• Dwight David Eisenhower Graduate Fellowship
Support:
• Kelly J. Clifton (Adviser)
• Chris Monsere
• Roger Chen
• Robert Schneider, U of Wisc.
• Brian Bochner, TTI
• Jina Mahmoudi & Kevin Hooper, ITE
51
Page 52
Questions?
Kristina M Currans
Civil Engineering
Portland State University
[email protected]
Currans, Kristina M.; Clifton, Kelly J. Improving Vehicle Trip Generation Estimations for Urban Contexts: A Method Using Household Travel Surveys to Adjust ITE Trip Generation Rates.
Masters thesis, 2014. Available at: http://pdxscholar.library.pdx.edu/open_access_etds/987/
52
Page 53
Bibliography
Bochner, B. S., Hooper, K., Sperry, B., & Dunphy, R. (2011). NCHRP Report 684: Enhancing Internal Trip Capture Estimation for Mixed-Use Developments. Washington, D.C.: Transportation Research Board.
Cervero, R., & Kockelman, K. (1997). Travel Demand and the 3Ds: Density, Diversity, and Design. Transportation Research: D, 2(3), 199-219.
Clifton, K. J., Currans, K. M., & Muhs, C. D. (2012). Contextual Influences on Trip Generation, OTREC-RR-12-13. Portland, Oregon: Oregon Transportation Research and Education Consortium (OTREC).
Daisa, J. M., Mustafa, A., Mizuta, M., Schwartz, L., Espelet, L., Turlik, D.,Bregman, G. (2009). Trip Generation Rates for Urban Infill Land Uses in California: Phase II Final Report. Kimley-Horn & Associates, Inc. California: California Department of Transportation (Caltrans).
Ewing, R., & Cervero, R. (2001). Travel and the Built Environment: A Synthesis. Transportation Research Record: Journal of the Transportation Research Board, 1780, 87-114.
Ewing, R., & Cervero, R. (2010). Travel and the Built Environment: A Meta-Analysis. Journal of the American Planning Association, 76(3), 265-294.
New York City. (2010). City Environmental Quality Review (CEQR): Chapter 16. New York City, NY: Mayor's Office of Environmental Coordination.
San Diego Association of Governments (SANDAG). (2010). Trip Generation for Smart Growth: Planning Tools for the San Diego Region. San Diego, CA.
San Diego Municipal Code. (2003). Land Development Code: Trip General Manual. San Diego, California.
San Francisco Planning Department. (2002). Transportation Impact Analysis Guidelines for Environmental Review. San Francisco, California: City and County of San Francisco.
Schneider, R. J., Shafizadeh, K., & Handy, S. L. (2013). California Smart-Growth Trip Generation Rates Study. Davis, California: University of California, Davis for the California Department of Transportation.
Maps by Stamen: http://maps.stamen.com
53