Page 1
doi.org/10.26434/chemrxiv.13124993.v1
Imputation of Missing Gas Permeability Data for Polymer Membranesusing Machine LearningQi Yuan, Mariagiulia Longo, Aaron Thornton, Neil B. McKeown, Bibiana Comesana-Gandara, Johannes C.Jansen, Kim Jelfs
Submitted date: 21/10/2020 • Posted date: 22/10/2020Licence: CC BY-NC-ND 4.0Citation information: Yuan, Qi; Longo, Mariagiulia; Thornton, Aaron; McKeown, Neil B.; Comesana-Gandara,Bibiana; Jansen, Johannes C.; et al. (2020): Imputation of Missing Gas Permeability Data for PolymerMembranes using Machine Learning. ChemRxiv. Preprint. https://doi.org/10.26434/chemrxiv.13124993.v1
Polymer-based membranes can be used for energy efficient gas separations. Successful exploitation of newmaterials requires accurate knowledge of the transport properties of all gases of interest. An open sourcedatabase of such data is of significant benefit to the research community. The Membrane Society ofAustralasia (https://membrane-australasia.org/) hosts a database for experimentally measured and reportedpolymer gas permeabilities. However, the database is incomplete, limiting its potential use as a research tool.Here, missing values in the database were filled using machine learning (ML). The ML model was validatedagainst gas permeability measurements that were not recorded in the database. Through imputing themissing data, it is possible to re-analyse historical polymers and look for potential “missed” candidates withpromising gas selectivity. In addition, for systems with limited experimental data, ML using sparse featureswas performed, and we suggest that once the permeability of CO2 and/or O2 for a polymer has beenmeasured, most other gas permeabilities and selectivities, including those for CO2/CH4 and CO2/N2, can bequantitatively estimated. This early insight into the gas permeability of a new system can be used at an initialstage of experimental measurements to rapidly identify polymer membranes worth further investigation.
File list (5)
download fileview on ChemRxivImputing_PolymerMembranes_MAIN.pdf (1.15 MiB)
download fileview on ChemRxivImputing_PolymerMembranes_SI.pdf (481.89 KiB)
download fileview on ChemRxivTOC.tif (747.39 KiB)
download fileview on ChemRxivImputed_database_BLR_standard_deviation.csv (475.67 KiB)
download fileview on ChemRxivImputed_database_BLR_ERT.csv (476.92 KiB)
Page 2
Imputation of Missing Gas Permeability Data for Polymer Membranes using Machine
Learning
Qi Yuana, Mariagiulia Longob, Aaron Thorntonc, Neil B. McKeownd, Bibiana Comesaña-
Gándarad, Johannes C. Jansenb, and Kim E. Jelfsa*
aDepartment of Chemistry, Molecular Sciences Research Hub, White City Campus, Imperial
College London, Wood Lane, London, UK
bInstitute on Membrane Technology, CNR-ITM, Via P. Bucci 17/C, 87036 Rende (CS), Italy
cFuture Industries, Commonwealth Scientific & Industrial Research Organisation, Research
Way, Clayton VIC, Australia
dEaStCHEM, School of Chemistry, University of Edinburgh, David Brewster Road, Edinburgh
EH9 3FJ, U.K.
*E-mail address: [email protected]
Page 3
1
Abstract
Polymer-based membranes can be used for energy efficient gas separations. Successful
exploitation of new materials requires accurate knowledge of the transport properties of all
gases of interest. An open source database of such data is of significant benefit to the research
community. The Membrane Society of Australasia (https://membrane-australasia.org/) hosts a
database for experimentally measured and reported polymer gas permeabilities. However, the
database is incomplete, limiting its potential use as a research tool. Here, missing values in the
database were filled using machine learning (ML). The ML model was validated against gas
permeability measurements that were not recorded in the database. Through imputing the
missing data, it is possible to re-analyse historical polymers and look for potential “missed”
candidates with promising gas selectivity. In addition, for systems with limited experimental
data, ML using sparse features was performed, and we suggest that once the permeability of
CO2 and/or O2 for a polymer has been measured, most other gas permeabilities and selectivities,
including those for CO2/CH4 and CO2/N2, can be quantitatively estimated. This early insight
into the gas permeability of a new system can be used at an initial stage of experimental
measurements to rapidly identify polymer membranes worth further investigation.
Keywords
polymers of intrinsic microporosity (PIMs), polyimides, database imputation, gas separation
membranes, machine learning
Page 4
2
1. Introduction
Membranes with polymers as the selective layer have been widely used for the separation of
gas mixtures including those of key relevance to energy and the environment[1–4]. The
development of new polymers with improved gas permeability and selectivity would enhance
the efficiency of membrane gas separations of industrial interest[5]. Polymers have been
developed for various purposes including hydrogen recovery during ammonia preparation (H2
from N2)[6,7], oxygen or nitrogen enrichment of air (O2 from N2)[8,9]; and natural gas
sweetening or biogas upgrading (CO2 from CH4)[10–12]. Rising concern about global warming
by greenhouse gas emissions has focused attention also on pre-combustion or post-combustion
carbon capture (mainly H2 from CO2, and CO2 from N2, respectively)[13,14]. Membranes with
high permeability are desired for industrial application at large scales, however, there is a well-
known trade-off between gas permeability and the gas selectivity for a gaseous mixture, with
an upper bound for each gas pair quantified by Robeson in 1991[15] and updated in 2008[16].
Subsequent effort in polymer design and synthesis has pushed the Robeson upper bound
towards polymers with both higher permeability and better selectivity, resulting in recently
revised upper bounds[17,18]. However, since experimental analysis of the transport properties
of novel materials can be time consuming and accurate studies require specialized equipment,
many studies are limited to a single gas pair[19]; or to a few gases[20]. It is likely that there
are missed opportunities, where polymers with promising gas selectivity and permeability for
a different gaseous mixture than those tested are missed. Conversely, for rapid screening of
potential polymers, it would be advantageous to assess the full potential based on fewer gas
permeability measurements.
The Membrane Society of Australasia (MSA) hosts the public Polymer Gas Separation
Membrane Database, which was launched online in 2012, and allows access to gas
permeability data for a large number of polymers published from 1950 to 2018[21]. Initially,
the resource consisted of data collated by Robeson, who empirically observed and
characterized the upper bound phenomenon in 1991[15] and again in 2008[16], reflecting the
growing interest in energy-efficient separations using membranes. The database now contains
over 1500 data points. The philosophy of the database is for it to be open, with anyone able to
freely add or edit the database, but the content is checked regularly to ensure the data-points
are correctly referenced. Gas permeability measurements originally included hydrogen, oxygen,
nitrogen, carbon dioxide and methane. Later the measurements were extended to vapours such
as ethylene, ethane, propene, propane, butene, butane, carbon tetrafluoride, hexafluoroethane
Page 5
3
and octafluoropropane. The membrane materials included cover a range of rubber and glassy
polymers, carbon sieves, zeolites and mixed composites. However, not every entry in the
database contains the experimentally reported values for every gas listed above. Due to the
widespread use of the Polymer Gas Separation Membrane Database by researchers in academia
and industry (approximately 1,000 views per month in 2019 and 2020), imputation of the
database is desirable. In statistics, imputation refers to the process of replacing missing data
with substituted values. With an accurate imputation model, one can not only retrieve
candidates with good gas selectivity that were not measured at the time of publication, but also
get a more complete database for future experimental and theoretical study. In addition,
experimental measurement of the gas permeability of previously reported polymers would be
time consuming and expensive, especially when the likelihood of publishing such studies in a
formal journal article is unlikely. It is thus highly desirable to develop an easily accessible
computational model to estimate the permeability of certain gases when the original
experimental data was not reported.
Machine learning (ML) methods have been developed and applied to polymers for predicting
properties including glass transition temperature[22], dielectric constants[23], the gas
permeability of polymers[24], and the discovery of novel functional polymers[25]. One of the
main models for predicting polymer membrane performance is group contribution theory,
where the chemical structure of a polymer is divided into smaller fragments and the fragments
used in various ML models as input features[26–28]. Recently, hierarchical methods for
fingerprinting polymers for property prediction have also been reported[29]. Such models were
built upon chemical structures of polymers and are of great value for identifying structure-
property relationships. However, the gas permeability of the same polymer is often measured
under different conditions, for example, different solvent treatment or degree of aging, and ML
models based upon polymer fingerprints cannot distinguish the difference between these
conditions. The Polymer Gas Separation Membrane Database often holds data for the same
polymer tested under different conditions, in different laboratories with different instruments,
and a ML model relying purely on chemical structure alone would not be sufficient for filling
the missing values for gas permeability.
An alternative way of imputing the database is to predict the permeability of unknown gases
based on data for gases with known permeability. As suggested by Alentiev et al., the logarithm
gas permeability coefficients Pi and Pj of gases i and j are strongly correlated[30], thus it is
plausible to predict the gas permeability of gas i using the permeability data for other gases
Page 6
4
without requiring any information on the molecular structure of the polymers or experimental
conditions. The aim of this paper is to accurately impute the Polymer Gas Separation
Membrane Database using known gas permeability values in the database with both linear and
non-linear ML models so that the imputed Polymer Gas Separation Membrane Database
provides a better understanding of previously reported polymers as good candidates for specific
gas separations even if the relevant gas permeabilities had not been reported. In addition, we
will show that the imputation model can be validated against published data that are not
included in the database as a test set, indicating that database imputation is a powerful tool for
examining the gas permeability of a novel polymer at an initial experimental stage, when not
all gas permeability data is available.
2. Methods
The Polymer Gas Separation Membrane Database was downloaded from the online portal of
the Membrane Society of Australasia (MSA) on 11/06/2020 at https://membrane-
australasia.org/msa-activities/polymer-gas-separation-membrane-database/. We focused on
data for the commonly measured gases He, H₂, O₂, N₂, CO₂ and CH₄ and removed datasets
that did not contain gas permeability data for at least one of these. We were left with a database
of 1,378 entries, and the number of missing values for the permeability of each gas in the target
database is shown in Table 1. The gas permeability of polymers was recorded in Barrer (1
Barrer = 10-10cm3(STP)cmcm-2s-1cm Hg-1), in this study the gas permeabilities were
converted to logarithm with base 10 values, since the logarithm values are used to define the
empirical Robeson upper bounds of gas selectivity[15,16].
Table 1 Number of missing values for the gas permeability in the Polymer Gas Separation
Membrane Database of each gas. The total number of data points for the permeability of
each gas was 1,378 in this study.
Gas He H2 O2 N2 CO2 CH4
Number and
percentage of
missing values
620
(45%)
608
(44%)
102
(7%)
123
(9%)
165
(12%)
341
(25%)
Page 7
5
Missing value imputation of the Polymer Gas Separation Membrane Database was performed
using the Multivariate Imputation by Chained Equations (MICE), which ‘fills in’ the missing
data in a dataset through an iterative procedure of predictive models[31]. In each iteration, the
missing values of a specific variable are predicted with the predictive model using other
variables in the dataset. The pseudo-code of the MICE algorithm is shown in Algorithm 1 in
the Supporting Information.
Here, a linear model and a non-linear model were selected as the predictive model in the MICE
algorithm, which were the Bayesian Linear Regression[32] and the Extremely Randomized
Trees[33], respectively. Predictive performance of these two models on the test set were
compared. The Bayesian Linear Regression (BLR) is an approach for linear regression where
the statistical analysis is undertaken with Bayesian inference, assuming that the regression
model has errors that have a normal distribution; while the Extremely Randomized Trees (ERT)
implements a meta-estimator that fits a number of randomized decision trees on various
subsamples of the dataset and uses averaging to improve the prediction accuracy and control
over-fitting. In this study, the ERT model was composed of 100 decision trees. The missing
value imputation of the Polymer Gas Separation Membrane Database is performed using
Python 3.7.1 and Scikit-learn 0.21.2[34]. The code for imputing the database is available at
https://github.com/qyuan7/polymer_permeability_imputation.
The test set in this work was selected from papers published in 2019 and 2020 reporting gas
permeability of polymers of intrinsic microporosity (PIMs)[18,35,36] and polyimides[37–42],
which have not been recorded in the Polymer Gas Separation Membrane Database.
Performance of the ML models on the test sets was measured in a round-robin manner with
“dense features”, for example, to test the model on prediction of permeability of H2, the
permeability data of H2 was dropped from the test database, and the data of H2 was modelled
as a function of other gases in the test database. To examine the ability of the imputation models
for cases where only limited permeability data is available, test sets with “sparse features” were
also used, where the gas permeability data of only one gas was used to predict the permeability
for all other gases, for example, predicting the gas permeability of He, O2, N2, CH4 and CO2
using the gas permeability data of H2. The performance of the ML model on the test set was
measured by the rooted mean squared error (RMSE) between the logarithm gas permeability
obtained by ML prediction and the experimentally reported values as defined in equation (1),
where n is the number of data points, 𝑝𝑖 is the experimentally reported logarithm gas
Page 8
6
permeability of polymer i, and �̂�𝑖 is the logarithm gas permeability of polymer i prediction
using the ML model:
𝑅𝑀𝑆𝐸 = √∑ (𝑝𝑖− �̂�𝑖)2𝑛
𝑖=1
𝑛 (1)
The ability of the ML models to predict the gas selectivity of polymers was measured by a
classification problem, where the ML models were used to predict whether polymers in the test
set had gas selectivity beyond the Robeson 2008 upper bound. Polymers with gas selectivity
above the Robeson 2008 upper bound were regarded as “positive”, while those below the
Robeson 2008 upper bound were regarded as “negative”. The gas permeabilities of polymers
were evaluated using the ML models to determine if they were predicted “positive” or
“negative” in the Robeson diagram. “True positive” represents polymers that were positive
from both experimental measurements and ML prediction; “False positive” represents
polymers that were positive from ML prediction but negative from experimental measurements;
“True negative” represents polymers that were negative from both experimental measurements
and ML prediction, and “False negative” represents polymers that were negative from ML
prediction but positive from experimental measurements. We computed the accuracy, precision,
and recall scores for identifying the polymers with gas selectivity above the Robeson 2008
upper bound. In this study, accuracy refers to the fraction of correct predictions from all
predictions made, precision refers to the fraction of “true positive” values from values that were
predicted as “positive”, and recall refers to the fraction of “true positive” values from all values
that were “positive” experimentally. The accuracy, precision and recall scores are defined in
equations (2) to (4):
𝐴𝑐𝑐𝑢𝑟𝑎𝑐𝑦 = 𝑇𝑟𝑢𝑒 𝑝𝑜𝑠𝑖𝑡𝑖𝑣𝑒+𝑇𝑟𝑢𝑒 𝑛𝑒𝑔𝑎𝑡𝑖𝑣𝑒
𝑆𝑖𝑧𝑒 𝑜𝑓 𝑡𝑒𝑠𝑡 𝑠𝑒𝑡 (2)
𝑃𝑟𝑒𝑐𝑖𝑠𝑖𝑜𝑛 = 𝑇𝑟𝑢𝑒 𝑝𝑜𝑠𝑖𝑡𝑖𝑣𝑒
𝑇𝑟𝑢𝑒 𝑝𝑜𝑠𝑖𝑡𝑖𝑣𝑒+𝐹𝑎𝑙𝑠𝑒 𝑝𝑜𝑠𝑖𝑡𝑖𝑣𝑒 (3)
𝑅𝑒𝑐𝑎𝑙𝑙 = 𝑇𝑟𝑢𝑒 𝑝𝑜𝑠𝑖𝑡𝑖𝑣𝑒
𝑇𝑟𝑢𝑒 𝑝𝑜𝑠𝑖𝑡𝑖𝑣𝑒+𝐹𝑎𝑙𝑠𝑒 𝑛𝑒𝑔𝑎𝑡𝑖𝑣𝑒 (4)
3. Results and discussion
3.1 Comparison of the BLR and ERT imputation results
Page 9
7
Comparison of the BLR and ERT imputation results are shown in Fig. 1. The BLR and ERT
imputation results are highly correlated apart from a few outliers, and no systematic error
between the two imputation methods is observed, with neither of the two imputation methods
giving constantly larger or smaller predictions than the other. As shown in Fig. 1, the RMSE
of the logarithm gas permeability obtained from the BLR and ERT imputations ranged from
0.07 to 0.26, with the largest disagreement observed for the CH4 data. This is possibly because
the data for CH4 has a relatively weak correlation with the data for other gases, as shown in
Figure S1, which is in part due to the relatively low permeability of CH4 in most glassy
polymers, and therefore the measurement may have a lower accuracy than that of other gases.
Furthermore, CH4 has the largest effective diameter of the gases considered in this work, and
is thus more affected by variations in the sample history, physical aging and measurement
conditions[43]. The fact that both the linear model BLR and non-linear model ERT produced
highly correlated imputation results indicates that the MICE algorithm is relatively robust
against the choice of the predictive model type. We have provided the imputed database
obtained from both the BLR and ERT model in the supporting information and at
https://github.com/qyuan7/polymer_permeability_imputation. In addition, the standard
deviation of the BLR imputation is provided to give prediction confidence intervals.
Fig. 1 Comparison of the BLR and ERT imputation results on the Polymer Gas Separation
Membrane Database of reported gas permeability. The RMSE in logarithm Barrer between
the BLR and ERT predictions are given in each sub figure.
Page 10
8
3.2 Validation of the imputation models on the test set
We selected publications with experimental data not recorded in the Polymer Gas Separation
Membrane Database for PIMs[18,35,36] and polyimides[37–42]. Representative molecular
structures of the PIMs and polyimides are shown in Fig. 2. The test set contained experimental
gas permeabilities of 50 PIM entries and 37 polyimide entries. As can be seen from Fig. 2,
there is great structural diversity in the test sets, in addition, PIMs exhibit higher gas
permeability compared to polyimides, thus the test set in this study is a diverse dataset in terms
of both polymer structure and the range of gas permeability.
Fig. 2 Representative structures of PIMs (a-c) and polyimides(d,e) in the test set. (a)
Adamantane-grafted PIM[35]; (b) Benzotriptycene-based PIM[18]; (c) OH-functionalized
Tröger’s base-based PIM[36]; (d) Microporous polyimides containing bulky tetra-o-isopropyl
and naphthalene groups[37]; (e) Imidazole containing polyimide[42].
Performance of the BLR and ERT imputation models was compared by computing the RMSE
between “predicted” logarithm gas permeability and the experimental logarithm gas
permeability reported in the literature, as shown in Table 2. The BLR model was more accurate
in the predictions for the gas permeability of PIMs than the ERT model, while the performance
of the two models were comparable for polyimides, except that the ERT model had
significantly larger errors for the H2 permeability. The BLR model is more accurate than the
ERT model in general on the test set with “dense features”, where the permeability of one gas
was predicted using the permeabilities of all other gases; and the discussion in this study for
Page 11
9
validation with “dense features” is primarily based on the predictions of the BLR model.
Correlation of the experimentally reported gas permeability and the BLR model predictions is
shown in Fig. 3. According to Table 2 and Fig. 3, the BLR model had the largest error in
predicting the CH4 and CO2 permeability, and the smallest in O2 permeability. From Fig. 3 it
can be seen that the BLR model systematically underestimated the CO2 permeability for almost
all the entries in the test set, while no obvious systematic error is observed for CH4 permeability.
Table 2 RMSE between the BLR and ERT predicted gas permeability and experimental results
in logarithm Barrer. The smaller RMSE values among the two models are in bold.
He H₂ O₂ N₂ CH₄ CO₂
BLR/PIMs 0.04 0.05 0.03 0.07 0.10 0.12
ERT/PIMs 0.08 0.14 0.04 0.11 0.15 0.13
BLR/polyimides 0.11 0.10 0.07 0.09 0.17 0.11
ERT/polyimides 0.13 0.19 0.08 0.09 0.16 0.10
BLR/average 0.06 0.07 0.05 0.08 0.13 0.12
ERT/average 0.10 0.16 0.06 0.10 0.16 0.12
Fig. 3 Correlation of BLR prediction and the experimental report of the gas permeability of
PIMs (orange data points) and polyimides (blue data points) in the test set.
Page 12
10
The most likely explanation for the model underestimating the CO2 permeability is that
researchers have been working towards improving the gas permeability by increasing the
amount of free volume (or microporosity) of the polymers. According to the solution-diffusion
model of gas transport[44], greater free volume enhances both gas diffusivity and solubility
with the latter being particularly high for PIMs relative to conventional polymers. Thus, the
pairwise relationship between different gases has changed over time, and the samples from the
test set belong to the latest generation of polymers with relatively high CO2 permeability. The
Robeson diagrams showing the position of polymers in the Polymer Gas Separation Membrane
Database for the selectivity of CO2/CH4 and CO2/N2 are shown in Figure S2. A chronological
increase can be observed in the gas selectivity, especially when comparing the gas selectivity
of polymers reported after 2010 and those reported before 2000. A time series analysis for
removing the error incurred by the time-dependent nature of the database was performed,
where data points in the Polymer Gas Separation Membrane Database were classified to
smaller datasets by the decade of publication, and imputation of the smaller datasets were
performed and validated against the test set. However, due to the existence of missing values
and the inconsistent number of data points per decade in the database, the imputation results
were not improved. As a result, we used the entries in the database as provided, without
performing any time-based corrections, and the uncertainty in predicting the CO2 permeability
is represented by the standard deviation of the BLR prediction, as provided in the supporting
information.
The most important property for gas separation membranes is to have a high permeability in
combination with a high selectivity for the gas pair of interest, which can be examined from
the Robeson diagram. We measured the performance of the imputation models using a two-
class classification task: polymers with gas selectivity above the Robeson 2008 upper bound
were regarded as “positive”, and those below the Robeson 2008 upper bound were regarded as
“negative”. For both the BLR and ERT model, the gas permeabilities of interest were calculated
using the permeability of other gases (the prediction using “dense features”), and the positions
of the calculated values in the Robeson diagram were computed. The model performance was
then evaluated by whether the correct label was assigned to the polymers in the test set. Two
of the most reported gas pairs, CO2/CH4 and CO2/N2, were considered, and the accuracy,
precision and recall scores for the BLR and ERT prediction of CO2/CH4 and CO2/N2 selectivity
are shown in Table 3.
Page 13
11
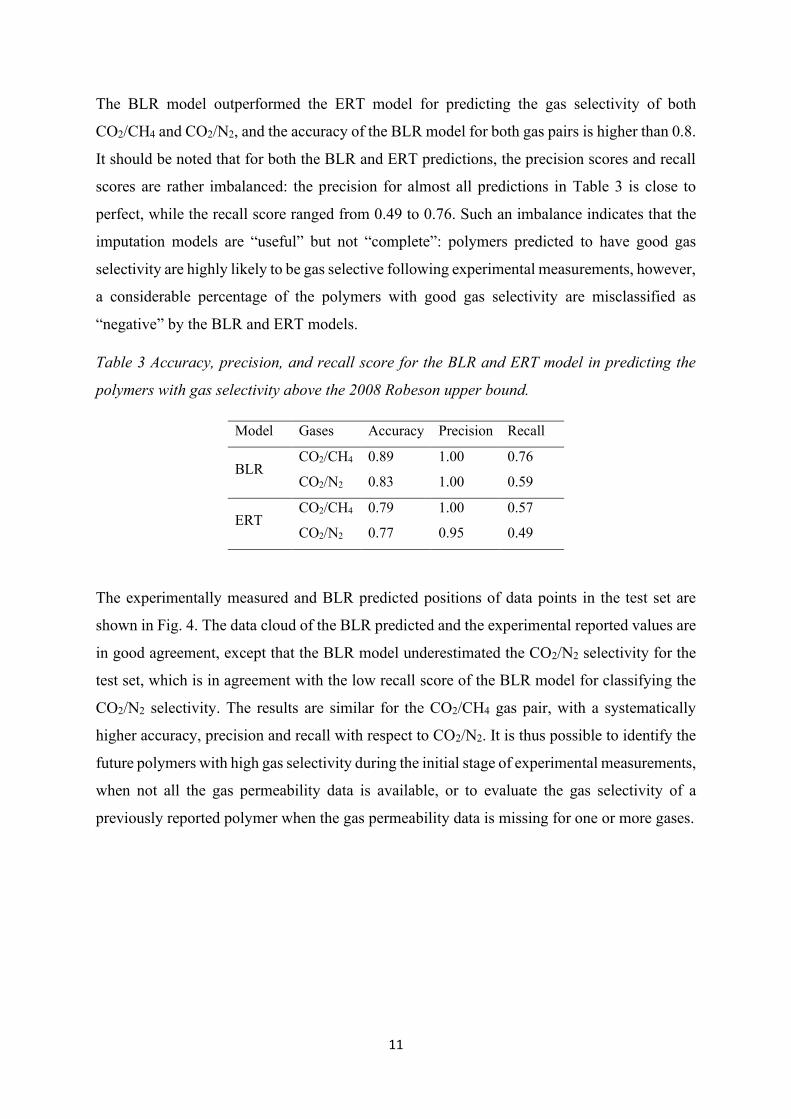
The BLR model outperformed the ERT model for predicting the gas selectivity of both
CO2/CH4 and CO2/N2, and the accuracy of the BLR model for both gas pairs is higher than 0.8.
It should be noted that for both the BLR and ERT predictions, the precision scores and recall
scores are rather imbalanced: the precision for almost all predictions in Table 3 is close to
perfect, while the recall score ranged from 0.49 to 0.76. Such an imbalance indicates that the
imputation models are “useful” but not “complete”: polymers predicted to have good gas
selectivity are highly likely to be gas selective following experimental measurements, however,
a considerable percentage of the polymers with good gas selectivity are misclassified as
“negative” by the BLR and ERT models.
Table 3 Accuracy, precision, and recall score for the BLR and ERT model in predicting the
polymers with gas selectivity above the 2008 Robeson upper bound.
Model Gases Accuracy Precision Recall
BLR
CO2/CH4 0.89 1.00 0.76
CO2/N2 0.83 1.00 0.59
ERT
CO2/CH4 0.79 1.00 0.57
CO2/N2 0.77 0.95 0.49
The experimentally measured and BLR predicted positions of data points in the test set are
shown in Fig. 4. The data cloud of the BLR predicted and the experimental reported values are
in good agreement, except that the BLR model underestimated the CO2/N2 selectivity for the
test set, which is in agreement with the low recall score of the BLR model for classifying the
CO2/N2 selectivity. The results are similar for the CO2/CH4 gas pair, with a systematically
higher accuracy, precision and recall with respect to CO2/N2. It is thus possible to identify the
future polymers with high gas selectivity during the initial stage of experimental measurements,
when not all the gas permeability data is available, or to evaluate the gas selectivity of a
previously reported polymer when the gas permeability data is missing for one or more gases.
Page 14
12
Fig. 4 BLR prediction and experimental reports of the CO2/CH4 and CO2/N2 selectivity in the
Robeson diagram.
3.3 Identifying Promising Candidates in the Polymer Gas Separation Membrane
Database
The Polymer Gas Separation Membrane Database contains inputs of which some or all
permeability data for CO2, CH4 and N2 was missing. Upon imputation of the database, the gas
selectivity of the candidates with missing values were examined using the imputed gas
permeability to identify potential candidates with good CO2/CH4 and CO2/N2 selectivity. As
shown in Fig. 5a and b, most of the candidates with missing values had potentially limited gas
selectivity for CO2/CH4 and CO2/N2. However, the KAUST-PI-1 reported by Pinnau et al.[17],
of which the CO2 permeability was not been reported in the database, was found to have a
predicted CO2/CH4 selectivity above the Robeson 2008 upper bound and predicted CO2/N2
selectivity close to the Robeson 2008 upper bound. The molecular structure of KAUST-PI-1 is
Page 15
13
shown in Fig. 5c. Based purely on the ML predictions from existing data in the Polymer Gas
Separation Membrane Database, we identified that KAUST-PI-1 has potentially high CO2/CH4
selectivity and good CO2/N2 selectivity.
Our assumption was confirmed by further review of the literature, where we found another
report on KAUST-PI-1 by Pinnau et al.[45], which was not included in the Polymer Gas
Separation Membrane Database. The permeability of KAUST-PI-1 for CO2, CH4, as well as
N2 was reported as an average value from two films. It was found that the KAUST-PI-1
exhibited excellent CO2/CH4 selectivity, which was above the Robeson 2008 upper bound (as
we predicted), while the CO2/N2 selectivity was good but just below the Robeson 2008 upper
bound (we predicted it to be close to the upper bound). The comparison of the CO2/CH4 and
CO2/N2 selectivity of our prediction and the experimental measurement is shown in Table 4.
The agreement between experimental measurements that are not recorded in the Polymer Gas
Separation Membrane Database and the ML prediction indicates that it has the potential to re-
analyse historical data and identify potentially “missed” polymers with promising gas
selectivity.
Table 4 Comparison of the CO2/CH4 and CO2/N2 selectivity of the KAUST-PI-1 of our ML
prediction and the experimental report[45].
CO2
permeability
CO2/N2
selectivity
CO2/CH4
selectivity
Above the
CO2/N2
bounda
Above
CO2/CH4
bounda
BLR prediction 2290 b 26 b 28 b No
Yes
Experimental
measurement 2398 22 23 No Yes
a Whether or not the CO2/N2 and CO2/CH4 selectivity is above the Robeson 2008 upper bound.
b The CO2 permeability was calculated using our BLR model, the N2 and CH4 permeabilities were collected from
the Polymer Gas Separation Membrane Database. The permeability data is in Barrer.
Page 16
14
Fig. 5 Robeson diagram for candidates in the Polymer Gas Separation Membrane Database
with missing permeability data for (a) CO2 and CH4, where blue circles represent PIMs of
which CO2 permeability are not reported, red squares represent PIMs of which CH4
permeability are not reported, and black triangles represent PIMs of which neither CO2 nor
CH4 permeability are reported; (b) CO2 and N2, where blue circles represent PIMs of which
CO2 permeability are not reported, red squares represent PIMs of which N2 permeability are
not reported, and black triangles represent PIMs of which neither CO2 nor N2 permeability are
reported; (c) the structure and position of KAUST-PI-1 PIM.
Page 17
15
3.4 Prediction of gas permeability from a single measurement
During the experimental testing of gas selectivity of new polymers, the gas permeability is
usually measured sequentially, and these measurements take considerable time and effort. We
gave the BLR and ERT predictors a more challenging, yet rewarding, task to impute the test
set with sparse features by removing the gas permeability data of all but one gas and using the
permeability of that one gas to predict the permeability for all the other gases.
The imputation of the test set was performed following the MICE algorithm using the BLR and
ERT model as shown in Algorithm 1 and the RMSE for the predictions is shown in Table 5.
The correlation between gas permeability of pairs of gases can be observed from the RMSE
results in Table 5. For example, it can be observed that the permeability of H2 and He are
strongly correlated, since the permeability of H2 solely is a strong feature in predicting the
permeability of He, with RMSE of 0.05 and 0.10 for the BLR and ERT model, respectively.
The permeability of He, on the other hand, is a rather weak feature in predicting the
permeability of other gases, which is partly due to the fact that a lot of the experimental reports
in the test set lack the permeability of He.
With the imputation using sparse features, O2 and CO2 permeability was the strongest indicator
of the permeability of the other gases. According to Table 5, the average RMSE of the BLR
model for predicting permeability of other gases using data for O2 and CO2 are 0.25 and 0.27;
and the RMSE of the ERT model using data for O2 and CO2 are 0.28 and 0.23, respectively.
The order of reliability of prediction from permeability of a single gas for BLR model is O2 >
CO2 > N2 > CH4 > He, and the order of reliability for the ERT model is CO2 > O2 > H2 > N2 >
He > CH4.
Page 18
16
Table 5 RMSE of the BLR and ERT predicted gas permeability in logarithm Barrer against the
experimental reports in the test set. Each column corresponds to a completed imputation with
the MICE algorithm using the permeability of only the gas in that column as input. The RMSE
values in bold shows the best ‘feature’ in predicting the gas permeability of the corresponding
‘target’.
Feature
He H2 O2 N2 CH4 CO2
BLR
Target
He - 0.05 0.26 0.43 0.59 0.27
H2 0.62 - 0.23 0.41 0.58 0.23
O2 0.82 0.24 - 0.23 0.46 0.10
N2 0.93 0.46 0.24 - 0.31 0.28
CH4 1.05 0.63 0.42 0.19 - 0.47
CO2 0.89 0.23 0.11 0.3 0.51 -
Average 0.86 0.32 0.25 0.31 0.49 0.27
ERT
Target
He - 0.10 0.26 0.65 0.91 0.29
H2 0.41 - 0.27 0.64 0.93 0.29
O2 0.47 0.26 - 0.36 0.62 0.13
N2 0.46 0.43 0.24 - 0.39 0.15
CH4 0.58 0.55 0.50 0.33 - 0.30
CO2 0.76 0.32 0.11 0.39 0.67 -
Average 0.54 0.33 0.28 0.47 0.70 0.23
To simulate the scenario where the experimental permeability of a new polymer for only one
gas has been measured and one wants to evaluate the gas selectivity of the polymer without
experimentally measuring the gas permeability of the other gases, we examined specifically
the performance of CO2 permeability in predicting whether the polymer is above the Robeson
2008 upper bound for CO2/CH4 and CO2/N2. This is similar to the situation where the
permeability of CO2 has been experimentally measured and one needs primary insight into the
CO2/CH4 and CO2/N2 selectivity. The accuracy, precision and recall scores for the BLR and
ERT prediction of CO2/CH4 and CO2/N2 selectivity using only CO2 permeability are shown in
Table 6. The ERT model outperformed the BLR model for both the selectivity of CO2/CH4 and
CO2/N2 in the “sparse feature” case. It should be noted that for the BLR model, the recall scores
are very low, and the precision and recall for CO2/CH4 are both 0.00, which indicates that
according to the BLR model, all polymers in the test set are “negative”. The ERT model, on
the other hand, yields robust prediction scores for both the CO2/CH4 and CO2/N2 selectivity,
except that the recall score for CO2/CH4 selectivity is moderate. The reason for the ERT model
Page 19
17
in outperforming the BLR model in the “sparse feature” case might be that the linear BLR
model learned a stricter relationship between the pairwise gas permeability from the Polymer
Gas Separation Membrane Database. This enabled accurate prediction of gas permeability in
the “dense feature” case, however limited the generalizability of the model in the “sparse
feature” case.
It should be noted that the ERT model is not deterministic and might give slightly varied results
from different runs if different random seeds are used. In this study, we built the ERT model
using the combination of 100 decision trees, which reduced the probability of high variance in
the predictions. In addition, parallel ERT tests with different random seeds were performed and
the results with “sparse feature” were close. Thus, we believe that the ERT model is robust in
predicting the CO2/CH4 and CO2/N2 selectivity from the permeability of CO2. We suggest here
that once the permeability of CO2 for some polymer has been measured, researchers can
quantitatively estimate the permeability of N2 and CH4 to gain primary insight on the CO2/CH4
and CO2/N2 selectivity of that polymer using the ERT model. Similarly, if only one gas pair
(CO2/CH4 or CO2/N2) is tested, this method is of high predictive value for the other gas pair.
This may save time for future work, because less experiments will be needed to screen the
potential performance of new materials, but it may be particularly helpful also in the evaluation
of existing materials outside the application field for which they were originally developed.
For instance. Many polymers were studied for carbon capture from flue gas, where CO2/N2
separation is relevant, but they may be equally interesting for the strongly emerging new
application field of biogas upgrading, where CO2/CH4 separation is important.
Table 6 Accuracy, precision, and recall score for the BLR and ERT model in predicting the
polymers with gas selectivity above the 2008 Robeson upper bound using only the permeability
of CO2, the “sparse feature”.
Model Gases Accuracy Precision Recall
BLR
CO2/CH4 0.52 0.00 0.00
CO2/N2 0.64 1.00 0.16
ERT
CO2/CH4 0.84 1.00 0.66
CO2/N2 0.89 0.90 0.81
Page 20
18
Although it does not have the full predictive power of other methods[24,29], the advantage of
the models presented in this work is that they do not require any knowledge about the polymer
structure and they work for polymers with different measurement conditions (such as aging
and solvent treatment), which makes it a fast and versatile approach. For the rapid screening of
polymers, especially those produced via high-throughput techniques, the prediction of the full
range of gas permeability from a single rapid measurement could be highly beneficial to
researchers, especially as the chosen gas may be selected based on avoiding stringent local
safety regulations (e.g. for H2 or CH4) or high costs (e.g. for He). Our ML model for this
purpose is open-source and thus available for all experimental researchers in the field to use.
Our methodology must be used with caution for the evaluation of polymers that may have non-
standard solubility selectivity due to enhanced interaction (e.g. amines for CO2) or poor
interaction (e.g. fluorinated polymers with CH4) with a particular gas.
4. Conclusions
The missing values for the permeability of He, H2, O2, N2, CH4 and CO2 in the online Polymer
Gas Separation Membrane Database of the Membrane Society of Australasia were imputed
using the MICE algorithm combined with Bayesian Linear Regression and Extremely
Randomized Trees. Based on the imputed database, we suggested that the KAUST-PI-1 has
potentially high CO2/CH4 selectivity and good CO2/N2 selectivity, which was confirmed by
experimental work that was not recorded in the database. The imputed database can serve as
the training set for future polymers for gas separation, and the gas permeability and selectivity
of newly synthesized polymers can be predicted using the ML models in this work. Such
models rely purely on the experimental measurement data of the gas permeability of one or
more gases and are applicable against different experimental conditions. Validation of the
imputation model against unseen data suggests that the gas permeability can be modelled with
reasonable accuracy. Our results for ML models using “sparse features” suggest that
permeability of He, H2, O2, N2 and CH4 can be quantitatively estimated using the gas
permeability of O2 and/or CO2. Specifically, the ERT model is robust in predicting the
CO2/CH4 and CO2/N2 selectivity from the permeability of CO2. It is suggested that for cases
with “dense features”, where the permeability data of multiple gases is already measured, the
BLR model can provide accurate imputation results to the remaining gas permeability. For
cases with “sparse features”, on the other hand, the ERT model is recommended for making
Page 21
19
quantitative predictions to the permeability of untested gases given that the CO2 permeability
has been measured. In summary, preliminary insight into the gas permeability of polymers can
be gained at the initial stage of experimental measurements, and our model has the potential to
rapidly identify polymer membranes worth further investigation for both separations of primary
interest and those other than they were originally designed for. As more data points are
continually added to the Polymer Gas Separation Membrane Database, particularly for rarely
reported sorbents, this will eventually provide sufficient data for the ML prediction of further
gas separation performances, such as ethylene, ethane, propylene, propane, CF4 based only
upon initial measurements of CO2 and O2. This would be of significant advantage to researchers
in vastly accelerating the assessment of new polymer membranes, at much lower experimental
cost. We strongly encourage researchers to report all measured permeability data for
membranes in their papers and to upload these to the Gas Separation Membrane Database, with
this open data effort having a universal benefit for the polymer membrane community.
Page 22
20
Acknowledgement
We acknowledge funding from the European Research Council under FP7 (CoMMaD, ERC
Grant No. 758370), and K. E. J. thanks the Royal Society for a University Research Fellowship.
J.C.J. acknowledges funding from the CNR Program Short Term Mobility 2019.
Page 23
21
References
[1] P. Bernardo, E. Drioli, G. Golemme, Membrane gas separation: A review/state of the
art, Ind. Eng. Chem. Res. 48 (2009) 4638–4663. https://doi.org/10.1021/ie8019032.
[2] Y. Yampolskii, Polymeric gas separation membranes, Macromolecules. 45 (2012)
3298–3311. https://doi.org/10.1021/ma300213b.
[3] R.W. Baker, B.T. Low, Gas separation membrane materials: A perspective,
Macromolecules. 47 (2014) 6999–7013. https://doi.org/10.1021/ma501488s.
[4] M. Galizia, W.S. Chi, Z.P. Smith, T.C. Merkel, R.W. Baker, B.D. Freeman, 50th
Anniversary Perspective: Polymers and Mixed Matrix Membranes for Gas and Vapor
Separation: A Review and Prospective Opportunities, Macromolecules. 50 (2017)
7809–7843. https://doi.org/10.1021/acs.macromol.7b01718.
[5] P.M. Budd, N.B. McKeown, Highly permeable polymers for gas separation
membranes, Polym. Chem. 1 (2010) 63–68. https://doi.org/10.1039/b9py00319c.
[6] N.W. Ockwig, T.M. Nenoff, Membranes for hydrogen separation, Chem. Rev. 107
(2007) 4078–4110.
[7] Prism Membrane Systems for Ammonia Plants, (n.d.). https://www.airproducts.no/wp-
content/uploads/2016/06/Membrane-Systems-For-Ammonia-Plants.pdf (accessed
August 26, 2020).
[8] R.S. Murali, T. Sankarshana, S. Sridhar, Air separation by polymer-based membrane
technology, Sep. Purif. Rev. 42 (2013) 130–186.
https://doi.org/10.1080/15422119.2012.686000.
[9] N.F. Himma, A.K. Wardani, N. Prasetya, P.T.P. Aryanti, I.G. Wenten, Recent progress
and challenges in membrane-based O2/N2 separation, Rev. Chem. Eng. 35 (2019) 591–
625. https://doi.org/10.1515/revce-2017-0094.
[10] S. Wang, X. Li, H. Wu, Z. Tian, Q. Xin, G. He, D. Peng, S. Chen, Y. Yin, Z. Jiang,
M.D. Guiver, Advances in high permeability polymer-based membrane materials for
CO2 separations, Energy Environ. Sci. 9 (2016) 1863–1890.
https://doi.org/10.1039/c6ee00811a.
[11] J.K. Adewole, A.L. Ahmad, Polymeric membrane materials selection for high-pressure
CO2 removal from natural gas, J. Polym. Res. 24 (2017).
https://doi.org/10.1007/s10965-017-1231-6.
[12] E. Esposito, L. Dellamuzia, U. Moretti, A. Fuoco, L. Giorno, J.C. Jansen,
Simultaneous production of biomethane and food grade CO2 from biogas: An
Page 24
22
industrial case study, Energy Environ. Sci. 12 (2019) 281–289.
https://doi.org/10.1039/c8ee02897d.
[13] D.M. D’Alessandro, B. Smit, J.R. Long, Carbon dioxide capture: prospects for new
materials, Angew. Chemie Int. Ed. 49 (2010) 6058–6082.
[14] M. Bui, C.S. Adjiman, A. Bardow, E.J. Anthony, A. Boston, S. Brown, P.S. Fennell,
S. Fuss, A. Galindo, L.A. Hackett, J.P. Hallett, H.J. Herzog, G. Jackson, J. Kemper, S.
Krevor, G.C. Maitland, M. Matuszewski, I.S. Metcalfe, C. Petit, G. Puxty, J. Reimer,
D.M. Reiner, E.S. Rubin, S.A. Scott, N. Shah, B. Smit, J.P.M. Trusler, P. Webley, J.
Wilcox, N. Mac Dowell, Carbon capture and storage (CCS): the way forward, Energy
Environ. Sci. 11 (2018) 1062–1176. https://doi.org/10.1039/C7EE02342A.
[15] L.M. Robeson, Correlation of separation factor versus permeability for polymeric
membranes, J. Memb. Sci. 62 (1991) 165–185.
[16] L.M. Robeson, The upper bound revisited, J. Memb. Sci. 320 (2008) 390–400.
[17] R. Swaidan, B. Ghanem, I. Pinnau, Fine-Tuned Intrinsically Ultramicroporous
Polymers Redefine the Permeability/Selectivity Upper Bounds of Membrane-Based
Air and Hydrogen Separations, ACS Macro Lett. 4 (2015) 947–951.
https://doi.org/10.1021/acsmacrolett.5b00512.
[18] B. Comesaña-Gándara, J. Chen, C.G. Bezzu, M. Carta, I. Rose, M.-C. Ferrari, E.
Esposito, A. Fuoco, J.C. Jansen, N.B. McKeown, Redefining the Robeson upper
bounds for CO2/CH4 and CO2/N2 separations using a series of ultrapermeable
benzotriptycene-based polymers of intrinsic microporosity, Energy Environ. Sci. 12
(2019) 2733–2740. https://doi.org/10.1039/C9EE01384A.
[19] Z.P. Smith, R.R. Tiwari, M.E. Dose, K.L. Gleason, T.M. Murphy, D.F. Sanders, G.
Gunawan, L.M. Robeson, D.R. Paul, B.D. Freeman, Influence of Diffusivity and
Sorption on Helium and Hydrogen Separations in Hydrocarbon, Silicon, and
Fluorocarbon-Based Polymers, Macromolecules. 47 (2014) 3170–3184.
https://doi.org/10.1021/ma402521h.
[20] J. Duan, M. Higuchi, R. Krishna, T. Kiyonaga, Y. Tsutsumi, Y. Sato, Y. Kubota, M.
Takata, S. Kitagawa, High CO2/N2/O2/CO separation in a chemically robust porous
coordination polymer with low binding energy, Chem. Sci. 5 (2014) 660–666.
https://doi.org/10.1039/C3SC52177J.
[21] A.W. Thornton, B.D., Freeman, and L.M. Robeson, Polymer Gas Separation
Membrane Database, (2012). https://membrane-australasia.org/.
[22] C. Kim, A. Chandrasekaran, A. Jha, R. Ramprasad, Active-learning and materials
Page 25
23
design: The example of high glass transition temperature polymers, MRS Commun. 9
(2019) 860–866. https://doi.org/10.1557/mrc.2019.78.
[23] C. Kim, G. Pilania, R. Ramprasad, From Organized High-Throughput Data to
Phenomenological Theory using Machine Learning: The Example of Dielectric
Breakdown, Chem. Mater. 28 (2016) 1304–1311.
https://doi.org/10.1021/acs.chemmater.5b04109.
[24] J.W. Barnett, C.R. Bilchak, Y. Wang, B.C. Benicewicz, L.A. Murdock, T. Bereau,
S.K. Kumar, Designing exceptional gas-separation polymer membranes using machine
learning, Sci. Adv. 6 (2020) 1–8. https://doi.org/10.1126/sciadv.aaz4301.
[25] S. Wu, Y. Kondo, M. Kakimoto, B. Yang, H. Yamada, I. Kuwajima, G. Lambard, K.
Hongo, Y. Xu, J. Shiomi, C. Schick, J. Morikawa, R. Yoshida, Machine-learning-
assisted discovery of polymers with high thermal conductivity using a molecular
design algorithm, Npj Comput. Mater. 5 (2019) 66. https://doi.org/10.1038/s41524-
019-0203-2.
[26] L.M. Robeson, C.D. Smith, M. Langsam, A group contribution approach to predict
permeability and permselectivity of aromatic polymers, J. Memb. Sci. 132 (1997) 33–
54. https://doi.org/10.1016/S0376-7388(97)00031-8.
[27] J.Y. Park, D.R. Paul, Correlation and prediction of gas permeability in glassy polymer
membrane materials via a modified free volume based group contribution method, J.
Memb. Sci. 125 (1997) 23–39. https://doi.org/10.1016/S0376-7388(96)00061-0.
[28] H. Hasnaoui, M. Krea, D. Roizard, Neural networks for the prediction of polymer
permeability to gases, J. Memb. Sci. 541 (2017) 541–549.
https://doi.org/10.1016/j.memsci.2017.07.031.
[29] G. Zhu, C. Kim, A. Chandrasekarn, J.D. Everett, R. Ramprasad, R.P. Lively, Polymer
genome--based prediction of gas permeabilities in polymers, J. Polym. Eng. 1 (2020).
[30] A. Alentiev, Y. Yampolskii, Correlation of gas permeability and diffusivity with
selectivity: Orientations of the clouds of the data points and the effects of temperature,
Ind. Eng. Chem. Res. 52 (2013) 8864–8874. https://doi.org/10.1021/ie302680r.
[31] S. van Buuren, K. Groothuis-Oudshoorn, mice: Multivariate imputation by chained
equations in R, J. Stat. Softw. (2010) 1–68.
[32] D.J.C. MacKay, Bayesian interpolation, Neural Comput. 4 (1992) 415–447.
[33] P. Geurts, D. Ernst, L. Wehenkel, Extremely randomized trees, Mach. Learn. 63
(2006) 3–42. https://doi.org/10.1007/s10994-006-6226-1.
[34] F. Pedregosa, G. Varoquaux, A. Gramfort, V. Michel, B. Thirion, O. Grisel, M.
Page 26
24
Blondel, P. Prettenhofer, R. Weiss, V. Dubourg, J. Vanderplas, A. Passos, D.
Cournapeau, M. Brucher, M. Perrot, E. Duchesnay, Scikit-learn: Machine Learning in
Python, J. Mach. Learn. Res. 12 (2011) 2825–2830.
[35] Z. Wang, Q. Shen, J. Liang, Y. Zhang, J. Jin, Adamantane-grafted polymer of intrinsic
microporosity with finely tuned interchain spacing for improved CO2 separation
performance, Sep. Purif. Technol. 233 (2020) 116008.
https://doi.org/10.1016/j.seppur.2019.116008.
[36] S.L. Li, Z. Zhu, J. Li, Y. Hu, X. Ma, Synthesis and gas separation properties of OH-
functionalized Tröger’s base-based PIMs derived from 1,1′-binaphthalene-2,2′-OH,
Polymer (Guildf). 193 (2020) 122369. https://doi.org/10.1016/j.polymer.2020.122369.
[37] T. Li, J. Liu, S. Zhao, Z. Chen, H. Huang, R. Guo, Y. Chen, Microporous polyimides
containing bulky tetra-o-isopropyl and naphthalene groups for gas separation
membranes, J. Memb. Sci. 585 (2019) 282–288.
https://doi.org/10.1016/j.memsci.2019.05.003.
[38] A.A. Kuznetsov, A.Y. Tsegelskaya, A.M. Orlova, N.A. Belov, S. V. Chirkov, R.Y.
Nikiforov, A.Y. Alentiev, Polyimides Based on the Diethyltoluenediamine Isomer
Mixture: Synthesis and Gas Transport Properties, Membr. Membr. Technol. 1 (2019)
316–322. https://doi.org/10.1134/s2517751619050044.
[39] C. Ma, J.J. Urban, Hydrogen-Bonded Polyimide/Metal-Organic Framework Hybrid
Membranes for Ultrafast Separations of Multiple Gas Pairs, Adv. Funct. Mater. 29
(2019) 1–9. https://doi.org/10.1002/adfm.201903243.
[40] S. Wang, S. Ma, H. He, W. Ai, D. Wang, X. Zhao, C. Chen, Aromatic polyimides
containing pyridine and spirocyclic units: Preparation, thermal and gas separation
properties, Polymer (Guildf). 168 (2019) 199–208.
https://doi.org/10.1016/j.polymer.2019.02.046.
[41] X. Hu, W.H. Lee, J. Zhao, J.Y. Bae, J.S. Kim, Z. Wang, J. Yan, Y. Zhuang, Y.M. Lee,
Tröger’s Base (TB)-containing polyimide membranes derived from bio-based
dianhydrides for gas separations, J. Memb. Sci. 610 (2020) 118255.
https://doi.org/10.1016/j.memsci.2020.118255.
[42] Y. Fan, H. Yu, S. Xu, Q. Shen, H. Ye, N. Li, Zn(II)-modified imidazole containing
polyimide/ZIF-8 mixed matrix membranes for gas separations, J. Memb. Sci. 597
(2020) 117775. https://doi.org/10.1016/j.memsci.2019.117775.
[43] A. Fuoco, C. Rizzuto, E. Tocci, M. Monteleone, E. Esposito, P.M. Budd, M. Carta, B.
Comesaña-Gándara, N.B. McKeown, J.C. Jansen, The origin of size-selective gas
Page 27
25
transport through polymers of intrinsic microporosity, J. Mater. Chem. A. 7 (2019)
20121–20126. https://doi.org/10.1039/C9TA07159H.
[44] I. Matteucci, S., Yampolskii, Y., Freeman, B.D., and Pinnau, Transport of Gases and
Vapors in Glassy and Rubbery Polymers, in: Mater. Sci. Membr. Gas Vap. Sep., John
Wiley & Sons, Ltd, 2006: pp. 1–48.
[45] R. Swaidan, B. Ghanem, E. Litwiller, I. Pinnau, Ultra-microporous triptycene-based
polyimide membranes for high-performance gas separation, 24th Annu. Meet. North
Am. Membr. Soc. NAMS 2014. 26 (2014) 150–151.
https://doi.org/10.1002/adma.201306229.
Page 28
download fileview on ChemRxivImputing_PolymerMembranes_MAIN.pdf (1.15 MiB)
Page 29
Imputation of Missing Gas Permeability Data for Polymer Membranes using Machine
Learning
Supporting Information
Qi Yuana, Mariagiulia Longob, Aaron W. Thorntonc, Neil B. McKeownd, Bibiana Comesaña-Gándarad, Johannes C. Jansenb, and Kim E. Jelfsa * a Department of Chemistry, Molecular Sciences Research Hub, White City Campus, Imperial College London, Wood Lane, London, UK b Institute on Membrane Technology, CNR-ITM, Via P. Bucci 17/C, 87036 Rende (CS), Italy
c Future Industries, Commonwealth Scientific & Industrial Research Organisation, Research
Way, Clayton VIC, Australia
d EaStCHEM, School of Chemistry, University of Edinburgh, David Brewster Road,
Edinburgh EH9 3FJ, U.K.
* E-mail address: [email protected] (Kim E. Jelfs)
Page 30
Contents
Algorithm 1 Missing value imputation with Multivariate Imputation by Chained Equations
(MICE) algorithm ................................................................................................................. 3
Figure S1 Pairwise correlation between the gas permeability (in logarithm Barrer) in the
Polymer Gas Separation Membrane Database ....................................................................... 4
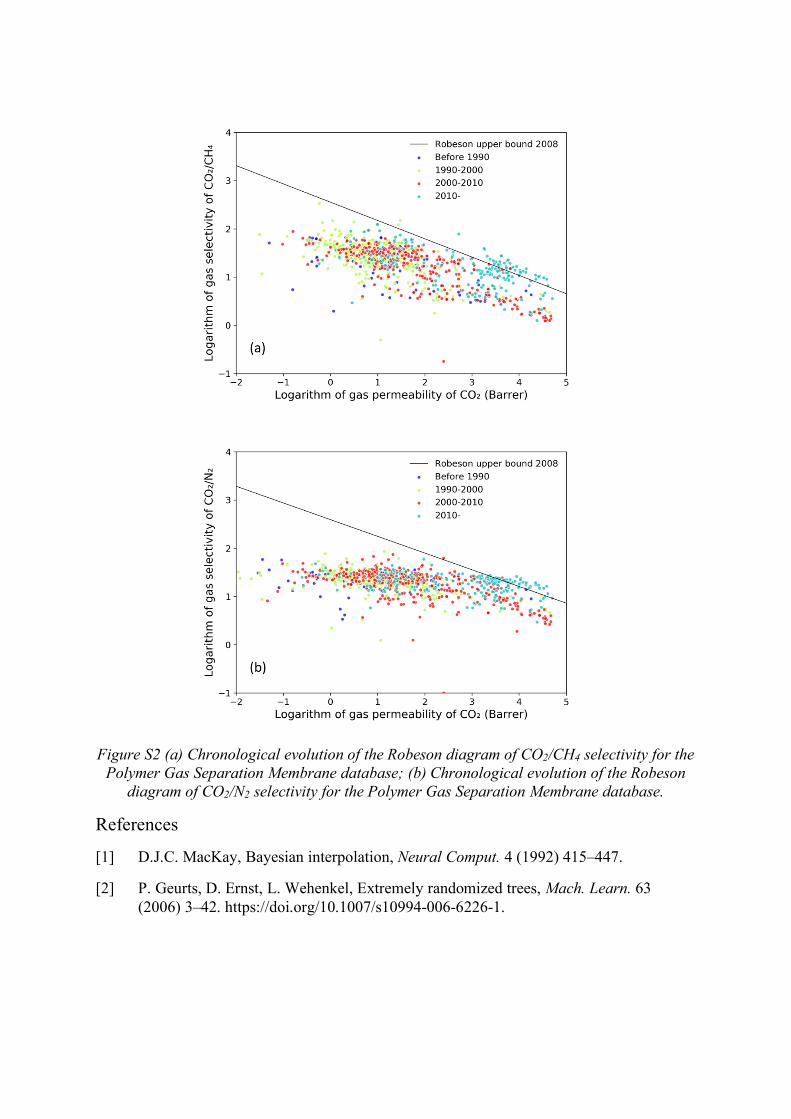
Figure S2 (a) Chronological evolution of the Robeson diagram of CO2/CH4 selectivity for the
Polymer Gas Separation Membrane database; (b) Chronological evolution of the Robeson
diagram of CO2/N2 selectivity for the Polymer Gas Separation Membrane database. ............. 5
Page 31
Algorithm 1 Missing value imputation with Multivariate Imputation by Chained Equations (MICE) algorithm
Missing value imputation with MICE
Input: Database D0 with missing values in columns C Output: Database D1 with missing values imputed using predictive model M*
1: Initialize missing values in D0 by the mean value of the non-missing values in each
column c to obtain D1
2: Determine maximum number of iterations T, early stopping criteria tol**;
3: Set t = 0, error = Infinity;
4: while t <= T and error > tol do
5: foreach iteration t do
6: foreach column c in D1 do
7: Set label =column c, features = all other columns;
8: Set training set = rows in D1 where column c is not missing,
Set test set = rows in D1 where column c is missing;
9: Train model M using training set;
10: Update missing values v in column c with prediction of M on the features
of test set;
11: end 12: error = max (abs(vt – vt-1))/max(abs(known value in D0)) 13: end 14: end 15: return D1
* In this study, a linear model and a non-linear model were selected as the predictive model M
in the MICE algorithm, the Bayesian Linear Regression[1] and the Extremely Randomized
Trees[2], respectively.
** In this study, the early stopping tolerance tol was 0.001 and the maximum number of
iterations T was 200.
Page 32
Figure S1 Pairwise correlation between the gas permeability (in logarithm Barrer) in the Polymer Gas Separation Membrane Database
Page 33
Figure S2 (a) Chronological evolution of the Robeson diagram of CO2/CH4 selectivity for the Polymer Gas Separation Membrane database; (b) Chronological evolution of the Robeson
diagram of CO2/N2 selectivity for the Polymer Gas Separation Membrane database.
References
[1] D.J.C. MacKay, Bayesian interpolation, Neural Comput. 4 (1992) 415–447.
[2] P. Geurts, D. Ernst, L. Wehenkel, Extremely randomized trees, Mach. Learn. 63 (2006) 3–42. https://doi.org/10.1007/s10994-006-6226-1.
Page 34
download fileview on ChemRxivImputing_PolymerMembranes_SI.pdf (481.89 KiB)
Page 35
download fileview on ChemRxivTOC.tif (747.39 KiB)
Page 36
Other files
download fileview on ChemRxivImputed_database_BLR_standard_deviation.csv (475.67 KiB)
download fileview on ChemRxivImputed_database_BLR_ERT.csv (476.92 KiB)