www.imrg.org
IMRG Capgemini
e-Retail Sales Index January 2016 (reporting December 2015 results)
What is the IMRG Capgemini e-Retail Sales Index? The IMRG Capgemini e-Retail Sales Index is the primary performance indicator of the UK online
shopping industry, tracking 'hard' sales data from reputable e-retailers since April 2000. The
participating merchants represent a significant proportion of the UK internet shopping market.
2 | www.imrg.org e-Retail Sales Index © - January 2016
Table of Contents
Executive Summary ........................................................................................... 3
Industry View ..................................................................................................... 4
December 2015 Index Results ........................................................................... 5
2015 Index Summary…………………………………………………………………………………..…7
2015 Quarterly Performance……………………………………..……………………………..….9
High St / Multichannel Vs Online-only / Catalogue ......................................... 10
Average Basket Values .................................................................................... 11
Conversion Rates ............................................................................................. 13
Additional Content .......................................................................................... 14
Index Sector Classification ............................................................................... 15
3 | www.imrg.org e-Retail Sales Index © - January 2016
Executive Summary
Key highlights:
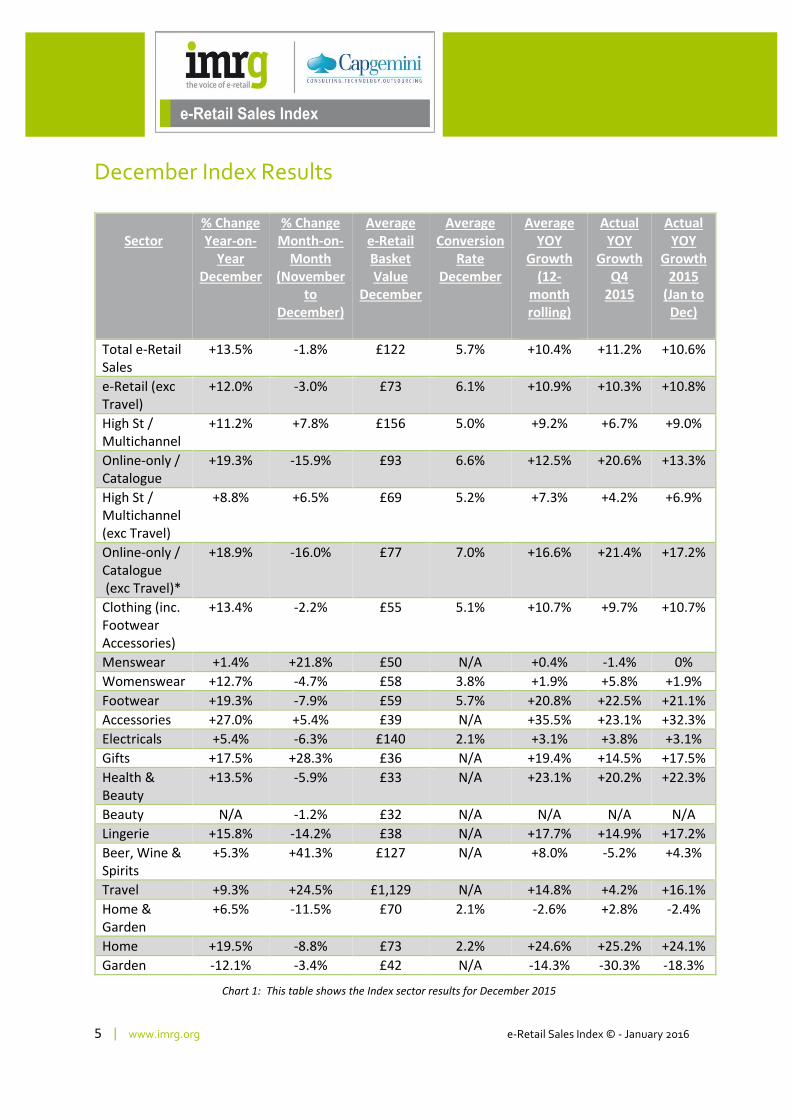
UK e-retail sales grew 13.5% year-on-year in December and fell 1.8% from the previous month
As we observed in 2014, the Index peaked in November due to the effect of sales during Black Friday week (w/c 22nd November)
The monthly decline between November and December 2015 (-1.8%) was less steep than the previous year, when the Index fell 4.1% between November and December 2014
Online sales over the Christmas period (November and December) grew in line with IMRG and Capgemini’s forecast, up 12% year-on-year
Index recorded a week-on-week surge of 62% in e-retail sales in the week of Black Friday – this compares with 44% during the same week in 2014
17% of total online sales during the Christmas period (1st November to 26th December) were during Black Friday week
Strongest performing sectors in December were footwear, accessories, gifts, lingerie and home with year-on-year growth exceeding the overall market performance
Britons spent an estimated £13.1 billion shopping online during December, resulting in total estimated e-retail spend in 2015 reaching £114.9 bn
During 2015 the UK online retail sector recorded annual growth of 11%, slightly below IMRG and Capgemini’s growth forecast of 12%
IMRG and Capgemini forecast the UK e-retail sector will grow 11% during 2016, with estimated online spend (including travel) expected to reach £126 billion
M-retail sales (including tablets) grew 48.3% year-on-year and 11.5% from the previous month
The latest results from the IMRG Capgemini e-Retail Sales Index reveal online sales grew 12% year-on-
year during the festive period (November and December), in line with our overall growth forecast for
2015. For the second year running, the Index recorded a decline between November and December,
due to the effect of Black Friday sales in the last week of November, however, the 1.8% dip was less
steep than the rate observed in 2014 when the Index fell 4.1% during this period.
It is clear that consumers were holding back during October waiting for Black Friday discounts and
promotions, which resulted in the weakest-ever annual growth recorded during that month, while in
November we observed a record monthly rise of 39.8% - the steepest monthly growth ever recorded in
the 15-year history of the Index. During the fourth quarter of 2015 the UK e-retail sector recorded
annual growth of 11.2%, resulting in total growth for the year of 10.6%. The Q4 performance compares
with 12% annual growth in the same period in 2014.
Tina Spooner, Chief Information Officer at IMRG said: “Rounding off a mixed year for e-retail, where we
saw single-digit growth in several months, the UK online retail industry recorded a solid performance in
December, with sales growth significantly higher than the same month in 2014. With December being
the wettest since records began, it appears the unseasonal weather, together with growth in mobile
commerce helped to boost online sales over the festive period. As we observed in 2014, the effect of
Black Friday resulted in November being the peak month for the online retail industry as consumers
brought forward much of their Christmas spending, no doubt boosted by promotional activity around
Black Friday.
4 | www.imrg.org e-Retail Sales Index © - January 2016
“Sales via smartphones continue to grow at a significantly higher rate than those via tablets, with sales
growth during December reaching the highest recorded during 2015 at 117.5% year-on-year. While
tablets continue to account for the largest share of mobile commerce, significantly, during December
four in 10 m-retail sales were completed on a smartphone, compared with 28% penetration in December
2014.”
Industry View
Mark Felix, Director Online Trade, John Lewis said: “Christmas 2015 had three distinct sales peaks –
Black Friday, Christmas and Clearance. As well as strong performances across all our product areas, we
also saw customers shopping across a variety of channels and our shops and website worked together
effectively. Overall, online accounted for 40% of sales over the Christmas period and mobile continued to
be our fastest-growing channel, with sales from smartphones and tablets up over a third."
Nigel Oddy, CEO of House of Fraser comments: “We are delighted with our Christmas trading
performance both in terms of sales growth and margin improvement. This year, we saw a very strong
start to the key Christmas season with Black Friday being particularly strong online, with sales up 40% on
the year – our biggest online day ever. Our stores have also performed well over the festive period, in
particular our recently refurbished stores which showed strong growth in the final week before
Christmas.”
Nigel Richards, Managing Director, Brora said: “Online sales for Black Friday were up 150% on last year
while Cyber Monday saw a 130% increase, giving a strong start to Christmas. Careful logistics planning
and cooperation from key carrier partners ensured customers still received a positive overall experience.
While the warm weather inevitably impacted trade during December, particularly with accessories, Brora
resisted going into sale pre-Christmas and this has resulted in a particularly good early January.”
Michael Durbridge, Director of Omni-Channel, B&Q commented: “Over the end of November /
December period, sales were higher than expected online with 31% growth year on year. We saw a
significant increase in the use of our Click & Collect service which accounted for half of the sales increase.
This was particularly prominent in the week before Christmas and the week after Christmas.
“We also saw a significant 4 percentage point uplift in the proportion of touchscreen device traffic to
B&Q website (smartphone & tablet) from Christmas Day onwards.”
Neil Sansom, Chief Executive, Woolovers.com said: “Woolovers.com saw a significant move online this
Christmas from its traditional catalogue based ordering channel and this helped sales considerably beat
the previous year’s sales over the Christmas period. We believe online sales will be the main source of
our projected growth in the future.”
5 | www.imrg.org e-Retail Sales Index © - January 2016
December Index Results
Sector
% Change Year-on-
Year December
% Change Month-on-
Month (November
to December)
Average e-Retail Basket Value
December
Average Conversion
Rate December
Average YOY
Growth (12-
month rolling)
Actual YOY
Growth Q4
2015
Actual YOY
Growth 2015
(Jan to Dec)
Total e-Retail Sales
+13.5% -1.8% £122 5.7% +10.4% +11.2% +10.6%
e-Retail (exc Travel)
+12.0% -3.0% £73 6.1% +10.9% +10.3% +10.8%
High St / Multichannel
+11.2% +7.8% £156 5.0% +9.2% +6.7% +9.0%
Online-only / Catalogue
+19.3% -15.9% £93 6.6% +12.5% +20.6% +13.3%
High St / Multichannel (exc Travel)
+8.8% +6.5% £69 5.2% +7.3% +4.2% +6.9%
Online-only / Catalogue (exc Travel)*
+18.9% -16.0% £77 7.0% +16.6% +21.4% +17.2%
Clothing (inc. Footwear Accessories)
+13.4% -2.2% £55 5.1% +10.7% +9.7% +10.7%
Menswear +1.4% +21.8% £50 N/A +0.4% -1.4% 0%
Womenswear +12.7% -4.7% £58 3.8% +1.9% +5.8% +1.9%
Footwear +19.3% -7.9% £59 5.7% +20.8% +22.5% +21.1%
Accessories +27.0% +5.4% £39 N/A +35.5% +23.1% +32.3%
Electricals +5.4% -6.3% £140 2.1% +3.1% +3.8% +3.1%
Gifts +17.5% +28.3% £36 N/A +19.4% +14.5% +17.5%
Health & Beauty
+13.5% -5.9% £33 N/A +23.1% +20.2% +22.3%
Beauty N/A -1.2% £32 N/A N/A N/A N/A
Lingerie +15.8% -14.2% £38 N/A +17.7% +14.9% +17.2%
Beer, Wine & Spirits
+5.3% +41.3% £127 N/A +8.0% -5.2% +4.3%
Travel +9.3% +24.5% £1,129 N/A +14.8% +4.2% +16.1%
Home & Garden
+6.5% -11.5% £70 2.1% -2.6% +2.8% -2.4%
Home +19.5% -8.8% £73 2.2% +24.6% +25.2% +24.1%
Garden -12.1% -3.4% £42 N/A -14.3% -30.3% -18.3%
Chart 1: This table shows the Index sector results for December 2015
6 | www.imrg.org e-Retail Sales Index © - January 2016
Chart 2: This chart shows the week-on-week Index performance during the festive period from 2013 to 2015
During Black Friday week 2015 (w/c 22nd November), the Index recorded a surge of 62% from the
previous week (Chart 2). This is steeper than the rate of growth we observed during this period in 2014,
when the Index rose 44% between week 3 and week 4 during November. The effect of Black Friday
during 2014 and 2015 is even more evident when we compare the weekly Index performance during the
same period in 2013. Between week 3 and 4 of November 2013 the Index rose 20%, therefore, the 2015
performance reveals sales grew at 3x the rate we observed before UK retailers began offering Black
Friday discounts and promotions.
During the 8 week period from 1st November to 26th December 2015, 17% of total online sales were
completed during Black Friday week – this is unchanged from the same week in 2014 but compares with
14% in week 4 of November 2013.
Britons spent an estimated £13.1 billion shopping online during December, taking the total estimated
spend (including travel) for 2015 to £114.8 billion. Excluding travel, we estimate the total value of UK
online sales reached £91.8 billion in 2015, accounting for 27% of total retail sales. This is up from 24% in
2014.
0
500
1,000
1,500
2,000
2,500
Nov-wk1 Nov-wk2 Nov-wk3 Nov-wk4 Dec-wk1 Dec-wk2 Dec-wk3 Dec-wk4
Ind
ex
Week on Week Growth: 2013-2015
2015 2014 2013
7 | www.imrg.org e-Retail Sales Index © - January 2016
2015 Summary
Chart 3: This graph shows the Index YOY performance in 2014 and 2015
The UK online retail market recorded annual growth of 11% in 2015, slightly below IMRG and
Capgemini’s forecast of 12%. We observed a rather mixed performance throughout the year with Q1
growth reaching just 7% year-on-year, significantly down on the same period in 2014 when Q1 growth
was 17% (Chart 3). This is the first time in the 15-year history of the e-Retail Sales Index, the market
recorded single-digit growth during a quarterly period. However, we saw a recovery during the second
quarter, when annual growth reached 14%.
June recorded the strongest performance during 2015 with sales up 18% year-on-year, boosted by
strong clothing and apparel sales, while the weakest growth came in August, when the late Bank Holiday
and later back-to-school purchases had a negative impact on sales.
Alex Smith-Bingham, Head of Digital, Capgemini, commented: “2015 has been another massive year in
terms of consumer spending, but what the Index reveals is just how dominant the online channels have
become. In just two years Black Friday has shifted from a high-street event to an online one, with
retailers extending their discounting over a week, rather than a single day. We also saw mobile confirm
its role as a primary shopping channel, providing consumers with an unprecedented level of convenience.
In 2016 I’m confident we’ll see this influence increase even further with mobile representing over half of
all sales made online.”
0%
5%
10%
15%
20%
25%
Jan Feb Mar Apr May Jun Jul Aug Sep Oct Nov Dec
IMRG Capgemini E-Retail Sales Index YOY Growth
2014
2015
8 | www.imrg.org e-Retail Sales Index © - January 2016
Chart 4: This graph shows the YOY performance in selected sectors during 2014 and 2015
During 2015 a number of sectors outperformed the total market performance, including categories
perhaps associated with discretionary spend such as gifts, health & beauty and travel. All these sectors
recorded stronger annual growth in 2015 compared with 2014 (Chart 4).
Clothing and apparel fluctuated throughout the year, with footwear, accessories and lingerie recording
significantly stronger growth than menswear and womenswear.
A weak performance in the garden sector brought down the overall performance in home and garden,
with sales down 2% year-on-year during 2015. And with no new ‘must-have’ technology released last
year, electricals was also one of the weakest performing sectors.
10%
13%14%
5%
17% 17%
10%
4%
11%
3%
18%
22%
-2%
16%
-5%
0%
5%
10%
15%
20%
25%
Be
ers,
Win
es &
Sp
irit
s
Clo
thin
g, F
oo
twea
r &
Acc
esso
rie
s
Elec
tric
al
Gif
ts
Hea
lth
& B
eau
ty
Ho
me
& G
ard
en
Trav
el
Year on Year Growth
2014
2015
9 | www.imrg.org e-Retail Sales Index © - January 2016
2015 Quarterly Performance
Chart 5: This table shows the year-on-year sector growth by quarter during 2015
Sector
Q1 2015 YOY
Growth
Q2 2015 YOY
Growth
Q3 2015 YOY
Growth
Q4 2015 YOY
Growth
Total YOY Growth
2015
Total Market +7.4% +13.8% +9.6% +11.2% +10.6%
High St / Multichannel (exc Travel)
+6.2%
+13.3%
+5.6%
+4.2%
+6.9%
Online-only / Catalogue (exc Travel)
+9.4%
+16.0%
+19.6%
+21.4%
+17.2%
E-retail Sales (exc Travel)
+8.3% +14.5% +10.9% +10.3% +10.8%
Beer, Wine, Spirits +28.6% +6.5% +0.6% -5.2% +4.3%
Clothing, Footwear, Accessories
+9.3%
+13.5%
+10.3%
+9.7%
+10.7%
Accessories +37.9% +53.3% +26.2% +23.1% +32.3%
Footwear +17.0% +20.1% +22.8% +22.5% +21.1%
Womenswear +4.7% +1.2% `-4.1% +5.8% +1.9%
Menswear +3.3% +4.1% -5.0% -1.4% 0%
Electricals -0.2% +5.2% +3.4% +3.8% +3.1%
Gifts +18.0% +23.2% +22.0% +14.5% +17.5%
Health & Beauty +17.6% +28.4% +23.7% +20.2% +22.3%
Lingerie +19.4% +20.0% +15.4% +14.9% +17.2%
Travel +18.9% +22.7% +14.2% +4.2% +16.1%
Home & Garden -6.1% -4.3% -3.3% +2.8% -2.8%
Home +13.8% +22.9% +34.8% +25.2% +24.1%
Garden +7.3% -18.8% -24.6% -30.3% -18.3%
10 | www.imrg.org e-Retail Sales Index © - January 2016
High Street / Multichannel Vs Online-only / Catalogue
(excluding Travel)
Chart 6: This chart shows the year-on-year performance for high st / multichannel and online-only / catalogue retailers during
2015
High street / multichannel retailers (excluding travel) recorded 8.8% annual growth in December,
compared with 18.9% for the online-only / catalogue merchants (Chart 6). The multichannel group
recorded a 6.5% rise between November and December, while sales for the online-only / catalogue
merchants fell 16.0% month-on-month.
Since June 2015 we have observed a divergence in these two groups’ year-on-year performance. The
chart below shows the annual growth recorded for each group (excluding travel) throughout 2015,
resulting in the online-0nly merchants recording 17.1% annual growth, compared with 6.9% for the high
street / multichannel group.
Average YOY Growth
2010 2011 2012 2013 2014 2015
High St / Multichannel
+20.3% +25.3% +12.2% +17.6% +15.5% +6.9%
Online-only / Catalogue
+10.5% +15.6% +19.3% +17.6% +14.6% +17.1%
Chart 7: This table shows the average year-on-year growth recorded by each retail group since 2010
-5.00%
0.00%
5.00%
10.00%
15.00%
20.00%
25.00%
Jan-15 Feb-15 Mar-15 Apr-15 May-15 Jun-15 Jul-15 Aug-15 Sep-15 Oct-15 Nov-15 Dec-15
YOY Growth
High St / Multichannel Online-only / Catalogue
11 | www.imrg.org e-Retail Sales Index © - January 2016
Average Basket Values
Chart 8: This chart shows the average basket values for high st /multichannel and online-only / catalogue retailers (excluding
travel) during 2015
Excluding travel average basket values of high street / multichannel and online-only / catalogue retailers
was fairly consistent throughout the year, with the online-only £2 higher on average during 2015 (Chart
8). However, both groups’ average basket values are down on 2014 – 7% for the multichannel
merchants and 1% for the online-only group. Since 2010 ABVs have fallen 8% and 10%, respectively, for
these groups.
Overall e-retail average basket values fell 4% in 2015 to £78 from £81 in 2014, and are down 9% from an
average of £86 in 2010.
Average Basket Values (exc Travel)
2010 2011 2012 2013 2014 2015
High St / Multichannel
£84 £92 £84 £78 £83 £77
Online-only / Catalogue
£88 £78 £81 £78 £80 £79
Total e-Retail £86 £84 £82 £78 £81 £78
Chart 9: This table shows the average basket values recorded by each retail group (excluding Travel) since 2010
0.00
10.00
20.00
30.00
40.00
50.00
60.00
70.00
80.00
90.00
Jan-15 Feb-15 Mar-15 Apr-15 May-15 Jun-15 Jul-15 Aug-15 Sep-15 Oct-15 Nov-15 Dec-15
Average Basket Values
High St / Multichannel Online-only / Catalogue
12 | www.imrg.org e-Retail Sales Index © - January 2016
Total e-Retail
e-Retail excluding
Travel
Clothing Electricals Health & Beauty
Gifts
2010 £136 £86 £58 £171 £42 £51
2011 £136 £84 £52 £159 £41 £33
2012 £139 £82 £55 £158 £42 £32
2013 £128 £78 £59 £155 £41 £37
2014 £127 £81 £58 £156 £38 £37
2015 £126 £78 £57 £150 £37 £39
Chart 10: This table shows the average basket values since 2010 for the total e-retail market, e-retail excluding travel and selected
sectors since 2010
Average basket values continue to show a downward trend, with the overall ABV (excluding travel),
down 9% since 2010 – from £86 to £78 in 2015. The ABV in electricals and health & beauty has fallen
14% in the 5-year period, while gifts has recorded a 31% drop. The clothing sector has seen fairly
consistent average basket values, however the average in 2011 fell 12% from the previous year.
Chart 11: This chart shows the monthly average basket values for total e-retail and e-retail excluding travel since December 2009
13 | www.imrg.org e-Retail Sales Index © - January 2016
Conversion Rates
Looking at conversion rates for the online-only retailers, we can see the average rate has increased 17%
since 2010 – from 4.7% to 5.5% in 2015. Although, conversion rates are lower for high street /
multichannel retailers, the average for this group has increased 21% during the same period, from 3.4%
to 4.1%. The overall e-retail conversion rate reached 4.8% in 2015, up from 4.1% in 2010, representing a
rise of 17%.
Chart 12: This chart shows the average e-retail conversion rates for high st / multichannel and online-only / catalogue retailers
since 2012
Average Conversion Rates
2010 2011 2012 2013 2014 2015
High St / Multichannel
3.4% 3.3% 3.6% 3.8% 4.0% 4.1%
Online-only / Catalogue
4.7% 4.8% 4.4% 5.2% 5.4% 5.5%
Total e-Retail 4.1% 4.0% 4.0% 4.5% 4.6% 4.8% Chart 13: This table shows the average conversion rates for high st / multichannel and online-only / catalogue retailers since 2010
14 | www.imrg.org e-Retail Sales Index © - January 2016
Additional Content
Additional Index results, including supplementary charts and commentary are available on our website.
Please see links below:
Market Information Commentary and Graphs
Total Market Performance Average Basket values Channel performance (Pure Play v Multi Channel) Average Conversion Rates Market Sectors relative Performance
Sectors Information Commentary and Graphs
Accessories Beers, Wines and Spirits Electricals Footwear Gifts Health and Beauty Home and Garden
Lingerie Menswear Travel Womenswear
15 | www.imrg.org e-Retail Sales Index © - January 2016
IMRG Capgemini e-Retail Sales Index Sector Classification The IMRG Capgemini Index records UK online retail sales of the products and services listed in the Index Sector
Classification, as set out below.
INDEX SECTOR CLASSIFICATION These products and services bought online by UK consumers are
recorded by the IMRG Capgemini Index
EXCLUDED FROM INDEX Online spending by UK consumers of these items
is excluded from the IMRG Capgemini Index
Beer / wine / spirits Books CDs / tapes / records Clothing / footwear / accessories Computer hardware / peripherals / consumables Consumer electronics Digital downloads (e.g. music, software) Flowers Food, beverages and household supplies Furniture Garden / DIY Gifts Health and beauty Home appliances (e.g. washing machines) Household goods (e.g. kitchenware, bedding) Jewellery / watches Software Sporting goods Tickets (e.g. cinema, theatre, events) Toys Travel (e.g. flights, holidays, hotels, car hire) Video games Videos / DVDs
Adult Auctions Cars / motor vehicles Gambling Gaming Houses / real estate Telecom services Utilities (e.g. water, heating, electricity) Financial services, e.g. - CREDIT: mortgages, loans, credit cards, overdrafts - INVESTMENT: savings accounts, funds, stocks & shares, bonds, life assurance, pensions - INSURANCE: car, home, life
About the IMRG Capgemini Index:
The IMRG Capgemini Index tracks 'online sales', which we define as 'transactions completed fully, including payment, via interactive channels' from any location, including in-store. These sales are predominantly internet-based today, but the Index remains ready to record e-retail sales conducted via whatever interactive channels the market may embrace in the future.
Over one hundred e-retailers now regularly contribute data to the IMRG Capgemini Index, including: A. Hume Country Clothing, Amara, Appliance House, Arcadia Group (Burton, Top Man, Top Shop, Dorothy Perkins, Evans, Wallis, Miss Selfridge), Ask Direct, ASOS.com, B&Q, Ben Sherman, Berry Bros & Rudd, Blacks, Boden.co.uk, Boots, Brora, Buyagift.com, Carphone Warehouse, Charles Tyrwhitt, Clarks, Clinkards, Crocus.co.uk, Dabs.com, Damart, Debenhams, Deckers, Dunelm Mill, Effortless Skin, Ethical Superstore, Feelunique.com, Firebox, First Choice, Freemans Grattan Holdings (Freemans, Grattan, Look Again, Kaleidoscope, Curvissa, Swimear365, Witt International UK), Game, Get The Label, Greenfingers.com, House of Fraser, HouseTrip.co.uk, JD Sports, JD Williams, John Lewis Partnership, Ladderstore.com, Lakeland Furniture, Liz Earle, LK Bennett, M and M Direct, Made in Design, Majestic Wine, Marks & Spencer, Millets, Moss Bros, Naked Wines, NaturalCollection.com, New Look, Next, Notonthehighstreet.com, Oasis, PetPlanet.co.uk, PetsPyjamas.com, Prezzybox.com, QVC, River Island, Scales Express, Schuh, Scotlight Direct, Scott, Screwfix.com, Shoe-Shop.com, Shop Direct Home Shopping (Littlewoods, Very, Very Exclusive, Serenata Flowers, Silentnight, Size, Sofa and Home, Sparkling Strawberry, Sunshine.co.uk, Tesco.com, The Body Shop, The Great Gift Company, The Mat Factory, The White Company, TUI UK, Turton Wines, Universal Music, Waitrose, Within Home, Woods of Shropshire & Wynsors World of Shoes.
16 | www.imrg.org e-Retail Sales Index © - January 2016
Participation in the IMRG Capgemini Index is available to reputable e-retailers of all sizes. For further details, or to participate in the survey, please contact:
Tina Spooner Chief Information Officer IMRG Tel : +44 (0)203 696 0987 Email: [email protected]
*Estimate of Market Cash Value: 1 Index point currently = GBP £0.77 million
Please note that IMRG has rebased its Index-linked estimates of the UK e-retail market size downwards by 24.9%, and will no longer use Forrester Research’s IMRG Capgemini E-retail Sales Index Multiplier, which we have previously used to estimate the size of the UK e-retail market. IMRG’s own extensive research now provides the basis for the IMRG Index Multiplier, which has been rebased to: - 1 Index point = GBP 0.77 million.
The IMRG Capgemini Index is a trend line that represents the collective gross sales value of participating merchants. We attribute a cash value to an Index point - i.e. a 'multiplier', with which we estimate the market's cash value, month by month. To accommodate the fact that the overall internet shopping market's growth is greater than that of the Index group, as more merchants trade online, we have rebased the multiplier value from time to time:
- November 2008: 1 point = £0.77 million (IMRG) - May 2006: 1 point = £1.02 million (Forrester Research) - January 2005: 1 point = £0.87 million (Forrester Research) - February 2003: 1 point = £0.82 million (Forrester Research) - April 2000: 1 point = £0.8 million (Forrester Research)
We do not recalculate Index cash value estimates retrospectively, as this would skew the historical data.
17 | www.imrg.org e-Retail Sales Index © - January 2016
About IMRG: IMRG (Interactive Media in Retail Group) is the UK’s industry association for e-retail. Formed in 1990, IMRG is setting and maintaining pragmatic and robust e-retail standards to enable fast-track industry growth, and facilitates its community of members with practical help, information, tools, guidance and networking. Consumers can be confident when dealing with IMRG Members because all interact in an environment where they are encouraged to operate using methods that are Honest, Decent, Legal, Truthful and Fair, and have undertaken to not bring the industry into disrepute. The strength of IMRG is the collective and cooperative power of its members. For more information please visit http://www.imrg.org/ or email [email protected].
About Capgemini: With around 120,000 people in 40 countries, Capgemini is one of the world's foremost providers of consulting, technology and outsourcing services. The Group reported 2011 global revenues of EUR 9.7 billion. Together with its clients, Capgemini creates and delivers business and technology solutions that fit their needs and drive the results they want. A deeply multicultural organization, Capgemini has developed its own way of working, the Collaborative Business ExperienceTM, and draws on Rightshore®, its worldwide delivery model. Learn more about us at www.capgemini.com. Rightshore® is a trademark belonging to Capgemini.