Contents lists available at SciVerse ScienceDirect
Applied Soil Ecology
journa l h o me page: www.elsev ier .com/ locate /apsoi l
n an Ecuadorian pasture soil the growth of Setaria sphacelata, but not of soilicroorganisms, is co-limited by N and P
arin Potthast, Ute Hamer ∗, Franz Makeschinnstitute of Soil Science and Site Ecology, Dresden University of Technology, Pienner Str. 19, 01737 Tharandt, Germany
r t i c l e i n f o
rticle history:eceived 6 February 2012eceived in revised form 6 August 2012ccepted 7 August 2012
eywords:reaock phosphateetariaoil respirationrass yieldoil microbial community structure
a b s t r a c t
In the mountain rainforest region of southern Ecuador, soils of active pastures, established after slash-and-burn of the forest, are characterized by improved quantity and quality of soil organic matter favoringmicrobial conditions. However, these beneficial conditions decrease with increasing pasture age andburning frequency. As a consequence, rates of soil nutrient cycling decrease, supporting the infestationof bracken fern and, in turn, causing further decreases in pasture productivity. Finally, farmers are forcedto abandon the degraded pastures and to establish new ones by continuous deforestation. To investigatewhether an application of N and/or P nutrients to an extensively grazed pasture (active pasture) canimprove grass productivity and maintain soil fertility, a pasture fertilization experiment was conducted.On an active pasture site, planted with Setaria sphacelata, moderate rates of urea (50 kg N ha−1 a−1), rockphosphate (10 kg P ha−1 a−1), and a combination of both were applied. It was examined whether soilmineralization (gross and net N mineralization, SOC mineralization) and microbial community struc-ture (PLFA-analysis), as well as quantity and quality of the grass biomass, were affected by fertilization.Furthermore, the impact of fertilization on in situ soil respiration rates was studied. The combined appli-cation of urea and rock phosphate increased the pasture yield by 2 Mg ha−1 a−1 most efficiently, indicatinga co-limitation of growth. Additionally, the fodder quality was improved by a 67% higher content of Pand by a 7% higher content of Ca in the grass biomass compared to the control. While carbon, nitro-gen, and phosphorus in the microbial biomass remained unaffected and the microbial activity increasedonly temporarily, the relative abundance of fungi (18:2n6,9) increased significantly due to fertilizer addi-tion. Urea addition induced a short-lived increase in the in situ soil CO2-C effluxes, assuming a positive
priming effect due to an activation of soil microbes. In total, plots amended with urea emitted 0.8 Mg CO2-C ha−1 a−1 more than the control. Results reveal that already moderate fertilization significantly improvedpasture productivity and maintained soil quality. However, it is expected that higher loads of NP fertilizerwill increase pasture productivity at the expense of soil organic carbon sequestration due to enhancedsoil CO2-C losses. Hence, to establish a sustainable pasture management in the study region, the soil Cmanagement must also be carefully considered.
. Introduction
A continuous growth of the livestock sector, especially in theeotropics, still contributes to an extended establishment of pas-ures at the expense of highly diverse natural forests (FAO, 2009b;
ontagnini, 2008; Steinfeld and Wassenaar, 2007). In Ecuador, theroduction of milk—as one important livestock product—increased
nnually by 2.5% from 1.9 Mt (megatonnes) in 1995 to 2.6 Mt in007 (FAO, 2009b). As a consequence of increasing milk- andeat-demand by the growing Ecuadorian population, a disperse
expansion of pastures to the detriment of natural forests stillprevails in the Andean region (FAO, 2010; Mosandl et al., 2008;Rhoades and Coleman, 1999). Additionally, a severe degradationof pastures due to weed invasion (Dias-Filho et al., 2001) forcesfarmers to frequently burn and finally abandon these areas, and toconvert further natural forest for maintenance of their livestock.Neither practice is sustainable, since huge additional ecosystemlosses of C, nutrients, and mainly of biodiversity occur (Eastmondand Faust, 2006).
The main prerequisites for a sustainable management of alreadyexisting pastures are to optimize biomass yields and fodder quality
in the long-term while maintaining soil quality (Kibblewhite et al.,2008; Montagnini, 2008). For the productivity of livestock farm-ing, the maintenance of plant-available nutrients (PO4-P, NH4-N,NO3-N) in the soil is crucial, since milk production and livestock
ealth are subjected to N, P, and/or Ca uptake by the plant (fodderuality) (FAO, 2009a; Walker et al., 1997). Frequently, progressiveasture degradation is closely linked to soil N and/or P depletionsDias-Filho et al., 2001; Garcia-Montiel et al., 2000). Hence, mod-rate fertilization of pastures with limiting nutrients can be anlternative for maintaining soil quality.
Fertilizer application can have considerable feedback on theutrient dynamics of ecosystems (Vitousek et al., 2010), not onlyy increasing aboveground biomass production, but also by induc-
ng shifts in the soil microbial structure and function. With regardo the fertilization of grassland soils, contrasting effects on sapro-hytic fungal abundance have been reported for temperate regions,anging from increases (Bardgett et al., 1999a; Rousk and Baath,007) to decreases (Grayston et al., 2004) to no effect (Denef et al.,009; Veresoglou et al., 2011). The direction and intensity of shifts
n the microbial community structure depends on the form, length,nd load of fertilizer application (Bardgett et al., 1999b; Stricklandnd Rousk, 2010; Treseder, 2008). Fertilizer-induced changes in theoil pH (Rousk et al., 2011) or shifts in the plant species’ composi-ion and dominance (Patra et al., 2006; Veresoglou et al., 2011) arenown to affect soil microbial properties as well. Fertilization mayncrease the amount of easily available C, inducing additional lossesf soil C by an activation of soil microbes. This induced accelera-ion of soil organic carbon (SOC) mineralization, a so-called positiveriming effect (PE) (Blagodatskaya and Kuzyakov, 2008; Kuzyakovt al., 2000), may alter the net ecosystem C exchange (Reed et al.,011).
In the mountain rainforest region of southern Ecuador, the econ-my of the farmers is primarily based on cattle ranching (Pohle anderique, 2006), since alternative agricultural uses are unfavorableue to steep slopes and high precipitation. For pasture establish-ent by a slash-and-burn practice of natural forest, the C4-grass
etaria sphacelata [(Schumach) Stapf & C.E. Hubb.] is widely usedn the study area. Setaria is a tropical grass species from AfricaHacker and Jones, 1969) that was introduced in the region in thearly 1950s (Gerique, 2010). It is more resistant to uncontrolleduman-induced fires and best suited to the prevailing temperaturesnd high precipitations of the region (>750 mm a−1) (Dwivedi andumar, 1999). Further reasons for its preferential usage are rapidrowth and higher resistance to weed invasion compared to tradi-ional, mixed grass communities, attributable to its dense fine-rootystem (Rhoades et al., 2000). In the study area, soils of extensivelyrazed Setaria-pastures (referred to as active pastures) are charac-erized by increased stocks of total C, N, S, and P (Hamer et al., 2012)nd by a lower C/N ratio of SOM (Potthast et al., 2010, 2011) com-ared to the adjacent forest. As a consequence of an increased levelf labile C and N availability for soil microorganisms, the microbialctivity and growth were enhanced (Potthast et al., 2011). However,he availability of P (Bray-P) in particular is low in all soils (Hamert al., 2012) and, during pasture utilization, soil nutrient stockseplete. This depletion is connected with a decline in the pastureroductivity, facilitating the infestation of bracken fern (Pteridiumrachnoideum) (Hamer et al., 2012; Makeschin et al., 2008) andncreasing the area of abandoned pastureland in the study area. Atresent, 50% of the pastureland is severely invaded by bracken ornder different stages of succession (Göttlicher et al., 2009), which
s one major obstacle to productive livestock farming. Fertilizations not a common practice in the study area; however, it is expectedo sustain the competitiveness of pasture grass and prevent furtherasture degradation.
On an active pasture with low P availability, a fertilizationxperiment (rock phosphate (P), urea (N), combination (NP)) was
onducted to test the hypothesis that pasture productivity is P-imited and that fodder quality is improved by N fertilization. Its assumed that competitive relations between soil microbes andlants exist and, as a result, N- and P-uptake by grass plants is
ology 62 (2012) 103– 114
retarded due to microbial nutrient limitation and microbial advan-tage in competition. The specific objectives of this study were toexamine (1) whether an addition of P alone or in combinationwith N would enhance the incorporation of P into the microbialbiomass and/or increase the uptake of P by the Setaria-grass, (2)whether fertilization would stimulate the activity and growth ofsoil microbes and/or alter the structure of the microbial communityand, (3) whether fertilization might change soil respiration rates,altering the net C balance of the pasture ecosystem. To achieve theseobjectives, in situ soil respiration rates and soil biogeochemical vari-ables, as well as the quantity and quality of the Setaria-grass, wereanalyzed.
2. Materials and methods
2.1. Site of study and field experiment
The in situ fertilization trial was established on an active Setaria-pasture (25◦ slope) in the southern Ecuadorian Andes, in 2007.The site is situated 4 km to the east of the joint research stationEstación Científica San Francisco (ECSF) at about 2000 m asl. At theECSF (3◦58′S and 79◦04′W, alt. 1860 m asl), the mean annual airtemperature is 15.3 ◦C and mean annual precipitation is 2176 mm,without pronounced seasonality (Bendix et al., 2006). According tothe WRB of the FAO (2006), a Cambisol is the predominant regionalsoil type (Makeschin et al., 2008), which in the study area is mainlydeveloped from clay schist and metasiltstones. A Haplic Cambisol(Humic, Siltic) was classified on the site that is planted with thegrass S. sphacelata (Schumach.). This tropical grass species growsin monocultures covering 98% of the area (Fig. 1). Since pastureestablishment by slash and burn practice 17 years ago, the land hasbeen extensively grazed by dairy cattle with a livestock density ofone cow per hectare. No fertilizer had been used at this site priorto the study.
During 2008–2010, the influence of fertilization with nitrogen(N), with phosphorus (P), and with a combination of both (NP)on grass productivity and quality as well as on soil respirationand biogeochemical properties in relation to the unfertilized con-trol (X), was determined. Regionally available organic N-fertilizer(urea) and inorganic P-fertilizer (rock phosphate) was used inpowder form. For the N, P, and NP treatments, the fertilizer wasapplied at a moderate rate of 50 kg N ha−1 a−1, 10 kg P ha−1 a−1, and50 kg N + 10 kg P ha−1 a−1, respectively. Every year, fertilization wasevenly split into three applications, starting in February followedby June and October; since no pronounced seasonality exists, fertil-ization was carried out on days without rain. The pasture site wasfenced (0.5 ha) to prevent grazing by cattle. As displayed in Fig. 1,six replicate plots (25 m2 each) of each treatment were randomlyarranged in a four-block design in the fenced area. To impede leach-ing of fertilizer N into the unfertilized control (X) and P treatments,the latter were established above the N and NP treatments. Foreven distribution of low amounts of fertilizer, topsoil (0–20 cm) wasused as a carrier. The carrier topsoil was taken from the field priorto each fertilization, dried at 40 ◦C, and sieved. Each plot receivedfertilizer mixed with 500 g of topsoil; control plots received top-soil only. To apply the fertilizer homogenously by hand, the plotswere divided into four equal parts receiving the respective fertilizeramount individually.
The chemical composition of rock phosphate was characterizedby the same methods, as shown in Section 2.4, for soil analysis. Therock phosphate used, contains 12.7 g kg−1 of easily available PO4-P,
which is NH4F-extractable. The fertilizer is further characterizedby the following element contents: 311 g kg−1 Ca, 114 g kg−1 P,36 g kg−1 S, 10 g kg−1 C, 3.1 g kg−1 K as well as Mg, and 0.21 g kg−1 N.It is important to note that the Cd contents of 8.5 mg kg−1 are in the
K. Potthast et al. / Applied Soil Ecology 62 (2012) 103– 114 105
ure fe
l(
2
w(Pdtwmptr(drmwitopias1ifrtbpuatwwC
Fig. 1. Location of the past
ower range of values reported in the literature for rock phosphatesZapata and Roy, 2004).
.2. Soil respiration measurements
Weekly measurements (2008–2010) of in situ soil respirationere conducted on each plot with a portable IR gas analyzer
IRGA, EGM 4, PP Systems) connected to a closed chamber (SRC1,P Systems). Two circular polyethylene collars (height: 10 cm,iameter: 10 cm) were inserted 2 cm deep into the soil betweenhe grass tussocks at each plot. In total, 12 replicate measurementsere conducted per treatment. The collars were used as steadyeasurement points, accounting for spatial variations. To avoid
hotosynthesis, living aboveground biomass was clipped withinhe collars and removed prior to measurements. In parallel to theespiration measurements, soil temperature and soil moistureTheta Probe ML2, Delta T Devices Ltd, UK) were determined at 5 cmepth. In order to test the comparability of the plots, weekly soilespiration measurements had been conducted at each plot twoonths before the first fertilization. Since no significant differencesere determined in this time-interval, plots were used for compar-
son of soil CO2-C effluxes of different fertilizer treatments. Duringhe whole measurement period (2008–2010), plots were fertilizedn seven application dates, while collars were covered with alastic bag to avoid uncontrolled addition. The appropriate fertil-
zer amount was applied to the collars individually afterwards. Tossess the assumed short-term impact of fertilizer amendment onoil respiration rates, CO2-C measurements were carried out after
h, one, three, five, 12, and 20 days, followed by a regular weeklynterval. Estimations of additional short-lived CO2-C effluxes (=PE)or the first, third, and fifth day were made on the basis of theesults of a laboratory experiment by Hamer et al. (2009b). There,he fate of 14C-labeled urea into evolved CO2-C and into microbialiomass was tracked. The addition of 14C-labeled urea to theresent pasture soil (0–5 cm) resulted in a rapid mineralization ofrea-derived C by 81% after the first day and by an additional 1%fter the fourth day. Assuming that similar short-term mineraliza-
ion rates of urea-derived C were found in the field, the potential PEas calculated as follows: PE (%) = (Rurea − Rcontrol)/Rcontrol × 100,here Rurea and Rcontrol signify soil respiration rates (g CO2-
m−2 d−1) on the respective day of particular urea-amended plots
rtilization experiment site.
(N, NP) and of control plots (X), respectively. The PE for the firstday was deduced from the calculation of the mean soil respirationrate after the first hour and first day. PEs were only consideredif the amount of respired CO2-C of urea fertilized plots exceededthat of control plots by more than 0.5788 g C m−2 (81% of totalurea-C added by each application). The mean annual soil CO2-Cefflux of each treatment was extrapolated for the period June 2008to June 2010 using mean weekly rates (g CO2-C m−2 h−1), sinceno pronounced seasonality exists in the study area. Furthermore,mean annual soil CO2-C effluxes of the fertilizer treatments werecorrected by subtracting the amount of C applied to the fertilizer(urea: 0.021 Mg C ha−1 a−1, rock phosphate: 0.0002 Mg C ha−1 a−1).
2.3. Grass biomass quantity and quality
Before harvesting the total plots every three months, grass sam-ples were taken from each plot by clipping the grass to 3 cm withinthree randomly chosen squares (wooden frames of 50 cm × 50 cm).The cutting interval (ranging between 60 and 94 days) was chosento simulate the system of rotational grazing used by the regionalfarmers (personal communication). To calculate the yield of totaldry matter (DM), the grass samples were weighed after drying at40 ◦C.
An aliquot of each of the dried samples obtained over a periodof 12 months (from January 2009 to February 2010) was shreddedand ground to analyze (i) C and N with a CNS-analyzer (vario ELIII/elementar, Heraeus) and (ii) total amount of elements (e.g. Ca,K, Mg, P, S) by acid digestion (250 mg, 50 ml HNO3, 180 ◦C) (Miller,1998) and subsequent measurements by an inductively coupledplasma optical emission spectrometer (ICP-OES, CIROS, Spectro).The recovery of added N- and P-fertilizer in the grass biomass wascalculated according to the difference method described by Syerset al. (2008). The total amount of the respective nutrient storedin the grass biomass of the control plot was subtracted from thatof the fertilized plot, divided by the nutrient added annually, andexpressed as a percentage.
2.4. Soil sampling and analysis
The homogeneity of soil properties within the field trial hadbeen tested in 2007 before starting the fertilization period. Five
1 Soil Ec
secrtfpsbctw
sowaaastsaF1e(atGmw
2
m(ieadatst(dosr1ateNaTcle((cca
06 K. Potthast et al. / Applied
oil cores (6 cm diameter) were taken between grass tussocks atach plot, split into 0–5, 5–10 and 10–20 cm deep sections, and oneomposite sample was prepared by deep section and plot. Visibleoot fragments and stones were manually removed in the labora-ory. Two weeks after the second (June 2008) and fifth (June 2009)ertilization, all plots were re-sampled as described above. Basic soilarameters were determined for each sampling time and at eachampling depth. The whole spectrum of analyses including micro-ial community structure, as described in Section 2.5, was onlyarried out for the soil samples taken from 0 to 5 cm depth afterhe fifth fertilization in 2009, since the most pronounced effectsere expected at this depth interval.
Water content was determined by drying 5 g of each field-moistoil sample at 105 ◦C. For pH (H2O) analysis a ratio of soil to waterf 1:2.5 was used. An aliquot of dried soil as well as rock phosphateas ground to analyze the content of total C and N (TN) with a CNS-
nalyzer (vario EL III/elementar, Heraeus). Furthermore, the totalmount of elements (e.g.: Al, Ca, Fe, K, Mg, P, S) was determined bycid (HNO3, HF, HClO4) digestion (Kingston and Jassie, 1986) andubsequent ICP-OES (CIROS, Spectro) measurements. To determinehe readily available amounts of phosphorus (PO4-P) and of dis-olved organic carbon (DOC) as well as of dissolved organic (DON)nd inorganic nitrogen (DIN), different extracting agents were used.or DOC, DON, and DIN, 25 g of field-moist soil was extracted with00 ml of KCl (0.1 M), and for PO4-P 10 g of field-moist soil wasxtracted by 50 ml of Bray I solution (0.03 M NH4F + 0.025 M HCl)Bray and Kurtz, 1945). The respective extracts were analyzed formmonium (NH4-N), nitrate (NO3-N) and phosphate concentra-ions by a continuous-flow auto analyzer (Skalar Analytik GmbH,ermany). DOC and total dissolved N (TDN) in the KCl extracts wereeasured by a multi-NC-analyzer (Analytik Jena, Germany). DONas calculated by subtracting NH4
+-N and NO3−-N from TDN.
.5. Soil microbial properties
C mineralization and net N mineralization rates were deter-ined by incubation of field-moist soil (25 g) in glass bottles
Schott Duran®, Germany) at 22 ◦C for 14 days in darkness. Duringncubation, soil C mineralization was quantified by trappingvolved CO2 in 0.1 M NaOH, precipitation with BaCl2, and titrationgainst 0.1 M HCl. Concentrations of NH4
+-N and NO3−-N were
etermined before and at the end of the incubation, as describedbove. Rates of net N mineralization were calculated by subtractinghe sum of the initial concentrations (NH4
+-N + NO3−-N) from the
um of the final concentrations (after 14 days). Gross N mineraliza-ion rates were determined by a 15N-isotope pool dilution methodBarraclough, 1995) after the fifth fertilization (0–5, 5–10 cm soilepth). In duplicate, each field-moist sample (25 g) received 0.5 mlf a solution containing 5 mg NH4-N per mg of total N in theample as (15NH4)2SO4 (1.5 atom% 15N). After 1 h and after 24 h,espectively, one of the duplicate samples was extracted with00 ml of KCl solution (0.1 M) to analyze NH4
+-N concentrations,s described in Section 2.4. The 15N-diffusion procedure, accordingo Mulvaney et al. (1997), which is described in detail by Hamert al. (2009a), was utilized to determine the isotope ratio ofH4
+-N. The enrichment of 15N was quantified by an elementalnalyzer coupled to an isotope-ratio mass spectrometer (EA-IRMS,hermoFinnigan Deltaplus). Gross N mineralization and gross NH4onsumption (NH4 immobilization plus nitrification) were calcu-ated according to Wessel and Tietema (1992). According to Vancet al. (1987) soil microbial biomass carbon (MBC) and nitrogenMBN) were determined by 0.5 M K2SO4 fumigation–extraction
1:5 soil:solution ratio). The extracts were analyzed for C and Nontent by a multi-NC-Analyzer (Analytik Jena, Germany) and foralculation the conversion factors of kEC = 0.43 (Martens, 1995)nd kEN = 0.45 (Jenkinson et al., 2004) were applied. Soil microbial
ology 62 (2012) 103– 114
biomass phosphorus (MBP) was determined by 0.03 M NH4F and0.025 M HCl fumigation–extraction at a soil:solution ratio of 1:5(Chen and He, 2004). Adsorption of phosphate in the soil sampleswas determined according to Brookes et al. (1982) and taken intoaccount when amounts of MBP were calculated. A conversionfactor kEP of 0.4 was applied (Brookes et al., 1982).
According to Zelles (1995), the analysis of total phospho-lipid fatty acid (PLFAtot) was carried out for the first soil depthinterval (0–5 cm) after the fifth fertilization trial. Fresh soil sam-ples (equivalent to 6.25 g dry-weight) were extracted with achloroform:methanol:phosphate buffer (1:2:0.8). On a silicic acidcartridge (2 g/12 ml, Mega Bond Elut, Varian) phospholipids wereseparated from neutral lipids and glycolipids. The phospho-lipids were subjected to a mild alkaline methanolysis. Using anaminopropyl cartridge (0.5 g/3 ml), the unsubstituted fatty acidmethylesters (FAME) were separated from the hydroxy substitutedones and the unsaponifiable lipids. Then the unsubstituted FAMEswere separated according to their degree of saturation (saturated,mono-unsaturated and polyunsaturated fatty acid fractions) witha benzenesulfonylpropyl cartridge (0.5 g/3 ml, Varian). Each frac-tion was analyzed by GC (GC 2010, Shimadzu) equipped with FIDand a polar column (0.25 �m film, 30 m × 0.25 mm, SGE, BPX70).A more detailed description of the applied temperature programand the referencing against internal standards is given in Hameret al. (2007). Particular identified PLFAs (30 in total) were assignedto specific microbial groups. Gram-negative bacteria were repre-sented by the fatty acids of cy17:0, cy19:0, 16:1n7c, 18:1n7c and18:1n9c, Gram-positive bacteria by i15:0, a15:0, i16:0 and i17:0,actinomycetes by 10Me16:0 and 10Me18:0, fungi by 18:2n6,9c and18:2n6,9t, and protozoa by 20:4 (Ratledge and Wilkinson, 1988;Zelles, 1999).
2.6. Statistics
A linear mixed-effects model (LMM) procedure, using restrictedmaximum likelihood (REML) to calculate variance components,was conducted by SPSS 19.0 (Statistics, 2010) to analyze the impactof urea- (N) and rock phosphate-fertilization (P) on soil biochem-ical properties, including soil depth (0–5, 5–10, 10–20 cm) andtime (2008, 2009) as repeated measures. N, P, time and soil depthalong with their interactions (N × P; soil depth × time; time × N andtime × P) were modeled as fixed effects and block (1–6) as ran-dom effect contributing only to the covariance structure of the data(Piepho et al., 2003). As repeated covariance type “Compound sym-metry” was used, which assumes the pre post measures to havea constant variance at each time point and a constant covariancebetween measurement times. Furthermore, LMM was used to ana-lyze the impact of fertilization (N, P, N × P as fixed effects) on soilmicrobial properties (0–5 cm, 2009), on in situ soil respiration ratesas well as on grass biomass characteristics (2009–2010) includingblock as a random effect. When significant impacts of fixed effectson variables were displayed by the model procedure, pair-wisepost hoc comparisons of means were made using the Tukey-testat a probability level of p < 0.05. Prior to the mixed model analy-ses, the Shapiro–Wilk test was used to test the normality of thedatasets. Not normally distributed datasets were log transformedto meet normality, and PLFAs mol%-data were transformed by anarcsine transformation. Data are illustrated in box-plot diagramssignifying median (line), upper and lower quartiles (box), mini-mum and maximum values (whiskers), as well as outliers (points)(StatSoft, 2009). A redundancy analysis (RDA) was conducted withCanoco 4.5 for Windows (ter Braak and Smilauer, 2002) to elucidate
the relationship among the soil microbial community structureof different fertilizer treatments (0–5 cm depth) and respectivesoil biogeochemical variables (included as so-called environmen-tal variables). Based on the Monte Carlo Permutation test (499
K. Potthast et al. / Applied Soil Ecology 62 (2012) 103– 114 107
Table 1Results (F values, significance, degree of freedom (df), and error of df (dfRes)) of a linear mixed model procedure testing the effects of the application of urea (N) and rockphosphate (P), and their interaction (N × P) on soil properties including soil depth (0–5, 5–10, 10–20 cm) and time (2008, 2009) as repeated measures and block (1–6) asrandom effect. In addition, the effects of time on soil depth (soil depth × time) and on fertilization (N × time, P × time) are given.
F value after fertilization
N P N × P Soil depth Time Soil depth × time N × time P × time
* Statistical significance at the 0.05 level.** Statistical significance at the 0.01 level.
*** Statistical significance at the 0.001 level.
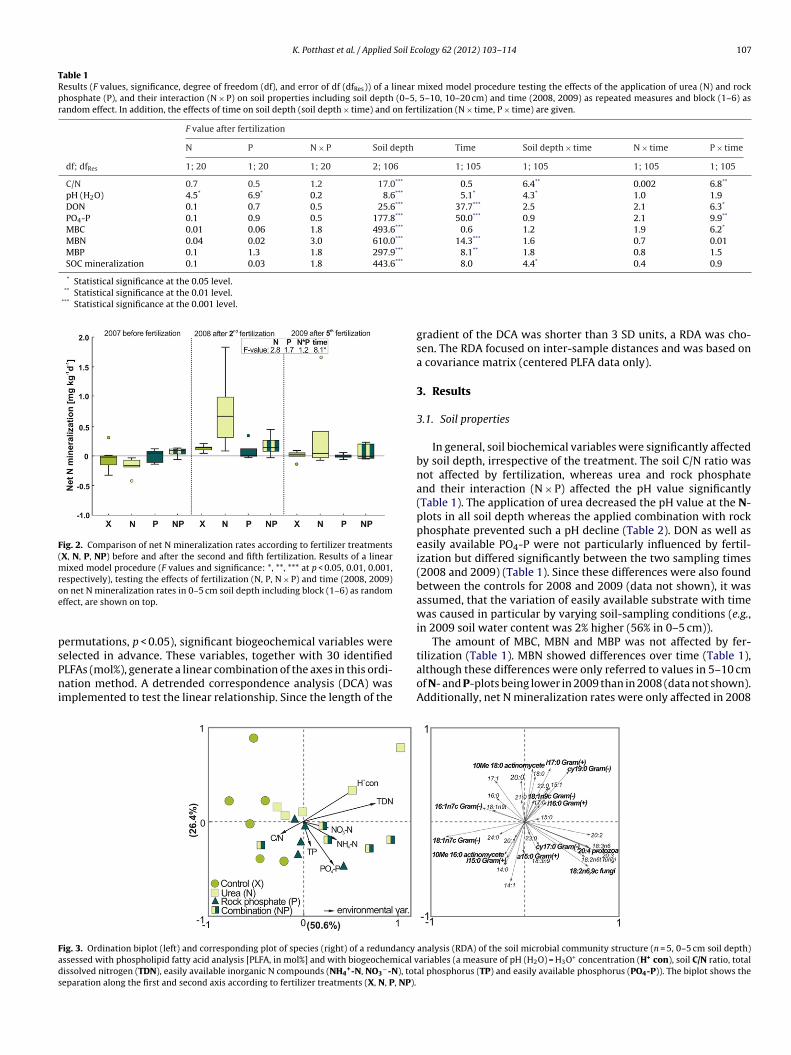
Fig. 2. Comparison of net N mineralization rates according to fertilizer treatments(X, N, P, NP) before and after the second and fifth fertilization. Results of a linearmixed model procedure (F values and significance: *, **, *** at p < 0.05, 0.01, 0.001,respectively), testing the effects of fertilization (N, P, N × P) and time (2008, 2009)oe
psPni
tilization (Table 1). MBN showed differences over time (Table 1),
Fads
n net N mineralization rates in 0–5 cm soil depth including block (1–6) as randomffect, are shown on top.
ermutations, p < 0.05), significant biogeochemical variables wereelected in advance. These variables, together with 30 identified
LFAs (mol%), generate a linear combination of the axes in this ordi-ation method. A detrended correspondence analysis (DCA) was
mplemented to test the linear relationship. Since the length of the
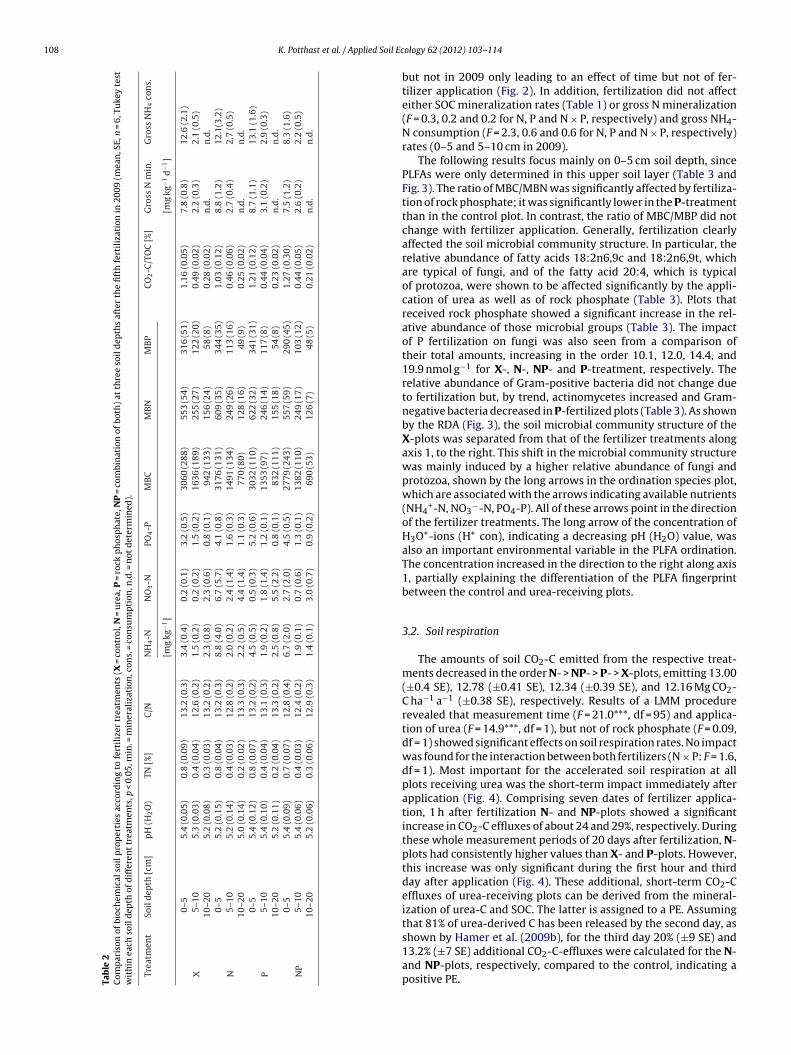
ig. 3. Ordination biplot (left) and corresponding plot of species (right) of a redundancy
ssessed with phospholipid fatty acid analysis [PLFA, in mol%] and with biogeochemical vissolved nitrogen (TDN), easily available inorganic N compounds (NH4
+-N, NO3−-N), tot
eparation along the first and second axis according to fertilizer treatments (X, N, P, NP).
gradient of the DCA was shorter than 3 SD units, a RDA was cho-sen. The RDA focused on inter-sample distances and was based ona covariance matrix (centered PLFA data only).
3. Results
3.1. Soil properties
In general, soil biochemical variables were significantly affectedby soil depth, irrespective of the treatment. The soil C/N ratio wasnot affected by fertilization, whereas urea and rock phosphateand their interaction (N × P) affected the pH value significantly(Table 1). The application of urea decreased the pH value at the N-plots in all soil depth whereas the applied combination with rockphosphate prevented such a pH decline (Table 2). DON as well aseasily available PO4-P were not particularly influenced by fertil-ization but differed significantly between the two sampling times(2008 and 2009) (Table 1). Since these differences were also foundbetween the controls for 2008 and 2009 (data not shown), it wasassumed, that the variation of easily available substrate with timewas caused in particular by varying soil-sampling conditions (e.g.,in 2009 soil water content was 2% higher (56% in 0–5 cm)).
The amount of MBC, MBN and MBP was not affected by fer-
although these differences were only referred to values in 5–10 cmof N- and P-plots being lower in 2009 than in 2008 (data not shown).Additionally, net N mineralization rates were only affected in 2008
analysis (RDA) of the soil microbial community structure (n = 5, 0–5 cm soil depth)ariables (a measure of pH (H2O) = H3O+ concentration (H+ con), soil C/N ratio, totalal phosphorus (TP) and easily available phosphorus (PO4-P)). The biplot shows the
108 K. Potthast et al. / Applied Soil Ec
Tab
le
2C
omp
aris
on
of
bioc
hem
ical
soil
pro
per
ties
acco
rdin
g
to
fert
iliz
er
trea
tmen
ts
(X
=
con
trol
, N
=
ure
a,
P
=
rock
ph
osp
hat
e,
NP
=
com
bin
atio
n
of
both
)
at
thre
e
soil
dep
ths
afte
r
the
fift
h
fert
iliz
atio
n
in
2009
(mea
n, S
E,
n
= 6,
Tuke
y
test
wit
hin
each
soil
dep
th
of
dif
fere
nt
trea
tmen
ts, p
<
0.05
, min
. =
min
eral
izat
ion
, con
s.
=
con
sum
pti
on, n
.d. =
not
det
erm
ined
).
Trea
tmen
t
Soil
dep
th
[cm
]
pH
(H2O
)
TN
[%]
C/N
NH
4-N
NO
3-N
PO4-P
MB
C
MB
N
MB
P
CO
2-C
/TO
C
[%]
Gro
ss
N
min
.
Gro
ss
NH
4co
ns.
[mg
kg−1
]
[mg
kg−1
d−1
]
X0–
5
5.4
(0.0
5)
0.8
(0.0
9)
13.2
(0.3
)
3.4
(0.4
)
0.2
(0.1
)
3.2
(0.5
)
3060
(288
)
553
(54)
316
(51)
1.16
(0.0
5)
7.8
(0.8
) 12
.6
(2.1
)5–
10
5.3
(0.0
3)
0.4
(0.0
4)
12.6
(0.2
)
1.5
(0.2
)
0.2
(0.2
)
1.5
(0.2
)
1636
(189
)
255
(27)
122
(20)
0.49
(0.0
2)
2.2
(0.3
)
2.1
(0.5
)10
–20
5.2
(0.0
8)
0.3
(0.0
3)
13.2
(0.2
)
2.3
(0.8
)
2.3
(0.6
)
0.8
(0.1
)
942
(133
)
156
(24)
58
(8)
0.28
(0.0
2)
n.d
. n
.d.
N0–
55.
2
(0.1
5)
0.8
(0.0
4)
13.2
(0.3
)
8.8
(4.0
)
6.7
(5.7
)
4.1
(0.8
)
3176
(131
)
609
(35)
344
(35)
1.03
(0.1
2)
8.8
(1.2
)
12.1
(3.2
)5–
10
5.2
(0.1
4)
0.4
(0.0
3)
12.8
(0.2
)
2.0
(0.2
)
2.4
(1.4
)
1.6
(0.3
)
1491
(134
)
249
(26)
113
(16)
0.46
(0.0
6)
2.7
(0.4
)
2.7
(0.5
)10
–20
5.0
(0.1
4)
0.2
(0.0
2)
13.3
(0.3
)
2.2
(0.5
)
4.4
(1.4
)
1.1
(0.3
)
770
(80)
128
(16)
49
(9)
0.25
(0.0
2)
n.d
.
n.d
.
P0–
5
5.4
(0.1
2)
0.8
(0.0
7)
13.2
(0.2
)
4.5
(0.5
)
0.5
(0.3
)
5.2
(0.6
)
3032
(110
)
622
(32)
341
(31)
1.21
(0.1
2)
8.7
(1.1
)
13.1
(1.6
)5–
10
5.4
(0.1
0)
0.4
(0.0
4)
13.1
(0.3
)
1.9
(0.2
)
1.8
(1.4
)
1.2
(0.1
)
1353
(97)
246
(14)
117
(8)
0.44
(0.0
4)
3.1
(0.2
)
2.9
(0.3
)10
–20
5.2
(0.1
1)
0.2
(0.0
4)
13.3
(0.2
)
2.5
(0.8
)
5.5
(2.2
)
0.8
(0.1
)
832
(111
)
155
(18)
54
(8)
0.23
(0.0
2)
n.d
.
n.d
.
NP
0–5
5.4
(0.0
9)
0.7
(0.0
7)
12.8
(0.4
)
6.7
(2.0
)
2.7
(2.0
)
4.5
(0.5
)
2779
(243
)
557
(59)
290
(45)
1.27
(0.3
0)
7.5
(1.2
)
8.3
(1.6
)5–
10
5.4
(0.0
6)
0.4
(0.0
3)
12.4
(0.2
)
1.9
(0.1
)
0.7
(0.6
)
1.3
(0.1
)
1382
(110
)
249
(17)
103
(12)
0.44
(0.0
5)
2.6
(0.2
)
2.2
(0.5
)10
–20
5.2
(0.0
6)
0.3
(0.0
6)
12.9
(0.3
)
1.4
(0.1
)
3.0
(0.7
)
0.9
(0.2
)
690
(53)
126
(7)
48
(5)
0.21
(0.0
2)
n.d
.
n.d
.
ology 62 (2012) 103– 114
but not in 2009 only leading to an effect of time but not of fer-tilizer application (Fig. 2). In addition, fertilization did not affecteither SOC mineralization rates (Table 1) or gross N mineralization(F = 0.3, 0.2 and 0.2 for N, P and N × P, respectively) and gross NH4-N consumption (F = 2.3, 0.6 and 0.6 for N, P and N × P, respectively)rates (0–5 and 5–10 cm in 2009).
The following results focus mainly on 0–5 cm soil depth, sincePLFAs were only determined in this upper soil layer (Table 3 andFig. 3). The ratio of MBC/MBN was significantly affected by fertiliza-tion of rock phosphate; it was significantly lower in the P-treatmentthan in the control plot. In contrast, the ratio of MBC/MBP did notchange with fertilizer application. Generally, fertilization clearlyaffected the soil microbial community structure. In particular, therelative abundance of fatty acids 18:2n6,9c and 18:2n6,9t, whichare typical of fungi, and of the fatty acid 20:4, which is typicalof protozoa, were shown to be affected significantly by the appli-cation of urea as well as of rock phosphate (Table 3). Plots thatreceived rock phosphate showed a significant increase in the rel-ative abundance of those microbial groups (Table 3). The impactof P fertilization on fungi was also seen from a comparison oftheir total amounts, increasing in the order 10.1, 12.0, 14.4, and19.9 nmol g−1 for X-, N-, NP- and P-treatment, respectively. Therelative abundance of Gram-positive bacteria did not change dueto fertilization but, by trend, actinomycetes increased and Gram-negative bacteria decreased in P-fertilized plots (Table 3). As shownby the RDA (Fig. 3), the soil microbial community structure of theX-plots was separated from that of the fertilizer treatments alongaxis 1, to the right. This shift in the microbial community structurewas mainly induced by a higher relative abundance of fungi andprotozoa, shown by the long arrows in the ordination species plot,which are associated with the arrows indicating available nutrients(NH4
+-N, NO3−-N, PO4-P). All of these arrows point in the direction
of the fertilizer treatments. The long arrow of the concentration ofH3O+-ions (H+ con), indicating a decreasing pH (H2O) value, wasalso an important environmental variable in the PLFA ordination.The concentration increased in the direction to the right along axis1, partially explaining the differentiation of the PLFA fingerprintbetween the control and urea-receiving plots.
3.2. Soil respiration
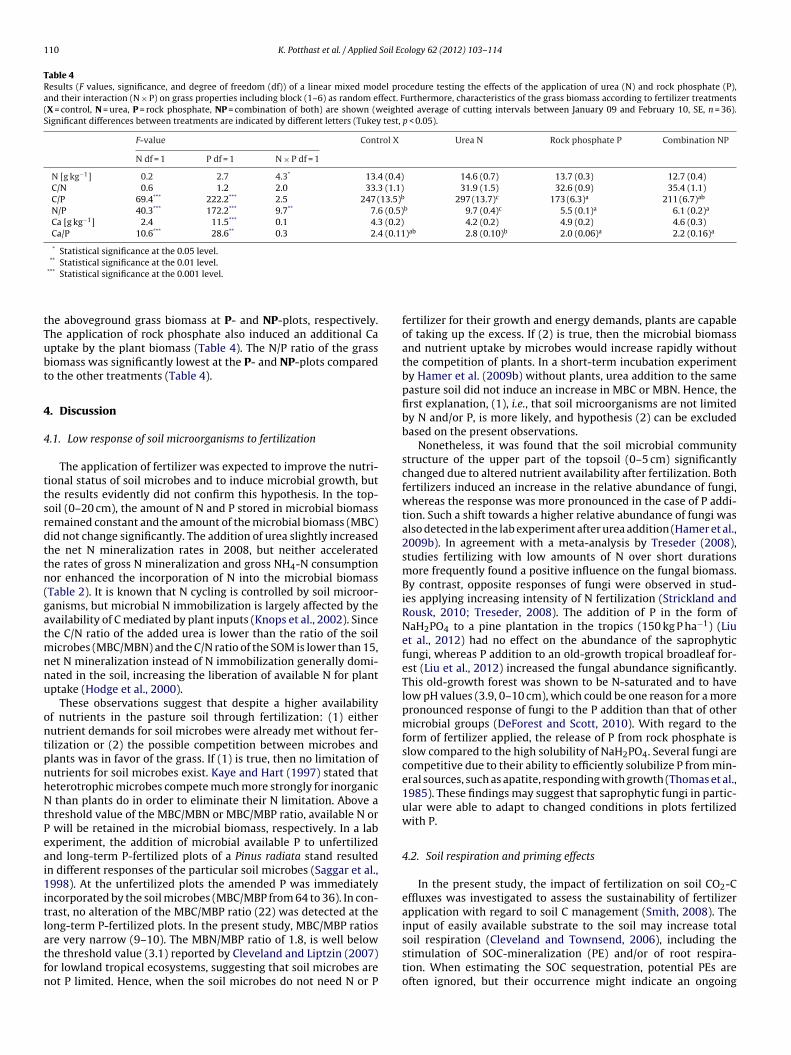
The amounts of soil CO2-C emitted from the respective treat-ments decreased in the order N- > NP- > P- > X-plots, emitting 13.00(±0.4 SE), 12.78 (±0.41 SE), 12.34 (±0.39 SE), and 12.16 Mg CO2-C ha−1 a−1 (±0.38 SE), respectively. Results of a LMM procedurerevealed that measurement time (F = 21.0***, df = 95) and applica-tion of urea (F = 14.9***, df = 1), but not of rock phosphate (F = 0.09,df = 1) showed significant effects on soil respiration rates. No impactwas found for the interaction between both fertilizers (N × P: F = 1.6,df = 1). Most important for the accelerated soil respiration at allplots receiving urea was the short-term impact immediately afterapplication (Fig. 4). Comprising seven dates of fertilizer applica-tion, 1 h after fertilization N- and NP-plots showed a significantincrease in CO2-C effluxes of about 24 and 29%, respectively. Duringthese whole measurement periods of 20 days after fertilization, N-plots had consistently higher values than X- and P-plots. However,this increase was only significant during the first hour and thirdday after application (Fig. 4). These additional, short-term CO2-Ceffluxes of urea-receiving plots can be derived from the mineral-ization of urea-C and SOC. The latter is assigned to a PE. Assumingthat 81% of urea-derived C has been released by the second day, as
shown by Hamer et al. (2009b), for the third day 20% (±9 SE) and13.2% (±7 SE) additional CO2-C-effluxes were calculated for the N-and NP-plots, respectively, compared to the control, indicating apositive PE.
K. Potthast et al. / Applied Soil Ecology 62 (2012) 103– 114 109
Table 3Results (F values, significance, and degree of freedom (df)) of a linear mixed model procedure testing the effects of the application of urea (N) and rock phosphate (P), andtheir interaction (N × P) on soil microbial properties (0–5 cm, 2009) including block (1–6) as random effect. In addition, means of soil microbial properties (0–5 cm, SE, n = 6)according to fertilizer treatments (X = control, N = urea, P = rock phosphate, NP = combination of both) after the 5th (2009) fertilization are shown. Significant differencesbetween treatments are indicated by different letters (Tukey test, p < 0.05).
F-value Control X Urea N Rock phosphate P Combination NP
* Statistical significance at the 0.05 level.** Statistical significance at the 0.01 level.
*** Statistical significance at the 0.001 level.
Fig. 4. Mean short-term CO2-C effluxes of different fertilizer treatments after 1 h,one, three, fifth, 12, and 20 days of seven fertilizer applications between 2008 and2010. Significant differences between fertilizer treatments (X, N, P, NP) at eachtime-point are indicated by different letters (Tukey test, p < 0.05). Grey line indicatesmean value of control plots (X) within the whole measurement period (2008–2010,n = 104). Results of a linear mixed model procedure (F values and significance: *,**, *** at p < 0.05, 0.01, 0.001, respectively), testing the effects of fertilization (N, P,N × P, df = 1) and time0.04–20d (between 0.04 and 20 days, df = 5) on short-term soilrespiration including block (1–6) as random effect, are shown on top right.
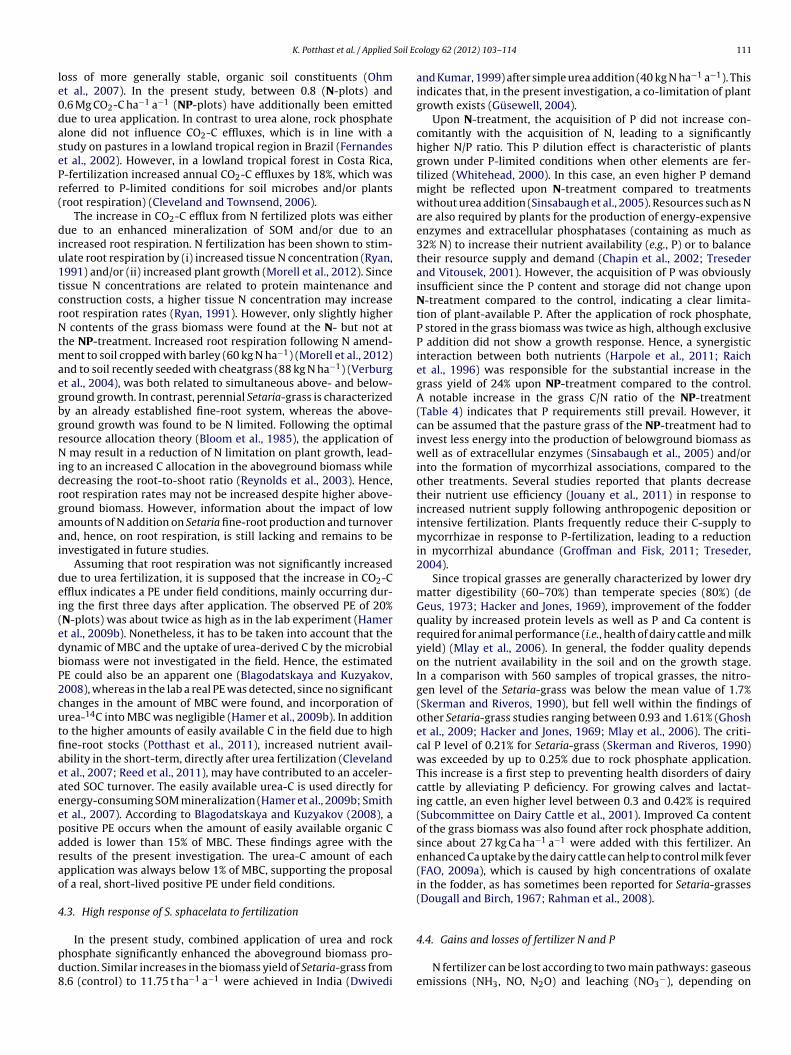
Fig. 5. (A) Weighted average of specific cutting intervals of grass biomass yield and corretreatments (X, N, P, NP) between January 2009 and February 2010 (n = 36), one year aftprocedure (F values and significance: *, **, *** at p < 0.05, 0.01, 0.001, respectively), testingas random effect, are shown on top.
3.3. Plant biomass
Between January 2009 and February 2010 the highest yield ofSetaria-grass biomass was obtained by application of both, ureaand rock phosphate (NP-plots), which increased the yield by about2 Mg ha−1 a−1, followed by N- > P- > and X-treatments (Fig. 5A).Characteristics of the grass biomass were not only significantlyaffected by fertilization but also by cutting interval. To adjust fordifferences due to the respective period of grass growth, all grassproperties were shown on a weighted average basis (Table 4 andFig. 5). Results of a LMM procedure revealed that biomass yield wasnot significantly affected by fertilizer application, however ureaapplication showed a positive effect on biomass yield and narrowlymissed the significance threshold (p = 0.063) (Fig. 5A). The nitrogenstock (kg ha−1 a−1) increased in both treatments with urea (Fig. 5B).Different factors contributed to this result. A higher N content at theN-plots (Table 4) and a significantly higher biomass at the NP-plotswere mainly responsible for the respective increase in the nitro-gen stock. According to the difference method (Syers et al., 2008),36–43% N of annually added urea were additionally stored in theaboveground grass biomass.
Plots receiving rock phosphate showed a significantly higher P-uptake by the grass biomass (Fig. 5C) which was also seen by asignificantly lower C/P, N/P and Ca/P ratio (Table 4). The phospho-
rus concentration of the grass biomass increased from 1.5, 1.8, 2.1to 2.5 g kg−1 DM for N-, X-, P- and NP-plots, respectively. Accord-ing to the difference method by Syers et al. (2008) 62% and 69%of annually added P by rock phosphate were additionally stored in
sponding (B) total nitrogen and (C) total phosphorus content according to fertilizerer the beginning of fertilization (February 2008). Results of a linear mixed model
the effects of fertilization (N, P, N × P) on biomass properties including block (1–6)
110 K. Potthast et al. / Applied Soil Ecology 62 (2012) 103– 114
Table 4Results (F values, significance, and degree of freedom (df)) of a linear mixed model procedure testing the effects of the application of urea (N) and rock phosphate (P),and their interaction (N × P) on grass properties including block (1–6) as random effect. Furthermore, characteristics of the grass biomass according to fertilizer treatments(X = control, N = urea, P = rock phosphate, NP = combination of both) are shown (weighted average of cutting intervals between January 09 and February 10, SE, n = 36).Significant differences between treatments are indicated by different letters (Tukey test, p < 0.05).
F-value Control X Urea N Rock phosphate P Combination NP
Statistical significance at the 0.01 level.*** Statistical significance at the 0.001 level.
he aboveground grass biomass at P- and NP-plots, respectively.he application of rock phosphate also induced an additional Captake by the plant biomass (Table 4). The N/P ratio of the grassiomass was significantly lowest at the P- and NP-plots comparedo the other treatments (Table 4).
. Discussion
.1. Low response of soil microorganisms to fertilization
The application of fertilizer was expected to improve the nutri-ional status of soil microbes and to induce microbial growth, buthe results evidently did not confirm this hypothesis. In the top-oil (0–20 cm), the amount of N and P stored in microbial biomassemained constant and the amount of the microbial biomass (MBC)id not change significantly. The addition of urea slightly increasedhe net N mineralization rates in 2008, but neither acceleratedhe rates of gross N mineralization and gross NH4-N consumptionor enhanced the incorporation of N into the microbial biomassTable 2). It is known that N cycling is controlled by soil microor-anisms, but microbial N immobilization is largely affected by thevailability of C mediated by plant inputs (Knops et al., 2002). Sincehe C/N ratio of the added urea is lower than the ratio of the soil
icrobes (MBC/MBN) and the C/N ratio of the SOM is lower than 15,et N mineralization instead of N immobilization generally domi-ated in the soil, increasing the liberation of available N for plantptake (Hodge et al., 2000).
These observations suggest that despite a higher availabilityf nutrients in the pasture soil through fertilization: (1) eitherutrient demands for soil microbes were already met without fer-ilization or (2) the possible competition between microbes andlants was in favor of the grass. If (1) is true, then no limitation ofutrients for soil microbes exist. Kaye and Hart (1997) stated thateterotrophic microbes compete much more strongly for inorganic
than plants do in order to eliminate their N limitation. Above ahreshold value of the MBC/MBN or MBC/MBP ratio, available N or
will be retained in the microbial biomass, respectively. In a labxperiment, the addition of microbial available P to unfertilizednd long-term P-fertilized plots of a Pinus radiata stand resultedn different responses of the particular soil microbes (Saggar et al.,998). At the unfertilized plots the amended P was immediately
ncorporated by the soil microbes (MBC/MBP from 64 to 36). In con-rast, no alteration of the MBC/MBP ratio (22) was detected at theong-term P-fertilized plots. In the present study, MBC/MBP ratios
re very narrow (9–10). The MBN/MBP ratio of 1.8, is well belowhe threshold value (3.1) reported by Cleveland and Liptzin (2007)or lowland tropical ecosystems, suggesting that soil microbes areot P limited. Hence, when the soil microbes do not need N or P
fertilizer for their growth and energy demands, plants are capableof taking up the excess. If (2) is true, then the microbial biomassand nutrient uptake by microbes would increase rapidly withoutthe competition of plants. In a short-term incubation experimentby Hamer et al. (2009b) without plants, urea addition to the samepasture soil did not induce an increase in MBC or MBN. Hence, thefirst explanation, (1), i.e., that soil microorganisms are not limitedby N and/or P, is more likely, and hypothesis (2) can be excludedbased on the present observations.
Nonetheless, it was found that the soil microbial communitystructure of the upper part of the topsoil (0–5 cm) significantlychanged due to altered nutrient availability after fertilization. Bothfertilizers induced an increase in the relative abundance of fungi,whereas the response was more pronounced in the case of P addi-tion. Such a shift towards a higher relative abundance of fungi wasalso detected in the lab experiment after urea addition (Hamer et al.,2009b). In agreement with a meta-analysis by Treseder (2008),studies fertilizing with low amounts of N over short durationsmore frequently found a positive influence on the fungal biomass.By contrast, opposite responses of fungi were observed in stud-ies applying increasing intensity of N fertilization (Strickland andRousk, 2010; Treseder, 2008). The addition of P in the form ofNaH2PO4 to a pine plantation in the tropics (150 kg P ha−1) (Liuet al., 2012) had no effect on the abundance of the saprophyticfungi, whereas P addition to an old-growth tropical broadleaf for-est (Liu et al., 2012) increased the fungal abundance significantly.This old-growth forest was shown to be N-saturated and to havelow pH values (3.9, 0–10 cm), which could be one reason for a morepronounced response of fungi to the P addition than that of othermicrobial groups (DeForest and Scott, 2010). With regard to theform of fertilizer applied, the release of P from rock phosphate isslow compared to the high solubility of NaH2PO4. Several fungi arecompetitive due to their ability to efficiently solubilize P from min-eral sources, such as apatite, responding with growth (Thomas et al.,1985). These findings may suggest that saprophytic fungi in partic-ular were able to adapt to changed conditions in plots fertilizedwith P.
4.2. Soil respiration and priming effects
In the present study, the impact of fertilization on soil CO2-Ceffluxes was investigated to assess the sustainability of fertilizerapplication with regard to soil C management (Smith, 2008). Theinput of easily available substrate to the soil may increase total
soil respiration (Cleveland and Townsend, 2006), including thestimulation of SOC-mineralization (PE) and/or of root respira-tion. When estimating the SOC sequestration, potential PEs areoften ignored, but their occurrence might indicate an ongoing
Soil Ec
le0dasePr(
diu1tcrNtmaegbgrNidrgaai
dei(edbP2cutfiaeaeeparao
4
pd8
K. Potthast et al. / Applied
oss of more generally stable, organic soil constituents (Ohmt al., 2007). In the present study, between 0.8 (N-plots) and.6 Mg CO2-C ha−1 a−1 (NP-plots) have additionally been emittedue to urea application. In contrast to urea alone, rock phosphatelone did not influence CO2-C effluxes, which is in line with atudy on pastures in a lowland tropical region in Brazil (Fernandest al., 2002). However, in a lowland tropical forest in Costa Rica,-fertilization increased annual CO2-C effluxes by 18%, which waseferred to P-limited conditions for soil microbes and/or plantsroot respiration) (Cleveland and Townsend, 2006).
The increase in CO2-C efflux from N fertilized plots was eitherue to an enhanced mineralization of SOM and/or due to an
ncreased root respiration. N fertilization has been shown to stim-late root respiration by (i) increased tissue N concentration (Ryan,991) and/or (ii) increased plant growth (Morell et al., 2012). Sinceissue N concentrations are related to protein maintenance andonstruction costs, a higher tissue N concentration may increaseoot respiration rates (Ryan, 1991). However, only slightly higher
contents of the grass biomass were found at the N- but not athe NP-treatment. Increased root respiration following N amend-
ent to soil cropped with barley (60 kg N ha−1) (Morell et al., 2012)nd to soil recently seeded with cheatgrass (88 kg N ha−1) (Verburgt al., 2004), was both related to simultaneous above- and below-round growth. In contrast, perennial Setaria-grass is characterizedy an already established fine-root system, whereas the above-round growth was found to be N limited. Following the optimalesource allocation theory (Bloom et al., 1985), the application of
may result in a reduction of N limitation on plant growth, lead-ng to an increased C allocation in the aboveground biomass whileecreasing the root-to-shoot ratio (Reynolds et al., 2003). Hence,oot respiration rates may not be increased despite higher above-round biomass. However, information about the impact of lowmounts of N addition on Setaria fine-root production and turnovernd, hence, on root respiration, is still lacking and remains to benvestigated in future studies.
Assuming that root respiration was not significantly increasedue to urea fertilization, it is supposed that the increase in CO2-Cfflux indicates a PE under field conditions, mainly occurring dur-ng the first three days after application. The observed PE of 20%N-plots) was about twice as high as in the lab experiment (Hamert al., 2009b). Nonetheless, it has to be taken into account that theynamic of MBC and the uptake of urea-derived C by the microbialiomass were not investigated in the field. Hence, the estimatedE could also be an apparent one (Blagodatskaya and Kuzyakov,008), whereas in the lab a real PE was detected, since no significanthanges in the amount of MBC were found, and incorporation ofrea-14C into MBC was negligible (Hamer et al., 2009b). In additiono the higher amounts of easily available C in the field due to highne-root stocks (Potthast et al., 2011), increased nutrient avail-bility in the short-term, directly after urea fertilization (Clevelandt al., 2007; Reed et al., 2011), may have contributed to an acceler-ted SOC turnover. The easily available urea-C is used directly fornergy-consuming SOM mineralization (Hamer et al., 2009b; Smitht al., 2007). According to Blagodatskaya and Kuzyakov (2008), aositive PE occurs when the amount of easily available organic Cdded is lower than 15% of MBC. These findings agree with theesults of the present investigation. The urea-C amount of eachpplication was always below 1% of MBC, supporting the proposalf a real, short-lived positive PE under field conditions.
.3. High response of S. sphacelata to fertilization
In the present study, combined application of urea and rockhosphate significantly enhanced the aboveground biomass pro-uction. Similar increases in the biomass yield of Setaria-grass from.6 (control) to 11.75 t ha−1 a−1 were achieved in India (Dwivedi
ology 62 (2012) 103– 114 111
and Kumar, 1999) after simple urea addition (40 kg N ha−1 a−1). Thisindicates that, in the present investigation, a co-limitation of plantgrowth exists (Güsewell, 2004).
Upon N-treatment, the acquisition of P did not increase con-comitantly with the acquisition of N, leading to a significantlyhigher N/P ratio. This P dilution effect is characteristic of plantsgrown under P-limited conditions when other elements are fer-tilized (Whitehead, 2000). In this case, an even higher P demandmight be reflected upon N-treatment compared to treatmentswithout urea addition (Sinsabaugh et al., 2005). Resources such as Nare also required by plants for the production of energy-expensiveenzymes and extracellular phosphatases (containing as much as32% N) to increase their nutrient availability (e.g., P) or to balancetheir resource supply and demand (Chapin et al., 2002; Tresederand Vitousek, 2001). However, the acquisition of P was obviouslyinsufficient since the P content and storage did not change uponN-treatment compared to the control, indicating a clear limita-tion of plant-available P. After the application of rock phosphate,P stored in the grass biomass was twice as high, although exclusiveP addition did not show a growth response. Hence, a synergisticinteraction between both nutrients (Harpole et al., 2011; Raichet al., 1996) was responsible for the substantial increase in thegrass yield of 24% upon NP-treatment compared to the control.A notable increase in the grass C/N ratio of the NP-treatment(Table 4) indicates that P requirements still prevail. However, itcan be assumed that the pasture grass of the NP-treatment had toinvest less energy into the production of belowground biomass aswell as of extracellular enzymes (Sinsabaugh et al., 2005) and/orinto the formation of mycorrhizal associations, compared to theother treatments. Several studies reported that plants decreasetheir nutrient use efficiency (Jouany et al., 2011) in response toincreased nutrient supply following anthropogenic deposition orintensive fertilization. Plants frequently reduce their C-supply tomycorrhizae in response to P-fertilization, leading to a reductionin mycorrhizal abundance (Groffman and Fisk, 2011; Treseder,2004).
Since tropical grasses are generally characterized by lower drymatter digestibility (60–70%) than temperate species (80%) (deGeus, 1973; Hacker and Jones, 1969), improvement of the fodderquality by increased protein levels as well as P and Ca content isrequired for animal performance (i.e., health of dairy cattle and milkyield) (Mlay et al., 2006). In general, the fodder quality dependson the nutrient availability in the soil and on the growth stage.In a comparison with 560 samples of tropical grasses, the nitro-gen level of the Setaria-grass was below the mean value of 1.7%(Skerman and Riveros, 1990), but fell well within the findings ofother Setaria-grass studies ranging between 0.93 and 1.61% (Ghoshet al., 2009; Hacker and Jones, 1969; Mlay et al., 2006). The criti-cal P level of 0.21% for Setaria-grass (Skerman and Riveros, 1990)was exceeded by up to 0.25% due to rock phosphate application.This increase is a first step to preventing health disorders of dairycattle by alleviating P deficiency. For growing calves and lactat-ing cattle, an even higher level between 0.3 and 0.42% is required(Subcommittee on Dairy Cattle et al., 2001). Improved Ca contentof the grass biomass was also found after rock phosphate addition,since about 27 kg Ca ha−1 a−1 were added with this fertilizer. Anenhanced Ca uptake by the dairy cattle can help to control milk fever(FAO, 2009a), which is caused by high concentrations of oxalatein the fodder, as has sometimes been reported for Setaria-grasses(Dougall and Birch, 1967; Rahman et al., 2008).
4.4. Gains and losses of fertilizer N and P
N fertilizer can be lost according to two main pathways: gaseousemissions (NH3, NO, N2O) and leaching (NO3
−), depending on
1 Soil Ec
wpftt5iRaoaado(l(Htgabian
otrsipiRpc
5
uygcoiwtsmCPtatsppeilffps
12 K. Potthast et al. / Applied
eather and soil conditions (Whitehead, 2000). On a Setaria-asture in Queensland, Australia, total losses of 15N-labeled urearom the soil-plant system differed between 20% and 45% overhe year (Catchpoole et al., 1983). While loss of N by volatiliza-ion of NH3 is rather unlikely due to soil pH values lower than.5, gaseous N-losses via N2O and NO emissions had to be taken
nto account in the present study. In the humid tropics of Costaica, Veldkamp et al. (1998) measured increased gaseous N lossesfter pasture fertilization with urea (four times 18.8 kg N ha−1
ver 23 days). Most of the fertilizer N was lost by N2O-N (11.6%)nd less by NO-N (2.2%), which was referred to high fertilizermounts and continuously high soil water contents. In the Ecua-orian study area, NO3
−-leaching and input into streams playsnly a minor role in catchments dominated by extensive pasturesBücker et al., 2011). The authors reported that pasture streams hadow nitrate concentrations and showed lower annual export rates0.07 kg NO3-N ha−1) than forested streams (3.1 kg NO3-N ha−1).ence, considering a maximum storage of 43% of yearly added N in
he aboveground Setaria-grass biomass, and assuming comparableaseous N-losses (14%) as in the study by Veldkamp et al. (1998)nd only minor losses via leaching, a notable proportion of N muste stored in the belowground plant–soil system. However, further
nvestigations of the N stored in the fine-root biomass, as well asnalyses of the NH4 amount adsorbed by SOM or clay minerals areeeded to verify the assumptions.
In contrast to rapid N-losses of the highly soluble urea, lossesf P from rock phosphate are at least in the short-term, compara-ively low. The results of the difference method (Syers et al., 2008)evealed that 69% of annually added P by rock phosphate wastored in the grass biomass. This is a simple approach, consider-ng only the P-release from rock phosphate, which is favored in theresent study by increased fungal abundance, moderate soil acid-
ty, and high precipitation rates (Gatiboni et al., 2003; Zapata andoy, 2004). However, in addition to the P-release from rock phos-hate, an accelerated P-release derived from SOM may also haveontributed to the higher plant P-uptake.
. Conclusion
In the mountain rainforest region, the combined application ofrea and rock phosphate to an active pasture increased biomassields and improved fodder quality most efficiently. The above-round biomass production of the pasture grass S. sphacelata iso-limited by N and P. In contrast, no changes in the amountsf immobilized N and P by the soil microorganisms were found,ndicating that the microbial N and P demands were already met
ithout fertilization. In the upper mineral soil (0–5 cm), both fer-ilizers induced a significant shift in the microbial communitytructure towards a higher relative abundance of fungi, which wasore pronounced for P-addition. Short-term increases in the soil
O2-C effluxes after urea application were mainly due to a positiveE induced by an activation of soil microbes. Increased root respira-ion rates seem to be unlikely, but cannot be completely excluded,nd should be investigated in future studies. The results suggesthat a combined N- and P-fertilization with moderate annual ratesplit into several applications per year is one part of a sustainableasture management strategy, at least during the considered timeeriod of three years. Higher amounts of fertilizer application arexpected to further increase pasture productivity and fodder qual-ty. However, this would also include the risk of an increased SOMoss in the long-term which, in turn, would be counterproductive
or the maintenance of soil quality. Further investigations shouldocus on the rehabilitation of soil quality of abandoned, degradedastures, since a re-integration of these sites is crucial for long-termustainable land-use in the study area.
ology 62 (2012) 103– 114
Acknowledgements
The authors gratefully acknowledge the financial support by theDFG (German Research Foundation) for the subproject B2.1 withinthe DFG research Unit 816 “Biodiversity and Sustainable Manage-ment of a Megadiverse Mountain Ecosystem in South Ecuador” (HA4597/1-1). We thank the owner of the pasture site, Mr. Pacheco, theEcuadorian co-workers for their ongoing field assistance, WillianRodriguez for measuring soil respiration rates and Axel Heinemannfor his dedicated assistance in collecting soil samples and labo-ratory measurements. We are grateful to Manuela Unger for herskilful and tedious laboratory work and Dr. Thomas Klinger for theICP-OES measurements. We highly appreciate the support with sta-tistical analyses by Dr. Matthias Rudolf and we would like to thankthe anonymous reviewers for their helpful suggestions.
References
Bardgett, R.D., Mawdsley, J.L., Edwards, S., Hobbs, P.J., Rodwell, J.S., Davies, W.J.,1999a. Plant species and nitrogen effects on soil biological properties of tem-perate upland grasslands. Funct. Ecol. 13, 650–660.
Bardgett, R.D., Lovell, R.D., Hobbs, P.J., Jarvis, S.C., 1999b. Seasonal changes in soilmicrobial communities along a fertility gradient of temperate grasslands. SoilBiol. Biochem. 31, 1021–1030.
Barraclough, D., 1995. 15N isotope dilution techniques to study soil nitrogen trans-formations and plant uptake. Fert. Res. 42, 185–192.
Bendix, J., Homeier, J., Cueva Ortiz, E., Emck, P., Breckle, S.W., Richter, M., Beck, E.,2006. Seasonality of weather and tree phenology in a tropical evergreen moun-tain rain forest. Int. J. Biometeorol. 50, 370–384.
Blagodatskaya, E., Kuzyakov, Y., 2008. Mechanisms of real and apparent primingeffects and their dependence on soil microbial biomass and community struc-ture: critical review. Biol. Fertil. Soils 45, 115–131.
Bray, R.H., Kurtz, L.T., 1945. Determination of total, organic and available forms ofphosphorus in soils. Soil Sci. 59, 39–45.
Brookes, P.C., Powlson, D.S., Jenkinson, D.S., 1982. Measurement of microbialbiomass phosphorus in soil. Soil Biol. Biochem. 14, 319–329.
Bücker, A., Crespo, P., Frede, H.-G., Breuer, L., 2011. Solute behaviour and export ratesin neotropical montane catchments under different land-uses. J. Trop. Ecol. 27,305–317.
Catchpoole, V.R., Oxenham, D.J., Harper, L.A., 1983. Transformation and recovery ofurea applied to a grass pasture in south-eastern Queensland. Anim. Prod. Sci.(formerly Aust. J. Exp. Agric. Anim. Husb.) 23, 80–86.
Chapin, F.S., Matson, P.A., Mooney, H.A., 2002. Principles of Terrestrial EcosystemEcology. Springer, New York.
Chen, G.C., He, Z.L., 2004. Determination of soil microbial biomass phosphorus inacid red soils from southern China. Biol. Fertil. Soils 39, 446–451.
Cleveland, C.C., Liptzin, D., 2007. C:N:P stoichiometry in soil: is there a “Redfieldratio” for the microbial biomass? Biogeochemistry 85, 235–252.
Cleveland, C.C., Nemergut, D.R., Schmidt, S.K., Townsend, A.R., 2007. Increases insoil respiration following labile carbon additions linked to rapid shifts in soilmicrobial community composition. Biogeochemistry 82, 229–240.
Cleveland, C.C., Townsend, A.R., 2006. Nutrient additions to a tropical rain forestdrive substantial soil carbon dioxide losses to the atmosphere. Proc. Natl. Acad.Sci. U.S.A. 103, 10316–10321.
de Geus, J.G., 1973. Fertilizer Guide for the Tropics and Subtropics, 2nd ed. Centred’Etude de l’Azote, Zürich.
DeForest, J.L., Scott, L.G., 2010. Available organic soil phosphorus has an impor-tant influence on microbial community composition. Soil Sci. Soc. Am. J. 74,2059–2066.
Denef, K., Roobroeck, D., Manimel Wadu, M.C.W., Lootens, P., Boeckx, P., 2009.Microbial community composition and rhizodeposit-carbon assimilation in dif-ferently managed temperate grassland soils. Soil Biol. Biochem. 41, 144–153.
Dias-Filho, M.B., Davidson, E.A., de Carvalho, C.J.R., 2001. Linking biogeochemicalcycles to cattle pasture management and sustainability in the Amazon Basin.In: McClain, M.E., Victoria, R.L., Richey, J.E. (Eds.), The Biogeochemistry of theAmazon Basin. Oxford University Press, New York, pp. 84–105.
Dougall, H.W., Birch, H.F., 1967. Further experiments on the acid grass Setaria sphace-lata. Plant Soil 26, 85–98.
Dwivedi, G.K., Kumar, D., 1999. Nitrogen economy, dry matter production and seedproduction potential of Setaria sphacelata by intercropping of pasture legumes.J. Agron. Crop Sci. 182, 121–125.
Eastmond, A., Faust, B., 2006. Farmers, fires, and forests: a green alternative to shif-ting cultivation for conservation of the Maya forest? Landsc. Urban Plan. 74,267–284.
FAO, 2006. World Reference Base for Soil Resources 2006 – A Framework for Inter-national Classification, Correlation and Communication, World Soil ResourcesReports. Food and Agriculture Organization of the United Nations, Rome, p. 128.
FAO, 2009a. Grassland Index. A Searchable Catalogue of Grass and Forage Legumes.Food and Agriculture Organization of the United Nations, Rome.
Soil Ec
F
F
F
G
G
G
G
G
G
G
G
H
H
H
H
H
H
H
J
J
K
K
K
K
K
L
M
M
M
M
K. Potthast et al. / Applied
AO, 2009b. The State of Food and Agriculture: Livestock in the Balance. Food andAgriculture Organization of the United Nations, Rome.
AO, 2010. Global Forest Resources Assessment 2010. Food and Agriculture Organi-zation of the United Nations, Rome.
ernandes, S.A.P., Bernoux, M., Cerri, C.C., Feigl, B.J., Piccolo, M.C., 2002. Seasonalvariation of soil chemical properties and CO2 and CH4 fluxes in unfertilizedand P-fertilized pastures in an Ultisol of the Brazilian Amazon. Geoderma 107,227–241.
arcia-Montiel, D.C., Neill, C., Melillo, J., Thomas, S., Steudler, P.A., Cerri, C.C., 2000.Soil phosphorus transformations following forest clearing for pasture in theBrazilian Amazon. Soil Sci. Soc. Am. J. 64, 1792–1804.
atiboni, L.C., Kaminski, J., Rheinheimer, D.S., Brunetto, G., 2003. Superphosphateand rock phosphates as phosphorus sources for grass-clover pasture on a limedacid soil in southern Brazil. Commun. Soil Sci. Plant Anal. 34, 2503–2514.
erique, A., 2010. Biodiversity as a Resource: Plant Use and Land Use Among theShuar, Saraguros, and Mestizos in Tropical Rainforest Areas of Southern Ecuador.Institute of Geography. Friedrich-Alexander Universität, Erlangen-Nürnberg, p.429.
hosh, P.K., Saha, R., Gupta, J.J., Ramesh, T., Das, A., Lama, T.D., Munda, G.C., Bordoloi,J.S., Verma, M.R., Ngachan, S.V., 2009. Long-term effect of pastures on soil qualityin acid soil of north-east India. Aust. J. Soil Res. 47, 372–379.
öttlicher, D., Obregón, A., Homeier, J., Rollenbeck, R., Nauss, T., Bendix, J.,2009. Land-cover classification in the Andes of southern Ecuador using Land-sat ETM+ data as a basis for SVAT modelling. Int. J. Remote Sens. 30,1867–1886.
rayston, S.J., Campbell, C.D., Bardgett, R.D., Mawdsley, J.L., Clegg, C.D., Ritz, K.,Griffiths, B.S., Rodwell, J.S., Edwards, S.J., Davies, W.J., Elston, D.J., Millard, P.,2004. Assessing shifts in microbial community structure across a range of grass-lands of differing management intensity using CLPP, PLFA and community DNAtechniques. Appl. Soil Ecol. 25, 63–84.
roffman, P.M., Fisk, M.C., 2011. Phosphate additions have no effect on microbialbiomass and activity in a northern hardwood forest. Soil Biol. Biochem. 43,2441–2449.
üsewell, S., 2004. N:P ratios in terrestrial plants: variation and functional signifi-cance. New Phytol. 164, 243–266.
acker, J.B., Jones, R.J., 1969. The Setaria sphacelata complex – a review. Trop. Grass-lands 3, 13–34.
amer, U., Makeschin, F., An, S., Zheng, F., 2009a. Microbial activity and communitystructure in degraded soils on the Loess Plateau of China. J. Plant Nutr. Soil Sci.172, 118–126.
amer, U., Potthast, K., Burneo, J.I., Makeschin, F., 2012. Nutrient stocks andphosphorus fractions in mountain soils of Southern Ecuador after conver-sion of forest to pasture. Biogeochemistry, 1–16, http://dx.doi.org/10.1007/s10533-012-9742-z.
amer, U., Potthast, K., Makeschin, F., 2009b. Urea fertilisation affected soil organicmatter dynamics and microbial community structure in pasture soils of South-ern Ecuador. Appl. Soil Ecol. 43, 226–233.
amer, U., Unger, M., Makeschin, F., 2007. Impact of air-drying and rewetting onPLFA profiles of soil microbial communities. J. Plant Nutr. Soil Sci. 170, 259–264.
ouany, C., Cruz, P., Daufresne, T., Duru, M., 2011. Biological phosphorus cycling ingrasslands: interactions with nitrogen. In: Bünemann, E., Oberson, A., Frossard,E. (Eds.), Phosphorus in Action: Biological Processes in Soil Phosphorus Cycling.Springer, Heidelberg, pp. 275–294.
aye, J.P., Hart, S.C., 1997. Competition for nitrogen between plants and soil microor-ganisms. Trends Ecol. Evol. 12, 139–143.
ibblewhite, M.G., Ritz, K., Swift, M.J., 2008. Soil health in agricultural systems. Phil.Trans. R. Soc. B 363, 685–701.
ingston, H.M., Jassie, L.B., 1986. Microwave energy for acid decomposition at ele-vated temperatures and pressures using biological and botanical samples. Anal.Chem. 58, 2534–2541.
nops, J.M.H., Bradley, K.L., Wedin, D.A., 2002. Mechanisms of plant species impactson ecosystem nitrogen cycling. Ecol. Lett. 5, 454–466.
uzyakov, Y., Friedel, J.K., Stahr, K., 2000. Review of mechanisms and quantificationof priming effects. Soil Biol. Biochem. 32, 1485–1498.
iu, L., Gundersen, P., Zhang, T., Mo, J., 2012. Effects of phosphorus addition on soilmicrobial biomass and community composition in three forest types in tropicalChina. Soil Biol. Biochem. 44, 31–38.
akeschin, F., Haubrich, F., Abiy, M., Burneo, J.I., Klinger, T., 2008. Pasture manage-ment and natural soil regeneration. In: Beck, E., Bendix, J., Kottke, I., Makeschin,F., Mosandl, R. (Eds.), Gradients in a Tropical Mountain Ecosystem of Ecuador.Springer, Berlin, pp. 397–408.
artens, R., 1995. Current methods for measuring microbial biomass C in soil: poten-tials and limitations. Biol. Fertil. Soils 19, 87–99.
iller, R.O., 1998. Nitric-perchloric acid wet digestion in an open vessel. In: Kalra,
Y.P. (Ed.), Handbook of Reference Methods for Plant Analysis. CRC Press LLC,Boca Raton, pp. 57–61.
lay, P.S., Pereka, A., Phiri, E.C., Balthazary, S., Igusti, J., Hvelplund, T., Weisbjerg,M.R., Madsen, J., 2006. Feed value of selected tropical grasses, legumes andconcentrates. Veterinarski Arhiv 76, 53–63.
ology 62 (2012) 103– 114 113
Montagnini, F., 2008. Management for sustainability and restoration of degradedpastures in the neotropics. In: Myster, R.W. (Ed.), Post-Agricultural Successionin the Neotropics. Springer, New York, pp. 265–295.
Morell, F.J., Whitmore, A.P., Alvaro-Fuentes, J., Lampurlanes, J., Cantero-Martinez, C.,2012. Root respiration of barley in a semiarid Mediterranean agroecosystem:field and modelling approaches. Plant Soil, 1–13.
Mosandl, R., Günter, S., Stimm, B., Weber, M., 2008. Ecuador suffers the highestdeforestation rate in South America. In: Beck, E., Bendix, J., Kottke, I., Makeschin,F., Mosandl, R. (Eds.), Gradients in a Tropical Mountain Ecosystem of Ecuador.Springer, Berlin, Heidelberg, pp. 37–40.
Mulvaney, R.L., Khan, S.A., Stevens, W.B., Mulvaney, C.S., 1997. Improved diffusionmethods for determination of inorganic nitrogen in soil extracts and water. Biol.Fertil. Soils 24, 413–420.
Ohm, H., Hamer, U., Marschner, B., 2007. Priming effects in soil size fractions of aPodzol Bs horizon after addition of fructose and alanine. J. Plant Nutr. Soil Sci.170, 551–559.
Patra, A.K., Abbadie, L., Clays-Josserand, A., Degrange, V., Grayston, S.J., Guillau-maud, N., Loiseau, P., Louault, F., Mahmood, S., Nazaret, S., Philippot, L., Poly,F., Prosser, J.I., Roux, X.L., 2006. Effects of management regime and plantspecies on the enzyme activity and genetic structure of N-fixing, denitrifyingand nitrifying bacterial communities in grassland soils. Environ. Microbiol. 8,1005–1016.
Piepho, H.P., Büchse, A., Emrich, K., 2003. A Hitchhiker’s guide to mixed models forrandomized experiments. J. Agron. Crop Sci. 189, 310–322.
Pohle, P., Gerique, A., 2006. Traditional ecological knowledge and biodiversitymanagement in the Andes of southern Ecuador. Geographica Helvetica 61,275–285.
Potthast, K., Hamer, U., Makeschin, F., 2010. Impact of litter quality on mineralizationprocesses in managed and abandoned pasture soils in Southern Ecuador. SoilBiol. Biochem. 42, 56–64.
Potthast, K., Hamer, U., Makeschin, F., 2011. Land-use change in a tropical mountainrainforest region of southern Ecuador affects soil microorganisms and nutrientcycling. Biogeochemistry, 1–17.
Rahman, M.R., Ishii, Y., Niimi, M., Kawamura, O., 2008. Effects of levels of nitro-gen fertilizer on oxalate and some mineral contents in napiergrass (Pennisetumpurpureum Schumach). Grassland Sci. 54, 146–150.
Raich, J.W., Russell, A.E., Crews, T.E., Farrington, H., Vitousek, P.M., 1996. Both nitro-gen and phosphorus limit plant production on young Hawaiian lava flows.Biogeochemistry 32, 1–14.
Ratledge, C., Wilkinson, S.G., 1988. An overview of microbial lipids. In: Ratledge, C.,Wilkinson, S.G. (Eds.), Microbial Lipids. Academic Press Inc., San Diego, pp. 3–22.
Reed, S.C., Vitousek, P.M., Cleveland, C.C., 2011. Are patterns in nutrient limitationbelowground consistent with those aboveground: results from a 4 million yearchronosequence. Biogeochemistry 106, 323–336.
Reynolds, H.L., Packer, A., Bever, J.D., Clay, K., 2003. Grassroots ecology: plant-microbe-soil interactions as drivers of plant community structure and dynamics.Ecology 84, 2281–2291.
Rhoades, C.C., Coleman, D.C., 1999. Nitrogen mineralization and nitrification follow-ing land conversion in montane Ecuador. Soil Biol. Biochem. 31, 1347–1354.
Rhoades, C.C., Eckert, G.E., Coleman, D.C., 2000. Soil carbon differences among forest,agriculture, and secondary vegetation in lower montane Ecuador. Ecol. Appl. 10,497–505.
Rousk, J., Baath, E., 2007. Fungal and bacterial growth in soil with plant materials ofdifferent C/N ratios. FEMS Microbiol. Ecol. 62, 258–267.
Rousk, J., Brookes, P.C., Bååth, E., 2011. Fungal and bacterial growth responses to Nfertilization and pH in the 150-year ‘Park Grass’ UK grassland experiment. FEMSMicrobiol. Ecol. 76, 89–99.
Ryan, M.G., 1991. Effects of climate change on plant respiration. Ecol. Appl. 1,157–167.
Saggar, S., Parfitt, R.L., Salt, G., Skinner, M.F., 1998. Carbon and phosphorus trans-formations during decomposition of pine forest floor with different phosphorusstatus. Biol. Fertil. Soils 27, 197–204.
Skerman, P.J., Riveros, F., 1990. Tropical Grasses. Food and Agriculture Organizationof the United Nations, Rome.
Smith, J.L., Bell, J.M., Bolton, H., Bailey, V.L., 2007. The initial rate of C substrateutilization and longer-term soil C storage. Biol. Fertil. Soils 44, 315–320.
Smith, P., 2008. Land use change and soil organic carbon dynamics. Nutr. CyclingAgroecosyst. 81, 169–178.
Statistics, 2010. SPSS 19.0 ed. IBM.StatSoft, 2009. Statistica for Windows, 9.0 ed, Tulsa.Steinfeld, H., Wassenaar, T., 2007. The role of livestock production in carbon and
– methods, controls, and ecosystem implications. Soil Biol. Biochem. 42,1385–1395.
Subcommittee on Dairy Cattle, N., Committee on Animal, N., National Research,C., 2001. Nutrient Requirements of Dairy Cattle: Seventh Revised Edition. TheNational Academies Press.
Syers, J.K., Johnston, A.E., Curtin, D., 2008. Efficiency of Soil and Fertilizer PhosphorusUse. Food and Agriculture Organization of the United Nations, Rome.
ter Braak, C.J.F., Smilauer, P., 2002. CANOCO Reference Manual and CanoDraw forWindows User’s Guide: Software for Canonical Community Ordination, 4.5 ed.Biometris, Wageningen.
homas, G., Shantaram, M., Saraswathy, N., 1985. Occurrence and activity ofphosphate-solubilizing fungi from coconut plantation soils. Plant Soil 87,357–364.
reseder, K.K., 2004. A meta-analysis of mycorrhizal responses to nitro-gen, phosphorus, and atmospheric CO2 in field studies. New Phytol. 164,347–355.
reseder, K.K., 2008. Nitrogen additions and microbial biomass: a meta-analysis ofecosystem studies. Ecol. Lett. 11, 1111–1120.
reseder, K.K., Vitousek, P.M., 2001. Effects of soil nutrient availability on investmentin acquisition of N and P in Hawaiian rain forests. Ecology 82, 946–954.
ance, E.D., Brookes, P.C., Jenkinson, D.S., 1987. An extraction method for measuringsoil microbial biomass C. Soil Biol. Biochem. 19, 703–707.
eldkamp, E., Keller, M., Nunez, M., 1998. Effects of pasture management on N2O andNO emissions from soils in the humid tropics of Costa Rica. Global Biogeochem.Cycles 12, 71–79.
erburg, P.S.J., Arnone Iii, J.A., Obrist, D., Schorran, D.E., Evans, R.D., Leroux-
Swarthout, D., Johnson, D.W., Luo, Y., Coleman, J.S., 2004. Net ecosystem carbonexchange in two experimental grassland ecosystems. Global Change Biol. 10,498–508.
eresoglou, S.D., Mamolos, A.P., Thornton, B., Voulgari, O.K., Sen, R., Veresoglou,D.S., 2011. Medium-term fertilization of grassland plant communities masks
ology 62 (2012) 103– 114
plant species-linked effects on soil microbial community structure. Plant Soil344, 187–196.
Walker, R.G., Davison, T.M., Orr, W.N., Silver, B.A., 1997. Phosphorus fertilizer fornitrogen-fertilized dairy pastures. 3. Milk responses to a dietary phosphorussupplement. J. Agric. Sci. 129, 233–236.
Wessel, W.W., Tietema, A., 1992. Calculating gross N transformation rates of 15Npool dilution experiments with acid forest litter: analytical and numericalapproaches. Soil Biol. Biochem. 24, 931–942.
Whitehead, D.C., 2000. Nutrient Elements in Grassland: Soil–Plant–Animal Relation-ships. CABI Publishing, Wallingford.
Zapata, F., Roy, R.N., 2004. Use of Phosphate Rocks for Sustainable Agriculture. Foodand Agriculture Organization of the United Nations, Rome.
Zelles, L., 1995. Fatty acid patterns of microbial phospholipids and lipopolysaccha-
rides. In: Schinner, F., Öhlinger, R., Kandeler, E., Margesin, R. (Eds.), Methods inSoil Biology. Springer Verlag, Berlin, pp. 80–93.
Zelles, L., 1999. Fatty acid patterns of phospholipids and lipopolysaccharides in thecharacterisation of microbial communities in soil: a review. Biol. Fertil. Soils 29,111–129.