nuclear magnetic resonance spectroscopy(1H-NMR) ultra-violet and visible light
absorption spectroscopy (UV-vis)
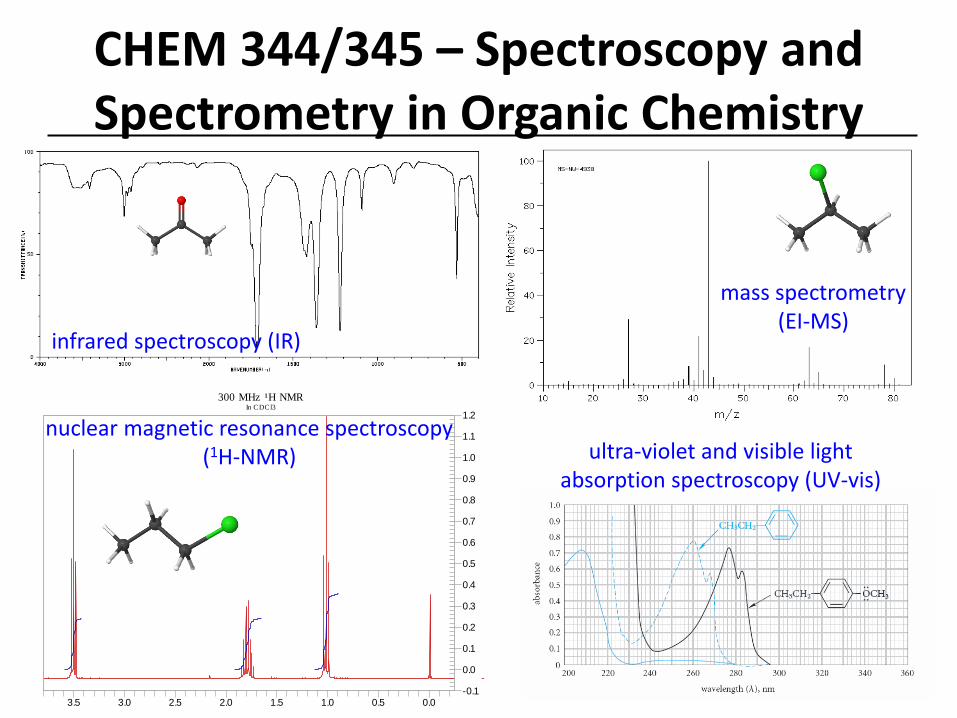
Spectroscopy and Spectrometry in Organic Chemistry
2
1. Ultra-violet and visible (UV/Vis) spectroscopy provides information about theelectronic structure of a molecule through the excitation of electrons. (15.2, 16.3D,19.3D)
2. Infrared (IR) spectroscopy can be used to determine functional groups and bondstrengths based upon molecular vibrations. (12.1 – 12.5, 14.3B, 16.3A, 19.3A, 20.3A,21.4A, 23.4A, & A-3 – A-4)
3. Mass Spectrometry (MS) ionizes and energizes a molecule to determine its mass andconnectivity through fragmentation. (12.6, 19.3E, 26.8A)
4. Nuclear Magnetic Resonance (NMR) spectroscopy provides detailed informationabout the structure of a molecule by its interaction with a magnetic field and a radiofrequency pulse. (13, 14.3C, 16.3B – 16.3C , 19.3B – 19.3C, 20.3B, 21.4B, 23.4A, & A-5– A-8)
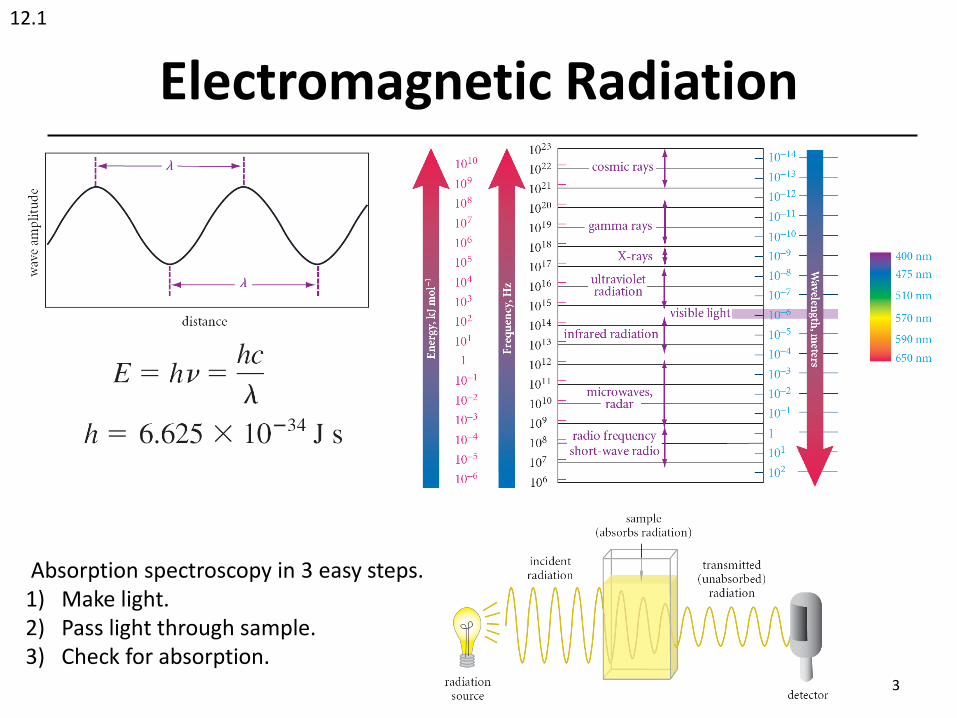
Electromagnetic Radiation
3
Absorption spectroscopy in 3 easy steps.1) Make light.2) Pass light through sample.3) Check for absorption.
12.1
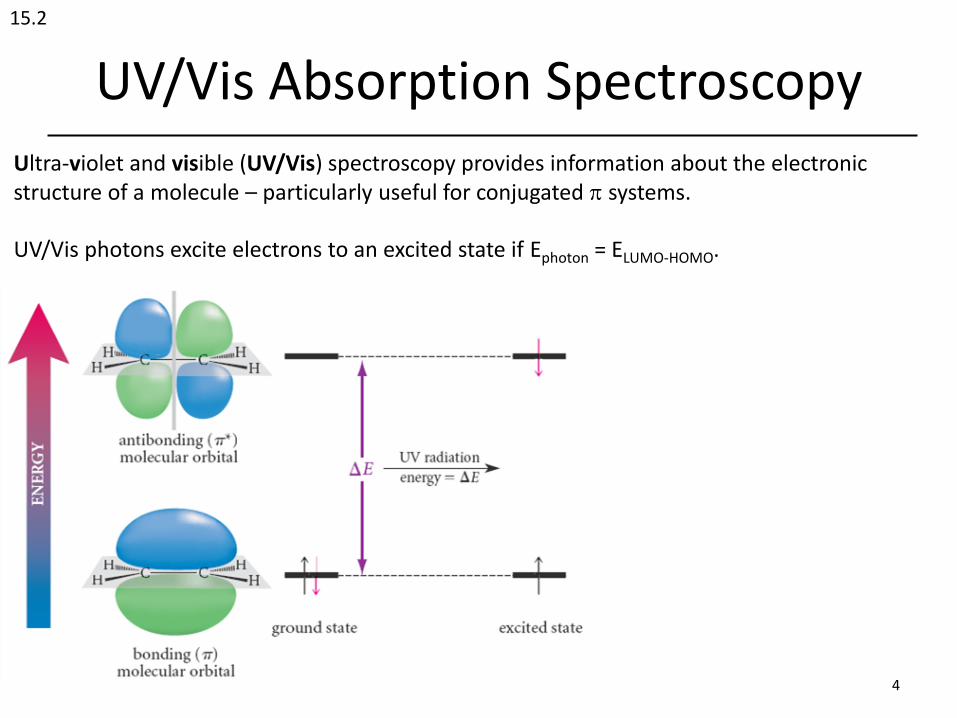
UV/Vis Absorption Spectroscopy
4
15.2
Ultra-violet and visible (UV/Vis) spectroscopy provides information about the electronic structure of a molecule – particularly useful for conjugated p systems.
UV/Vis photons excite electrons to an excited state if Ephoton = ELUMO-HOMO.
UV/Vis Absorption Spectroscopy
5
15.2
This explains why many organiccompounds tend to be boring (whiteor off-white powders or crystals) inthe visible spectrum.
Molecules need to absorbin the visible range in orderto be colored.
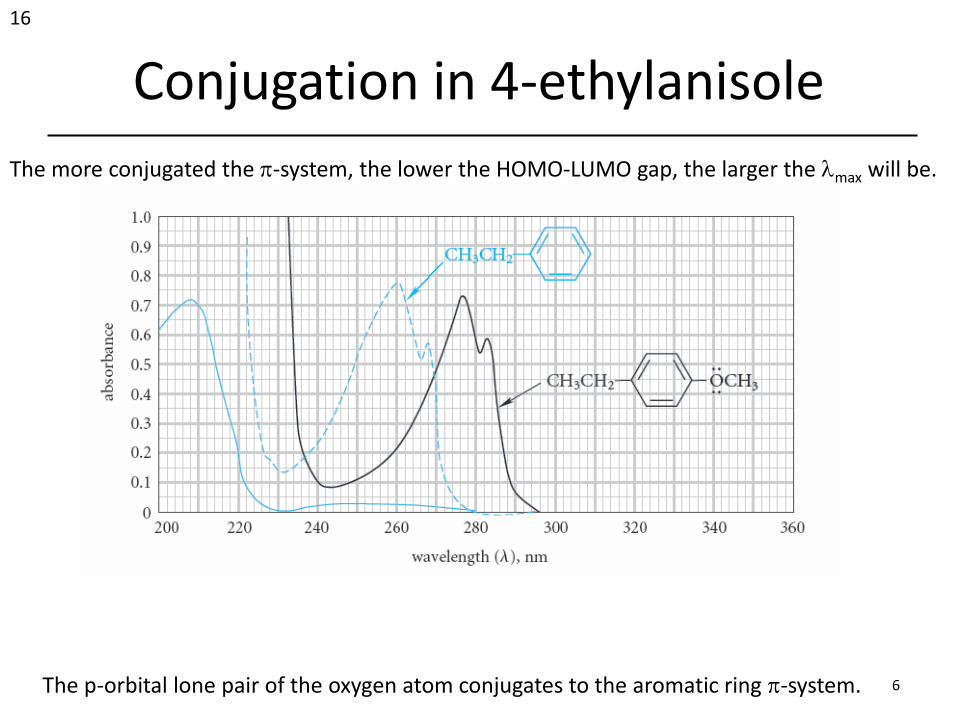
Conjugation in 4-ethylanisole
6
16
The more conjugated the p-system, the lower the HOMO-LUMO gap, the larger the lmax will be.
The p-orbital lone pair of the oxygen atom conjugates to the aromatic ring p-system.
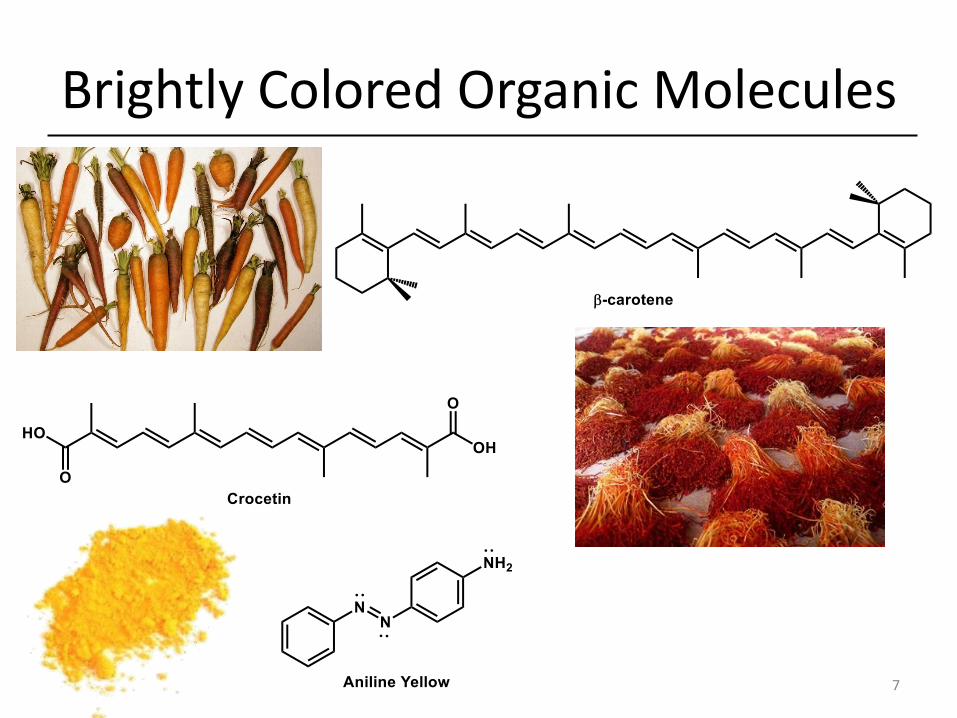
Brightly Colored Organic Molecules
7
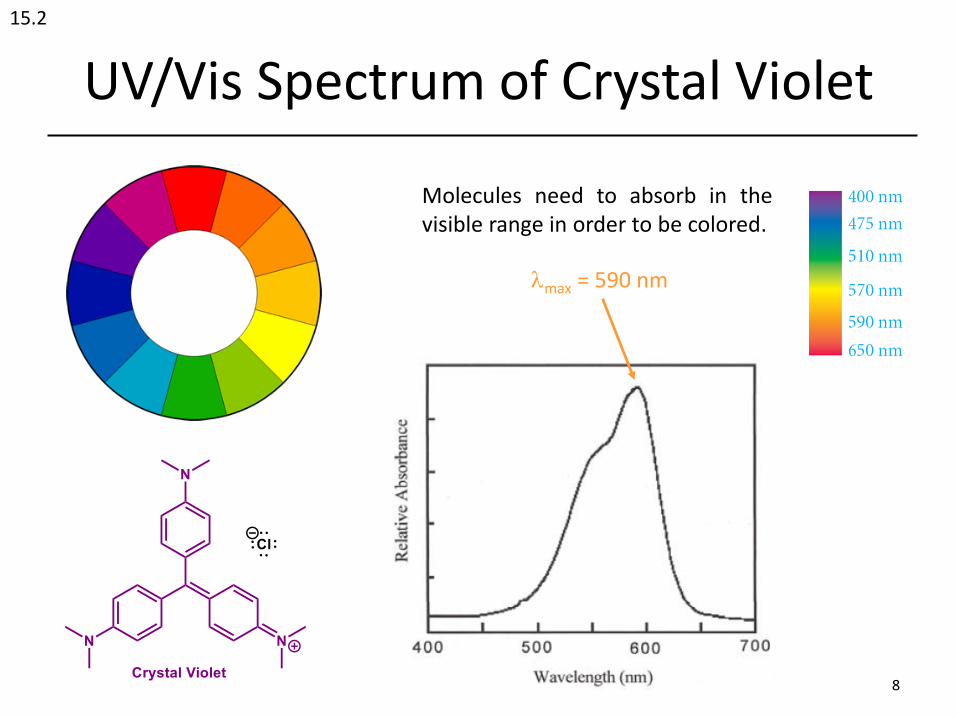
UV/Vis Spectrum of Crystal Violet
8
15.2
Molecules need to absorb in thevisible range in order to be colored.
lmax = 590 nm
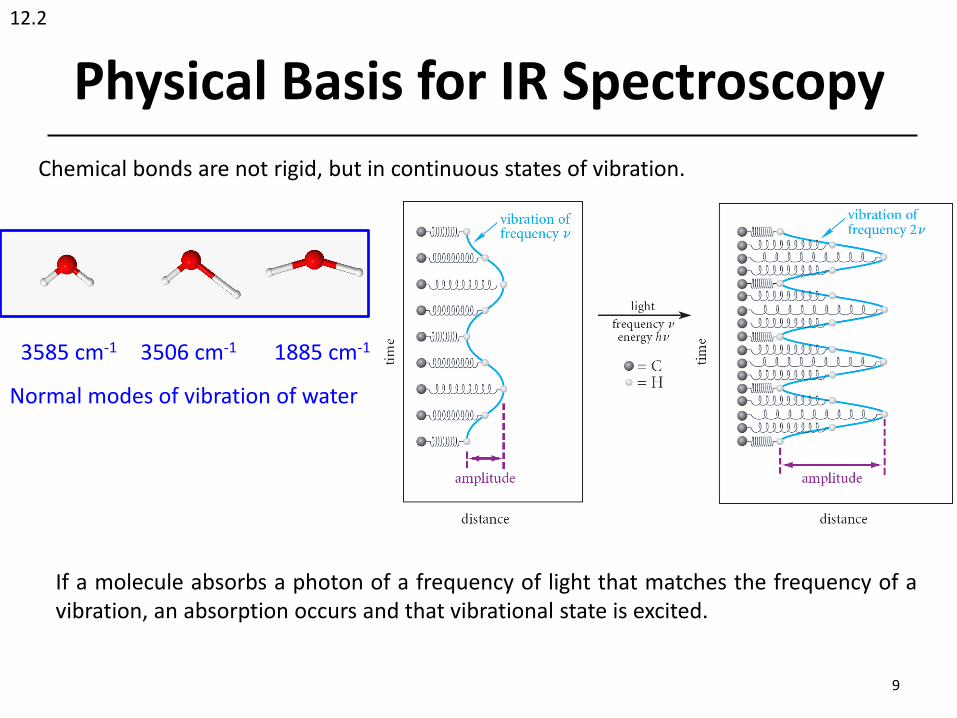
Physical Basis for IR Spectroscopy
9
Chemical bonds are not rigid, but in continuous states of vibration.
If a molecule absorbs a photon of a frequency of light that matches the frequency of avibration, an absorption occurs and that vibrational state is excited.
Normal modes of vibration of water
3585 cm-1 3506 cm-1 1885 cm-1
12.2
Factors that Affect IR Absorption Frequency
10
𝜈 =1
2𝜋
𝑘 𝑚1+𝑚2
𝑚1𝑚2
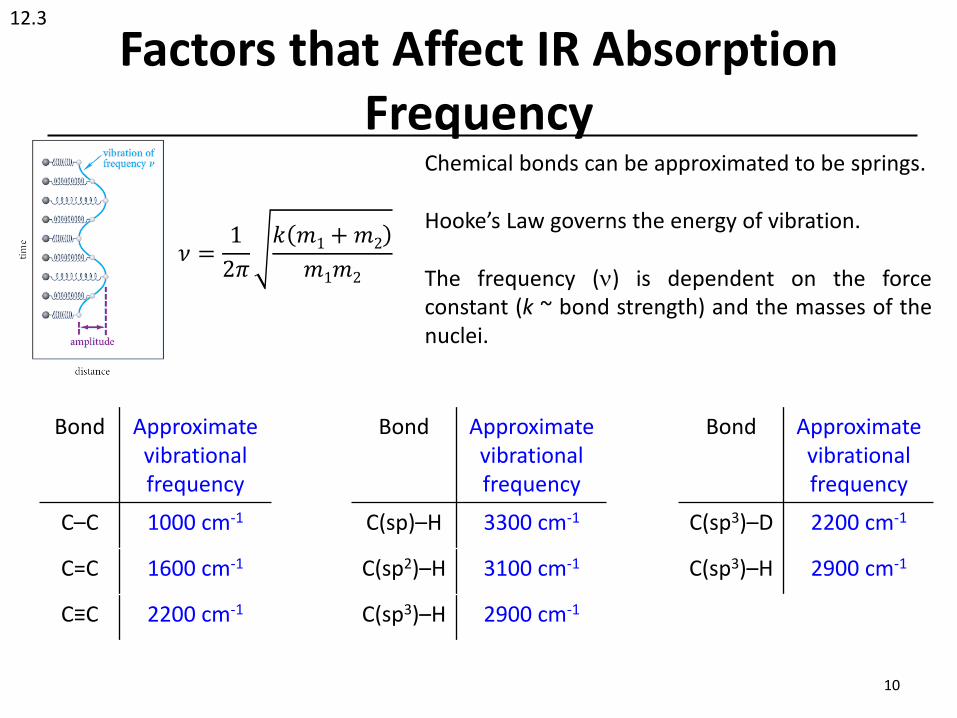
Chemical bonds can be approximated to be springs.
Hooke’s Law governs the energy of vibration.
The frequency (n) is dependent on the forceconstant (k ~ bond strength) and the masses of thenuclei.
Bond Approximate vibrational frequency
C–C 1000 cm-1
C=C 1600 cm-1
C≡C 2200 cm-1
Bond Approximate vibrational frequency
C(sp)–H 3300 cm-1
C(sp2)–H 3100 cm-1
C(sp3)–H 2900 cm-1
Bond Approximate vibrational frequency
C(sp3)–D 2200 cm-1
C(sp3)–H 2900 cm-1
12.3
IR Spectrum of Acetone
11
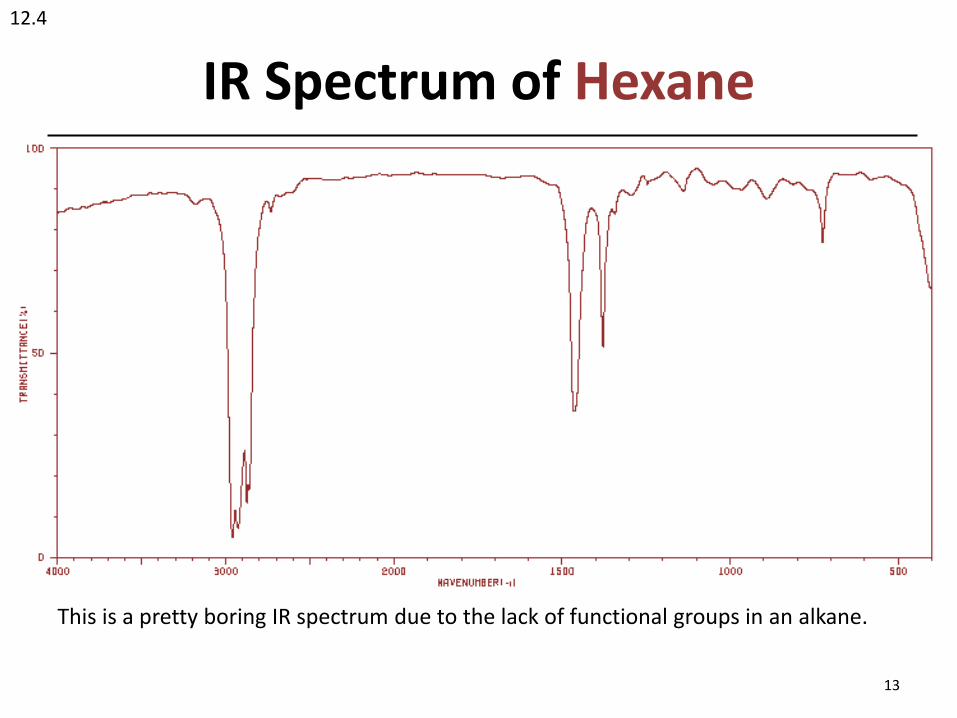
Vertical axis in %Transmittance (most often) in IR spectra.
Horizontal axis in wavenumber (cm-1) for most IR spectra.
Absorptions are observed as sharp or broad reductions in the % of light transmitted.
12.4 & 19.3A
IR Spectrum of Acetone
12
12.4 & 19.3A
IR Spectrum of Hexane
13
This is a pretty boring IR spectrum due to the lack of functional groups in an alkane.
12.4
IR Spectrum of Hexane vs. 1-Hexene
14
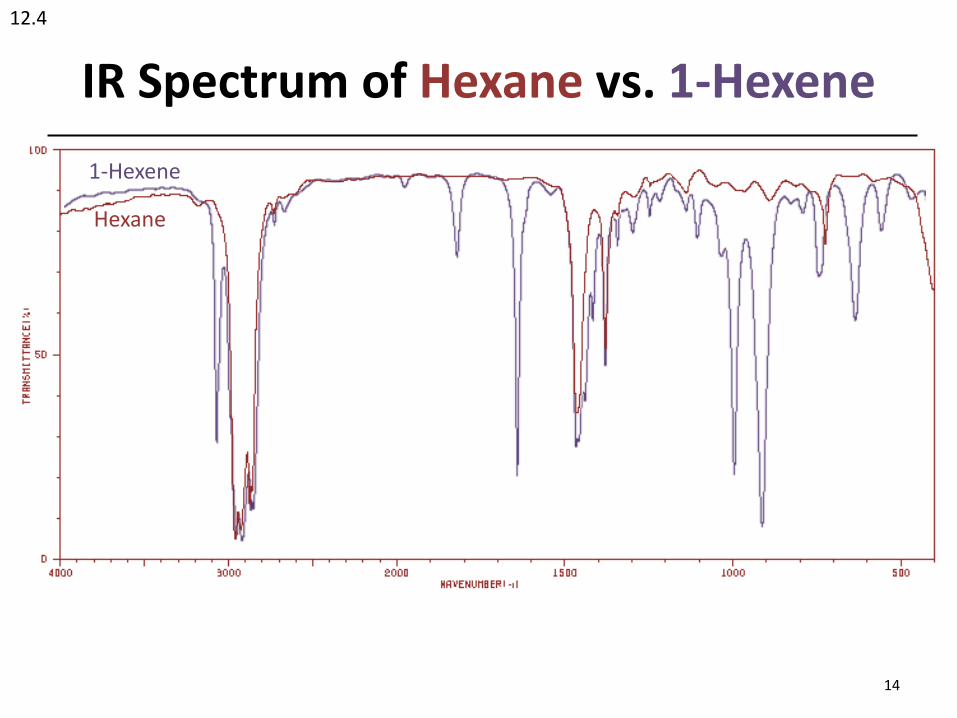
Hexane
1-Hexene
12.4
IR Spectrum of Phenol
15
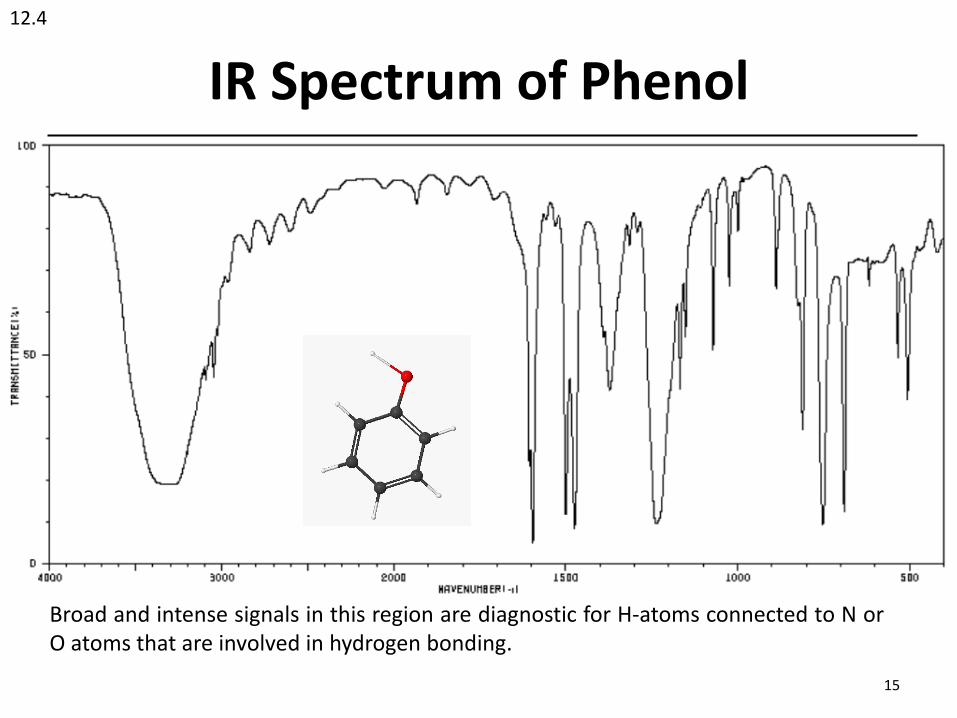
Broad and intense signals in this region are diagnostic for H-atoms connected to N orO atoms that are involved in hydrogen bonding.
12.4
Infrared Observation of Hydrogen Bonding – p-Cresol
16
12.4
Appearance of O–H stretches are dependent on conditions. Below, the blue spectrum is ofa pure liquid with H-bonding. Below, the red spectrum is of a sample dilute in CCl4.
p-cresol
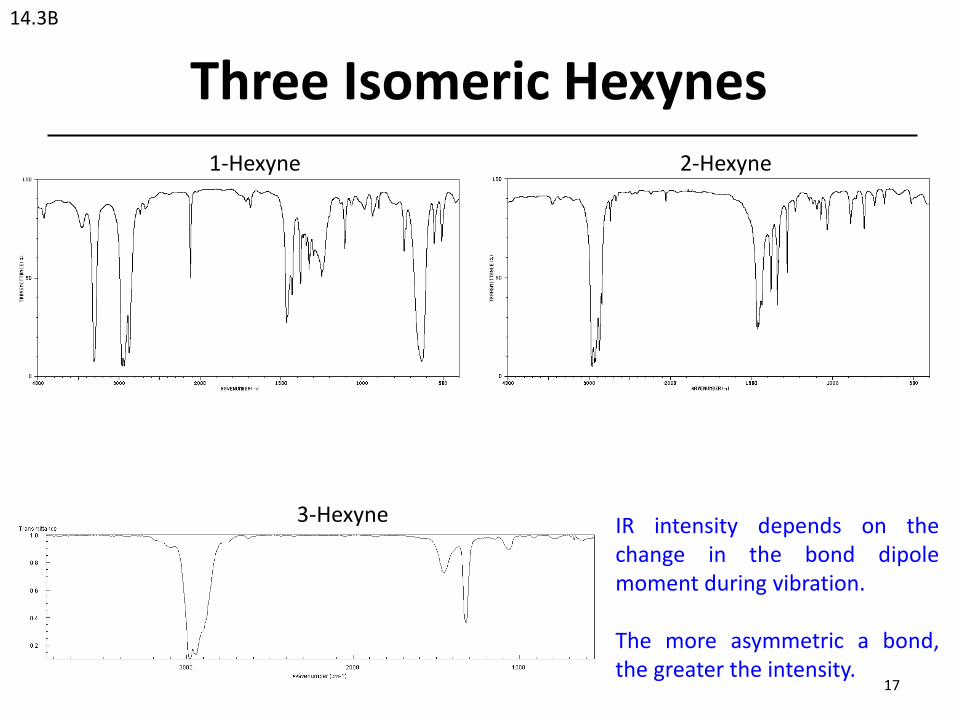
Three Isomeric Hexynes
17
IR intensity depends on thechange in the bond dipolemoment during vibration.
The more asymmetric a bond,the greater the intensity.
1-Hexyne 2-Hexyne
3-Hexyne
14.3B
Functional Group Identification with Correlation Tables
18
IR spectra provide confirmation of the presence of a functional group or a partial structuredetermination when used in tandem with other analyses.
• 3400 – 2800: great for detecting O–H or N–H stretching.
• 2250 – 2100: great for detecting asymmetric triple bonds R–C≡N, R–C≡C–R’.
• 1880 – 1600: great for detecting C=O, C=N, C=C and aromatic rings.
12.3
Functional Group Identification with Correlation Tables
19
1743 cm-1
1715 cm-11646 cm-1
21.4
Functional Group Identification with Correlation Tables
20
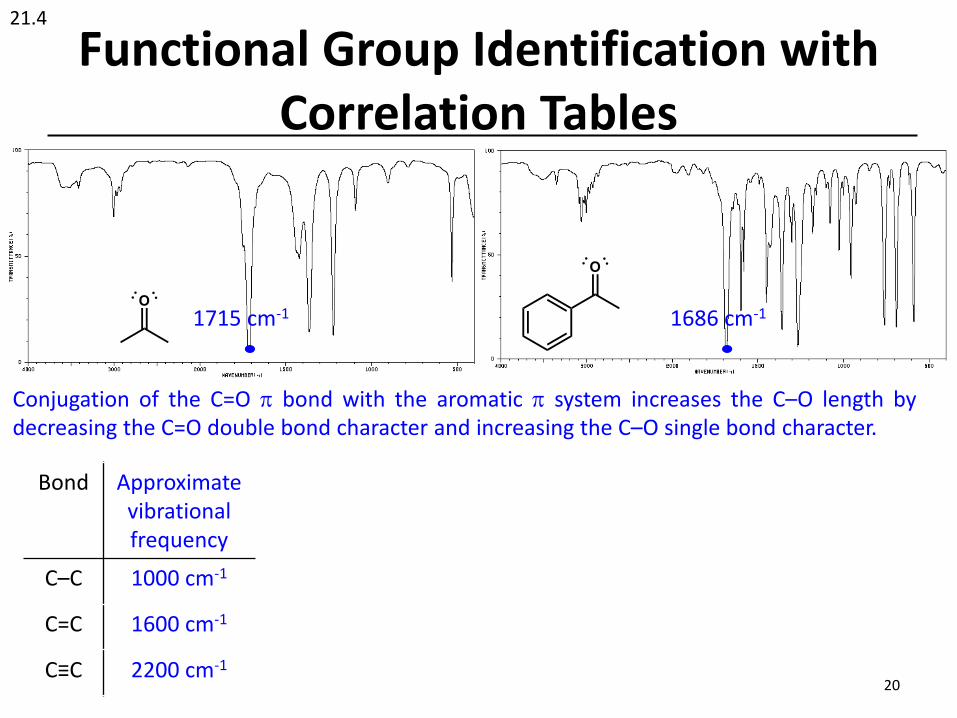
1715 cm-1
21.4
1686 cm-1
Conjugation of the C=O p bond with the aromatic p system increases the C–O length bydecreasing the C=O double bond character and increasing the C–O single bond character.
Bond Approximate vibrational frequency
C–C 1000 cm-1
C=C 1600 cm-1
C≡C 2200 cm-1
Infrared Prediction with Computational Chemistry
21
1715 cm-1
19.3A
A quick (~ 1 min) calculation using Gaussian09 with B3LYP/6-31G(d) overestimates theabsorption frequencies. (More sophisticated calculations can predict more accurately.)
1800 cm-1
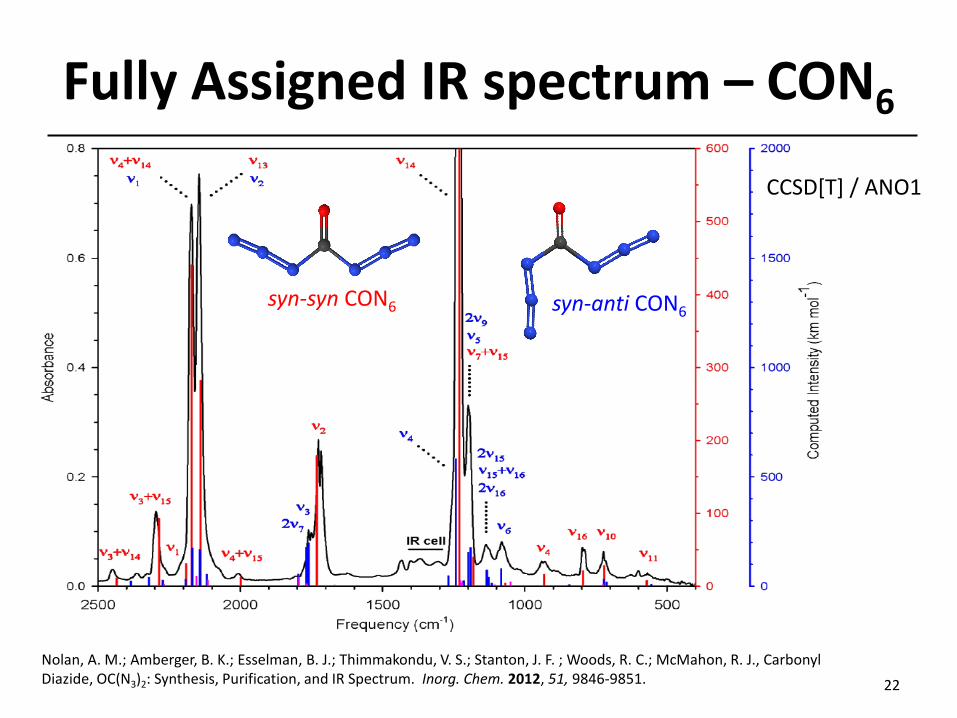
Fully Assigned IR spectrum – CON6
22
syn-syn CON6 syn-anti CON6
CCSD[T] / ANO1
Nolan, A. M.; Amberger, B. K.; Esselman, B. J.; Thimmakondu, V. S.; Stanton, J. F. ; Woods, R. C.; McMahon, R. J., Carbonyl Diazide, OC(N3)2: Synthesis, Purification, and IR Spectrum. Inorg. Chem. 2012, 51, 9846-9851.
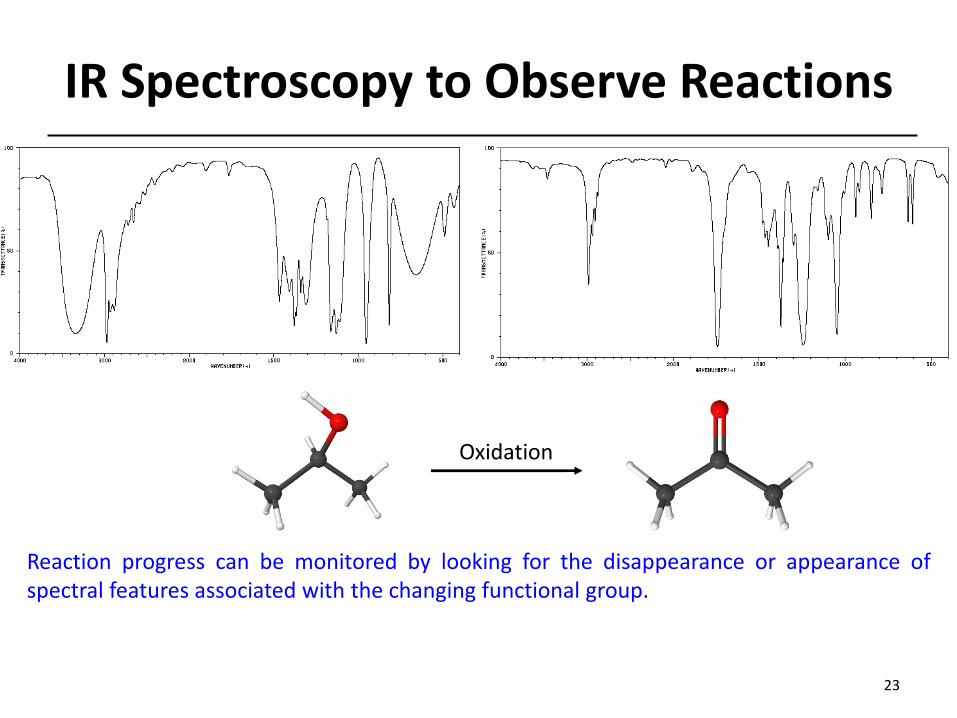
IR Spectroscopy to Observe Reactions
23
Oxidation
Reaction progress can be monitored by looking for the disappearance or appearance ofspectral features associated with the changing functional group.
IR Spectroscopy in Photochemistry
24
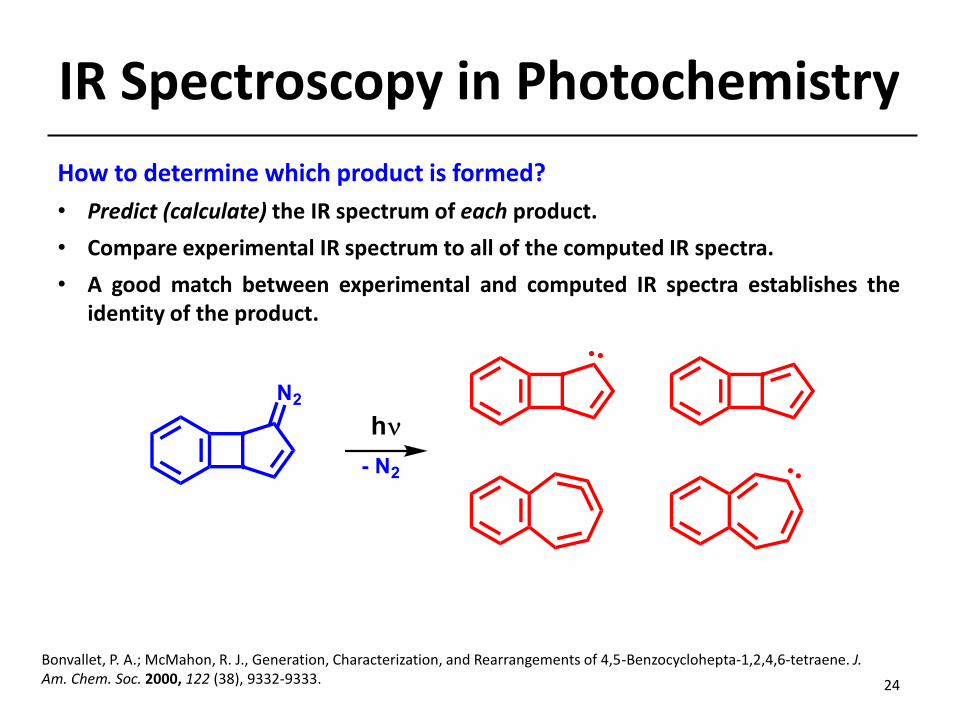
How to determine which product is formed?
• Predict (calculate) the IR spectrum of each product.
• Compare experimental IR spectrum to all of the computed IR spectra.
• A good match between experimental and computed IR spectra establishes theidentity of the product.
Bonvallet, P. A.; McMahon, R. J., Generation, Characterization, and Rearrangements of 4,5-Benzocyclohepta-1,2,4,6-tetraene. J. Am. Chem. Soc. 2000, 122 (38), 9332-9333.
IR Spectroscopy in Photochemistry
Frequency (cm-1
)
500100015002000
A
bs
orb
an
ce
-0.3
-0.2
-0.1
0.0
0.1
0.2
0.3
l > 237 nm, 40 min (Ar, 10 K)
(B3LYP/6-31G*)
(B3LYP/6-31G*)
Experimental
N2
25
Product
Reactant
IR Spectroscopy – Summary
26
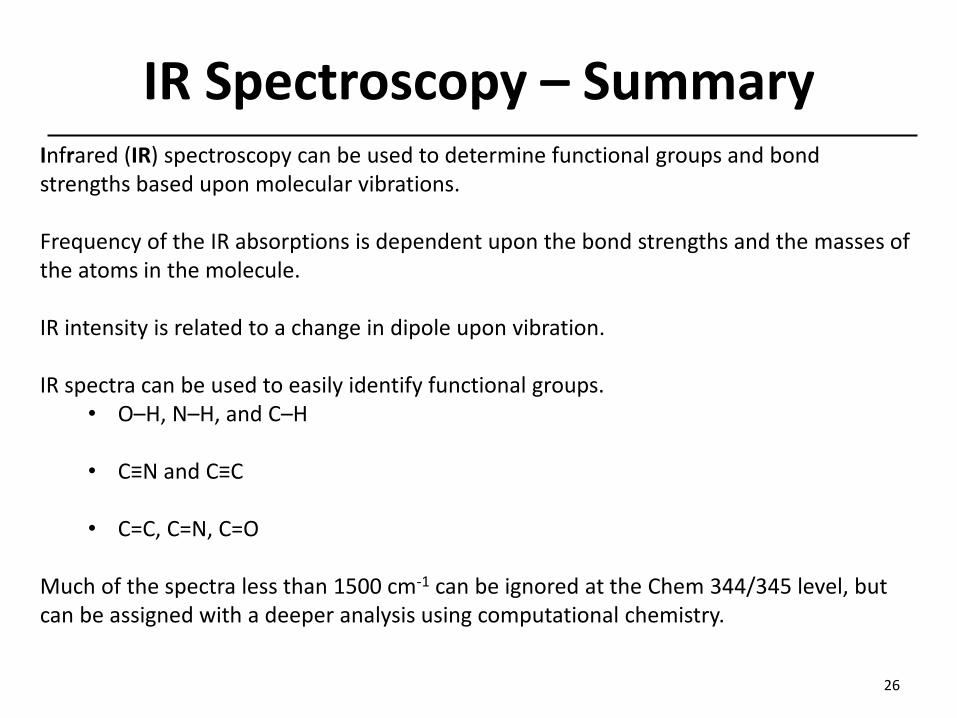
Infrared (IR) spectroscopy can be used to determine functional groups and bond strengths based upon molecular vibrations.
Frequency of the IR absorptions is dependent upon the bond strengths and the masses of the atoms in the molecule.
IR intensity is related to a change in dipole upon vibration.
IR spectra can be used to easily identify functional groups.• O–H, N–H, and C–H
• C≡N and C≡C
• C=C, C=N, C=O
Much of the spectra less than 1500 cm-1 can be ignored at the Chem 344/345 level, but can be assigned with a deeper analysis using computational chemistry.
Electron Impact Mass Spectrometry (EI-MS)
27
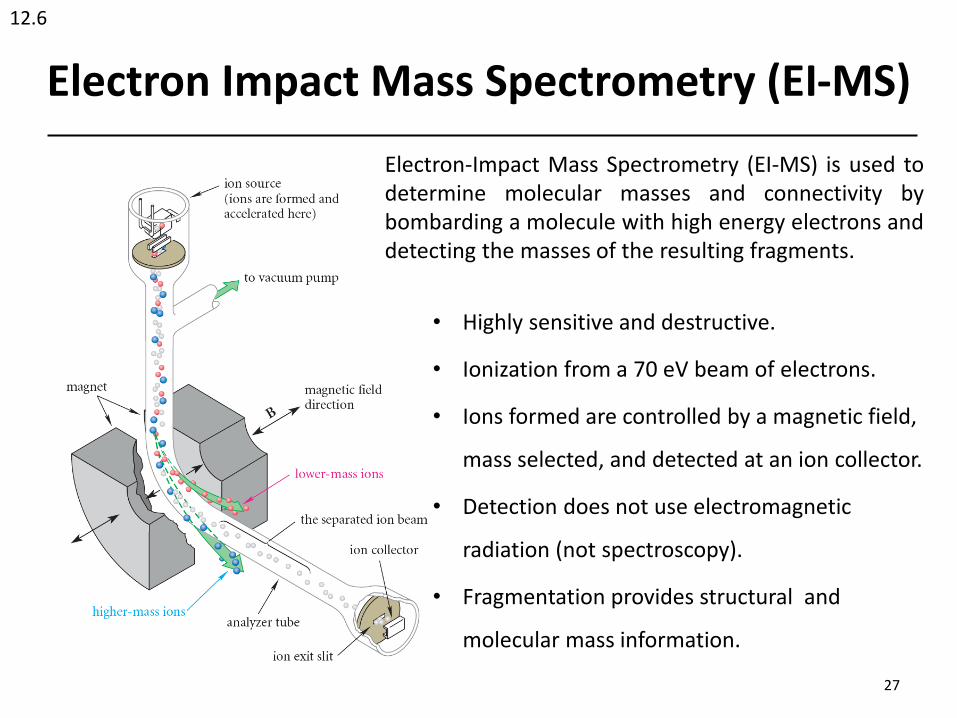
Electron-Impact Mass Spectrometry (EI-MS) is used todetermine molecular masses and connectivity bybombarding a molecule with high energy electrons anddetecting the masses of the resulting fragments.
• Highly sensitive and destructive.
• Ionization from a 70 eV beam of electrons.
• Ions formed are controlled by a magnetic field,
mass selected, and detected at an ion collector.
• Detection does not use electromagnetic
radiation (not spectroscopy).
• Fragmentation provides structural and
molecular mass information.
12.6
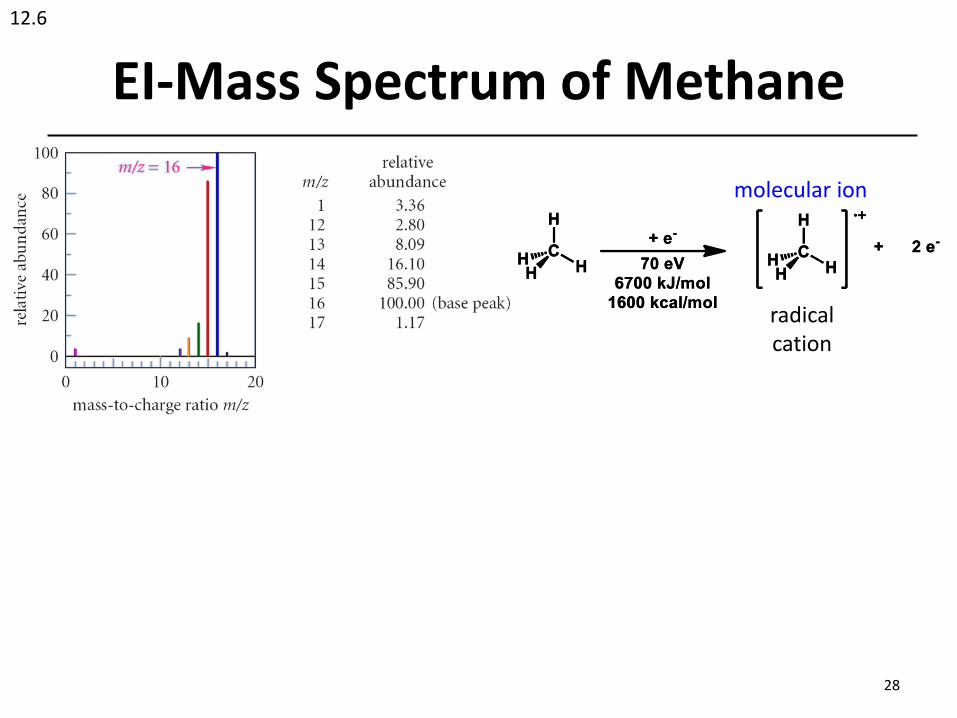
EI-Mass Spectrum of Methane
28
radical cation
molecular ion
12.6
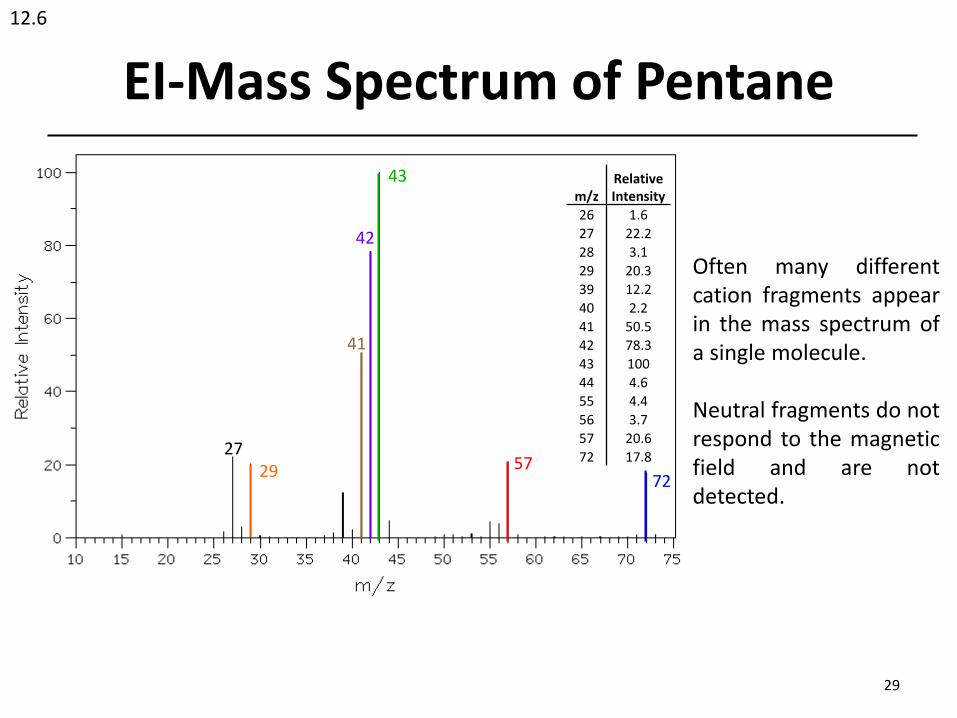
EI-Mass Spectrum of Pentane
29
m/zRelative Intensity
26 1.6
27 22.2
28 3.1
29 20.3
39 12.2
40 2.2
41 50.5
42 78.3
43 100
44 4.6
55 4.4
56 3.7
57 20.6
72 17.8
Often many differentcation fragments appearin the mass spectrum ofa single molecule.
Neutral fragments do notrespond to the magneticfield and are notdetected.
12.6
5772
43
2927
42
41
EI-Mass Spectrum of 2-Methylpentane
30
12.6
71
43
86
5729
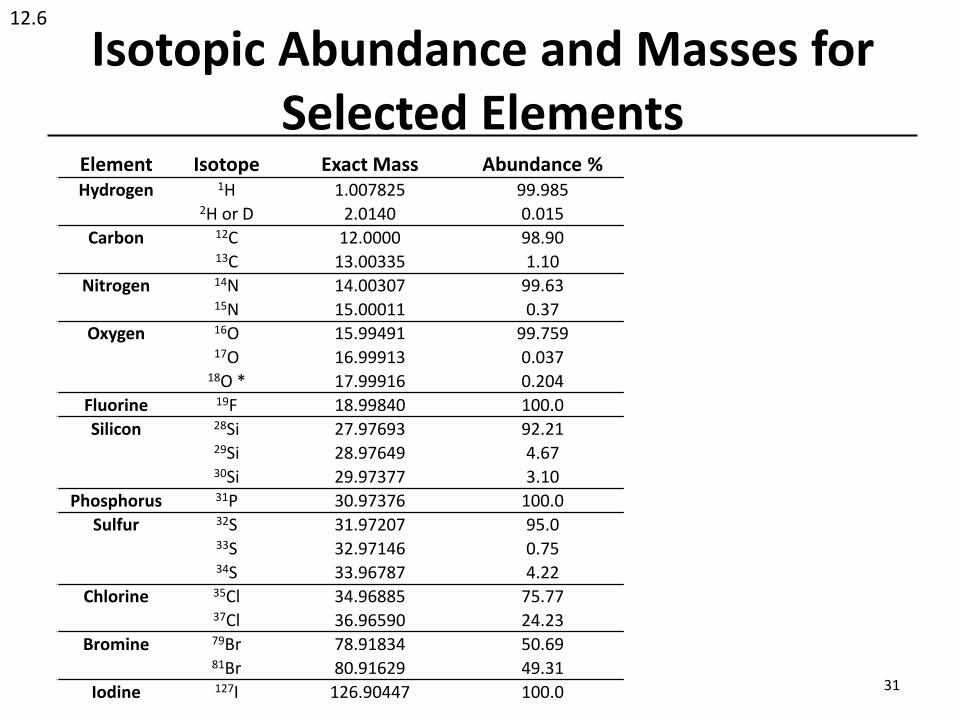
Isotopic Abundance and Masses for Selected Elements
31
12.6
Element Isotope Exact Mass Abundance %Hydrogen 1H 1.007825 99.985
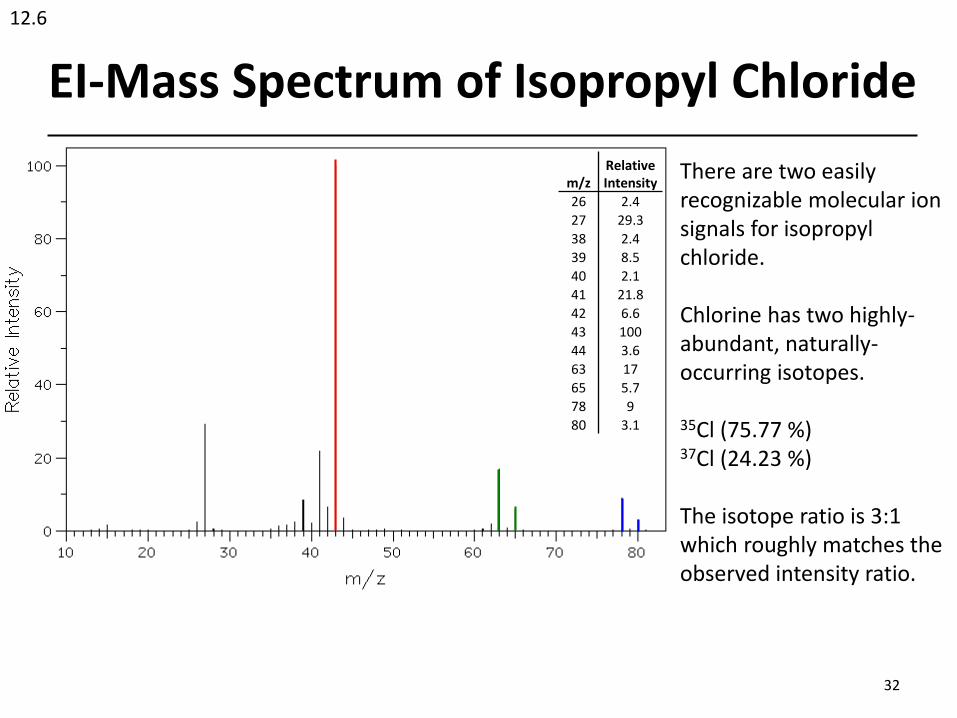
There are two easily recognizable molecular ion signals for isopropyl chloride.
Chlorine has two highly-abundant, naturally-occurring isotopes.
35Cl (75.77 %)37Cl (24.23 %)
The isotope ratio is 3:1 which roughly matches the observed intensity ratio.
12.6
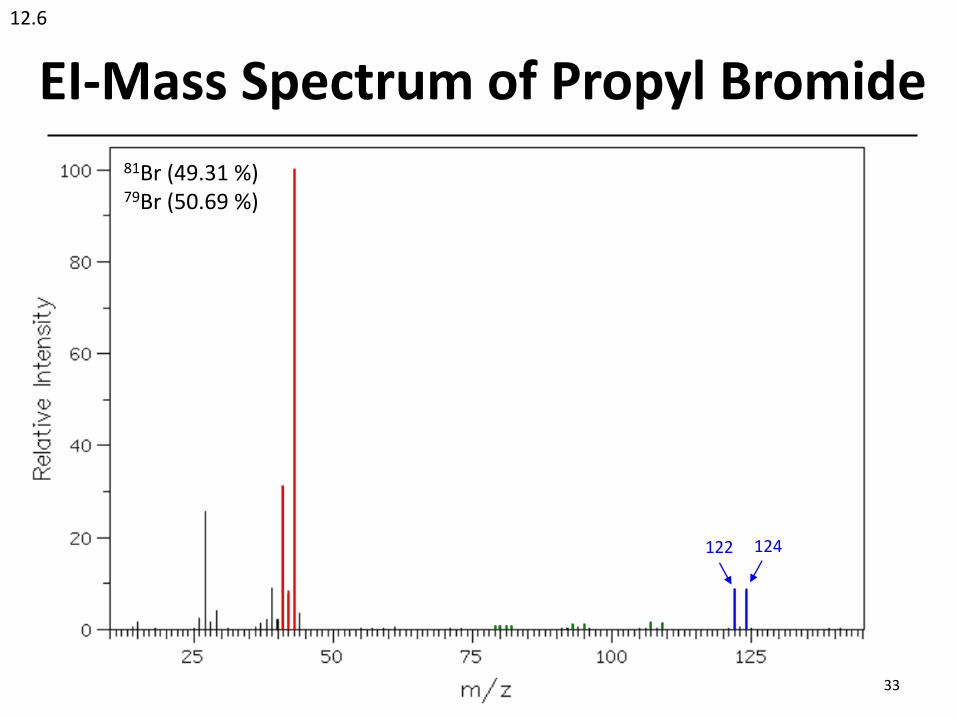
EI-Mass Spectrum of Propyl Bromide
33
81Br (49.31 %)79Br (50.69 %)
12.6
124122
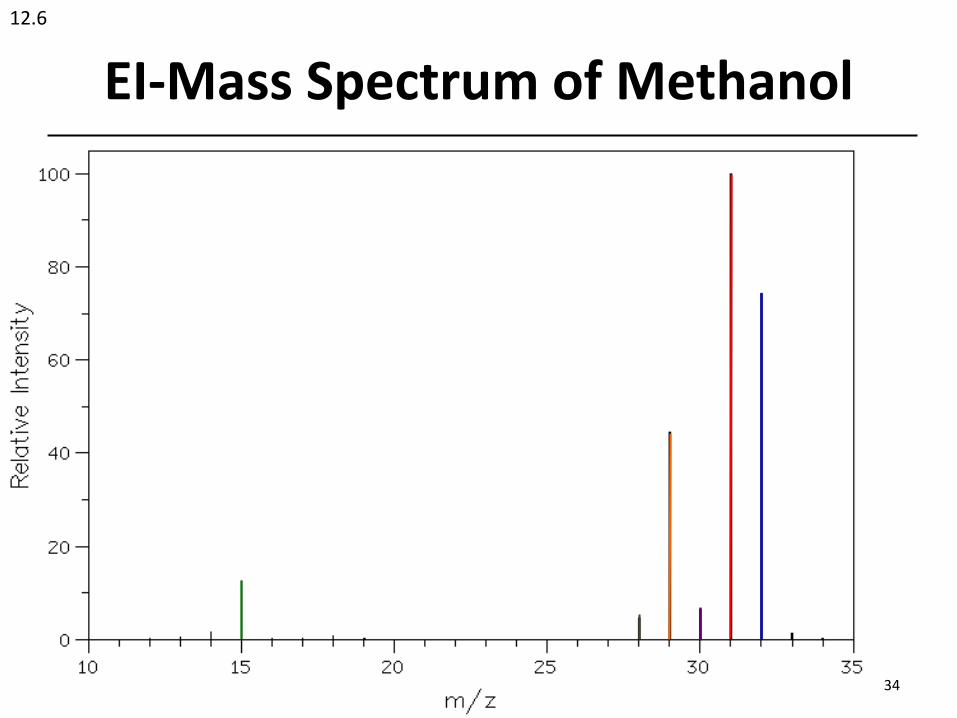
EI-Mass Spectrum of Methanol
34
12.6
EI-Mass Spectrum of Acetone
35
m/zRelative Intensity
14 2.9
15 23.1
26 3.5
27 5.7
29 3.1
38 2.2
39 4.2
42 9.1
43 100
44 3.4
58 63.8
59 3.1
19.3E
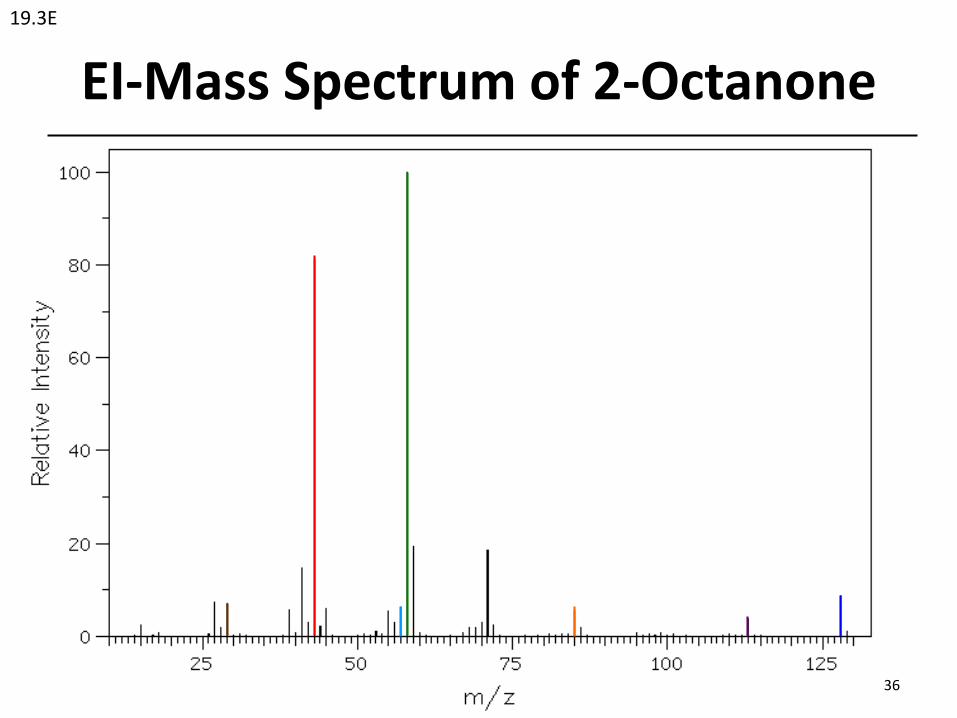
Acylium-type cations arecommon MS fragmentsproduced from carbonylcontaining compounds.
Acylium is also a reactiveintermediate in EAS(Friedel–Crafts) acylationreactions.
EI-Mass Spectrum of 2-Octanone
36
19.3E
Mass Spectrometry – Summary
37
Mass Spectrometry (MS) ionizes and energizes a molecule to determine its mass andconnectivity through fragmentation. Electron Impact – Mass Spectrometry (EI-MS) useshigh energy electrons to ionize the molecules.
Only cationic fragments are responsive to the magnetic field and detected.
Abundance of ions detected is dependent upon their rate of formation and their rate offragmentation.
More stable ions that are easy to form tend to be responsible for more intense signals.
1H-NMR & 13C-NMR Spectroscopy
38
13.1 - 13.2
Nuclear Magnetic Resonance Spectroscopy takes advantage of the magnetic spinproperties of some nuclei to provide detailed structural information about molecules.
Nuclei which have an odd number of protons and/or neutrons are NMR active and can bestudied by NMR.
NMR active nuclei: 1H, 13C, 15N, 19F, 31P
NMR inactive nuclei: 12C, 16O, 32S
most common NMR experiments
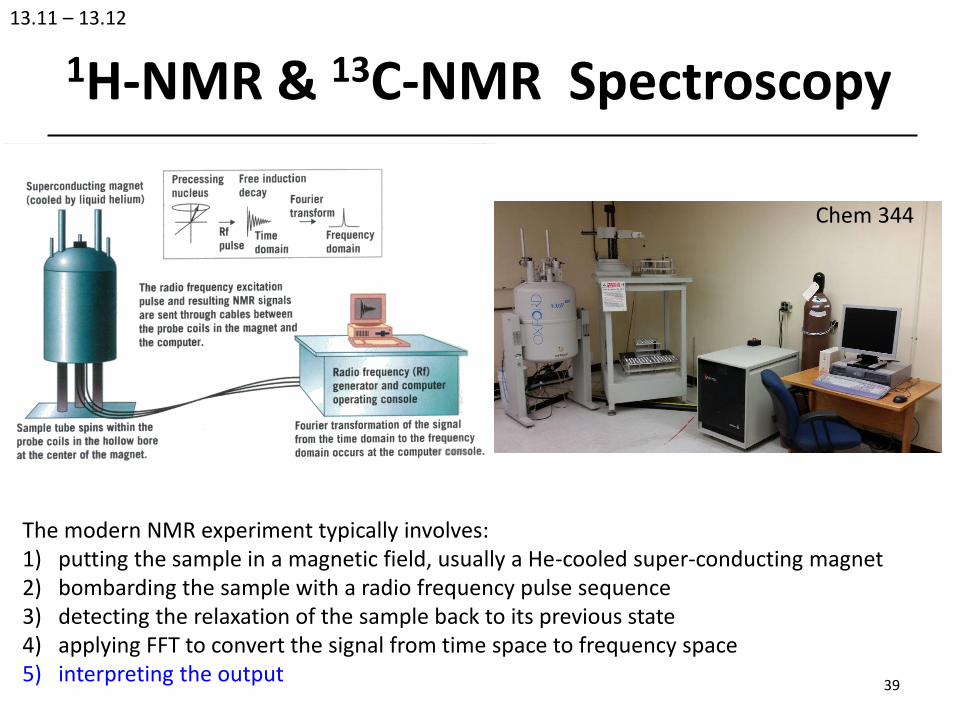
1H-NMR & 13C-NMR Spectroscopy
39
13.11 – 13.12
The modern NMR experiment typically involves:1) putting the sample in a magnetic field, usually a He-cooled super-conducting magnet2) bombarding the sample with a radio frequency pulse sequence3) detecting the relaxation of the sample back to its previous state4) applying FFT to convert the signal from time space to frequency space5) interpreting the output
Chem 344
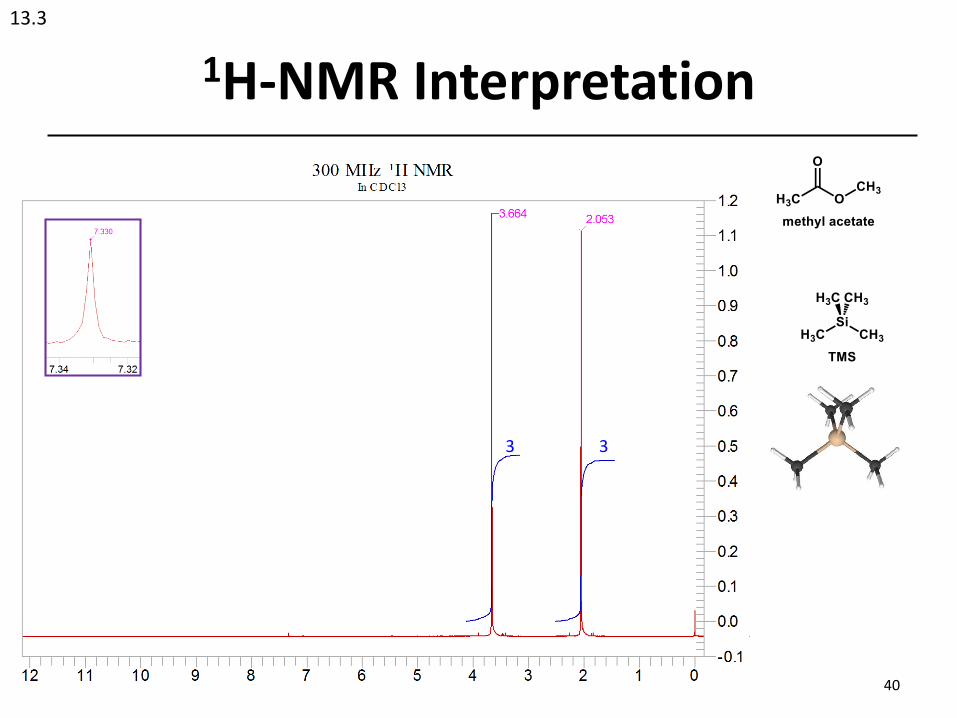
1H-NMR Interpretation
13.3
3 3
40
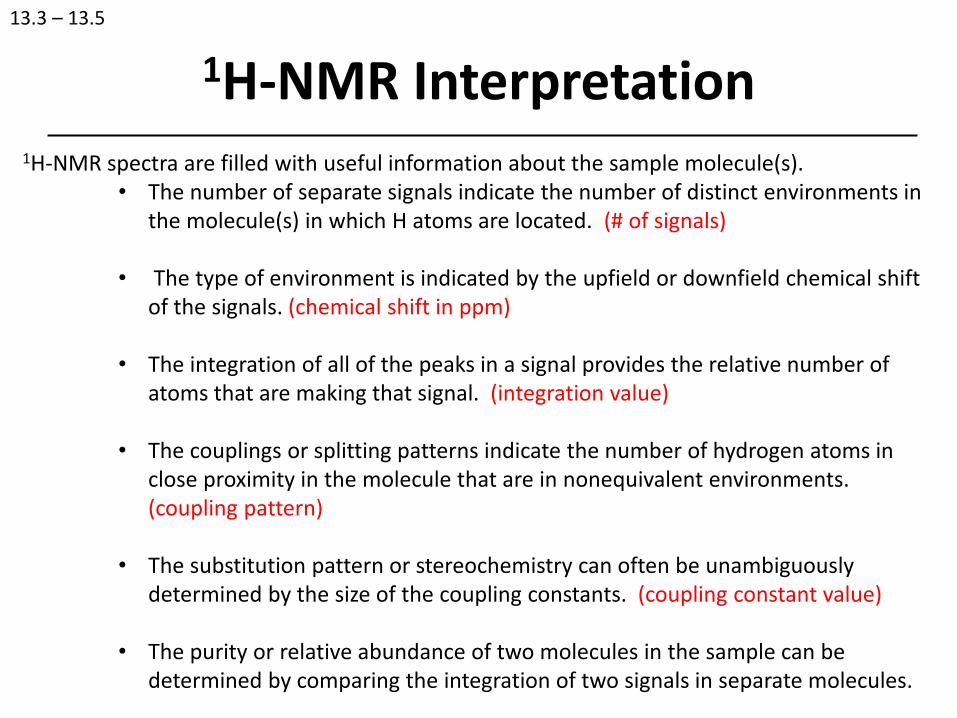
1H-NMR spectra are filled with useful information about the sample molecule(s).• The number of separate signals indicate the number of distinct environments in
the molecule(s) in which H atoms are located. (# of signals)
• The type of environment is indicated by the upfield or downfield chemical shift of the signals. (chemical shift in ppm)
• The integration of all of the peaks in a signal provides the relative number of atoms that are making that signal. (integration value)
• The couplings or splitting patterns indicate the number of hydrogen atoms in close proximity in the molecule that are in nonequivalent environments. (coupling pattern)
• The substitution pattern or stereochemistry can often be unambiguously determined by the size of the coupling constants. (coupling constant value)
• The purity or relative abundance of two molecules in the sample can be determined by comparing the integration of two signals in separate molecules.
1H-NMR Interpretation
13.3 – 13.5
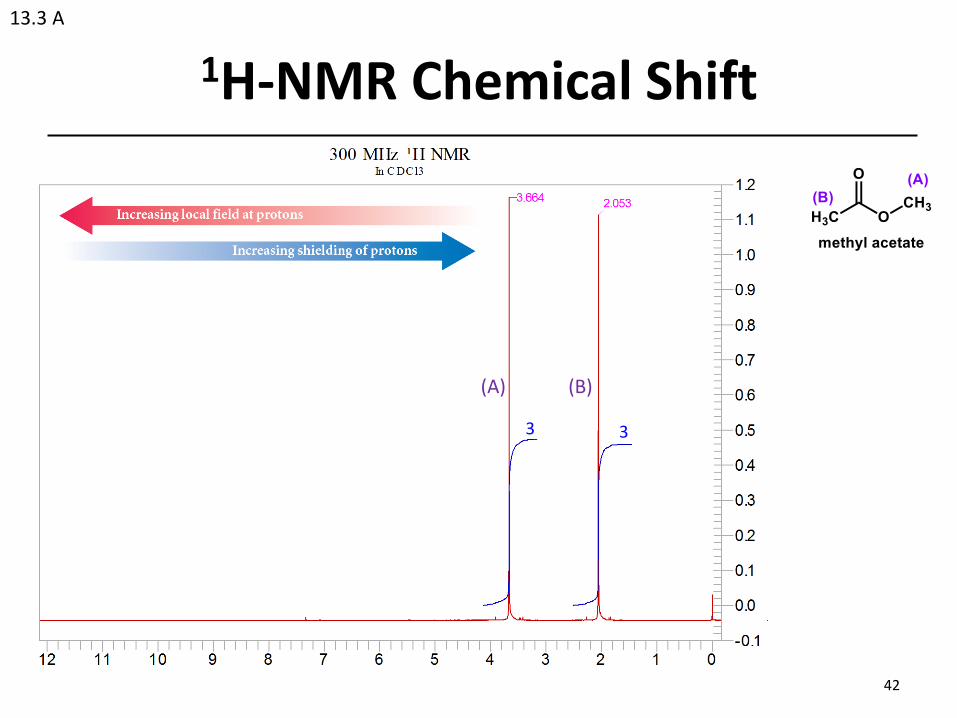
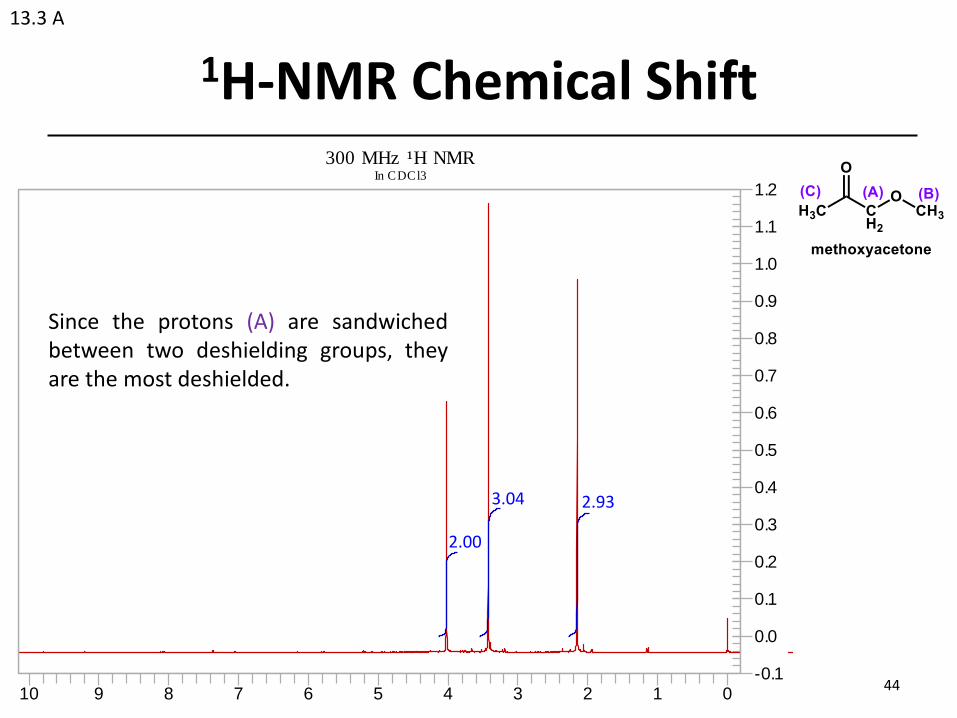
1H-NMR Chemical Shift
42
13.3 A
3 3
(A) (B)
1H-NMR Chemical Shift
43
13.3 A
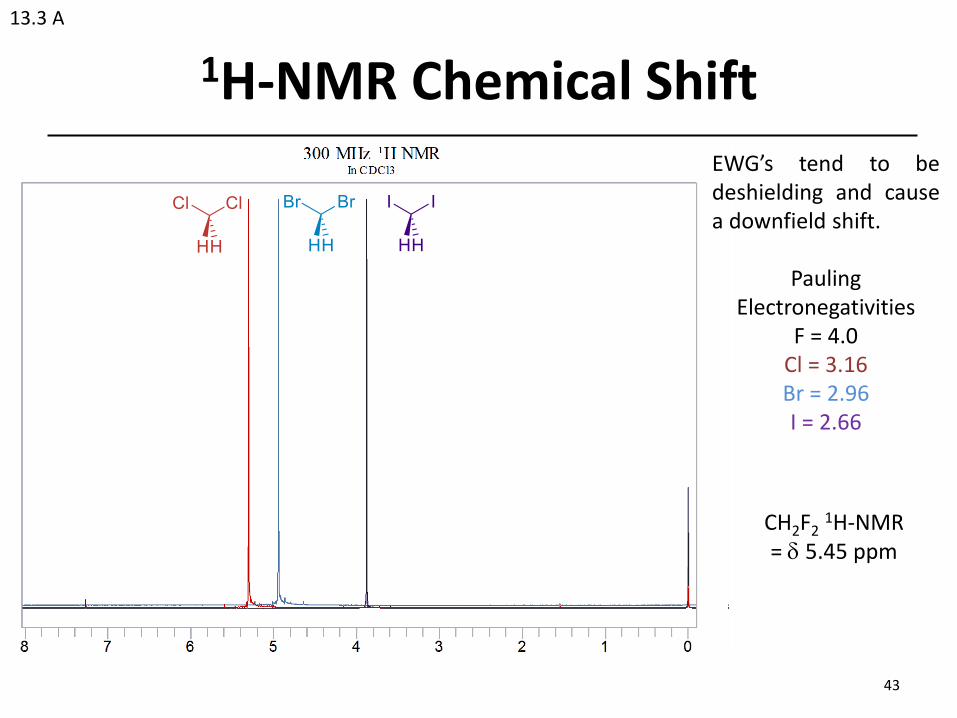
EWG’s tend to bedeshielding and causea downfield shift.
The simplest coupling patterns (resulting from equal coupling constants) in 1H-NMR can be interpreted by the n+1 rule where the number of peaks in a signal is equal to the number of nonequivalent vicinal hydrogen atom neighbors plus one.
𝑝𝑒𝑎𝑘𝑠 = 𝑛 + 1,
n
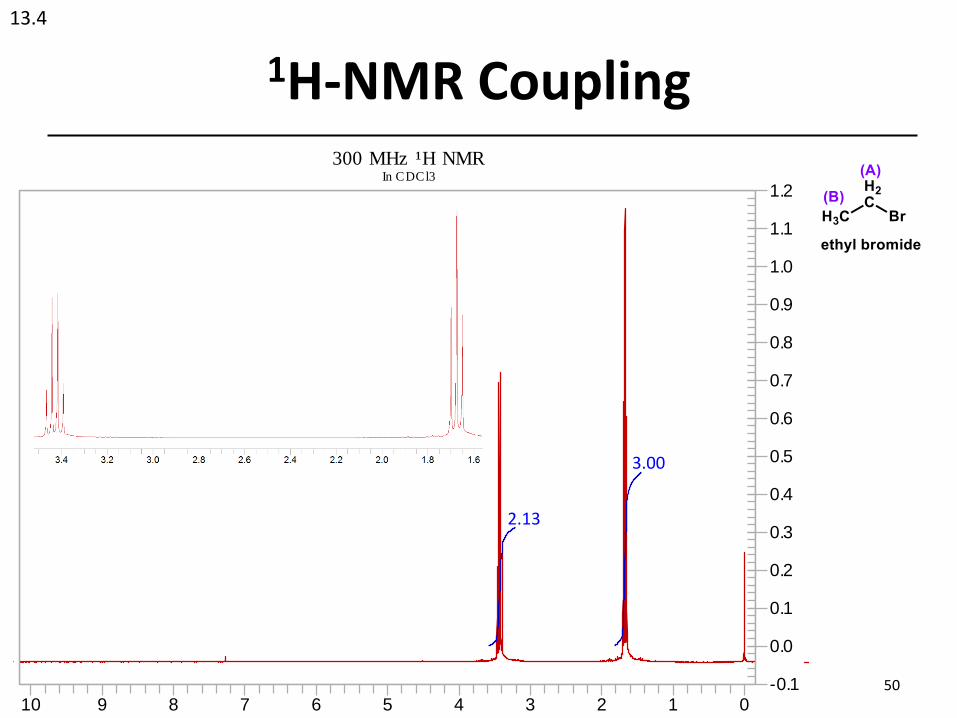
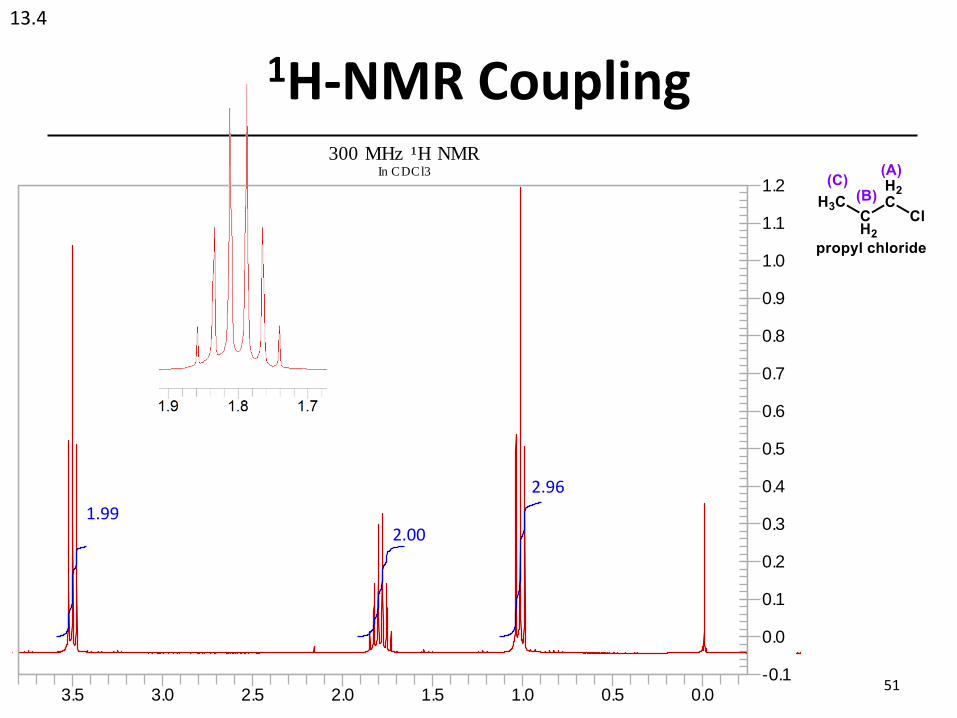
1H-NMR Coupling
49
13.4
The coupling of vicinal protons is due to the magnetic field created by each proton due to its spin. Each vicinal proton can either align parallel or anti-parallel to the external magnetic field which alters the resonance of individual protons.
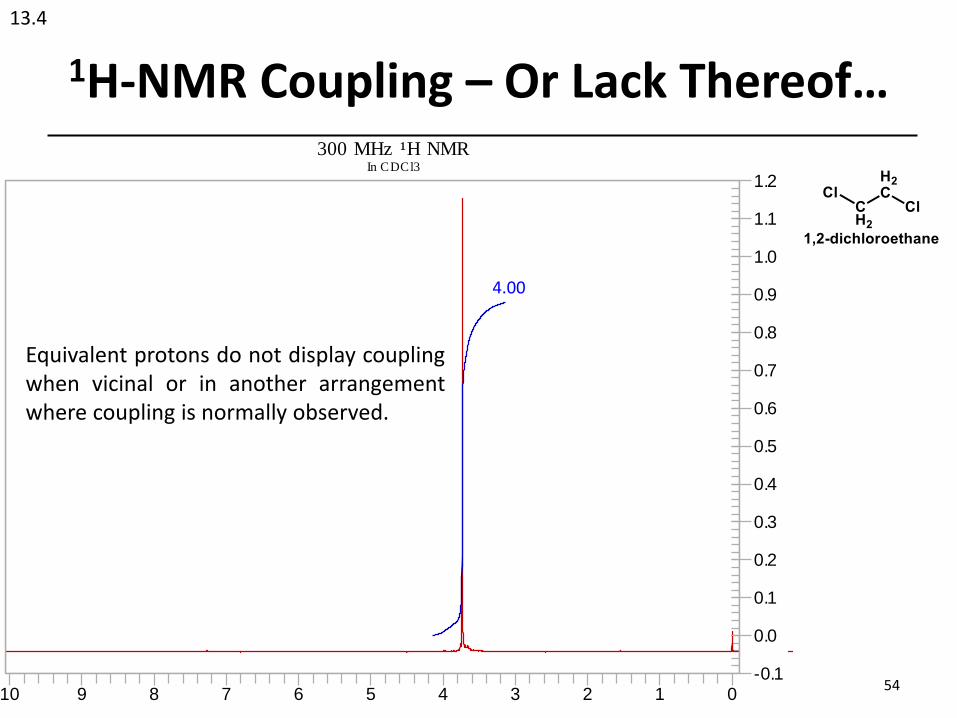
Equivalent protons do not display couplingwhen vicinal or in another arrangementwhere coupling is normally observed.
4.00
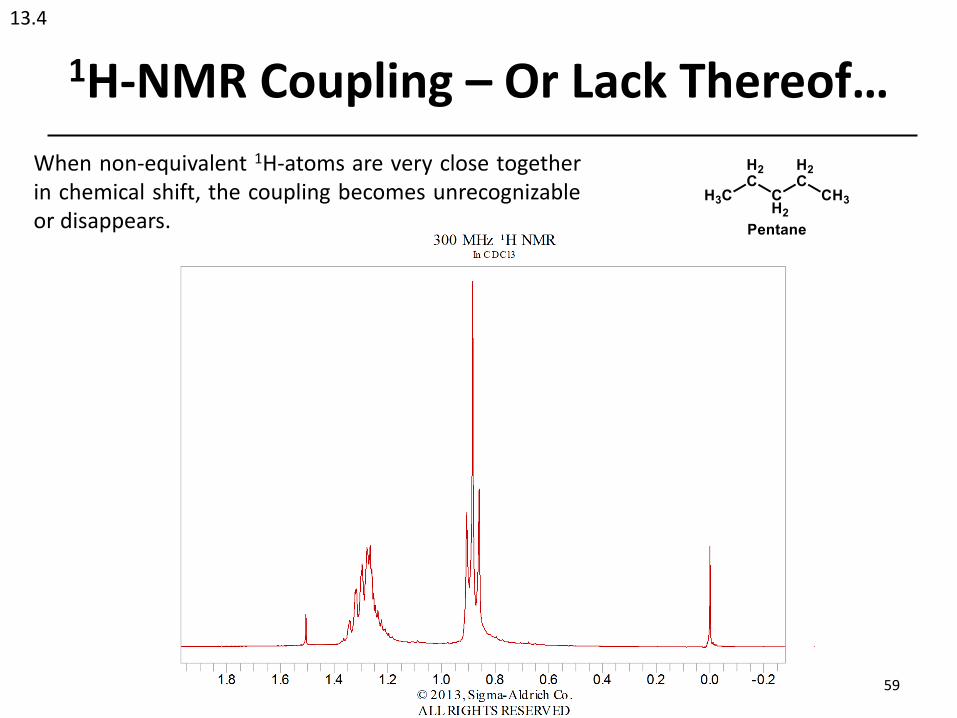
1H-NMR Coupling – Or Lack Thereof…
55
13.4
4.00
Equivalent protons do not needto be on the same C-atom.
6.10
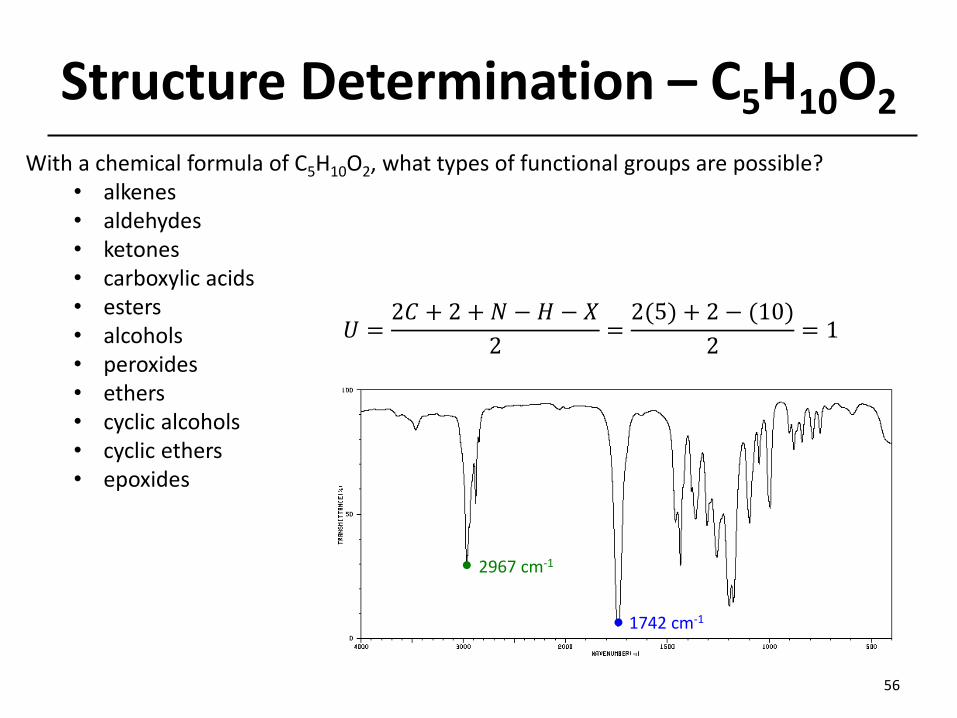
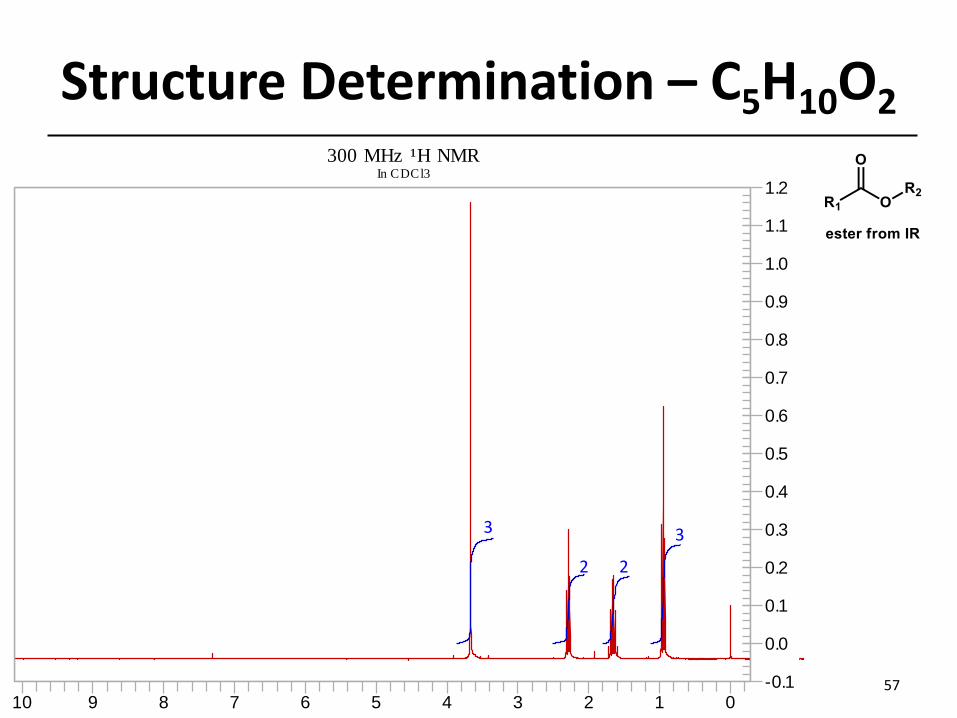
Structure Determination – C5H10O2
56
With a chemical formula of C5H10O2, what types of functional groups are possible?• alkenes• aldehydes• ketones• carboxylic acids• esters• alcohols• peroxides• ethers• cyclic alcohols• cyclic ethers• epoxides
When non-equivalent 1H-atoms are very close togetherin chemical shift, the coupling becomes unrecognizableor disappears.
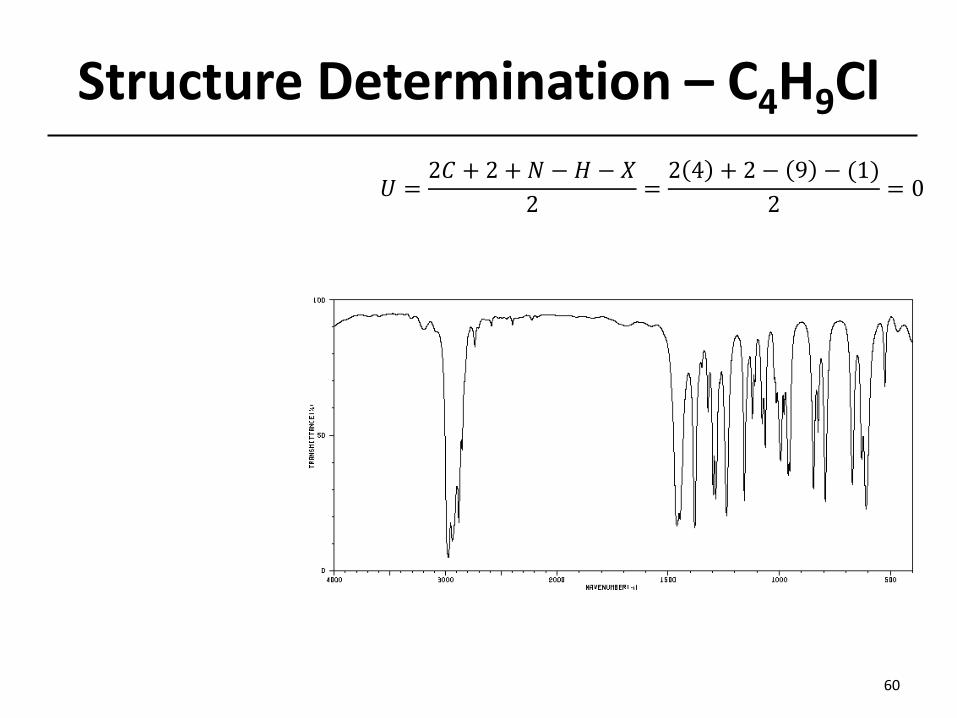
Structure Determination – C4H9Cl
60
𝑈 =2𝐶 + 2 + 𝑁 − 𝐻 − 𝑋
2=2 4 + 2 − 9 − (1)
2= 0
Structure Determination – C4H9Cl
61
0.97
3.12 3.00
2.14
1H-NMR – Diastereotopic Protons & 2nd Order Coupling
62
13.5 B
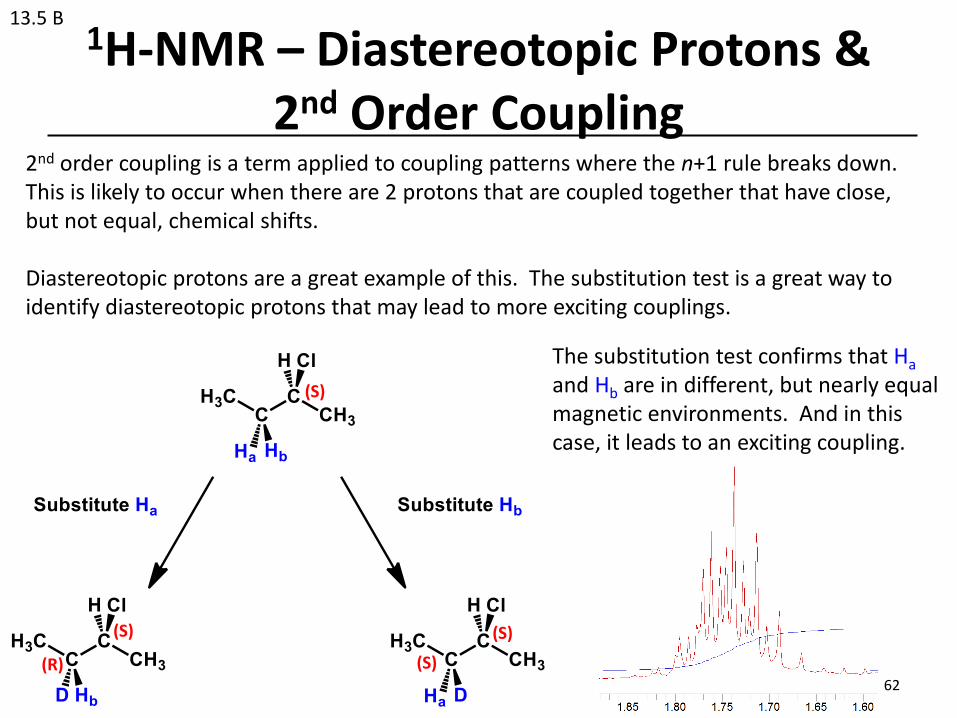
2nd order coupling is a term applied to coupling patterns where the n+1 rule breaks down. This is likely to occur when there are 2 protons that are coupled together that have close, but not equal, chemical shifts.
Diastereotopic protons are a great example of this. The substitution test is a great way to identify diastereotopic protons that may lead to more exciting couplings.
(S)
(S) (S)
(R) (S)
The substitution test confirms that Ha
and Hb are in different, but nearly equal magnetic environments. And in this case, it leads to an exciting coupling.
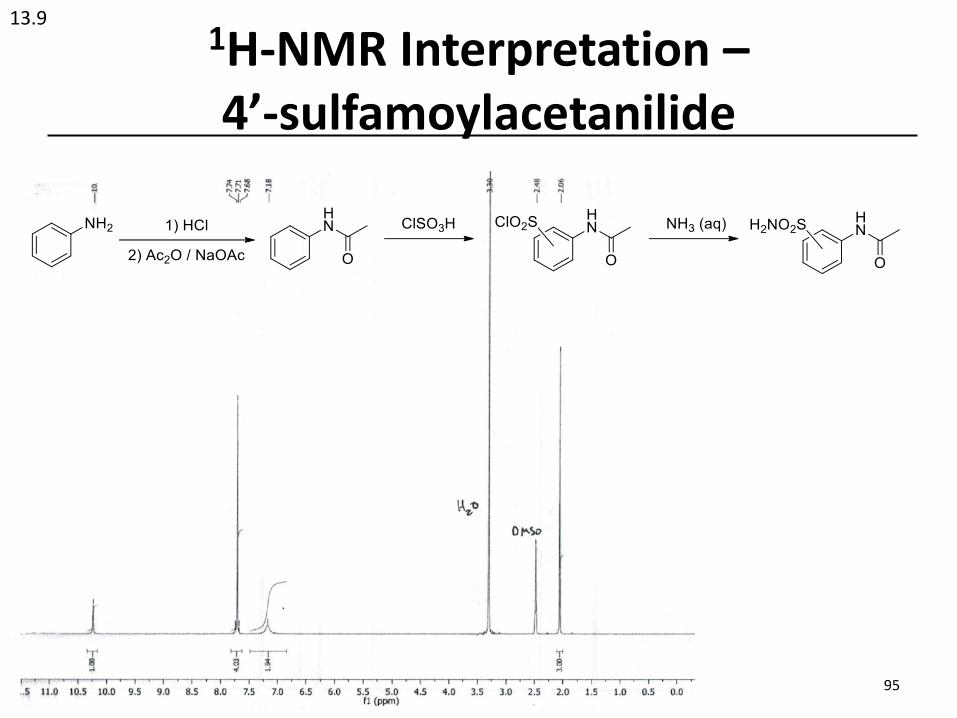
13C-NMR spectra are almost always decoupled and show no splitting or coupling. Since 13C is not highly abundant, 13C-NMR spectra are usually nosier. Signal integrals are not directly related to the number of atoms making the signal.
• The number of separate signals indicate the number of distinct environments in the molecule(s). (# of signals)
• The type of environment is indicated by the upfield or downfield chemical shift of the signals. (chemical shift in ppm)
13C-NMR Interpretation
13.9
63
13C-NMR Chemical Shift
13.9
64
13C-NMR Interpretation - Methanol
13.9
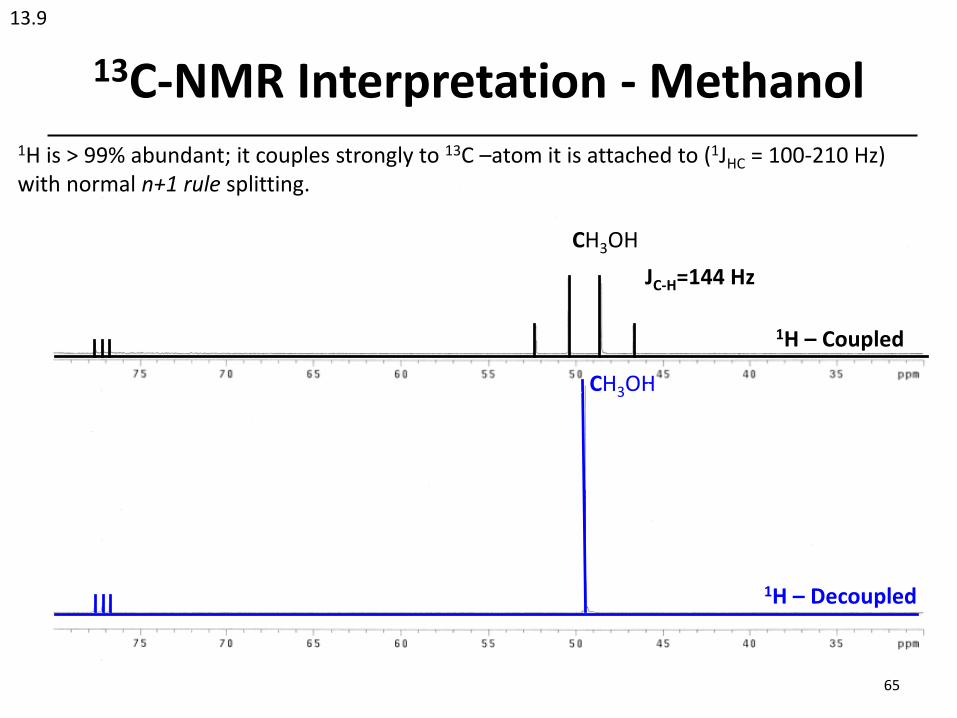
CH3OH
JC-H=144 Hz
1H is > 99% abundant; it couples strongly to 13C –atom it is attached to (1JHC = 100-210 Hz) with normal n+1 rule splitting.
CH3OH
1H – Decoupled
1H – Coupled
65
13C-NMR Interpretation – 2-Chlorobutane
13.9
66
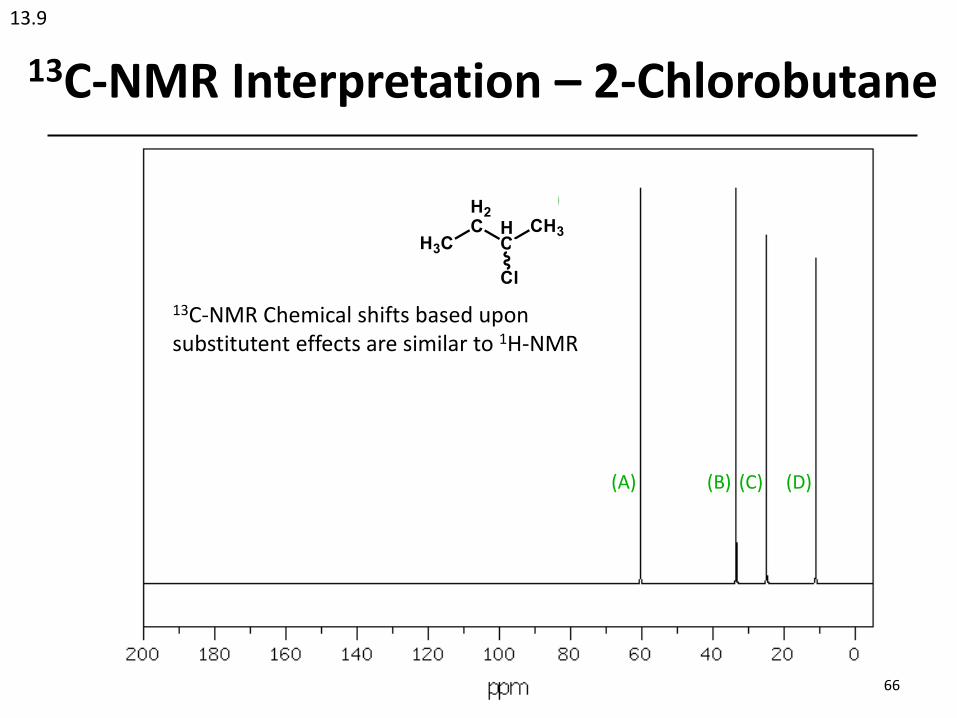
(A) (B) (C) (D)
13C-NMR Chemical shifts based upon substitutent effects are similar to 1H-NMR
1H-NMR Spectrum of n-pentane
67
13.4
6.09 6.00
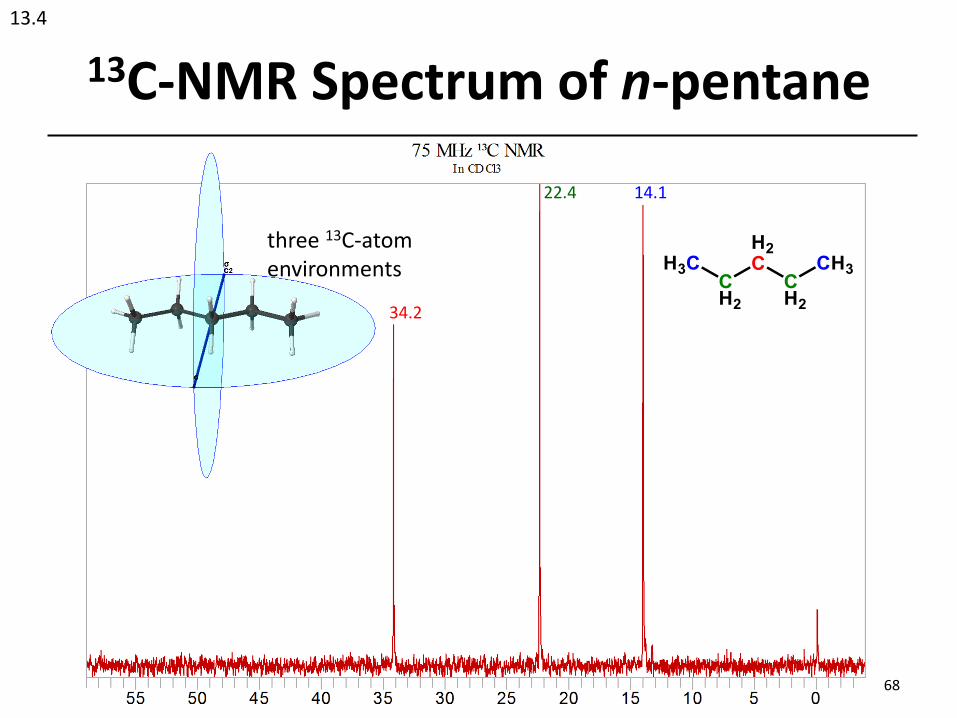
13C-NMR Spectrum of n-pentane
68
13.4
three 13C-atom environments
34.2
22.4 14.1
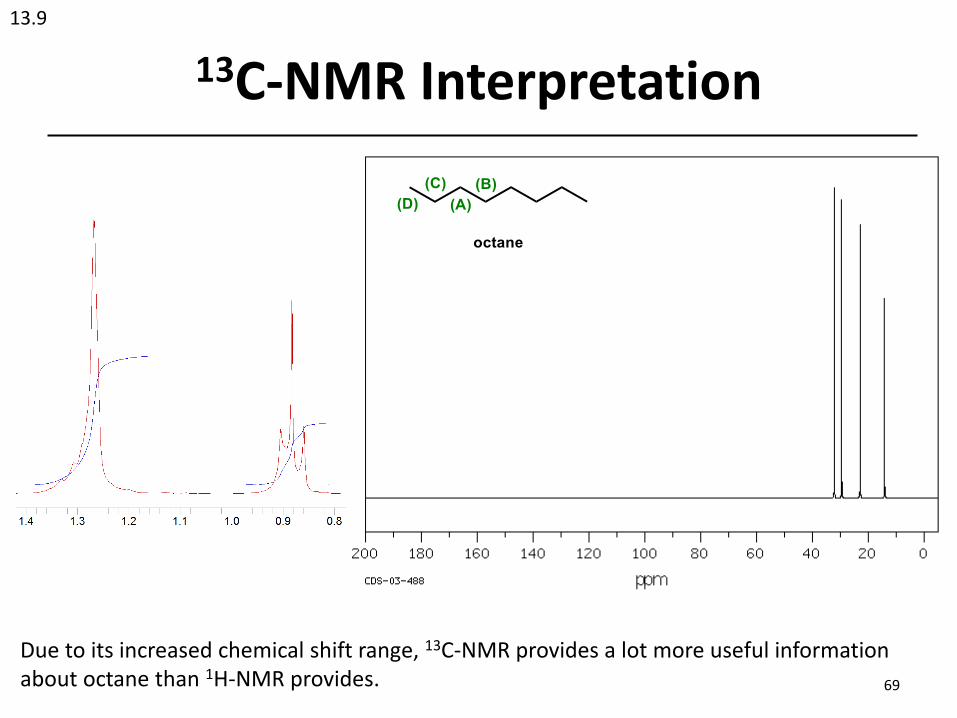
13C-NMR Interpretation
13.9
69
Due to its increased chemical shift range, 13C-NMR provides a lot more useful information about octane than 1H-NMR provides.
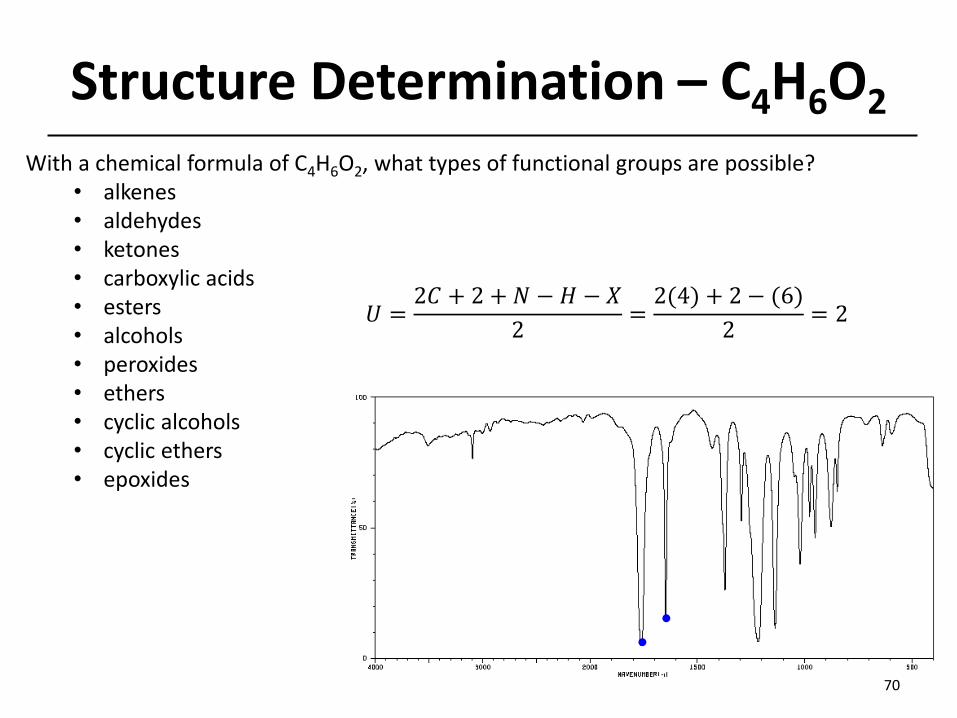
Structure Determination – C4H6O2
70
With a chemical formula of C4H6O2, what types of functional groups are possible?• alkenes• aldehydes• ketones• carboxylic acids• esters• alcohols• peroxides• ethers• cyclic alcohols• cyclic ethers• epoxides
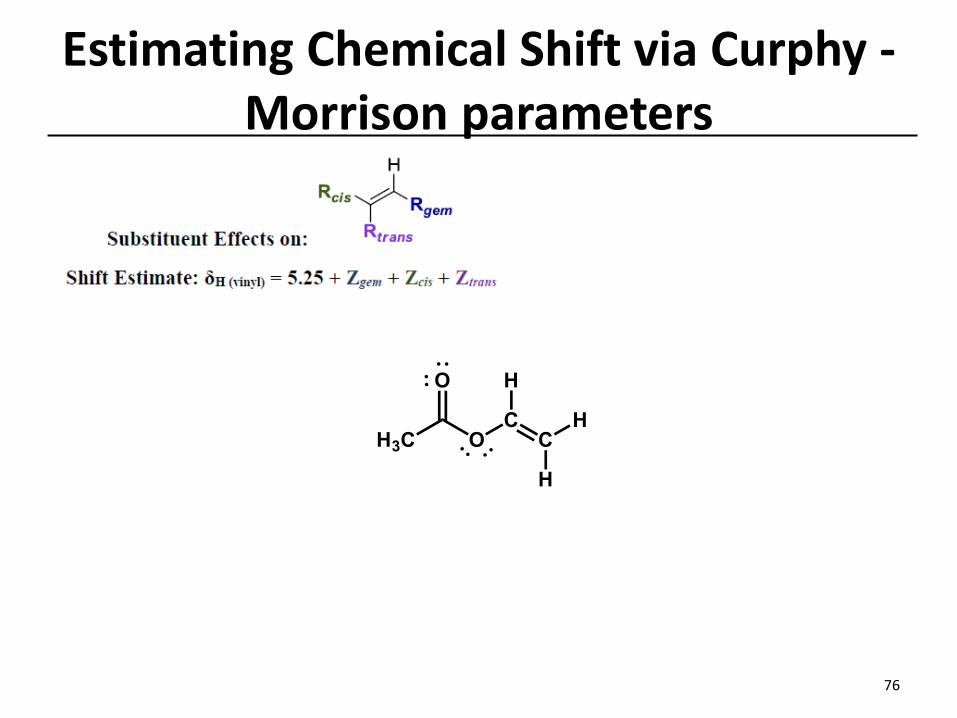
Due to the magnetic field of the electrons in the p bond, 1H-atoms attached to double-bonded C-atoms experience an enhanced magnetic field resulting in a significant downfield shift to about d 5.8 ± 1.5 ppm.
• Chemical shift varies with substitution.
• Coupling constants vary from trans, cis, and geminal protons.
1H-NMR Vinyl Region
75
13.5
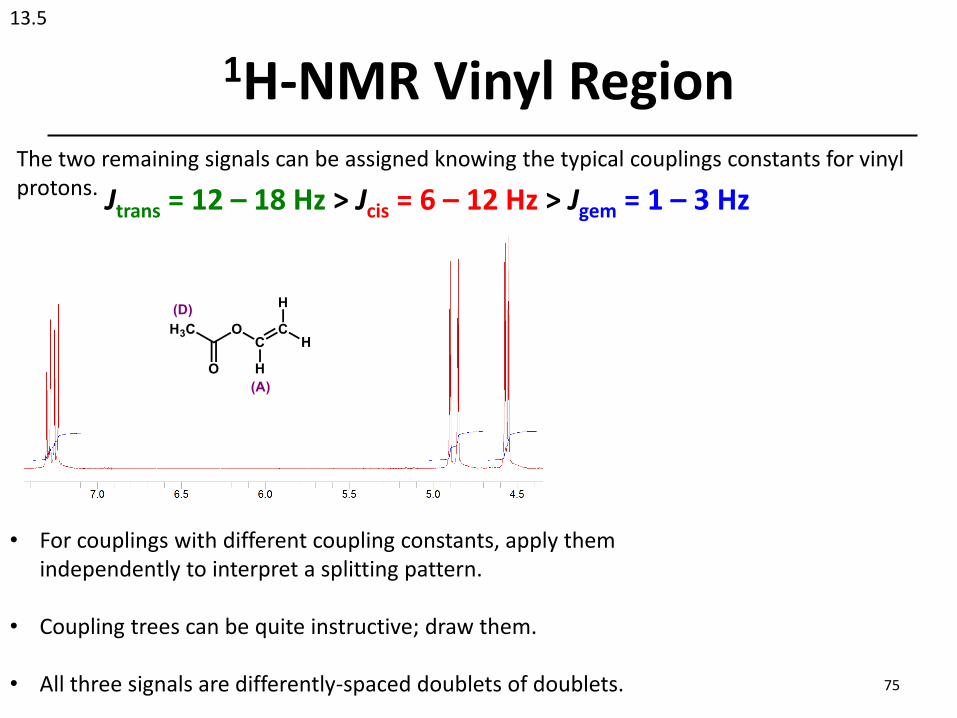
The two remaining signals can be assigned knowing the typical couplings constants for vinyl protons. Jtrans = 12 – 18 Hz > Jcis = 6 – 12 Hz > Jgem = 1 – 3 Hz
• For couplings with different coupling constants, apply them independently to interpret a splitting pattern.
• Coupling trees can be quite instructive; draw them.
• All three signals are differently-spaced doublets of doublets.
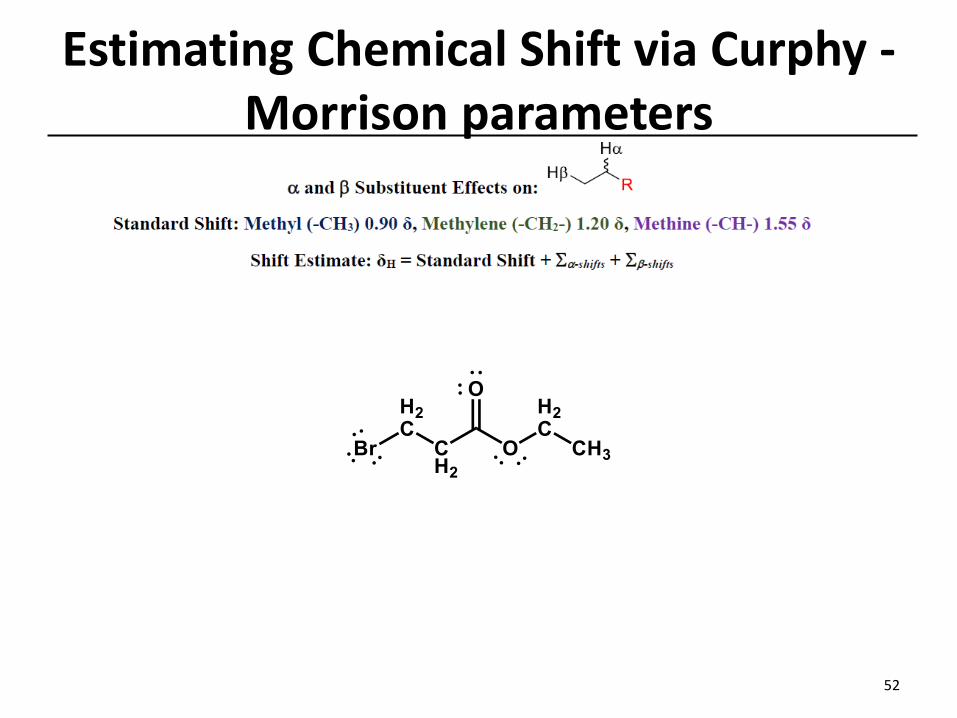
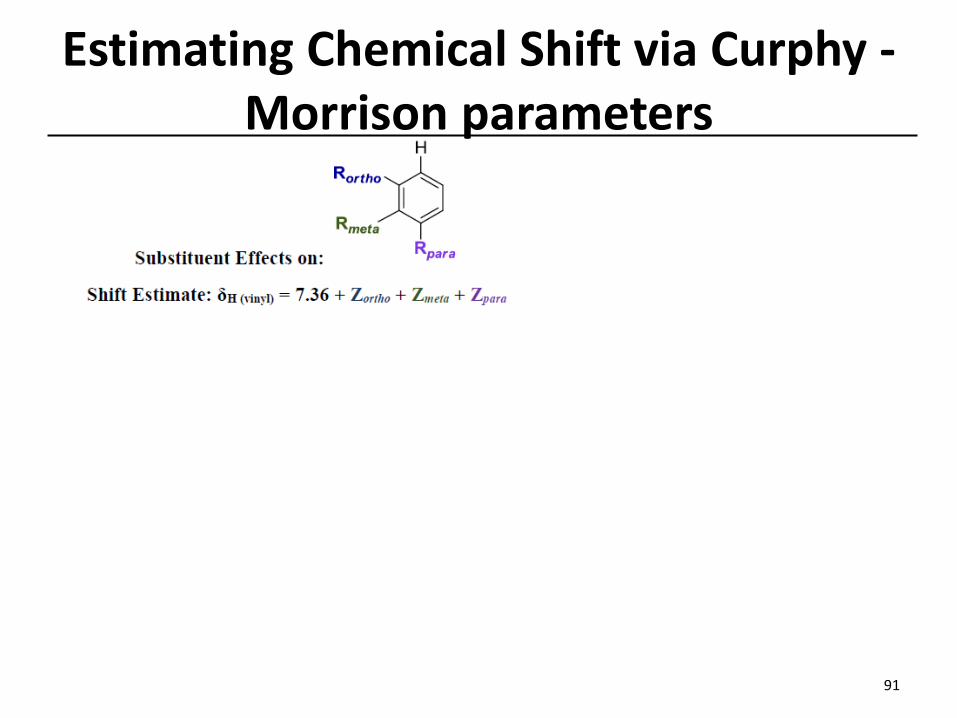
Estimating Chemical Shift via Curphy -Morrison parameters
76
Estimating Chemical Shift via Curphy -Morrison parameters
77
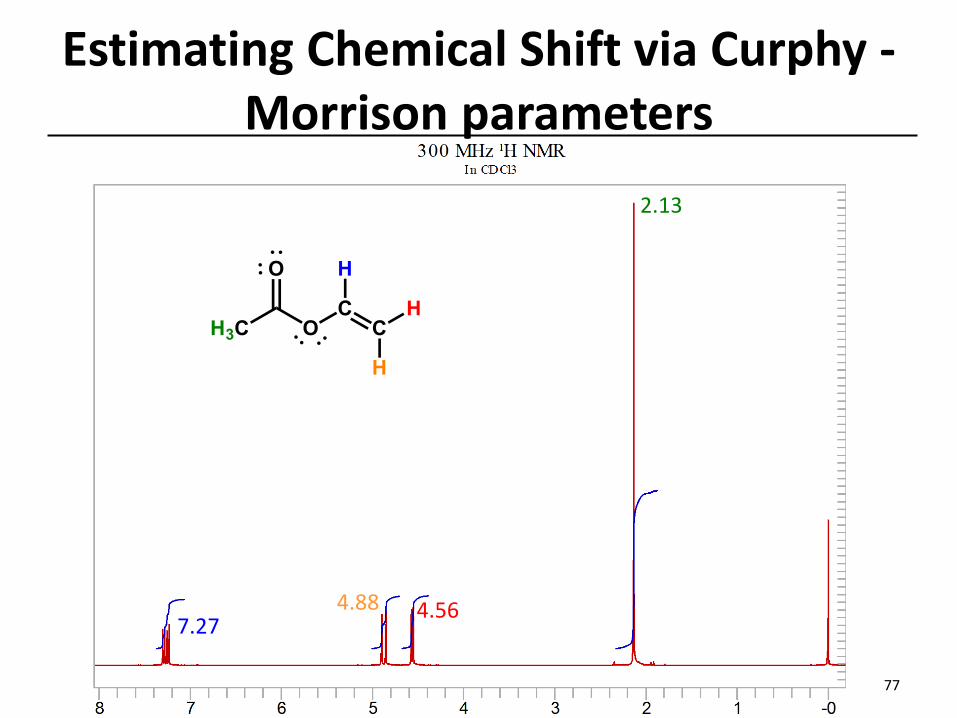
2.13
4.564.887.27
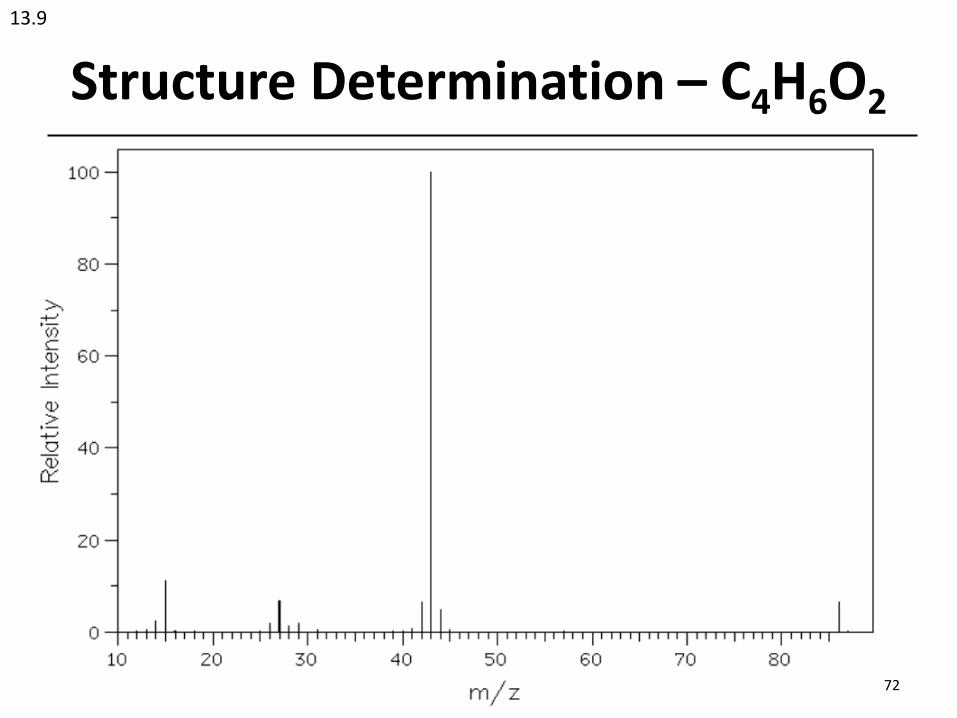
Structure Determination – C4H6O2
13.9
78
Structure Determination – C4H6O2
13.9
79
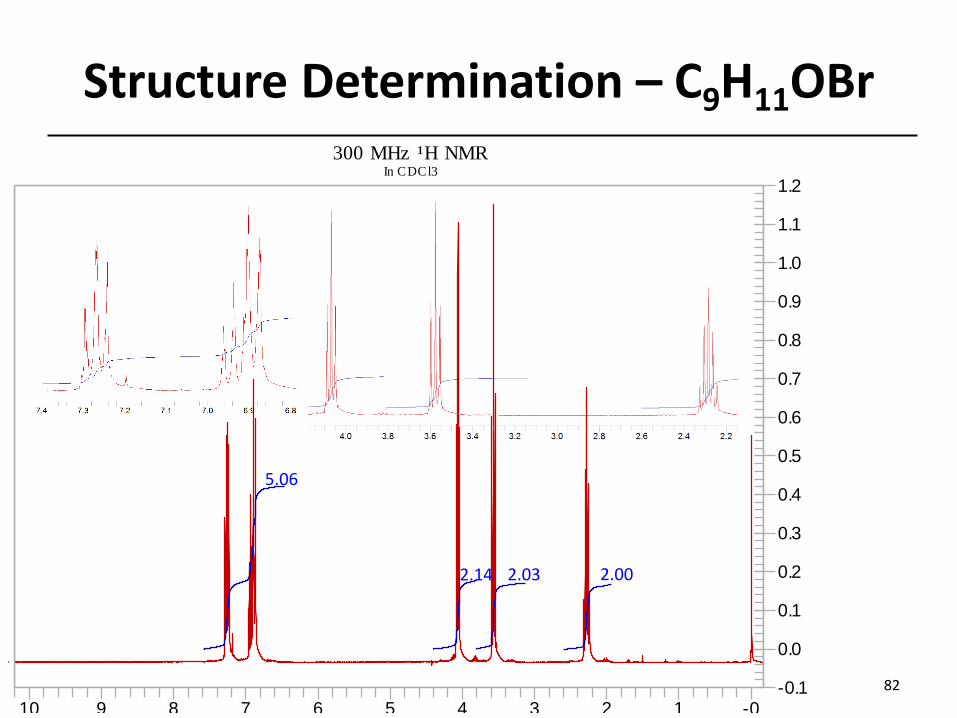
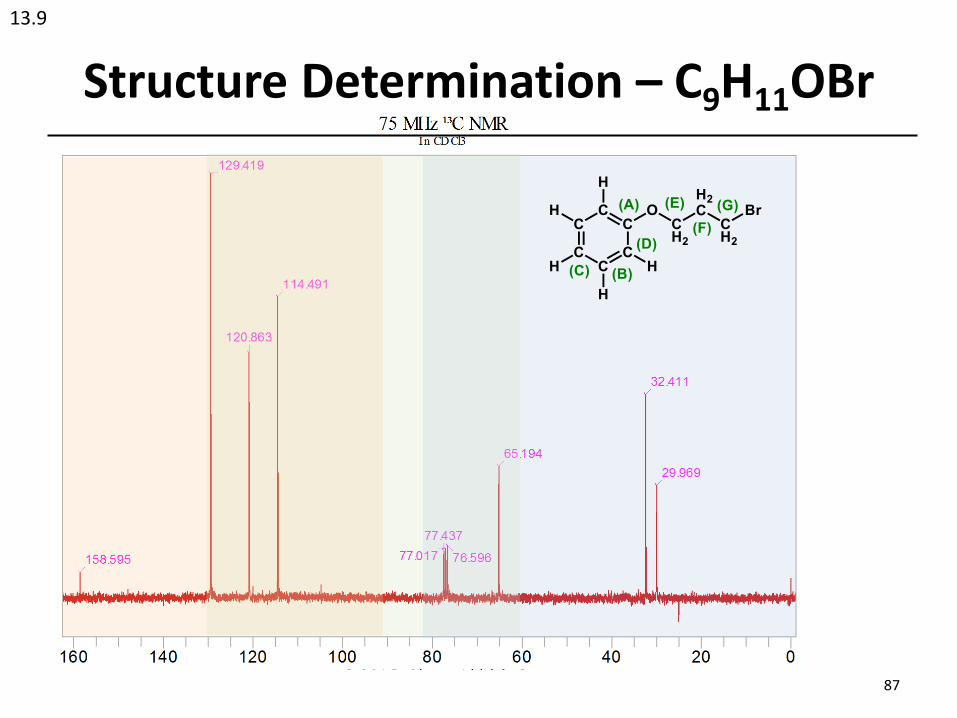
Structure Determination – C9H11OBr
80
With a chemical formula of C9H11OBr, what types of functional groups are possible?• alkenes• alkynes• arenes• aldehydes• ketones• alcohols• ethers• cyclic alcohols• cyclic ethers• epoxides• etc
Due to the local magnetic field created by the diatropic aromatic ring current, 1H-atoms attached to C-atoms that are part of a aromatic ring experience an enhanced magnetic field resulting in a significant downfield shift to about d 7.5 ± 1 ppm.
• Shift is much further downfield than for typical CH protons without multiple strong EWGs.
• Shift is further downfield than an H-atom on an alkene or conjugated diene; aromaticity is important.
• No coupling is observed for benzene as all protons are equivalent.
1H-NMR Aromatic Region
84
16.3
EWG or EDG substituents on aromatic rings can alter the electron density at a carbon atom in the ring which in turn impacts the shielding for a particular proton. (more e- = more shielding)
2
2
1(A) (B)(C)
(A)(B)
(C)
The coupling appears complicated, but can be interpreted without too much difficulty using the ortho couplings.
1H-NMR Aromatic Region
85
16.3
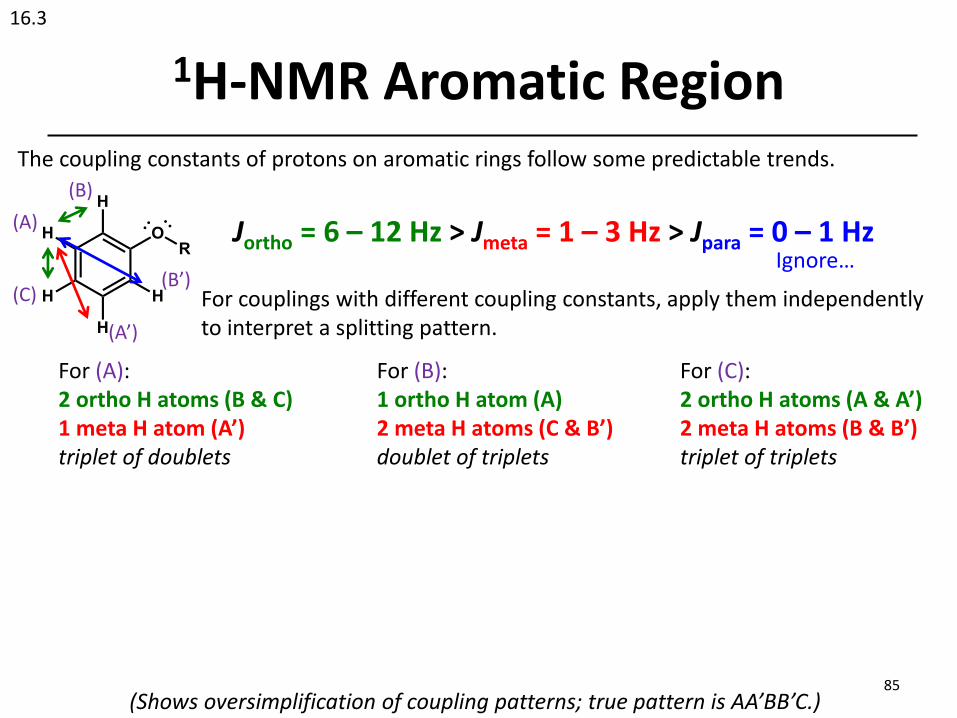
The coupling constants of protons on aromatic rings follow some predictable trends.
For couplings with different coupling constants, apply them independently to interpret a splitting pattern.
(A)
(B)
(C)
For (A):2 ortho H atoms (B & C)1 meta H atom (A’)triplet of doublets
For (B):1 ortho H atom (A)2 meta H atoms (C & B’)doublet of triplets
For (C):2 ortho H atoms (A & A’)2 meta H atoms (B & B’)triplet of triplets
(Shows oversimplification of coupling patterns; true pattern is AA’BB’C.)
(A’)
(B’)
1H-NMR Aromatic Region
86
16.3
(A)
(B)
(C)
(A): triplet of doublets (B): doublet of triplets (C): triplet of triplets
(A) (B)(C)
This approach is an over-simplification of the coupling, but works well enough in most simple cases to make assignments.
Usually assignments can be made from the ortho couplings alone; focus on them.
Structure Determination – C9H11OBr
13.9
87
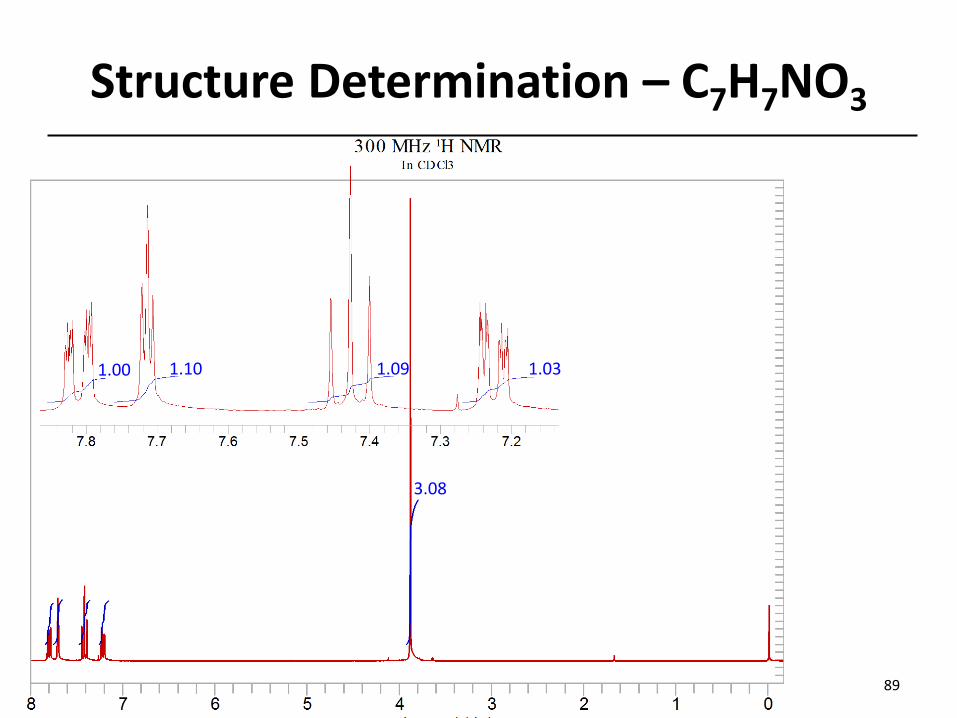
Structure Determination – C7H7NO3
88
𝑈 =2𝐶 + 2 + 𝑁 − 𝐻 − 𝑋
2=2 7 + 2 + (1) − 7
2= 5
Structure Determination – C7H7NO3
89
3.08
1.031.091.101.00
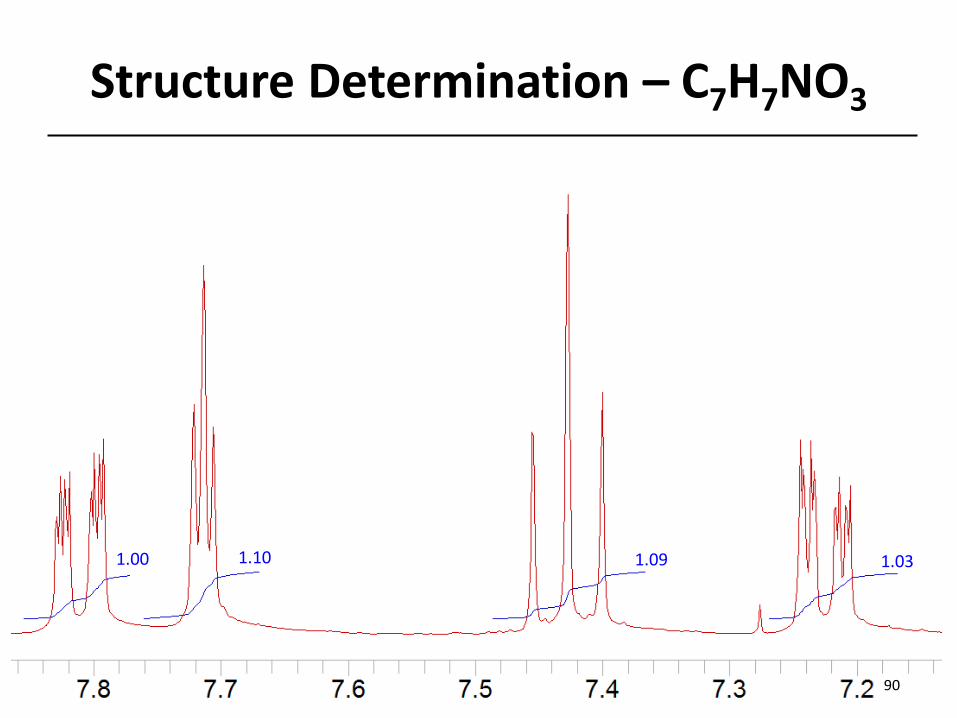
Structure Determination – C7H7NO3
90
1.031.091.101.00
Estimating Chemical Shift via Curphy -Morrison parameters
91
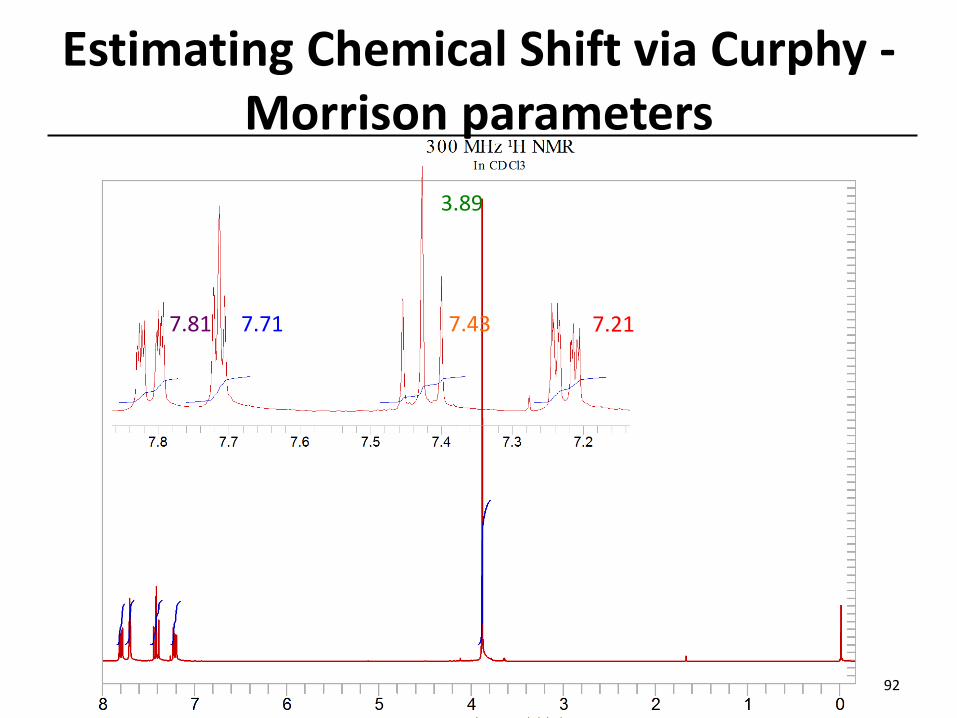
Estimating Chemical Shift via Curphy -Morrison parameters
92
3.89
7.437.717.81 7.21
93
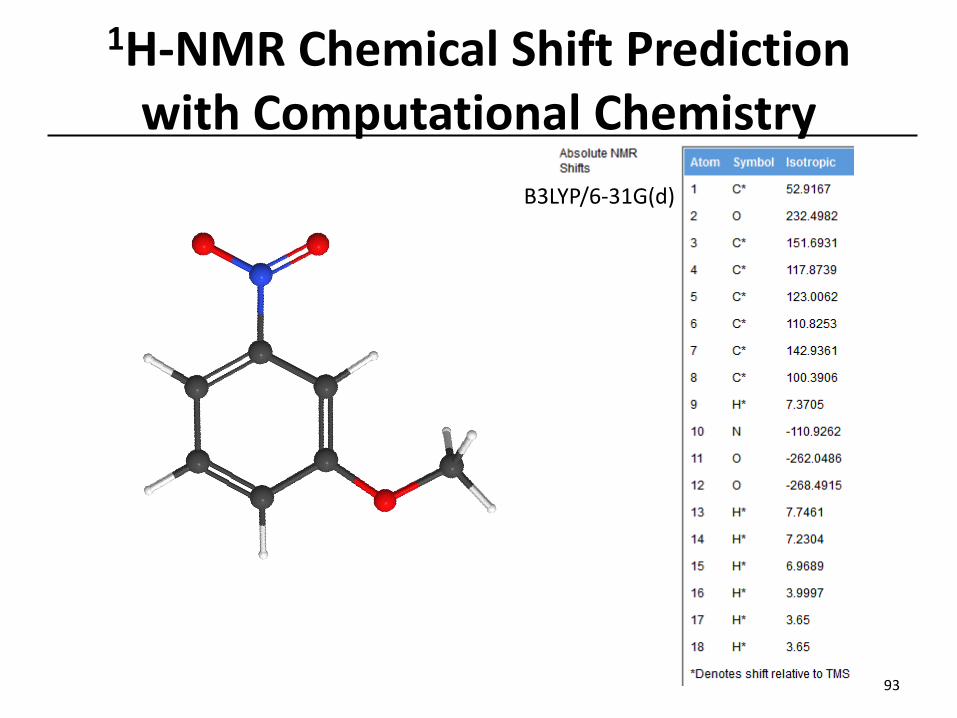
1H-NMR Chemical Shift Prediction with Computational Chemistry
B3LYP/6-31G(d)
Structure Determination – C7H7NO3
94
(A) (G)
(B)
(C)
(D)
(E)(F)
1H-NMR Interpretation –4’-sulfamoylacetanilide
13.9
95
13C-NMR Interpretation –4’-sulfamoylacetanilide
13.9
96
A B C
D E
F
NMR Spectroscopy – Summary
97
13, 16.3
1H-NMR and 13C-NMR spectra are very useful for structural determination of sample molecule(s).
• NMR techniques are based upon the interaction between radio frequency light and the magnetic properties of the nuclei in a molecule.
• 1H-NMR and 13C-NMR spectra commonly use TMS as a 0 ppm standard.
• Important information is found in the # of signals, chemical shift in ppm, integration value, coupling pattern, and coupling constant value.
• For 1st order 1H-NMR spectra, the n+1 rule is highly useful for interpreting coupling patterns.
• The size of the coupling constants can be used to interpret stereochemical and regiochemical relationships of protons.
References and Acknowledgements
98
1) All computational values were calculated in WebMO running Gaussian 09 using B3LYP/6-31G(d). Atomic charges were calculated using NBO 6.0 unless otherwise noted.
2) All 1H-NMR spectra were obtained from the Sigma-Aldrich Spectral Viewer unless otherwise noted.
3) Vibrational potential surface taken from http://www.chemtube3d.com/spectrovibwater1-CE-final.html
4) All MS, IR and 13C-NMR spectra were obtained from the Spectral Database of Organic Compounds (SDBS). National Institute of Advanced Industrial Science and Technology (AIST) http://riodb01.ibase.aist.go.jp/sdbs/cgi-bin/cre_index.cgi?lang=eng
5) Many images were obtained from Loudon 5th edition 2009.
6) Amberger, B. K.; Esselman, B. J.; Woods, R. C.; McMahon, R. J., Millimeter-wave spectroscopy of carbonyl diazide, OC(N3)2. J. Mol. Spectrosc. 2014, 295, 15-20.
7) Bonvallet, P. A.; McMahon, R. J., Generation, Characterization, and Rearrangements of 4,5-Benzocyclohepta-1,2,4,6-tetraene. J. Am. Chem. Soc. 2000, 122 (38), 9332-9333.