In-Depth Survey Report Field Evaluation of the NIOSH Mini-Baghouse Assembly Generation 3 for Control of Silica Dust on Sand Movers Barbara M. Alexander, Eric J. Esswein, Michael G. Gressel, Jerry L. Kratzer, H. Amy Feng, Arthur L. Miller, Emanuele Cauda and Graeham Heil Division of Applied Research and Technology Engineering and Physical Hazards Branch EPHB Report No. 373-12a Southwestern Energy (SWN) North Little Rock, Arkansas July 2016 DEPARTMENT OF HEALTH AND HUMAN SERVICES Centers for Disease Control and Prevention National Institute for Occupational Safety and Health
Transcript
In-Depth Survey Report
Field Evaluation of the NIOSH Mini-Baghouse Assembly Generation 3 for Control of Silica Dust on Sand Movers
Barbara M. Alexander, Eric J. Esswein, Michael G. Gressel, Jerry L. Kratzer, H. Amy Feng, Arthur L. Miller, Emanuele Cauda and Graeham Heil
Division of Applied Research and Technology Engineering and Physical Hazards Branch EPHB Report No. 373-12a Southwestern Energy (SWN) North Little Rock, Arkansas
July 2016
DEPARTMENT OF HEALTH AND HUMAN SERVICES Centers for Disease Control and Prevention National Institute for Occupational Safety and Health
EPHB Report No. 373-12a
Page ii
Site Surveyed: SWN Sand Company
NAICS Code: 211111
Survey Dates: May 19 – 21, 2015
Surveys Conducted by: Barbara Alexander, Eric Esswein, Bradley King, Michael Gressel, Jerry Kratzer, Arthur Miller, Emanuele Cauda, Graeham Heil
Employer/Employee Representatives Contacted: Allen Green, Ted Hunter, Tom Huetter and Jim Bolander
Contractor Representatives: N/A
EPHB Report No. 373-12a
Page iii
Disclaimer Mention of any company or product does not constitute endorsement by NIOSH. In addition, citations to websites external to NIOSH do not constitute NIOSH endorsement of the sponsoring organizations or their programs or products. Furthermore, NIOSH is not responsible for the content of these websites. All Web addresses referenced in this document were accessible as of the publication date.
EPHB Report No. 373-12a
Page iv
Acknowledgements NIOSH thanks and acknowledges Southwestern Energy (SWN) for their enduring leadership in occupational health and safety by agreeing to partner with NIOSH in safety and health research through the NIOSH Field Effort to Assess Chemical Exposures in Oil and Gas Workers. The authors further express their sincere gratitude to Messrs. Jim Bolander, Allen Green, Ted Hunter, Tom Huetter and others at SWN for their support of the field evaluation of the mini baghouse retrofit assembly. The authors thank Kenneth Strunk (NIOSH, Spokane) for his computer-generated rendering of a sand mover used in the report and Dylan Neu and Daniel Farwick (NIOSH, Cincinnati) for assistance in preparing the NIOSH mini-baghouse for field trials.
EPHB Report No. 373-12a
Page v
Table of Contents
Disclaimer ........................................................................................ iii Acknowledgements ........................................................................... iv
Abstract ........................................................................................... vi Introduction ...................................................................................... 1
Background for Control Technology Studies ........................................ 1
Background for this Study ................................................................ 1
Risks for Mineral and Chemical Exposures in Unconventional Oil and Gas Extraction .............................................................................. 1
Abstract Exposure risks to worker health at unconventional oil and gas extraction sites can include chemicals and inhalation of respirable crystalline silica (RCS). National Institute for Occupational Safety and Health (NIOSH) researchers have identified concentrations of RCS at hydraulic fracturing sites that can be 10-50 times higher than the Occupational Safety and Health Administration (OSHA) Permissible Exposure Limit (PEL). NIOSH research has identified at least 7 point sources where silica dust is generated.
Engineering controls have been proposed by NIOSH to limit dust generation at some of the known locations of most concern. One of these controls is a NIOSH-developed mini-baghouse retrofit assembly (NMB), to be mounted on the thief hatches on top of the sand mover, one of the largest sources of dust generation. This report details the results of a trial of the 3rd generation of the NMB that occurred at Southwestern Energy (SWN) Sand Company in North Little Rock, Arkansas, May 19 – 21, 2015. This trial is a follow-up to the 2013 test of the 2nd generation of the technology [Alexander et al. 2016; NIOSH 2015].
Area air samples were collected at 12 locations on and around a sand mover with and without the mini-baghouse retrofit assembly in place. Samples were analyzed for respirable dust and RCS. Improvements made to the design of the mini-baghouse retrofit assembly enhanced performance relative to the generation 2 version. Results indicate that the mini-baghouse retrofit assembly effectively reduced both respirable dust and RCS downwind of the thief hatches. Reductions of airborne respirable dust at the three locations with the highest uncontrolled concentrations were all greater than 99% (all controlled concentrations were less than the limit of detection), and reductions in airborne RCS ranged from 98% to greater than 99%. Measurements of the static pressure inside the bags remained low throughout filling of the sand mover, avoiding the need to suspend sand transfer and manually shake filter bags. Analysis of a bulk sample of the dust collected by the baghouse assembly during this trial showed the presence of silicon, silica monoxide and the silica dioxide radicals which are indicators of freshly fractured quartz, a particularly hazardous form of RCS.
Design enhancements are proposed to provide weather resistance and ease of clamping of the mini-baghouse. Future trials are planned to determine the efficacy of these design changes.
EPHB Report No. 373-12a
Page 1
Introduction
Background for Control Technology Studies The National Institute for Occupational Safety and Health (NIOSH) is the primary Federal agency engaged in occupational safety and health research. Located in the Department of Health and Human Services, it was established by the Occupational Safety and Health Act of 1970. This legislation mandated NIOSH to conduct a number of research and education programs separate from the standard setting and enforcement functions carried out by the Occupational Safety and Health Administration (OSHA) in the Department of Labor. An important area of NIOSH research deals with methods for controlling occupational exposure to potential chemical and physical hazards. The Engineering and Physical Hazards Branch (EPHB) of the Division of Applied Research and Technology has been given the lead within NIOSH to study the engineering aspects of health hazard prevention and control.
Since 1976, EPHB has conducted a number of assessments of health hazard control technology on the basis of industry, common industrial process, or specific control techniques. Examples of these completed studies include the foundry industry; various chemical manufacturing or processing operations; spray painting; and the recirculation of exhaust air. The objective of each of these studies has been to document and evaluate effective control techniques for potential health hazards in the industry or process of interest, and to create a more general awareness of the need for or availability of an effective system of hazard control measures.
These studies involve a number of steps or phases. Initially, surveys are conducted to determine exposure to workers. The reports from these surveys are then used as a basis for choosing effective hazard control measures. The hazard control measures are tested to determine their effectiveness. Ultimately, the information from these research activities builds the data base of publicly available information on hazard control techniques for use by health professionals who are responsible for preventing occupational illness and injury.
Background for this Study
Risks for Mineral and Chemical Exposures in Unconventional Oil and Gas Extraction Although occupational exposure to respirable crystalline silica (RCS) is a well-established hazard in mining, sandblasting, foundry work, and construction, until recently it was not recognized as a hazard associated with oil and gas extraction [Amandus and Costello 1991; Amandus et al. 1995; Chen et al. 2005; Chen et al. 2012; Cox-Ganser et al. 2009; Echt et al. 2002; Echt and Sieber 2002; Froines et al. 1986; Goldstein et al. 2014; Hnizdo et al. 1997; Landrigan et al. 1986; Laney et al. 2010; Morfeld et al. 2014; NIOSH 1992; Park et al. 2002; Perez-Alonso et al. 2014; Rosenman et al. 1996; Steenland et al. 2001]. Hydraulic fracturing involves high pressure injection of large volumes of water (about 95%), mixed with 4 – 5% of “proppant” (typically silica sand) and approximately 1% of treatment chemicals,
EPHB Report No. 373-12a
Page 2
to enhance existing fissures and create new cracks in tight oil and gas formations. After release of hydraulic pressure, the proppant holds the cracks open, so that gas or oil can flow freely from the formation. In addition to silica sand, resin-coated sand or ceramic proppant may also be used, depending on the formation.
The American Petroleum Institute (API) has a standard for sand used as proppant. Proppant sand must be ≥99% silica, within a certain range of mesh sizes, smooth-edged and highly spherical. It must also pass tests of crush resistance, low acid solubility and low turbidity [API 2008]. Although hydraulic fracturing has been in use since the 1940s, its use for recovering oil and gas from tight formations has skyrocketed in the last 10 years due to the use of directional and horizontal drilling techniques coupled with high volume, high pressure hydraulic fracturing. U.S. production of dry natural gas alone increased by 39% from 2004 to 2014 [USEIA 2015].
As part of a NIOSH research program to evaluate risks for chemical exposures to land-based oil and gas workers [NIOSH 2010a], NIOSH researchers were the first to systematically evaluate risks for occupational exposures on hydraulic fracturing sites across the U.S. Identified exposure risks include RCS in hydraulic fracturing and volatile organic compounds (VOCs) in flowback operations [Esswein et al. 2013; Esswein et al. 2014]. (See Figure 1.)
Silica-Related Disease Silica, or silicon dioxide (SiO2), is found in a variety of crystalline and non-crystalline forms. The most common forms of crystalline silica are quartz, cristobalite and tridymite, with quartz being by far the most common [NTP 2011]. Inhalation of RCS is most closely identified with the disease silicosis, a scarring of the lungs that causes difficulty in breathing, and is progressive and fatal. Acute silicosis can develop in weeks to months following exposure to very high concentrations (tens of milligrams per cubic meter) of RCS. Long-term exposure to much lower concentrations of RCS can lead to accelerated or chronic silicosis years to decades later. Silicosis is a risk factor for developing tuberculosis, and silica exposure can also cause kidney and autoimmune disease. Workers exposed to RCS also have higher rates of other respiratory diseases, such as chronic bronchitis and emphysema [NIOSH 2002].
Inhalation of quartz and cristobalite, two of the most common crystalline forms, can lead to cancer [NTP 2011]. In a study of diatomaceous earth workers published in 2001, the risk of mortality from lung cancer increased with increasing exposure to RCS dust (cristobalite) [Rice et al. 2001]. In a study of Vermont granite workers, increasing crystalline silica dust exposure was associated with lung cancer[Attfield and Costello 2004]. A study of industrial sand workers in North America showed increasing risk of silicosis and lung cancer with increasing exposure to respirable silica [McDonald et al. 2005]. In Chinese workers at metal mines and pottery factories, long-term exposure to silica dust increased the mortality rate due to respiratory diseases, lung cancer and cardiovascular disease [Chen et al. 2012].
EPHB Report No. 373-12a
Page 3
The International Agency for Research on Cancer (IARC) classifies crystalline silica dust, in the form of quartz or cristobalite, as carcinogenic to humans, based on studies such as the ones mentioned above, as well as animal experiments [IARC 2012]. The U.S. National Toxicology Program (NTP) also classifies RCS as a known human carcinogen [NTP 2011].
Plant and Process Description
Hydraulic Fracturing Unconventional oil and gas wells are hydraulically fractured in multiple stages. Each stage requires the use of hundreds of thousands to millions of pounds of proppant. Proppant (mostly silica sand) is typically delivered on site in dry bulk by tractor-trailers. A fan-compressor pneumatically transfers proppant from the delivery trailer to multi-bin storage and handling units called sand movers.
One or two inspection hatches (or “thief hatches”) are usually located along the top of each bin on a sand mover. These hatches are either left open or unlatched when proppant is being transferred into the bins, to allow for release of pneumatic pressure from the bin. Underneath the bins, the sand mover has a conveyor belt onto which proppant is discharged and conveyed into a blender truck. In the blender, proppant is mixed with water and other additives before high pressure pumping and injection into the hydrocarbon formation. Often, multiple sand movers are in use, each one depositing sand onto a transfer belt for delivery to the blender. Sand mover operators work from one of two stations: on the top rear of the sand mover, above the location where sand emerges from under the sand mover on the conveyor belt; or at the lower front of the sand mover [Esswein et al. 2013].
NIOSH researchers collected personal breathing zone air samples for workers at 11 hydraulic fracturing sites in 2010 and 2011. Job classification was associated with exposures to silica. Sand Mover and Transfer Belt Operators had the highest exposures to RCS, due to their proximity to point sources of sand dust generation. Figure 2 shows a Sand Mover Operator at his work station. Exposures of Sand Mover Operators were sometimes over ten times higher than occupational exposure limits, exceeding the assigned protection factor (APF) of 10 for half-face elastomeric or filtering-facepiece respirators. In that case, wearing a half-face elastomeric or filtering-facepiece respirator would provide insufficient protection. At one hydraulic fracturing site, a portion of the silica sand was replaced with ceramic proppant, and risks for exposures to RCS were notably lower [Esswein et al. 2013].
Pneumatic transfer of sand enhances generation of silica dust aerosols. NIOSH researchers identified at least seven primary point sources of dust generation/release [OSHA/NIOSH 2012]. They are:
• Thief hatches on top of the sand movers during filling
• Uncapped side fill ports on sand movers during filling
EPHB Report No. 373-12a
Page 4
• Vehicular traffic on the site
• Transfer belt under the sand movers
• Sand being dropped or mixed in the belt or blender area
• Transfer belts between the sand movers and the blender
• The end of the sand mover conveyor belt
Several engineering controls were proposed to limit the generation of silica-containing dusts. These included a mini-baghouse assembly on the sand mover hatches, skirting and shrouding at the base of the sand mover and near the conveyor belt, and capping unused fill ports [Esswein et al. 2013].
NIOSH previously evaluated one of these controls, the mini-baghouse retrofit assembly, at an SWN sand mine in North Little Rock, Arkansas on November 18 – 21, 2013 (See Figure 3) [NIOSH 2015]. As a result of that test, enhancements were made to the technology, and the mini-baghouse was again tested at the same location on May 19 – 21, 2015. This report presents the results of that evaluation. The NIOSH mini-baghouse is only designed to control dust being released from the thief hatches. Other technologies are needed to control silica aerosol emissions from other sources.
Occupational Exposure Limits and Health Effects As a guide to the evaluation of the hazards posed by workplace exposures, NIOSH investigators use mandatory and recommended occupational exposure limits (OELs) when evaluating chemical, physical, and biological agents in the workplace. Generally, OELs suggest levels of exposure to which most workers may be exposed up to 10 hours per day, 40 hours per week for a working lifetime without experiencing adverse health effects. It is, however, important to note that not all workers will be protected from adverse health effects even though their exposures are maintained below these levels. A small percentage may experience adverse health effects because of individual susceptibility, a pre-existing medical condition, and/or hypersensitivity (allergy).
In addition, some hazardous substances may act in combination with other workplace exposures, the general environment, or with medications or personal habits of the worker to produce health effects even if the occupational exposures are controlled at the level set by the exposure limit. Combined effects are often not considered in the OEL. Also, some substances are absorbed by direct contact with the skin and mucous membranes, and thus can increase the overall exposure. Finally, OELs may change over the years as new information on the toxic effects of an agent become available [Plog 2012].
Most OELs are expressed as a time-weighted average (TWA) exposure. A TWA exposure refers to the average airborne concentration of a substance during a normal 8- to 10-hour workday. Some substances have recommended short-term
EPHB Report No. 373-12a
Page 5
exposure limits (STELs) or ceiling values (C) which are intended to supplement the TWA where there are recognized toxic effects from higher exposures over the short-term [Plog 2012].
In the U.S., OELs are established by Federal agencies, professional organizations, state and local governments, and other entities. NIOSH Recommended Exposure Limits (RELs) are based on a critical review of the scientific and technical information available on the prevalence of health effects, the existence of safety and health risks, and the adequacy of methods to identify and control hazards [NIOSH 2010b]. They are developed using a weight of evidence approach and formal peer review process. The U.S. Department of Labor OSHA Permissible Exposure Limits (PELs) [OSHA 2006] are OELs that are legally enforceable in covered workplaces under the Occupational Safety and Health Act. OSHA has recently reduced the PEL for RCS [OSHA 2016].
Other OELs that are commonly used and cited in the U.S. include the Threshold Limit Values (TLVs®) recommended by the American Conference of Governmental Industrial Hygienists (ACGIH®), a professional organization [ACGIH 2015]. ACGIH TLVs are considered voluntary guidelines for use by industrial hygienists and others trained in this discipline “to assist in the control of health hazards.” Workplace Environmental Exposure Levels (WEELs®) are recommended OELs that were historically developed by the American Industrial Hygiene Association (AIHA), another professional organization. In 2013, WEEL development was transferred to the Occupational Alliance for Risk Science (OARS). WEELs have been established for some chemicals “when no other legal or authoritative limits exist.” [AIHA 2014].
OSHA requires an employer to furnish employees a place of employment that is free from recognized hazards that are causing or are likely to cause death or serious physical harm [OSHA 2004]. Thus, employers are required to comply with OSHA PELs. Some hazardous agents do not have PELs, however, and for others, the PELs do not reflect the most current health-based information. Thus, NIOSH investigators encourage employers to consider the other OELs in making risk assessment and risk management decisions to best protect the health of their employees. NIOSH investigators also encourage the use of the traditional hierarchy of controls approach to eliminating or minimizing identified workplace hazards. This includes, in preferential order, the use of: (1) substitution or elimination of the hazardous agent, (2) engineering controls (e.g., local exhaust ventilation, process enclosure, dilution ventilation) (3) administrative controls (e.g., limiting time of exposure, employee training, work practice changes, medical surveillance), and (4) personal protective equipment (e.g., respiratory protection, gloves, eye protection, hearing protection) [NIOSH 2010c].
RCS generated during sand mover filling operations consists of particles small enough to be inhaled into the gas exchange regions of the lungs. The particles are typically smaller than 10 micrometers (µm) in aerodynamic diameter [OSHA/NIOSH 2012]. Occupational exposure limits for RCS vary. The major U.S. exposure limits, along with selected international limits, are summarized in Table I.
EPHB Report No. 373-12a
Page 6
OSHA recently promulgated a silica standard which revises the PEL to 0.05 mg/m3 as a time-weighted average and requires employers to train employees, develop written exposure control plans, evaluate exposure risks, conduct medical monitoring and limit access to high exposure areas and provide respiratory protection when engineering or administrative controls cannot control exposure below the PEL [OSHA 2016].
Where workers are exposed to RCS at or above the PEL and REL (0.05 mg/m3), NIOSH recommends minimizing risks by substituting less hazardous materials and using engineering controls to limit exposures. If substitution and engineering controls cannot limit exposures to a level less than the PEL and REL, respiratory protection should be used in accordance with a written respiratory protection program, including medical clearance and fit testing [NIOSH 2002].
Methodology Researchers from NIOSH evaluated generation 3 of the NIOSH-developed and fabricated mini-baghouse retrofit assembly for control of silica dust generation from sand moving machinery on May 19 – 21, 2015 at an SWN sand mine in North Little Rock, Arkansas. Eight NIOSH mini-baghouse retrofit assemblies were fabricated by a contractor and assembled by NIOSH. The units were installed on each of eight thief hatches atop an NOV-APPCO FS-30 “Frac Sander” (i.e., sand mover). Figure 4 shows a photo of the FS-30 sand mover with the mini-baghouse assemblies installed.
The study design involved collection of area air samples for respirable particulates and RCS, with the mini baghouse installed and absent, while one bin on the FS-30 was filled with 40/70 mesh silica sand proppant. Seven trials were conducted. Each trial consisted of a pair of bin filling “runs”: one with the mini-baghouse control present, and one with the control absent. Each of the 4 sand bins on the FS-30 has a different volumetric internal capacity; bins #2 and #3, chosen for the 2013 test, were also used for the current study. The experimental design was intended to evenly sample from bins #2 and #3, but adverse weather conditions made it impossible to perform the planned number of trials. Therefore, in the first four trials, bin #3 was filled with sand, and in the last three trials, bin #2 was filled.
Samples for respirable particulates and RCS were collected using SKC® 224-PCXR8 universal sampling pumps (SKC, Eighty Four, PA) connected in-line to BGI® Model GK 2.69 size-selective cyclones (Mesa Labs, Butler, NJ). Samples were collected on tared 5 micron (µm) polyvinyl chloride (PVC) filters in three-piece 37-mm polystyrene sampling cassettes. The lids of the cassettes were removed to make it possible to attach the cyclones. The sampling trains were calibrated on-site, pre- and post-sampling, to 4.2 liters per minute to collect the respirable fraction of the dust [Kenny and Gussman 1997].
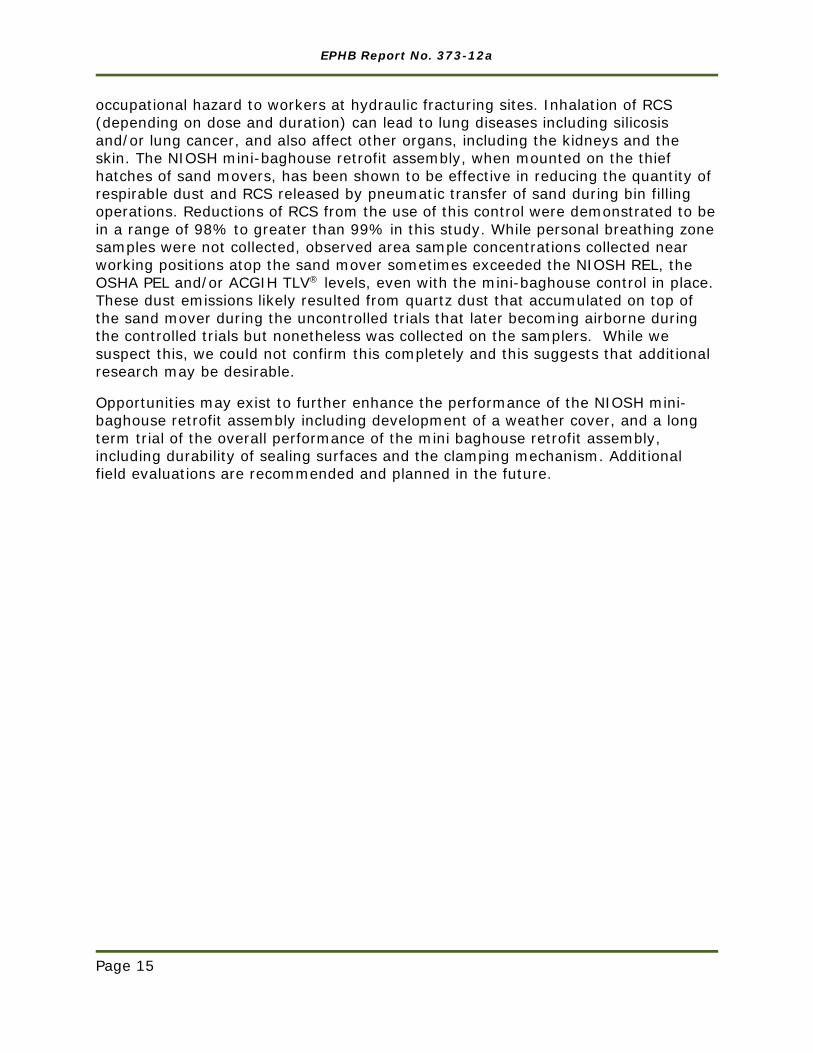
Air samples were collected at 12 different sampling locations. Six locations were on top of the sand mover (at each of the four corners and at two locations towards the middle of the FS-30), and six locations were on the ground at personal breathing
EPHB Report No. 373-12a
Page 7
zone height. Sampling locations are marked on a diagram in Figure 5. Photos of the air sampling trains are found in Figures 6 - 8. A total of 168 air samples were collected during two days of sampling. Half of the air samples (84) were collected while using the mini-baghouse, and half were collected with the mini-baghouse absent. Temperature, relative humidity, and wind speed and direction were recorded continuously during each sample period using a Kestrel 4500 weather meter (Nielsen-Kellerman, Boothwyn, PA) located north of the sand mover (See Figure 9.).
After all samples were collected, the PVC filters were delivered to an analytical laboratory (Bureau Veritas, Novi, Michigan) where they were analyzed for respirable dust according to NIOSH method 0600, and for RCS according to NIOSH Method 7500 [NIOSH 2003]. For the respirable dust analysis, the filters were equilibrated for at least 2 hours and static charges were neutralized before the filters were weighed.
For the RCS analysis, the filter was removed from the air-sampling cassette and folded two times to retain the particulate inside. It was then moistened with a drop of isopropyl alcohol, and the filter holder was wiped with the filter to collect any sample that was clinging to the holder. The PVC filter was dissolved, and the sample particulate was transferred to a silver-membrane filter. X-ray diffraction was used to determine the mass of the cristobalite, quartz and tridymite forms of crystalline silica that were present.
In addition to the air samples, two bulk samples of sand were collected and sent to an AIHA-accredited analytical laboratory (Bureau Veritas, Novi, MI) for determination of the percent silica by NIOSH Method 7500 [NIOSH 2003]. The samples were ground up using a mortar and pestle before being deposited on a silver-membrane filter for analysis by X-ray diffraction using a Rigaku Ultima III diffractometer (Rigaku Corporation, Tokyo, Japan).
Three bulk samples of the sand dust were collected. One sample was collected from inside one of the filter bags of the mini-baghouse, and the other two were samples of settled dust accumulated on top of the sand mover when the mini-baghouse was not in use. Portions of each bulk sample of the dust generated by sand moving were sent to an AIHA-accredited analytical laboratory (Bureau Veritas, Kennesaw, GA) for examination of particle count, size and shape using a scanning electron microscope (SEM).
Quantities of these three dust samples were further analyzed by Electron Spin Resonance (ESR) at an analytical laboratory (University of Kentucky, Lexington, KY), using a Bruker EMX Premium X ESR instrument (Bruker Daltonik, Bremen, Germany) to determine if free radicals were present. The presence of free radicals indicates that the particles have been freshly fractured [Vallyathan et al. 1988].
EPHB Report No. 373-12a
Page 8
Control Technology The mini-baghouse generation 2 (See Figure 2.) was evaluated in 2013 at Southwestern Energy (SWN) Sand Company in North Little Rock, Arkansas, with good results. The mini-baghouse effectively reduced both respirable dust and RCS downwind of the thief hatches. Reduction of airborne respirable dust ranged from 85% to 98%, and reductions in airborne RCS ranged from 79% to 99%. At the time, opportunities were identified to improve the performance of the mini-baghouse by improving particulate capture and reducing pressure drop across the filter bags [Alexander et al. 2016; NIOSH 2015].
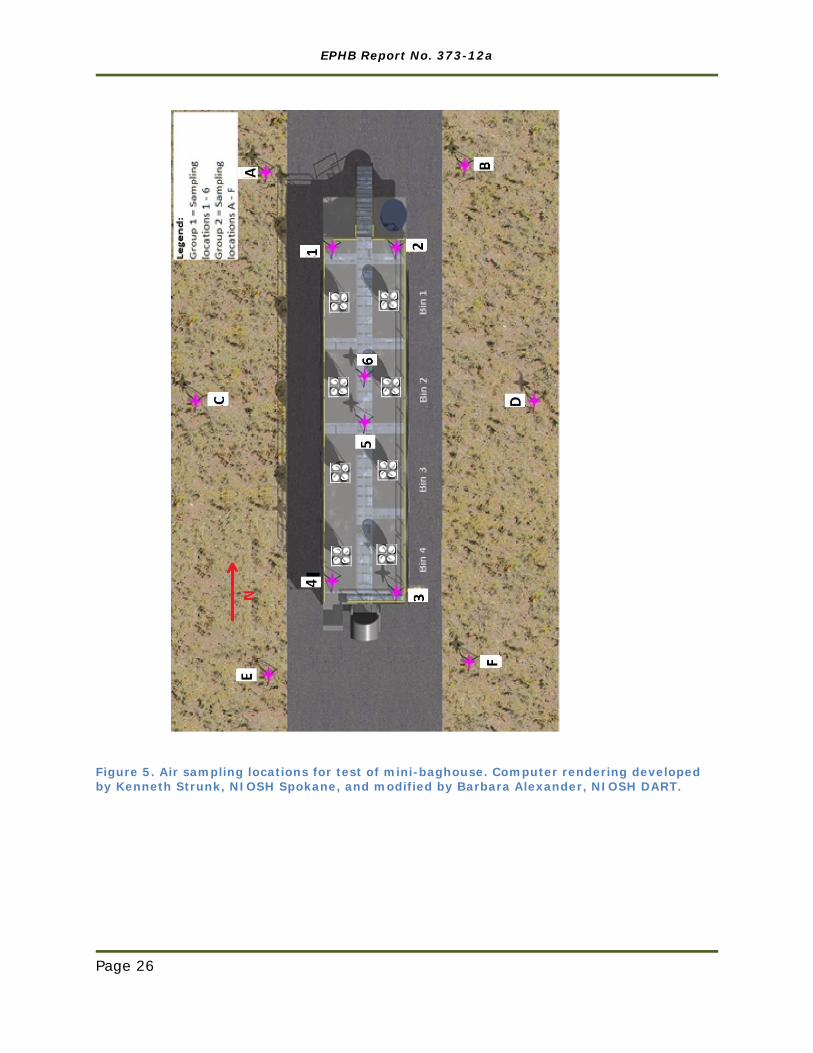
The mini-baghouse retrofit assembly generation 3 incorporates an improved filter bag fabric, and four bags with a much greater air-to-cloth ratio, for enhanced air flow and filtration performance. In Figure 10, it can be seen that the two sections of ductwork used in generation 2 have been eliminated, reducing the possibility of dust leakage at the joints. This revision, as well as the change from a single bag to four bags on each unit, increases the surface area of filter bag material. The air-to-cloth ratio for the generation 3 mini-baghouse is nearly 3 times as high as the generation 2 unit, which reduces air velocity through the filter bag material, and helps to keep static pressure low inside the filter bags.
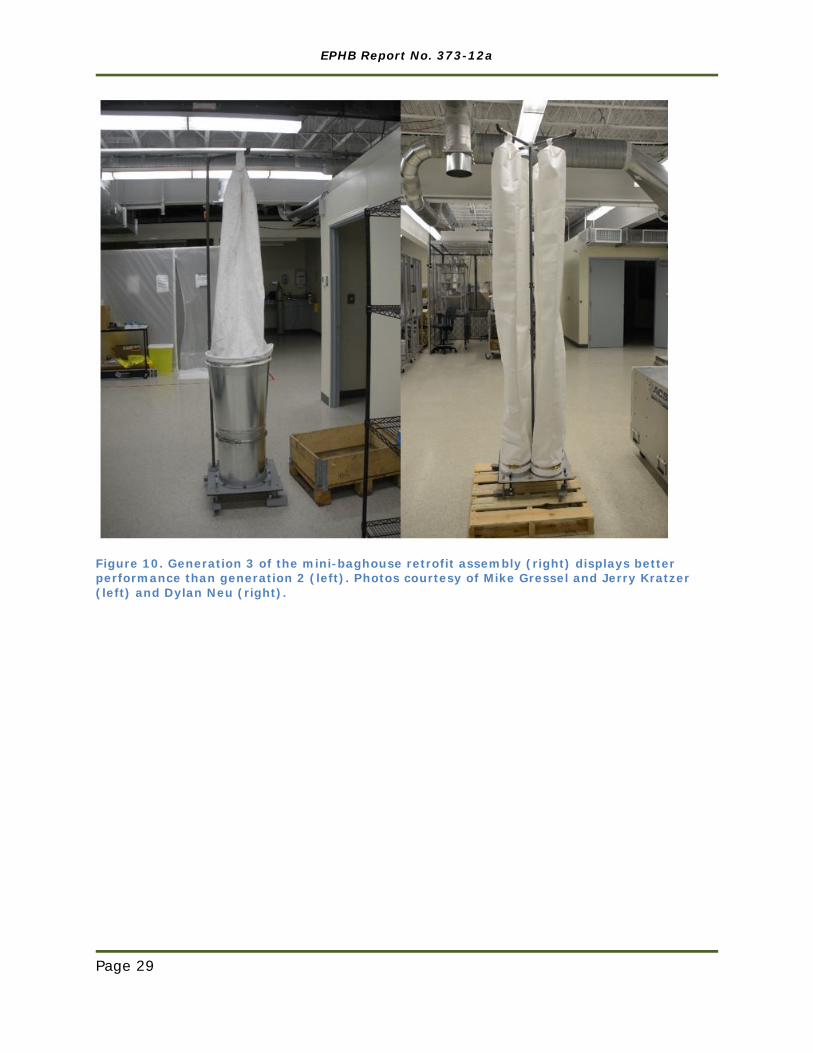
The filter bags are made of a 15 ounce polypropylene felt lined with a polytetrafluoroethylene (PTFE) membrane to help shed the dust cake. The material of the base of each mini-baghouse unit has been changed from steel to aluminum, reducing the weight while improving corrosion resistance. A ¼ inch-thick (0.6 cm) sheet of polyurethane rubber is bonded to the bottom of each unit to help it seal to the thief hatch opening. The clamping arrangement for each unit is very similar to that for the generation 2 units. A photo of the generation 3 assemblies installed in the field is shown in Figure 4. Table II lists the materials used to construct the assemblies. An engineering drawing of the base for one of the assemblies is shown in Figure 11.
The mini baghouse retrofit assembly controls sand dust emissions generated during pneumatic sand filling operations through the same principles used by commercial baghouses for air pollution control. The APPCO FS 30 sand mover is configured with four compartments (or bins) and two hatches for each bin. One mini baghouse assembly is attached to each of the eight 22-inch x 22-inch (56 cm x 56 cm) hatch openings. The high volume of dust-laden air used to move the proppant into the sand mover bin forms a dust cake on the inside of the bag, which traps particulate while allowing air to pass through the bag material. The dust cake collected on the filter fabric is shed when air flow is stopped, allowing the cake to drop back into the sand mover.
Results and Data Analysis Area air samples were collected to determine concentrations of respirable particulates and silica during the time required to transfer one truckload of sand into a sand mover bin. Sampling locations are labeled in Figure 5. One of the two
EPHB Report No. 373-12a
Page 9
Sand Mover Operator positions was near the location of sample 4 on top of the sand mover; the other was between sample locations 2 and B, at ground level. In the first 4 trials, bin 3 of the sand mover was filled with sand; in the last 3 trials, bin 2 of the sand mover was filled with sand.
Fill times for each run varied from 34 to 51 minutes. Concentrations of respirable dust and RCS were determined by dividing the gravimetric weight of dust (or amount of quartz) collected on the filter, as determined by the analytical laboratory, by the total volume of air (product of the collection time and the volumetric flowrate) pulled through the air sampling pump. Quartz was the only form of crystalline silica detected by laboratory analyses. No detectable concentrations of cristobalite or tridymite were found. Weather data for all trials are presented in Tables III and IV. The runs in the tables are labeled with a trial number and whether the control was on or off.
NIOSH analytical methods include the analytical limit of detection (LOD), or the lowest amount of the analyte which can be distinguished from background. A related, and typically threefold greater value, is the analytical limit of quantitation (LOQ), above which a specified level of precision is achieved. Above the LOQ, the false negative rate is negligible unless certain interfering substances are present [NIOSH 2003].
Seventy-eight percent of all air samples collected in trials 1 – 7 of this investigation were less than the LOD (<LOD) for respirable dust and fifty-one percent of samples were <LOD for RCS. This is believed to be the result of prevailing winds during the trials. In stagnant air, more of the air samples would be expected to be above the LOD for both analytes.
For respirable dust, the LOD was reported as 40 micrograms; for RCS, the LOD for most of the samples was 5 micrograms (two samples had a reported LOD of 20 micrograms, and two samples had an LOD of 30 micrograms, all due to heavy particulate loading). The LOQ for respirable dust was 130 micrograms, and the LOQ for most samples of RCS was 17 micrograms (two samples had a reported LOQ of 51 micrograms, and two samples had an LOQ of 89 micrograms, all due to heavy particulate loading). For calculation and statistical purposes, numerical values for samples <LOD can be estimated using a value such as the LOD divided by the square root of 2 (i.e., divided by 1.414) [Hornung and Reed 1990], and this approximation was used in the boxplots in Figures 12 - 19. Figures 12 – 19 show concentrations measured with or without the use of the mini-baghouse control.
For the 84 area air samples for respirable dust collected using the mini-baghouse, 81 of 84 (96.4%) were <LOD. For RCS, 57 of 84 (67.9%) of the samples collected using the mini-baghouse were <LOD. Some of the samples that exceeded the LOD for both respirable dust and RCS were outliers, caused when the conveyor belt under the sand mover was mistakenly started up during a trial (Trial 2, Control On). The moving conveyor belt caused a visible cloud of dust to float in the direction of sampling locations C, E and 4. Therefore the only respirable dust concentrations
EPHB Report No. 373-12a
Page 10
that exceeded the LOD when the mini-baghouse was in use were outliers. Three of the 27 RCS concentrations that exceeded the LOD when the mini-baghouse was in use were also outliers.
Of the 84 area samples collected with the control absent, 50 of 84 (59.5%) were <LOD for respirable dust; and 29 of 84 (34.5%) were <LOD for RCS. In the boxplots (Figures 12 - 19), concentrations are presented by sampling location and whether the control was on or off (1-off, 1-on, etc.). SAS/STAT 12.1 (SAS Institute, Inc., Cary, NC) was used to prepare the boxplots.
Because the number of data points <LOD was so large, data were analyzed by a maximum likelihood estimation method (MLE) using the NLMIXED procedure in SAS/STAT 12.1 (SAS Institute, Inc., Cary, NC) according to the method described by Jin et al. for datasets with repeated measures containing large numbers of non-detectable values. MLE is a statistical method used to fit models and estimate the distribution of measurements <LOD when the data fit a lognormal distribution, which is typically the case for airborne particulates. The resulting MLE parameter estimates can be used to calculate the geometric mean and the geometric standard deviation of the data set. The MLE method results in less bias than substituting a constant value, such as the LOD divided by the square root of 2. The method performs well with datasets in which up to 80% of values are <LOD [Jin et al. 2011].
To calculate the effectiveness of the mini-baghouse control, only data from the three locations with the highest measured concentrations of respirable dust and RCS (i.e., locations 3, 4 and 5) were used; all of these locations were atop the sand mover. All of the 21 samples taken without the mini-baghouse in place at these locations resulted in concentrations of RCS >LOD and >LOQ, and all of the 21 samples for respirable dust were >LOD. Using the method of Jin et al. [Jin et al. 2011] made it possible to calculate percent reductions in dust concentration for this dataset, in spite of the high number of concentrations below the LOD when the mini-baghouse was in use. The one outlier value at sampling location 4 was discarded in these calculations.
As shown in Tables V and VI, impressive reductions in respirable dust and in RCS were achieved at sampling locations 3, 4 and 5 by use of the mini-baghouse. Reductions in respirable dust were all estimated to be 99+% (all controlled concentrations <LOD), while reductions in RCS ranged from 98% to 99% at these sampling locations.
Two bulk samples of sand were analyzed for three crystalline forms of quartz (cristobalite, quartz and tridymite). Only quartz was found in detectable quantities. The two samples were comprised of 65% and 76% quartz by weight.
The bulk samples of sand dust were notably finer than the original 40/70 mesh sand transferred into the sand delivery trucks. The bulk sample particulate had the appearance and feel of talcum powder, which suggests that some degree of
EPHB Report No. 373-12a
Page 11
proppant disintegration occurs from pneumatic transport. This is likely due to frictional and impact forces on the sand as it is pneumatically conveyed from the sand delivery truck into the sand mover.
The size range (by number of particles counted) of the three bulk samples of sand dust is shown in Figure 20. This chart indicates that the greatest percentage of particles were between 0.5 and <2 microns in diameter. An SEM examination of a sample of collected particles showed that nearly every particle appeared to be fractured. Virtually no smooth particles are visible in an SEM image shown in Figure 21.
Three ESR signals were observed and reported by the laboratory (Si, SiO, SiO2) in each of the bulk dust samples. This indicates the presence of silica free radicals and shows that the dust samples contained freshly fractured quartz. In Figure 22, the ESR signal is absent in the blank sample (top), but clearly present in the three bulk samples. The first bulk sample, labeled “5-19-15 Run 1”, was collected from inside a filter bag. The other two samples were collected from settled dust that had accumulated on top of the sand mover when the mini-baghouse control was not in use. Although the ESR signal was present in all of the three samples, they exhibited different ESR signal strengths. The reason for these differences is unknown.
Discussion
Performance of the Mini-Baghouse It is evident from Figures 12 – 19 that concentrations of respirable dust and RCS measured without the NIOSH mini-baghouse retrofit assembly were highest at air sampling locations 3, 4 and 5 on top of the sand mover. This was expected due to the proximity of the samplers to the bin being filled, and the prevailing wind direction during testing. Because dust concentrations were highest at these sampling locations when the NIOSH mini-baghouse was not in use, these locations were chosen to determine the effectiveness of the control.
Average wind directions during testing varied from 162.9o to 248.6o (See Tables II and III.). Because the average wind direction was always in the same quadrant, some of the sampling locations were always upwind, and dust and RCS concentrations at those locations were always low, whether the mini-baghouse was in use or not. Any airborne dust collected at these locations likely came from a different source than the thief hatches, such as dust from the ground or surrounding areas. The measured concentrations at those locations were not affected by the engineering control on the thief hatches, and were not used in calculations of its effectiveness in reducing airborne respirable dust.
All of the area air samples collected near the Sand Mover Operator’s station (sampling location 4) atop the sand mover were well above the LOD and LOQ for both respirable dust and RCS when the NIOSH mini-baghouse retrofit assembly was not used. Conversely, when the mini-baghouse retrofit assembly was in place, only 1 of 7 (14.3%) samples at this same location was above the LOD for respirable dust
EPHB Report No. 373-12a
Page 12
and 4 of the 7 (57.1%) of samples were above the LOD for respirable silica. One sample exceeding the LOD for both respirable dust and RCS was determined to be an outlier, caused when the conveyor belt under the sand mover was mistakenly started up during a trial and generated sand dust. Therefore the only respirable dust concentration that exceeded the LOD at sampling location 4 when the mini-baghouse was in use was determined to be an outlier and not included in statistical calculations.
Neglecting the outlier values at sampling location 4, the percent reduction for both the respirable dust and RCS area samples located at the operator station was estimated by the MLE method to be greater than or equal to 99.3%. This demonstrates a high degree of airborne particulate reduction and effectiveness of the Generation 3 NIOSH mini-baghouse retrofit assembly in controlling both respirable particulates in general and RCS, specifically.
Because of their small size, respirable aerosols settle at rates much slower than larger, non-respirable particles and consequently can remain airborne, disperse, and travel longer distances from point sources compared to larger and heavier aerosols. Because the dust was released from thief hatches approximately 10 feet above the ground, respirable particles might have been diluted by wind or may have been transported from the release point before reaching the PBZ ground level of the samplers located next to the sand movers (locations A – F). This may explain why respirable particulate concentrations measured at ground level locations near the sand mover were comparatively (and consistently) lower compared to respirable dust and RCS concentrations collected at sampling locations 3, 4 and 5.
Because the air samples collected during the study were area samples, they are not predictive of risks for worker exposure because workers typically move between different locations during a working day. Also, they were only collected for a maximum of 51 minutes, not for an entire working day. Personal breathing zone (PBZ) samples, such as those collected by Esswein et al. [Esswein et al. 2013] are needed to determine worker exposure. However, it is interesting to compare the results of this evaluation with occupational exposure limits (see Table I).
When the mini-baghouse control was not in use, all seven of the samples collected at the Sand Mover Operator’s position on top of the sand mover (sampling location 4) exceeded the ACGIH-TLV®, the OSHA PEL and the NIOSH REL for RCS. A worker who worked a full day at this position without respiratory protection would likely have been overexposed to respirable silica. Although area samples do not necessarily reflect PBZ samples, 74% of the PBZ samples for Sand Mover Operators collected during the study by Esswein et al. also exceeded the ACGIH TLV®, the OSHA PEL and the NIOSH REL [Esswein et al. 2013]. With the mini baghouse control in place, 3 of the 7 area samples (43%) exceeded the NIOSH REL, and 4 of 7 samples (57%) exceeded the ACGIH-TLV for RCS. Once again, one of these concentration values for respirable dust and one for RCS were outliers. Neglecting the outliers, 2 of 6 samples (33%) exceeded the NIOSH REL and 3 of 6 (50%) exceeded the ACGIH-TLV.
EPHB Report No. 373-12a
Page 13
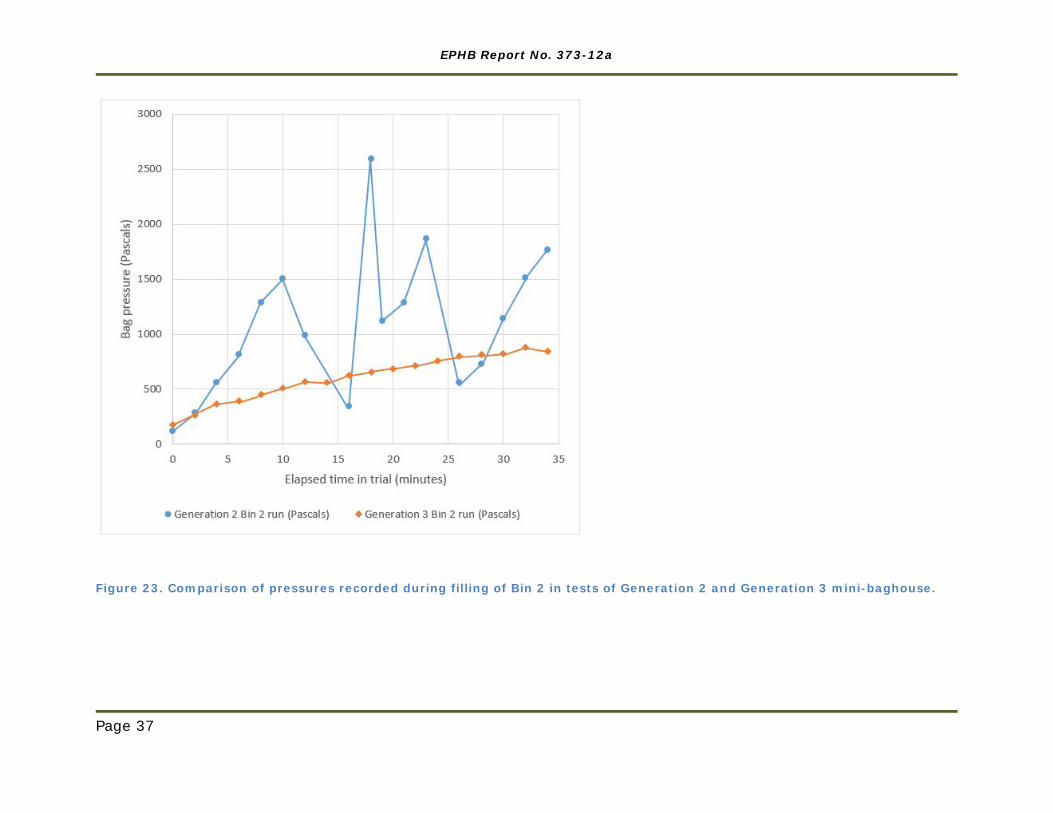
Comparisons between Generation 2 and 3 Mini-Baghouse Retrofit Assemblies The performance of the Generation 3 mini-baghouse retrofit assembly showed a clear improvement over the Generation 2 units. Because of the interior porosity of the fabric used for the filter bags in the Generation 2 mini-baghouse, filter bags had a tendency to blind. The calculated air-to-cloth ratio was also much higher. These factors necessitated stopping the flow of air periodically during sand transfer, and manually shaking each bag to release accumulated dust. Because of the improved fabric and the lower air-to-cloth ratio used with the Generation 3 units, it was never necessary to interrupt sand transfer during the trials to shake the bags. Pressures inside the bags increased very gradually during runs, and returned to a level near zero at the beginning of the next run.
Pressures inside the bags during the Generation 3 trials are compared to pressures during Generation 2 trials in Figures 23 and 24. At each point where pressures are shown to drop from a high to a low level during a Generation 2 trial, sand transfer had been interrupted to shake the bags.
Control of respirable dust and RCS were also greatly improved in the Generation 3 mini-baghouse compared to the Generation 2 mini-baghouse. Percent reductions are compared for the two versions of the technology in Tables VII and VIII.
Freshly Fractured Silica There is evidence that freshly fractured silica particles are more toxic than aged silica particles [Vallyathan et. al., 1995]. The observation of fractured silica particles in the bulk sand samples collected during sand moving is a cause for concern. The ESR signal, found in each of the three bulk dust samples (See Figure 22.), confirms that freshly fractured silica is present. Research performed by the NIOSH Respiratory Diseases Research Program (RDRP) shows that siloxyl radicals are formed on the surface of freshly fractured silica. These highly-reactive radicals can persist for about 30 hours after they are formed, long enough to react with the lung if they are inhaled. Studies in rats also showed that inhalation of freshly fractured silica caused more oxidant injury and inflammation than inhalation of aged silica [NIOSH 2006]. With freshly fractured RCS particles present in the aerosols generated during sand transport, inhalation risks to unprotected workers could be enhanced compared to silica aerosols containing only aged quartz.
Limitations of the Study Because of prevailing winds, many air samples collected were <LOD for respirable dust and RCS. This resulted in not all of the data being useful or used to calculate a representative value for the effectiveness of the mini-baghouse control. However, using the MLE method with the NLMIXED procedure as described by Jin et al. [Jin et al. 2011], a percent reduction in respirable dust and RCS by use of the mini-baghouse control could be calculated for sampling locations that were downwind from the point sources of dust generation, the thief hatches.
EPHB Report No. 373-12a
Page 14
NLMIXED proved to be a very reasonable way to estimate the geometric mean RCS concentrations with control on (Table VI), but the estimated geometric mean respirable dust concentrations with control on, shown in Table V, seem extremely low (about 3 orders of magnitude lower than the average LOD concentration of 0.2 mg/m3). The procedure is reported to provide good results for datasets containing up to 80% non-detectable values, but with 78% of respirable dust samples being <LOD (over 79% when neglecting outlier values), this dataset may be too close to the performance limit of the statistical method. In contrast, only 51% of the RCS samples were <LOD (52% when neglecting outlier values), and the estimated geometric mean RCS concentrations with control on appear to be much more reasonable estimates (about the same order of magnitude as the average LOD concentration of 0.03 mg/m3).
As a conservative estimate of the effectiveness of the generation 3 NIOSH mini-baghouse in controlling respirable dust, the LOD/√2 can be substituted for the geometric mean respirable dust concentration with control on (approximately 0.17 micrograms/m3). This would give percent reductions in respirable dust of 95% at location 3, 99% at location 4 and 94% at location 5 – lower than those calculated using the NLMIXED procedure, but still extremely effective.
A percentage of captured dust particles will cling to the wall of the filter cassette when airborne dust samples are collected [Soo et al. 2014]. Different analytical procedures were employed by the analytical laboratory to determine the mass of dust and the mass of silica present. When determining the mass of dust, only the dust on the filter was included, while the wall of the cassette was wiped when determining the mass of silica present. Using a polystyrene cassette with a GK2.69 cyclone, as in this study, Soo et al. found a mean of 7.52% of quartz mass on the wall of the cassette [Soo et al. 2014]. Due to this difference, the percentage of silica in the dust collected during air sampling could not be accurately calculated.
During Run 2, with the mini-baghouse control in use, the conveyor belt under the sand mover was mistakenly started, generating an additional source of respirable dust and RCS that was not present in other trials. A visible cloud of dust was observed to float toward the sampling locations C, E and 4. These samples showed a higher concentration of respirable dust and RCS than they otherwise would have. These three data points have been neglected in the analysis of experimental results.
Even though the Generation 3 mini-baghouse has been upgraded from the earlier version, there are still opportunities to improve upon the design. The clamping mechanism is somewhat tricky to use and could be made simpler. Also, the filter bags are not well protected from the weather. Provision of a weather enclosure could increase the potential service life of the bags.
Conclusions and Recommendations The presence of RCS, and in particular freshly fractured silica, released in the course of pneumatic transfer of sand during hydraulic fracturing operations, is an
EPHB Report No. 373-12a
Page 15
occupational hazard to workers at hydraulic fracturing sites. Inhalation of RCS (depending on dose and duration) can lead to lung diseases including silicosis and/or lung cancer, and also affect other organs, including the kidneys and the skin. The NIOSH mini-baghouse retrofit assembly, when mounted on the thief hatches of sand movers, has been shown to be effective in reducing the quantity of respirable dust and RCS released by pneumatic transfer of sand during bin filling operations. Reductions of RCS from the use of this control were demonstrated to be in a range of 98% to greater than 99% in this study. While personal breathing zone samples were not collected, observed area sample concentrations collected near working positions atop the sand mover sometimes exceeded the NIOSH REL, the OSHA PEL and/or ACGIH TLV® levels, even with the mini-baghouse control in place. These dust emissions likely resulted from quartz dust that accumulated on top of the sand mover during the uncontrolled trials that later becoming airborne during the controlled trials but nonetheless was collected on the samplers. While we suspect this, we could not confirm this completely and this suggests that additional research may be desirable.
Opportunities may exist to further enhance the performance of the NIOSH mini-baghouse retrofit assembly including development of a weather cover, and a long term trial of the overall performance of the mini baghouse retrofit assembly, including durability of sealing surfaces and the clamping mechanism. Additional field evaluations are recommended and planned in the future.
EPHB Report No. 373-12a
Page 16
References ACGIH [2015]. 2015 TLVs® and BEIs®: threshold limit values for chemical
substances and physical agents and biological exposure indices. Cincinnati, Ohio: American Conference of Governmental Industrial Hygienists (ACGIH).
AIHA [2014]. WEELs. Falls Church, Virginia: American Industrial Hygiene Association (AIHA), https://www.aiha.org/get-involved/AIHAGuidelineFoundation/WEELs/Pages/default.aspx.
Alexander BM, Esswein EJ, Gressel MG, Kratzer JL, Feng HA, King B, Miller AL, and Cauda E [2016]. The Development and Testing of a Prototype Mini-Baghouse to Control the Release of Respirable Crystalline Silica from Sand Movers. J Occup Environ Hyg 13 (8): 628-638.
Amandus H, and Costello J [1991]. Silicosis and Lung-Cancer in United-States Metal Miners. Arch Environ Health 46 (2):82-89.
Amandus HE, Shy C, Castellan RM, Blair A, and Heineman EF [1995]. Silicosis and lung cancer among workers in North Carolina dusty trades. Scand J Work Environ Health 21:81-83.
API [2008]. API RP 19c - Recommended Practice for Measurement of Proppants Used in Hydraulic Fracturing and Gravel-packing Operations, First ed.: American Petroleum Institute (API),
Attfield MD, and Costello J [2004]. Quantitative exposure-response for silica dust and lung cancer in Vermont granite workers. Am J Ind Med 45 (2):129-138.
Chen W, Hnizdo E, Chen JQ, Attfield MD, Gao P, Hearl F, Lu J, and Wallace WE [2005]. Risk of silicosis in cohorts of Chinese tin and tungsten miners, and pottery workers (I): an epidemiological study. Am J Ind Med 48 (1):1-9.
Chen W, Liu Y, Wang H, Hnizdo E, Sun Y, Su L, Zhang X, Weng S, Bochmann F, Hearl FJ, Chen J, and Wu T [2012]. Long-term exposure to silica dust and risk of total and cause-specific mortality in Chinese workers: a cohort study. PLoS Med 9 (4):e1001206.
Cox-Ganser JM, Burchfiel CM, Fekedulegn D, Andrew ME, and Ducatman BS [2009]. Silicosis in lymph nodes: the canary in the miner? J Occup Environ Med 51 (2):164-9.
Echt A, Sieber W, Jones A, and Jones E [2002]. Control of silica exposure in construction: scabbling concrete. Appl Occup Environ Hyg 17 (12):809-13.
Echt A, and Sieber WK [2002]. Control of silica exposure from hand tools in construction: grinding concrete. Appl Occup Environ Hyg 17 (7):457-61.
Esswein EJ, Breitenstein M, Snawder J, Kiefer M, and Sieber WK [2013]. Occupational Exposures to Respirable Crystalline Silica During Hydraulic Fracturing. J Occup Environ Hyg 10 (7):347-356.
Esswein EJ, Snawder J, King B, Breitenstein M, Alexander-Scott M, and Kiefer M [2014]. Evaluation of Some Potential Chemical Exposure Risks During Flowback Operations in Unconventional Oil and Gas Extraction: Preliminary Results. J Occup Environ Hyg:D174-D184.
Froines JR, Wegman DH, and Dellenbaugh CA [1986]. An approach to the characterization of silica exposure in U.S. industry. Am J Ind Med 10 (4):345-61.
Goldstein BD, Brooks BW, Cohen SD, Gates AE, Honeycutt ME, Morris JB, Orme-Zavaleta J, Penning TM, and Snawder J [2014]. The Role of Toxicological Science in Meeting the Challenges and Opportunities of Hydraulic Fracturing. Toxicol Sci 139 (2):271-283.
Hnizdo E, Murray J, and Klempman S [1997]. Lung cancer in relation to exposure to silica dust, silicosis and uranium production in South African gold miners. Thorax 52 (3):271-5.
Hornung RW, and Reed LD [1990]. Estimation of Average Concentration in the Presence of Nondetectable Values. Appl Occup Environ Hyg 5 (1):46-51.
IARC [2012]. Part C: Arsenic, metals, fibres, and dusts/ IARC Working Group on the Evaluation of Carcinogenic Risks to Humans. In IARC monographs on the evaluation of carcinogenic risks to humans, edited by IARC. Lyon, France: International Agency for Research on Cancer (IARC), http://monographs.iarc.fr/ENG/Monographs/vol100C/mono100C.pdf#page=1&zoom=auto,1260,764.
Jin Y, Hein MJ, Deddens JA, and Hines CJ [2011]. Analysis of lognormally distributed exposure data with repeated measures and values below the limit of detection using SAS. Ann Occup Hyg 55 (1):97-112.
Kenny LC, and Gussman RA [1997]. Characterization and modelling of a family of cyclone aerosol preseparators. J Aerosol Sci 28 (4):677-688.
Landrigan PJ, Cherniack MG, Lewis FA, Catlett LR, and Hornung RW [1986]. Silicosis in a Gray Iron Foundry - the Persistence of an Ancient Disease. Scand J Work Environ Health 12 (1):32-39.
Laney AS, Petsonk EL, and Attfield MD [2010]. Pneumoconiosis among underground bituminous coal miners in the United States: is silicosis becoming more frequent? Occup Environ Med 67 (10):652-656.
McDonald JC, McDonald AD, Hughes JM, Rando RJ, and Weill H [2005]. Mortality from lung and kidney disease in a cohort of North American industrial sand workers: an update. Ann Occup Hyg 49 (5):367-73.
Morfeld P, Mundt KA, Taeger D, Guldner K, Steinig O, and Miller BG [2014]. Threshold Value Estimation for Respirable Quartz Dust Exposure and Silicosis Incidence Among Workers in the German Porcelain Industry. J Occup Environ Med 56 (2):123-125.
NIOSH [1992]. NIOSH Alert: Preventing Silicosis and Deaths from Sandblasting. Atlanta, Georgia: U.S. Department of Health and Human Services, Centers for Disease Control and Prevention, National Institute for Occupational Safety and Health, DHHS (NIOSH) Publication No. 92-102, http://www.cdc.gov/niosh/docs/92-102/.
NIOSH [2002]. NIOSH Hazard Review: Health Effects of Occupational Exposure to Respirable Crystalline Silica. Cincinnati, OH: U.S. Department of Health and Human Services, Centers for Disease Control and Prevention, National Institute for Occupational Safety and Health, DHHS (NIOSH) Publication No. 2002-129, http://www.cdc.gov/niosh/docs/2002-129/pdfs/2002-129.pdf.
NIOSH [2003]. NIOSH Manual of Analytical Methods. Cincinnati, Ohio: U.S. Department of Health and Human Services, Centers for Disease Control and Prevention, National Institute for Occupational Safety and Health, DHHS
NIOSH [2006]. NIOSH Respiratory Diseases Research Program: Evidence Package for the National Academies' Review 2006 - 2007. Atlanta, GA: U.S. Department of Health and Human Services, Centers for Disease Control and Prevention, National Institute for Occupational Safety and Health, http://www.cdc.gov/niosh/nas/rdrp/ch3.2e.htm.
NIOSH [2010a]. NIOSH Field Effort to Assess Chemical Exposure Risks to Gas and Oil Workers. Cincinnati, Ohio: U.S. Department of Health and Human Services, Centers for Disease Control and Prevention, National Institute for Occupational Safety and Health, DHHS (NIOSH) Publication No. 2010–130, http://www.cdc.gov/niosh/docs/2010-130/pdfs/2010-130.pdf.
NIOSH [2010b]. NIOSH Pocket Guide to Chemical Hazards. Washington, DC: U.S. Department of Health and Human Services, Centers for Disease Control and Prevention, National Institute for Occupational Safety and Health, http://www.cdc.gov/niosh/npg/.
NIOSH [2010c]. Workplace Safety & Health Topics: Engineering Controls. Atlanta, GA: U.S. Department of Health and Human Services, Centers for Disease Control and Prevention, National Institute for Occupational Safety and Health, http://www.cdc.gov/niosh/topics/engcontrols/.
NIOSH [2015]. In-depth survey report: field evaluation of a NIOSH mini-baghouse assembly for control of silica dust on sand movers. By Alexander BM, Esswein EJ, Gressel MG, Kratzer JL, Feng HA, King B, Miller AL and Cauda E. Cincinnati, Ohio: U.S. Department of Health and Human Services, Centers for Disease Control and Prevention, National Institute for Occupational Safety and Health, DHHS (NIOSH) Publication No. EPHB 373-11a, http://www.cdc.gov/niosh/surveyreports/pdfs/373-11a.pdf.
NTP [2011]. Report on Carcinogens. Washington, DC: U.S. Department of Health and Human Services, National Institutes of Health, National Institute of Environmental Health Sciences, National Toxicology Program (NTP), http://ntp.niehs.nih.gov/ntp/roc/twelfth/roc12.pdf.
OSHA [2004]. Occupational Safety and Health Act of 1970, Public Law 91-596. By Department of Labor. Washington, DC: U.S. Department of Labor, Occupational Safety and Health Administration, https://www.osha.gov/pls/oshaweb/owasrch.search_form?p_doc_type=OSHACT.
OSHA [2006]. OSHA 1910.1000 Air Contaminants. By US Department of Labor. Washington, DC: U.S. Department of Labor, Occupational Safety and Health Administration, https://www.osha.gov/pls/oshaweb/owadisp.show_document?p_table=STANDARDS&p_id=9991.
OSHA [2016]. Occupational Exposure to Respirable Crystalline Silica 81 FR 16285. By US Department of Labor. Washington, D.C., https://www.federalregister.gov/articles/2016/03/25/2016-04800/occupational-exposure-to-respirable-crystalline-silica.
OSHA/NIOSH [2012]. "OSHA-NIOSH Hazard Alert: Worker Exposure to Silica during Hydraulic Fracturing." U.S. Department of Labor, Occupational Safety
and Health Administration. https://www.osha.gov/dts/hazardalerts/hydraulic_frac_hazard_alert.pdf.
Park R, Rice F, Stayner L, Smith R, Gilbert S, and Checkoway H [2002]. Exposure to crystalline silica, silicosis, and lung disease other than cancer in diatomaceous earth industry workers: a quantitative risk assessment. Occup Environ Med 59 (1):36-43.
Perez-Alonso A, Cordoba-Dona JA, Millares-Lorenzo JL, Figueroa-Murillo E, Garcia-Vadillo C, and Romero-Morillo J [2014]. Outbreak of silicosis in Spanish quartz conglomerate workers. Int J Occup Environ Health 20 (1):26-32.
Plog BA [2012]. "Overview of Industrial Hygiene." In Fundamentals of Industrial Hygiene, edited by B.A. Plog. Itasca, IL: National Safety Council. Original edition, 1971.
Rice FL, Park R, Stayner L, Smith R, Gilbert S, and Checkoway H [2001]. Crystalline silica exposure and lung cancer mortality in diatomaceous earth industry workers: a quantitative risk assessment. Occup Environ Med 58 (1):38-45.
Rosenman KD, Reilly MJ, Rice C, Hertzberg V, Tseng CY, and Anderson HA [1996]. Silicosis among foundry workers. Implication for the need to revise the OSHA standard. Am J Epidemiol 144 (9):890-900.
Soo JC, Lee T, Kashon M, Kusti M, and Harper M [2014]. Quartz in Coal Dust Deposited on Internal Surface of Respirable Size Selective Samplers. J Occup Environ Hyg: 11 (12):D215-9.
Steenland K, Mannetje A, Boffetta P, Stayner L, Attfield M, Chen J, Dosemeci M, DeKlerk N, Hnizdo E, Koskela R, and Checkoway H [2001]. Pooled exposure-response analyses and risk assessment for lung cancer in 10 cohorts of silica-exposed workers: an IARC multicentre study. Cancer Causes Control 12 (9):773-84.
USEIA [2015]. December 2015. In Monthly Energy Review. Washington, D.C.: U.S. Energy Information Administration, http://www.eia.gov/totalenergy/data/monthly/pdf/mer.pdf.
Vallyathan V, Shi X, Dalal NS, Irr W, and Castranova V [1988]. Generation of Free Radicals from Freshly Fractured Silica Dust: Potential Role in Acute Silica-induced Lung Injury. Am Rev Respir Dis 138 (5):1213-1219.
Tables Table I. Occupational Exposure Limits for respirable crystalline silica.
Agency Limit Time-weighted Average Exposure Limit
National Institute for Occupational Safety and Health (NIOSH) [NIOSH 2010b]
Recommended Exposure Limit (REL)
𝑅𝑅𝑅𝑅𝑅𝑅 = 0.05 𝑚𝑚𝑚𝑚𝑚𝑚3
Occupational Safety and Health Administration (revised in 2016) [OSHA 2016]
Permissible Exposure Limit (PEL)
𝑃𝑃𝑅𝑅𝑅𝑅 = 0.05
𝑚𝑚𝑚𝑚𝑚𝑚3
American Conference of Governmental Industrial Hygienists (ACGIH) (α-quartz and cristobalite) [ACGIH 2015]
Threshold Limit Value (TLV®)
𝑇𝑇𝑅𝑅𝑇𝑇 = 0.025 𝑚𝑚𝑚𝑚𝑚𝑚3
Canada Labour Code (for respirable fraction of quartz and cristobalite)
Occupational Exposure Limit (OEL)
OEL = 0.025mgm3
United Kingdom Workplace
Exposure Limit (WEL)
WEL = 0.1 mgm3
EPHB Report No. 373-12a
Page 21
Table II. Materials used in mini-baghouse assemblies. Section Material
Filter bag 15 ounce polypropylene felt with a polytetrafluoroethylene (PTFE) membrane lining
Filter bag support ½ inch NPT threaded black iron pipe and fittings
Band clamps Stainless steel Baseplate ½ inch aluminum 6061-T6 Gasket ¼ inch polyurethane rubber, 30A
durometer
Table III. Weather data for trials in which bin 3 was filled.
* Azimuth angle of the wind vector, measured clockwise from due north, with wind towards the north being an angle of 0o.
Table IV. Weather data for trials in which bin 2 was filled.
Trial Avg. Wind Direction
(degrees)*
Avg. Wind Speed (mph)
Avg. Temperature
(oF)
Avg. %Relative Humidity
5 ON 176.6 4.7 59.1 68.9 5 OFF 163.7 3.9 57.4 72.6 6 ON 162.9 5.3 57.7 71.5 6 OFF 198.0 3.6 61.7 65.3 7 ON 191.2 3.6 62.4 63.1 7 OFF 195.4 3.4 63.3 61.4
* Azimuth angle of the wind vector, measured clockwise from due north, with wind towards the north being an angle of 0o.
Trial Avg. Wind Direction
(degrees)*
Avg. Wind Speed (mph)
Avg. Temperature
(oF)
Avg. %Relative Humidity
1 ON 207.0 4.0 69.0 85.4 1 OFF 204.0 4.2 70.9 81.8 2 ON 232.8 2.6 77.0 72.8 2 OFF 245.7 4.0 73.1 77.0 3 ON 248.6 2.8 78.6 70.9 3 OFF 225.0 2.5 80.6 67.4 4 ON 179.0 5.6 57.9 72.2 4 OFF 203.1 2.8 80.3 67.2
EPHB Report No. 373-12a
Page 22
Table V. Reductions in respirable dust concentrations when using the generation 3 mini-baghouse control. Sampling Location
Geometric Mean* –
control off (mg/m3)
Minimum – control off (mg/m3)
Maximum – control off (mg/m3)
Geometric Mean* –
control on (mg/m3)
Minimum – control
on (mg/m3)
Maximum – control
on (mg/m3)
Reduction* (%)
3 (n=14) 3.5 1.12 4.9 0.00024 <LOD <LOD >99
4 (n=13) 12.4 6.0 32.1 0.00004 <LOD <LOD >99
5 (n=14) 2.7 0.26 13.0 0.00027 <LOD <LOD >99 *Geometric Means and % Reduction values were estimated using the maximum likelihood estimation (MLE) method, due to the large number of non-detectable (<LOD) values in the dataset. Table VI. Reductions in respirable crystalline silica concentrations when using the generation 3 mini-baghouse control. Sampling Location
Geometric Mean* –
control off (mg/m3)
Minimum – control
off (mg/m3)
Maximum – control
off (mg/m3)
Geometric Mean* –
control on (mg/m3)
Minimum – control
on (mg/m3)
Maximum – control
on (mg/m3)
Reduction* (%)
3 (n=14) 1.05 0.40 1.83 0.022 <LOD 0.041 97.9
4 (n=13) 4.24 2.16 10.2 0.028 <LOD 0.085 99.3
5 (n=14) 1.09 0.135 4.33 0.026 <LOD 0.068 98.1 *Geometric Means and % Reduction values were estimated using the maximum likelihood estimation (MLE) method, due to the large number of non-detectable (<LOD) values in the dataset.
EPHB Report No. 373-12a
Page 23
Table VII. Comparison of Respirable Dust Control between Generation 2 and Generation 3 Mini-Baghouse.
Generation 2 Results Generation 3 Results
Sampling Location
Respirable Dust
Geometric Mean* –
control off (mg/m3) (n=16)
Respirable Dust
Geometric Mean* –
control on (mg/m3) (n=16)
Reduction* (%)
Respirable Dust
Geometric Mean* –
control off (mg/m3) (n=14)
Respirable Dust
Geometric Mean* –
control on (mg/m3) (n=14)
Reduction* (%)
3 1.5 0.15 90 3.5 0.00024 >99
4 9.7 0.24 98 12.4 0.00004 >99
5 0.73 0.047 93 2.7 0.00027 >99 *Geometric Means and % Reduction values were estimated using the maximum likelihood estimation (MLE) method, due to the large number of non-detectable (<LOD) values in the dataset.
Table VIII. Comparison of Respirable Crystalline Silica Control between Generation 2 and Generation 3 Mini-Baghouse.
control off control on control off control on (mg/m3) (mg/m3) (mg/m3) (mg/m3) (n=16) (n=16) (n=14) (n=14)
3 0.43 0.090 79 1.05 0.022 98
4 4.1 0.053 99 4.24 0.028 99
5 0.33 0.026 92 1.09 0.026 98
*Geometric Means and % Reduction values were estimated using the maximum likelihood estimation (MLE) method, due to the large number of non-detectable (<LOD) values in the dataset.
EPHB Report No. 373-12a
Page 24
Figures
Figure 1. Clouds of dust become visible as sand trucks are unloaded at a hydraulic fracturing site. Photo courtesy of Michael Breitenstein, NIOSH.
Figure 2. Sand Mover Operator at his work station on top of a sand mover, with arrows pointing to the open thief hatches. Photo courtesy of Eric Esswein, NIOSH.
EPHB Report No. 373-12a
Page 25
Figure 3. NIOSH mini-baghouse generation 2 assemblies installed on 8 thief hatches atop a sand mover during a 2013 test. Photo courtesy of Mike Gressel and Jerry Kratzer, NIOSH.
Figure 4. Test of generation 3 mini-baghouse at SWN Sand Company May 19, 2015. Photo courtesy of Barbara Alexander, NIOSH.
EPHB Report No. 373-12a
Page 26
Figure 5. Air sampling locations for test of mini-baghouse. Computer rendering developed by Kenneth Strunk, NIOSH Spokane, and modified by Barbara Alexander, NIOSH DART.
EPHB Report No. 373-12a
Page 27
Figure 6. Sampling train installed on upper corner of sand mover. Photo courtesy of Barbara Alexander, NIOSH.
Figure 7. Sampling train located in the middle of the top of the sand mover during a controlled trial run. Photo courtesy of Barbara Alexander, NIOSH.
EPHB Report No. 373-12a
Page 28
Figure 8. Sampling train located at breathing zone height on stand next to the sand mover. Photo courtesy of Barbara Alexander, NIOSH.
Figure 9. Wind direction and velocity, temperature, and relative humidity were measured with a Kestrel weather meter. Photo courtesy of Barbara Alexander, NIOSH.
EPHB Report No. 373-12a
Page 29
Figure 10. Generation 3 of the mini-baghouse retrofit assembly (right) displays better performance than generation 2 (left). Photos courtesy of Mike Gressel and Jerry Kratzer (left) and Dylan Neu (right).
EPHB Report No. 373-12a
Page 30
Figure 11. Engineering drawing of the base of the NIOSH mini-baghouse generation 3. Drawing courtesy of Jerry Kratzer.
EPHB Report No. 373-12a
Page 31
Figure 12. Boxplot of respirable dust concentrations measured at locations atop the sand mover while filling Bin 2, labeled by sampling location and whether mini-baghouse control was on or off. Plots courtesy of H. Amy Feng.
Figure 13. Boxplot of respirable dust concentrations measured at locations atop the sand mover while filling Bin 3, labeled by sampling location and whether mini-baghouse control was on or off. Plots courtesy of H. Amy Feng.
EPHB Report No. 373-12a
Page 32
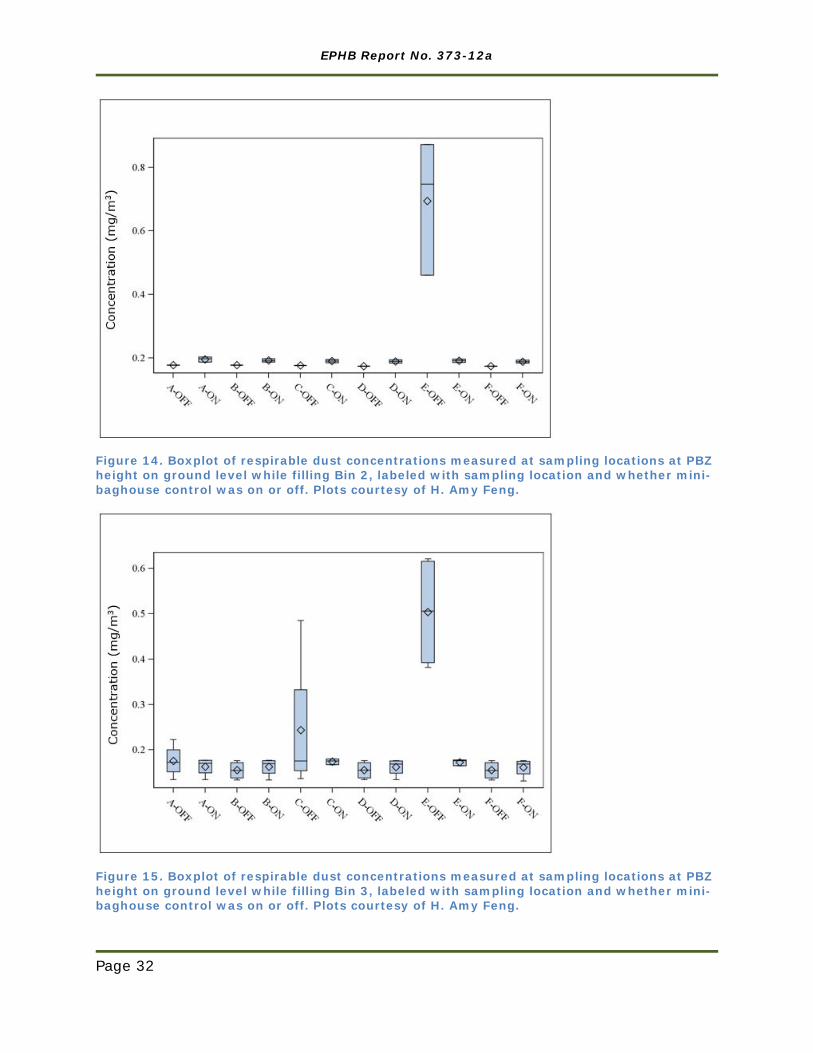
Figure 14. Boxplot of respirable dust concentrations measured at sampling locations at PBZ height on ground level while filling Bin 2, labeled with sampling location and whether mini-baghouse control was on or off. Plots courtesy of H. Amy Feng.
Figure 15. Boxplot of respirable dust concentrations measured at sampling locations at PBZ height on ground level while filling Bin 3, labeled with sampling location and whether mini-baghouse control was on or off. Plots courtesy of H. Amy Feng.
EPHB Report No. 373-12a
Page 33
Figure 16. Boxplot of RCS concentrations measured at locations atop the sand mover while filling Bin 2, labeled by sampling location and whether mini-baghouse control was on or off. Plots courtesy of H. Amy Feng.
Figure 17. Boxplot of RCS concentrations measured at locations atop the sand mover while filling Bin 3, labeled by sampling location and whether mini-baghouse control was on or off. Plots courtesy of H. Amy Feng.
EPHB Report No. 373-12a
Page 34
Figure 18. Boxplot of RCS concentrations measured at sampling locations at PBZ height on ground level while filling Bin 2, labeled with sampling location and whether mini-baghouse control was on or off. Plots courtesy of H. Amy Feng.
Figure 19. Boxplot of RCS concentrations measured at sampling locations at PBZ height on ground level while filling Bin 3, labeled with sampling location and whether mini-baghouse control was on or off. Plots courtesy of H. Amy Feng.
EPHB Report No. 373-12a
Page 35
Figure 20. Results of scanning electron microscopy analyses to determine particle size (number) distribution for 3 bulk dust samples.
Figure 21. Photomicrograph of silica dust collected during the mini-baghouse trials. SEM image courtesy of Bureau Veritas North America, Inc.
EPHB Report No. 373-12a
Page 36
Figure 22. Laboratory results of electron spin resonance (ESR) analyses performed on 3 bulk samples of dust from the test of Generation 3 of the NIOSH mini-baghouse. Blank sample is shown at top.
EPHB Report No. 373-12a
Page 37
Figure 23. Comparison of pressures recorded during filling of Bin 2 in tests of Generation 2 and Generation 3 mini-baghouse.
EPHB Report No. 373-12a
Page 38
Figure 24. Comparison of pressures recorded during filling of Bin 3 in tests of Generation 2 and Generation 3 mini-baghouse.
EPHB Report No. 373-12a
Page 39
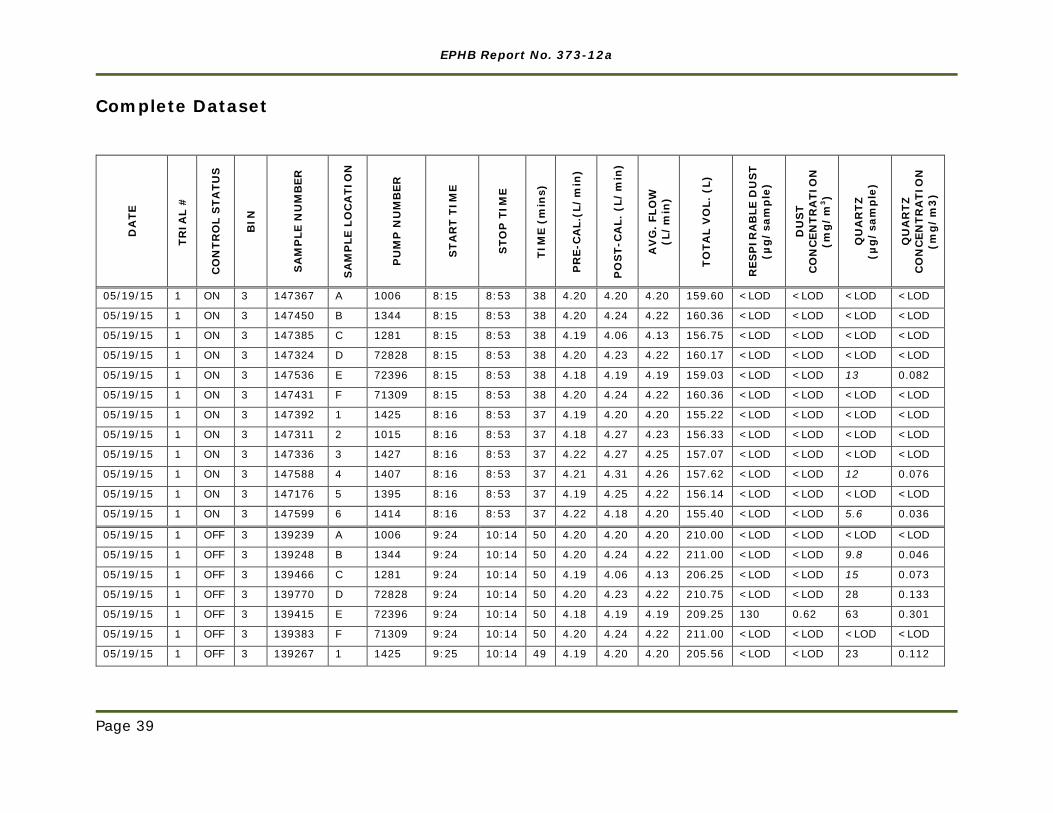
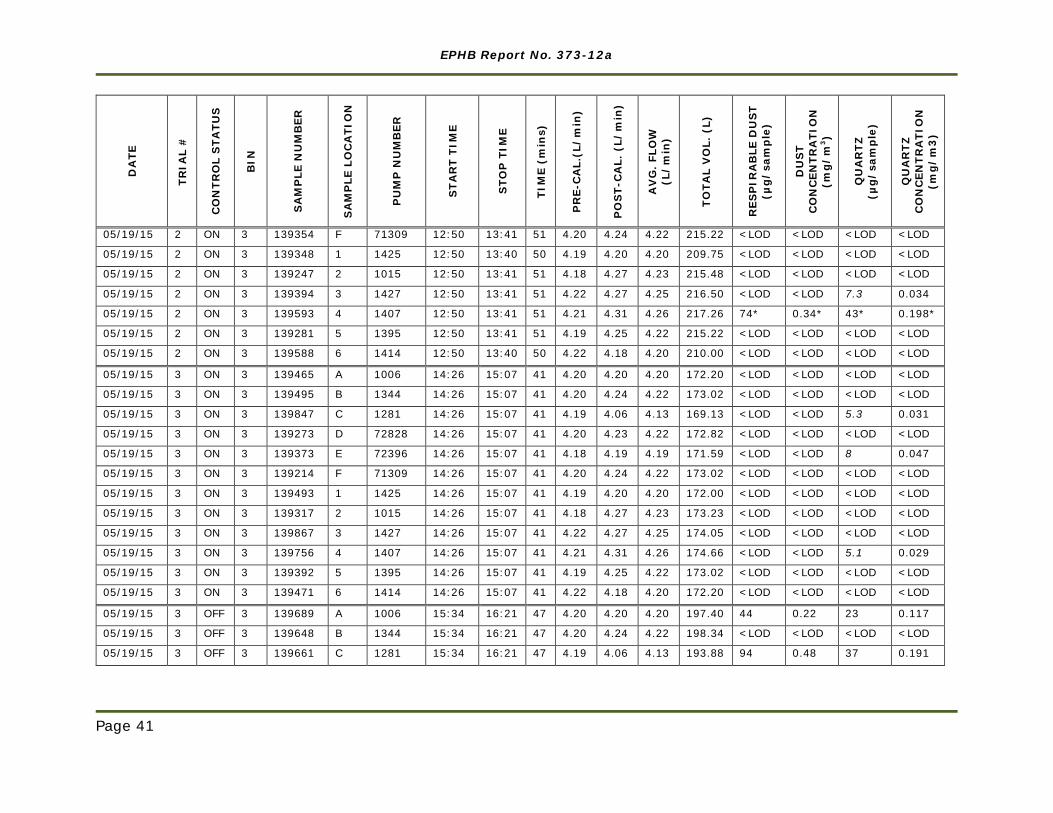
Complete Dataset
DA
TE
TRIA
L #
CO
NTR
OL
STA
TUS
BIN
SA
MP
LE N
UM
BER
SA
MP
LE L
OC
ATI
ON
PU
MP
NU
MB
ER
STA
RT
TIM
E
STO
P T
IME
TIM
E (m
ins)
PR
E-C
AL.
(L/m
in)
PO
ST-
CA
L. (
L/m
in)
AV
G.
FLO
W
(L/m
in)
TOTA
L V
OL.
(L)
RES
PIR
AB
LE D
US
T (µ
g/s
amp
le)
DU
ST
CO
NC
ENTR
ATI
ON
(m
g/m
3)
QU
AR
TZ
(µg
/sam
ple
)
QU
AR
TZ
CO
NC
ENTR
ATI
ON
(m
g/m
3)
05/19/15 1 ON 3 147367 A 1006 8:15 8:53 38 4.20 4.20 4.20 159.60 <LOD <LOD <LOD <LOD
05/19/15 1 ON 3 147450 B 1344 8:15 8:53 38 4.20 4.24 4.22 160.36 <LOD <LOD <LOD <LOD
05/19/15 1 ON 3 147385 C 1281 8:15 8:53 38 4.19 4.06 4.13 156.75 <LOD <LOD <LOD <LOD
05/19/15 1 ON 3 147324 D 72828 8:15 8:53 38 4.20 4.23 4.22 160.17 <LOD <LOD <LOD <LOD
05/19/15 1 ON 3 147536 E 72396 8:15 8:53 38 4.18 4.19 4.19 159.03 <LOD <LOD 13 0.082
05/19/15 1 ON 3 147431 F 71309 8:15 8:53 38 4.20 4.24 4.22 160.36 <LOD <LOD <LOD <LOD
*These values are outliers, caused when a conveyor belt was mistakenly started up during a trial, causing a visible cloud of dust to drift toward sampling locations C, E and 4.
Delivering on the Nation’s promise: Safety and health at work for all people through research and prevention.
To receive NIOSH documents or other information about occupational safety and health topics, contact NIOSH at