23
Planet formation in evolving protoplanetary discs Bertram Bitsch Lund Observatory July 2015 Bertram Bitsch (Lund) Planet formation July 2015 1 / 18
Planet formationin evolving protoplanetary discs
Bertram Bitsch
Lund Observatory
July 2015
Bertram Bitsch (Lund) Planet formation July 2015 1 / 18

OutlineTime evolving discs, planet migration and pebble & gas accretion!
0.01
0.02
0.03
0.04
0.05
0.06
0.07
0.08
2 5 201 10
H/r
r [AU]
tdisc = 0.0Myrtdisc = 0.1Myrtdisc = 0.2Myrtdisc = 0.5Myrtdisc = 1.0Myrtdisc = 2.0Myrtdisc = 3.0Myr
Bitsch et al. (2015), Lambrechts & Johansen (2012), Machida et al. (2010)
Bertram Bitsch (Lund) Planet formation July 2015 2 / 18

Time-scale to build gas giants
Mamajek (2009) Hartmann et al. (1998)
The protoplanetary disc evolves during time of a few Myr
Giant planet formation has to happen within the disc’s lifetime
Bertram Bitsch (Lund) Planet formation July 2015 3 / 18

Disc Model
2D hydrodynamical disc model with viscous heating, radiative coolingand stellar irradiation with S ∝ L?:
1 2 3 4 5 6 7 8 9
r [aJup]
0
0.5
1
1.5
2
2.5
3
z in [
aJup]
-13-12.5-12-11.5-11-10.5-10-9.5-9
log (
ρ in g
/cm
3 )
Bitsch et al., 2013
Mass flux through disc: M constant at each r with α viscosity:
M = 3πνΣ = 3παH2ΩKΣ
Bertram Bitsch (Lund) Planet formation July 2015 4 / 18

Cooling of the disc
Cooling of the disc:
F = − λc
ρκR∇ER
Grey area marks transition inopacity at the ice line
Change of opacity:⇒ change of cooling
Change of cooling:⇒ change in T (r)
log
(κ in
cm
2/g
)
T in K
TransitionκR
-3
-2.5
-2
-1.5
-1
-0.5
0
0.5
1
10 100 1000
Tin
K
r [AU]
TransitionM = 3.5× 10⁻⁸M⊙/yr
MMSN
50
200
500
1
10
100
2 3 4 5 201 10
Bitsch et al., 2014, 2015
Bertram Bitsch (Lund) Planet formation July 2015 5 / 18
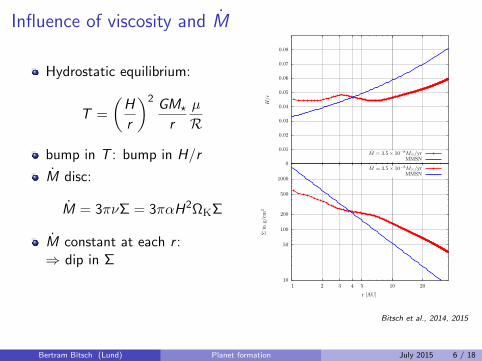
Influence of viscosity and M
Hydrostatic equilibrium:
T =
(H
r
)2 GM?
r
µ
R
bump in T : bump in H/r
M disc:
M = 3πνΣ = 3παH2ΩKΣ
M constant at each r :⇒ dip in Σ
Σin
g/cm
2
r [AU]
H/r
M = 3.5× 10⁻⁸M⊙/yrMMSN
50
200
500
10
100
1000
2 3 4 5 10 201
M = 3.5× 10⁻⁸M⊙/yrMMSN
0
0.01
0.02
0.03
0.04
0.05
0.06
0.07
0.08
Bitsch et al., 2014, 2015
Bertram Bitsch (Lund) Planet formation July 2015 6 / 18

Change of M in timeT
inK
r [AU]
TransitionM = 1.0× 10⁻⁷
M = 7.0× 10⁻⁸
M = 3.5× 10⁻⁸
M = 1.75× 10⁻⁸
M = 8.75× 10⁻⁹
M = 4.375× 10⁻⁹
50
200
500
10
100
2 3 4 5 201 10
M decreases with decreasing Σ
M = 3πνΣ = 3παH2ΩKΣEvolution in time followsHartmann et al. 1998 equation:
log
(M
M/yr
)= −8.00 − 1.40 log
(tdisc + 105yr
106yr
).
ΣG
ing/cm
2
r [AU]
H/r
M = 1.0× 10⁻⁷
M = 7.0× 10⁻⁸
M = 3.5× 10⁻⁸
M = 1.75× 10⁻⁸
M = 8.75× 10⁻⁹
M = 4.375× 10⁻⁹
1
10
50
100
200
500
1000
2 3 4 5 10 201
M = 1.0× 10⁻⁷
M = 7.0× 10⁻⁸
M = 3.5× 10⁻⁸
M = 1.75× 10⁻⁸
M = 8.75× 10⁻⁹
M = 4.375× 10⁻⁹
0
0.01
0.02
0.03
0.04
0.05
0.06
Bitsch et al., 2015
See also: K. Baillie et al. (2015) and his poster!
0.01
0.02
0.03
0.04
0.05
0.06
0.07
0.08
2 5 201 10
H/r
r [AU]
tdisc = 0.0Myrtdisc = 0.1Myrtdisc = 0.2Myrtdisc = 0.5Myrtdisc = 1.0Myrtdisc = 2.0Myrtdisc = 3.0Myr
Bertram Bitsch (Lund) Planet formation July 2015 7 / 18
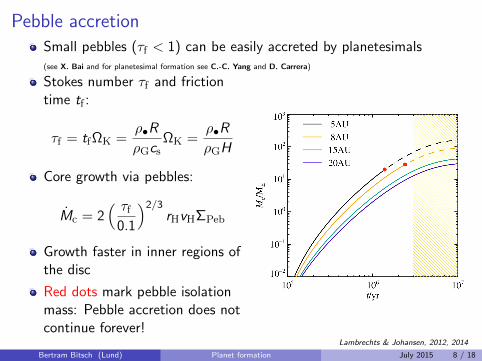
Pebble accretionSmall pebbles (τf < 1) can be easily accreted by planetesimals(see X. Bai and for planetesimal formation see C.-C. Yang and D. Carrera)
Stokes number τf and frictiontime tf :
τf = tfΩK =ρ•R
ρGcsΩK =
ρ•R
ρGH
Core growth via pebbles:
Mc = 2( τf
0.1
)2/3rHvHΣPeb
Growth faster in inner regions ofthe disc
Red dots mark pebble isolationmass: Pebble accretion does notcontinue forever!
Lambrechts & Johansen, 2012, 2014
Bertram Bitsch (Lund) Planet formation July 2015 8 / 18
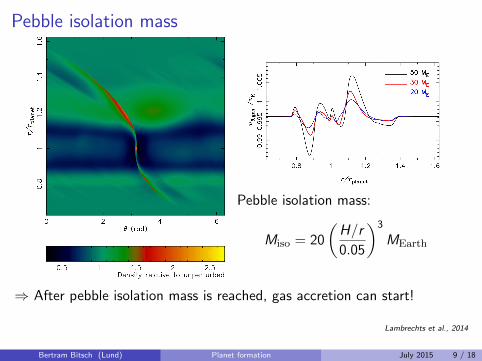
Pebble isolation mass
Pebble isolation mass:
Miso = 20
(H/r
0.05
)3
MEarth
⇒ After pebble isolation mass is reached, gas accretion can start!
Lambrechts et al., 2014
Bertram Bitsch (Lund) Planet formation July 2015 9 / 18

Planet growth
0
10
20
30
40
50
60
70
80
90
100
1 105
2 105
3 105
4 105
5 105
M [
ME]
t [yr]
McMenvMtot
Phase 1: accretion of solid core until pebble isolation
Phase 2: envelope contraction until Menv ≈ Mc, faster for larger Mc
(Piso & Youdin, 2014)
Phase 3: rapid accretion of gas onto core when Mc < Menv (Machidaet al. 2010)
Bertram Bitsch (Lund) Planet formation July 2015 10 / 18

Planet migration
Paardekooper et al. (2011):Analytic torque estimate ofembedded low mass planetsusing gradients in the disc(Σ ∝ r−αΣ ; T ∝ r−βT):
γΓtot
Γ0= −0.9− 3.22αΣ + 3.92βT
Γ0 =(qh
)2ΣPr
4PΩ2
K
Gap opening planets migratein type-II migration
M = 3.5× 10⁻⁸M/yr
M = 8.75× 10⁻⁹M/yr
Bitsch et al., 2015
See also: talk by A. Crida (yesterday)!
Bertram Bitsch (Lund) Planet formation July 2015 11 / 18

Evolution track starting at t0 = 2 Myr until tf = 3 Myr
0.0001
0.001
0.01
0.1
1
10
100
1000
5 20 30 4050 0.1 1 10
M [
ME]
r [AU]
r0 = 5.0 AUr0 = 10 AUr0 = 15 AUr0 = 25 AUr0 = 40 AUr0 = 50 AUtD=3.0Myr
(Bitsch et al., in review)
0.01
0.02
0.03
0.04
0.05
0.06
0.07
0.08
2 5 201 10
H/r
r [AU]
tdisc = 0.0Myrtdisc = 0.1Myrtdisc = 0.2Myrtdisc = 0.5Myrtdisc = 1.0Myrtdisc = 2.0Myrtdisc = 3.0Myr
Bertram Bitsch (Lund) Planet formation July 2015 12 / 18

Planet formation in evolving discEverything below blue line: pebble isolation reachedEverything above white line: Mcore > Menv
0.5x10⁶
1.0x10⁶
1.5x10⁶
2.0x10⁶
2.5x10⁶
3.0x10⁶
5 10 15 20 25 30 35 40 45 50
t 0 [
yr]
r0 [AU]
0.1
1
10
100
1000
MP in
ME
0.1 0.51.0
5.0
10.0
20.0
Z=1.0%
t0 formation time of planetary seed; r0 starting orbital distance (Bitsch et al., in review)
Bertram Bitsch (Lund) Planet formation July 2015 13 / 18

Link to observations
r/AU 5.2 9.6 19.2 30.1M/M⊕ 318 95.2 14.5 17.1
Nice model:
Compact configuration of planets that then went unstable:
r/AU ≈ 5 ≈ 8 ≈ 19 ≈ 17
Bertram Bitsch (Lund) Planet formation July 2015 14 / 18

Link to observations
r/AU 5.2 9.6 19.2 30.1M/M⊕ 318 95.2 14.5 17.1
Nice model:
Compact configuration of planets that then went unstable:
r/AU ≈ 5 ≈ 8 ≈ 19 ≈ 17
Bertram Bitsch (Lund) Planet formation July 2015 14 / 18

Link to observations
r/AU 5.2 9.6 19.2 30.1M/M⊕ 318 95.2 14.5 17.1
Nice model:
Compact configuration of planets that then went unstable:
r/AU ≈ 5 ≈ 8 ≈ 19 ≈ 17
Bertram Bitsch (Lund) Planet formation July 2015 14 / 18
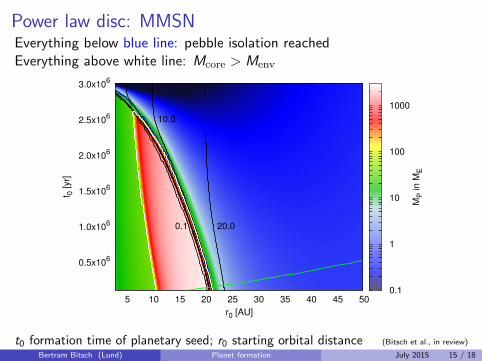
Power law disc: MMSNEverything below blue line: pebble isolation reachedEverything above white line: Mcore > Menv
0.5x10⁶
1.0x10⁶
1.5x10⁶
2.0x10⁶
2.5x10⁶
3.0x10⁶
5 10 15 20 25 30 35 40 45 50
t 0 [
yr]
r0 [AU]
0.1
1
10
100
1000
MP in
ME
0.1 20.0
10.0
t0 formation time of planetary seed; r0 starting orbital distance (Bitsch et al., in review)
Bertram Bitsch (Lund) Planet formation July 2015 15 / 18

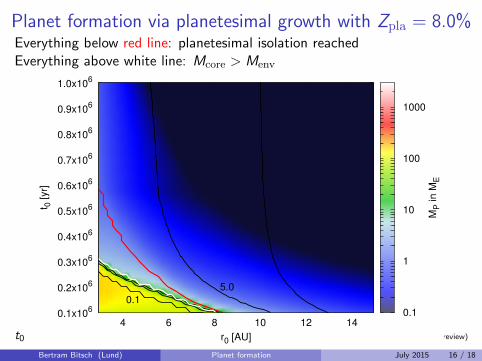
Planet formation via planetesimal growth with Zpla = 8.0%Everything below red line: planetesimal isolation reachedEverything above white line: Mcore > Menv
0.5x10⁶
1.0x10⁶
1.5x10⁶
2.0x10⁶
2.5x10⁶
3.0x10⁶
3.5x10⁶
4.0x10⁶
4.5x10⁶
5.0x10⁶
5 10 15 20 25 30 35 40 45 50
t 0 [
yr]
r0 [AU]
0.1
1
10
100
1000
MP in
ME
t0 formation time of planetary seed; r0 starting orbital distance (Bitsch et al., in review)
0.1x10⁶
0.2x10⁶
0.3x10⁶
0.4x10⁶
0.5x10⁶
0.6x10⁶
0.7x10⁶
0.8x10⁶
0.9x10⁶
1.0x10⁶
4 6 8 10 12 14
t 0 [yr]
r0 [AU]
0.1
1
10
100
1000
MP in M
E
0.1
5.0
Bertram Bitsch (Lund) Planet formation July 2015 16 / 18
Summary
Protoplanetary discs evolve in time and change their properties (Σ,T , H), which matters for all processes inside the disc (Bitsch et al. 2014, 2015)
Resulting planetary systems depend crucially on the underlyingprotoplanetary disc structure
Early planet formation produces mainly gas giants
Giant planets form far out in the disc and migrate into the inner disc
Smaller planets can form in-situ, but form late
Late formation scenario preferred: larger diversity of planetary types
Formation with planetesimals not efficient and can not explain gasgiants at r > 0.2 AU!
Bertram Bitsch (Lund) Planet formation July 2015 17 / 18

Graphical summary
Bitsch et al., in reviewBertram Bitsch (Lund) Planet formation July 2015 18 / 18


