DEPARTMENT OF THE INTERIOR UNITED STATES GEOLOGICAL SURVEY GEORGE OTIS SMITH, DIRECTOR BuxL/ETiisr 393 INCIDENTAL PROBLEMS IN GAS-PRODUCER TESTS BY R. H. FERNALD, C. D. SMITH, J. K. CLEMENT AND H. A. GRINE WASHINGTON GOVERNMENT PRINTING OFFICE 1909
Transcript
DEPARTMENT OF THE INTERIOR
UNITED STATES GEOLOGICAL SURVEYGEORGE OTIS SMITH, DIRECTOR
BuxL/ETiisr 393
INCIDENTAL PROBLEMS
IN
GAS-PRODUCER TESTS
BY
R. H. FERNALD, C. D. SMITH, J. K. CLEMENT AND H. A. GRINE
WASHINGTONGOVERNMENT PRINTING OFFICE
1909
CONTENTS.
Page.Introduction J.....................i...................................... 5Factors affecting proper length of tests..................................... 7
Practical importance of results!......................................... 7Limitations of present experiments.................................... 8Determination of fuel-bed thickness ................................... 8Effect of error in measurement......... .............................. 9Beginning and closing with equal fuel-bed depth ....................... 9Division of tests into periods .........................................: 11.Fluctuations of fuel-consumption rate.................................. 11Estimate of proper test duration. ....................................... 13Summary and table......................... .......................... 13
Temperature differences in fuel bed........................................ 15Purpose and method of .experiments................................... 15Temperature at different heights ...................................... 17Different horizontal positions ......................................... 18Causes of irregularities................................................ 20Average results for each point......................................... 20Process of gas formation .............................................. 22Differences with distance from axis.................................... 24Requisite temperature for formation of CO ............................. 26Summary............................................................ 27
ILLUSTRATIONS.
Page. FIGURK 1. Cross section of gas-producer fuel bed............................ 10
2. Variation in coal consumption per brake horsepower hour......... 123. Cross section of gas producer.................................... 164. Pyrometer tube ................................................ 175. Gas-sampling tube.............................................. 176. Curves of temperature variation with height above base of fuel bed. 217. Variation of gas combustion temperature and British thermal units
with height above base of fuel bed............................. 238. Section of producer, showing temperature variation for height and
distance from sides of producer................................ . 25
INTRODUCTION.
By J. A. HOLMES.
As part of its investigation of methods of increasing the efficiency of fuel resources, the United States Geological Survey is .studying the general problems involved in the economic use of fuels in gas pro ducers. In the course of this study many incidental problems of prime importance demand consideration. Among them is the deter mination, under practically constant conditions, of the duration of gas-producer tests necessary to reduce the possible error to a mini mum. A discussion of this proper length of test period forms the first part of this bulletin.
An attempt to dispel some of the uncertainties that arise in an investigation or to account for some of the minor phenomena often necessitates a systematic and careful study of certain chemical, ther- modynamic, or physical laws, or a combination of these, which in turn may result in information or conclusions of great value. Fur thermore, seemingly unimportant observations often prove to bear directly upon the design, construction, or manipulation of the machine under test.
In attempts to improve the gas producer considerable attention has been given by manufacturers to such questions as fixing or isolating the combustible components of the tar, utilizing the waste heat of the producer for the generation of the steam required by the plant, apply ing the suction principle to bituminous coal and other tarry fuels, and many allied subjects. Little study, apparently, has been given to the physical-chemical conditions most suitable to the formation of hydro gen and of carbon monoxide, with a view to regulating the percentages of these gases in generators using fuels other than anthracite coal or charcoal.
An attempt was made to introduce such investigations when the operations of the government coal-testing plant began at the Louisi ana Purchase Exposition in St. Louis in 1904, but owing to adverse conditions these problems were abandoned until the plant was trans ferred to Norfolk in 1907. The delay in beginning this line of inves tigations, together with the short testing season at Norfolk, limit the second part of this report to preliminary physical-chemical studies, which, however, are sufficiently significant to warrant careful exam ination pending more complete researches, which are to be carried on at the station recently located in Pittsburg.
5
INCIDENTAL PROBLEMS IN GAS-PRODUCER TESTS..
FACTORS AFFECTING PROPER LENGTH OF TESTS.
By R. H. FERNALD and C. D. SMITH.
PRACTICAL IMPORTANCE OF RESULTS.
The recent development of producer-gas as * an important element in power installations has led to a large number of tests of such plants within the past few years. Such tests have been conducted from several standpoints: (a) By the United States Geological Sur vey as a means of determining the economic value of different fuels when used in gas producers, and also the relative value of the fuels in the producer and under the steam boiler; (&) by the purchaser of such installations for a satisfactory verification of points in the con tract; (c] by the gas-producer manufacturers to assist in determining questions of proper design, bases for guaranties in contracts, etc.; and (^), unfortunately, by.some promoters to obtain results purely for advertising purposes, at the same time conveying the impression that the absurd figures quoted have been obtained by carefully con ducted tests by disinterested parties.
Some of the test results reported by certain gas-producer manu facturers are so absurd that no careful purchaser will be deceived; but, unfortunately, the alluring guaranties and special, inducements regarding the cost of the installation have caught enough unwary
'buyers to injure seriously the business of reputable concerns. It is not uncommon to pick up advertising material that states a fuel con sumption per horsepower per hour based on tests of two or three hours' duration only, in which the total coal charged during that period was from 20 to 30 pounds. The producers in such tests are of course of small sizes, but the principle is the same for all. The initial fuel bed built up before the test is started amounts to several times the quantity of fuel charged during short-interval tests, and the amount of gas that may be drawn from this foundation bed is an unknown quantity. It may be very small or may reach a large percentage of
8 PROBLEMS IN GAS-PRODUCER TESTS.
the total gas used during short tests, depending on the carelessness or cleverness of the superintendent of the test.
Of course the claim is made that at the end of the test the fuel bed is always brought to the same condition that it was in at the begin ning, but experience in this direction need not be great to show that such conditions are practically impossible in tests of short duration. The error introduced by such an assumption may be sufficiently great to make the recorded results absurd. In fact, the percentage of pos sible error may be so large that it is only necessary to predetermine the desired fuel consumption per horsepower per hour and trust to the clever manipulation of the operator to secure that result.
It is no wonder, then, that tests showing a consumption of only 0.6 pound of coal per horsepower per hour are often reported; and apparently it is only necessary for some daring'promoter to decide that a horsepower should be developed with a consumption of 0.25 pound per hour for tests to be reported that show this figure.
LIMITATIONS OF PRESENT EXPERIMENTS.
For accurate tests of gas producers and for a true determination of the fuel consumption, either (a) the conditions of the fuel bed. at the beginning and at the end of the test must be positively known, or (5) the test must be of sufficient duration to practically eliminate the uncertainties that arise from varying, conditions of the bed. Inasmuch as the first method is usually out of the question, it is necessary to resort to the second, at the same time securing as uniform conditions as possible in the fuel bed.
The exact relation between the size of producer and the proper length of test for measuring with a reasonable degree of accuracy the amount of coal consumed has not yet been fully determined atthe fuel-testing plant of the Geological Survey, but some light may be thrown upon this- important point by some of the results secured in the course of these tests.
During the tests at St. Louis very little information relating to the subject of this report could be obtained, because the average length of test was restricted to fifty hours or less by the limited supply of each variety of fuel furnished for the trial. At Norfolk, however, the conditions were more favorable in this respect, and four tests were of sufficient length to permit some study of the problem.
DETERMINATION OF FUEL-BED THICKNESS.
The producer used was of the pressure type. It was rated at 250 horsepower and was 7 feet in internal diameter. The initial fuel bed, built up before the official start of each test, amounted to about 5,000 pounds of coal.
FACTORS AFFECTING LENGTH OF TESTS. 9
The method of measuring the thickness of the fuel bed was as follows: Around the sides of the producer and located 90° apart were four sets of sight holes, designated A, B, C, and D. Each of these sets consisted of four holes placed vertically 6 inches apart, thus giving a vertical range of 18 inches for observation. During the operation of the plant the top of the ash bed was maintained within this range. The distance from the producer top to the top of the ash bed was taken as the average of the four -measurements at the points A, B, C, and D. In a similar manner the distance from the producer top to the top of the fuel bed was taken as the average of measurements at four corresponding points. The difference between these two measurements gave the thickness of the bed, and, with the weight of a given volume of the fuel known, the total weight of the fuel bed, on the basis of the assumptions noted, could be determined.
EFFECT OF ERROR IN MEASUREMENT.
The thickness of the fuel bed as determined by assumption, or even by measurement, in the producer used for these tests, may easily be in error from 4 to 6 inches. The error at the beginning may or may not be neutralized by an equal error at the close of the test period. The magnitude of the error depends on the state of the fuel at the time the measurements are taken. With a bed 7 feet in diameter it will amount to from 500 to 800 pounds if the fuel happens to be green coal (" coal as fired "); but as the uncertainty in measuring is at the bottom of the fuel bed, just above the ash line, where the fuel is not green coal but coke, an error in Aveight of fuel estimated from measurements of the depth of bed probably equals the weight of the corresponding volume of coke instead of green cpal. For the fuel used during these tests, the ratio of the weights of equal volumes of coke and coal is approximately 1 to 2. Hence, there may be an error, either positive or negative, due to the fuel-bed measurements alone, of 400 pounds of coke. .
It is readily seen that even if the essential conditions of the bed at the end of a test duplicate those at the beginning there is still con siderable difficulty in determining the exact fuel consumption, owing to inaccuracy in the measurements indicated. It is evident, however, that a test may be continued to such length that this error of 800 pounds of coal, or 400 pounds of coke, will be 'a small percentage of the total fuel consumed.
BEGINNING AND CLOSING WITH.EQUAL FUEL-BED DEPTH.
Although a test may continue so long that the error due to in accurate measurement is eliminated, a second serious difficulty is encountered if the depth of bed at the end of the test does not equal
10 PBOBLEMS IN GAS-PRODUCER TESTS.
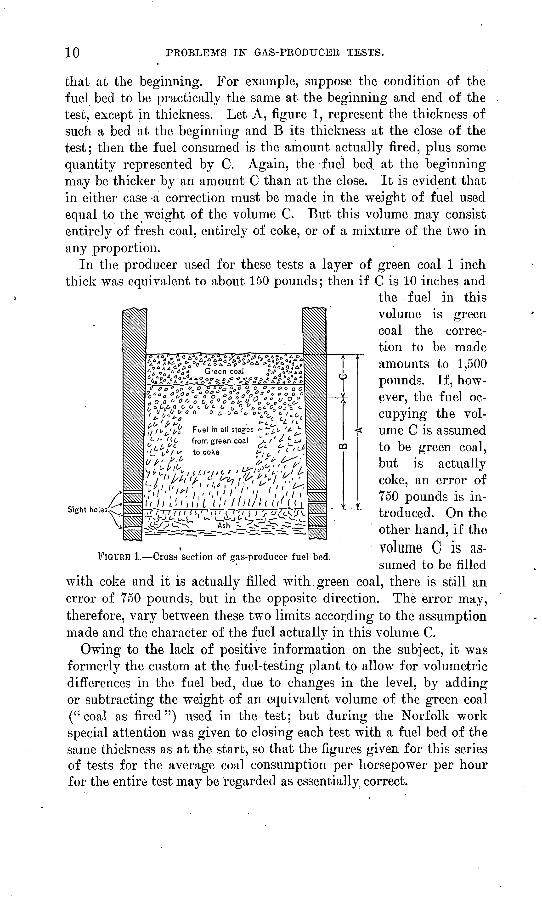
that at the beginning. For example, suppose the condition of the fuel bed to be practically the same at the beginning and end of the test, except in thickness. Let A, figure 1, represent the thickness of such a bed at the beginning and B its thickness at the close of the test; then the fuel consumed is the amount actually fired, plus some quantity represented by C. Again, the -fuel bed. at the beginning may be thicker by an amount C than at the close. It is evident that in either case -a correction must be made in the weight of fuel used equal to the weight of the volume C. But this volume may consist entirely of fresh coal, entirely of coke, or of a mixture of the two in any proportion.
In the producer used for these tests a layer of green coal 1 inch thick was equivalent to about 150 pounds; then if C is 10 inches and
the fuel in this volume is green coal the correc tion to be made amounts to 1,500 pounds. If, how ever, the fuel oc cupying the vol ume C is assumed to be green coal, but is actually coke, an error of 750 pounds is in troduced. On the other hand, if the volume C is as sumed to be filled
ir« V'/t*Fuel i'n all stages * ^i- from green coal "/- /' ̂
to coke
Sight holesST ^-r-
FIGURE 1. Cross section of gas-producer fuel bed.
with coke and it is actually filled with green coal, there is still an error of 750 pounds, but in the opposite direction. The error may, therefore, vary between these two limits according to the assumption made and the character of the fuel actually in this volume C.
Owing to the lack of positive information on the subject, it was formerly the custom at the fuel-testing plant to allow for volumetric differences in the fuel bed, due to changes in the level, by adding or subtracting the weight of an equivalent volume of the green coal ("coal as fired") used in the test; but during the Norfolk work special attention was given to closing each test with a fuel bed of the same thickness as at the start, so that the figures given for this series of tests for the average coal consumption per horsepower per hour for the entire test may be regarded as essentially, correct.
FACTORS AFFECTING LENGTH OF TESTS. 11
DIVISION OF TESTS INTO PERIODS.
In order to study conditions more carefully, each test was divided into several periods and the fuel consumed in the producer was calcu lated for each period. The desirability of having the fuel-bed level the same at the beginning and at the end of each of these short periods was not appreciated until the calculations had been made. This variation in depth (C, fig. 1) for some of the periods was as much as 10 inches, which, with a 7-foot producer, means a consid erable volume.
If the periods into which these tests are divided are only eight hours, the fuel consumption for each period amounts to only 1,800 pounds, approximately. If it so happens that an error of 750 pounds due to changes in the fuel-bed thickness is combined with a 400- pound error due to inaccurate measurement of the depth of bed, atotal error amounting to 1,150 pounds may result. The percentage of possible error in calculating fuel consumption for short periods is obviously great. With a period of twenty-four hours and a fuel consumption of about 5,400 pounds the percentage of possible error is much less, but is still over 20 per cent.
Of the tests used in studying this subject, No. 164 was divided into periods of eight hours each, while tests 165,166, and 168 were divided into periods of twenty-four hours. The table on page 14 gives the amount of coal actually charged into the producer during each period, and also the amount of coal consumed for each period as corrected (on the green-coal basis) for changes in the volume of the fuel bed, according to the methods indicated above.
FLUCTUATIONS OF FUEL-CONSUMPTION RATE.
It will be noted that the load carried, or brake horsepower, is very uniform except in one or tAvo instances, and for this reason a fairly uniform fuel consumption would naturally be expected. It will be seen from Table 1, however, that in the first three tests, Nos. 164, 165, and 166, the apparent fuel consumption per period and also per brake horsepower per hour for each period is far from uniform. The last column in the table gives the fuel consumption per brake horsepower per hour for the time from the start of the test to the end of each period. These values approach an average, and in general become more uniform as the test proceeds. It was expected that they would become so uniform as to practically determine the necessary duration of tests in plants of the given type and size, but of the four tests made only one, No. 168, was entirely satisfactory in this respect. In No. 165, for example, the average fuel consumption per brake horsepower per hour at the end of the ninth period, or 216 hours, was 0.84 pound, and at the end of the tenth period, or 240 hours, it was 0.90 pound, an
12 PROBLEMS IN" GAS-PRODUCER TESTS.
increase of 7.1 per cent. These results are shown graphically by the curves in figure 2. The horizontal straight line indicates the average
1.40 1
1.20
1.00
.80
.60
.40
3 O
<D
O
sh.ooo
_c
o-"i .so-Q
<Do.g - 603-aga.
_c oV
El. 20
c o
-Si. 00
£ .80
.60
1.00
.80
.60
(
Hours ) 25 50 75 100 125 150 175 200 225 25
-J
,\i
i i
o
-j r
4-
c ^
-r-
-V
D-
/
.
, >
^
^
\
1
^
*.
Kii
/
i
*1
*
t-
_
-td/
1
M
"1
1i
ts
"
'
-1
*=-v-V
rf
"4
~
^.
^/
-/
31
-P/
^
t
\
--
-*i
3J
/
64-
f^
1-
111
O
f"
\
. '
F
i;//
"
\
/t.±»
v
">
-T
_;
-T
V
?^
-T
^-«
At
r.
&
K
\
\
H
,'
a
> <
>-
o
N
;t/-at.
-6
^
M
^
-6
^
u
B-
s
=7X
<
^^y
f
*
x^
=!> CN'
>.
X,
'
a
">,
o-
O
V
\
*S
o-
A
)
jI
1
1
f--
/
^-g
For period. ~rom beginning of test to end of period. Average for entire test.
FIGURE 2. Variation in coal consumption per brake horsepower hour.
fuel consumption per brake horsepower per hour for the entire test; the points connected by a broken line give the fuel consumption for
FACTOES AFFECTING LENGTH OF TESTS. 13
each period and show a wide variation from one period to the next. The points connected by an unbroken line give the average fuel con sumption from, the beginning of the test up to and including any period. In test 168 the results are very satisfactory. The average fuel consumption per brake horsepower per hour did not vary more than 1 per cent after the first 96 hours of the test; hence for this one test it is clear that 96 hours would have been .sufficient for securing reasonably accurate results.
ESTIMATE OF PROPER TEST DURATION.
From the table it may be seen that the lack of uniformity in quan tity of fuel consumed per period is due, in a great measure, to the corrections made for thickness of fuel bed. The graphic logs* of these tests show that the thickness .of the fuel bed throughout testNo. 168 was comparatively uniform, although in tests 164, 165, and 166 the fuel-bed thickness varied considerably, and frequently there was a change of 8 to 10 inches during one period. These observa tions led to a study of the effect of change in thickness of the fuel bed and of the error in the calculations for fuel consumption due to inaccurate measurements. With the results of test No. 168 as a 'basis for comparison, an inspection of the other curves strengthens che im pression that, with proper precautions regarding uniformity of fuel- bed depth, approximately 100 hours may be the required duration for tests on producers of this size and type, although this period may be infmenced^by the character of the fuel used.
SUMMARY AND TABLE.
From the above discussion it is evident: (a) That throughout a test the fuel bed should be maintained in uniform condition, with regard to both the character of the fire and the thickness of bed; (5) but that failing in this, special care should be exercised to see that the fuel bed is in the same condition and of the same thickness at the close of a complete test, or at the end of a test period, as at the begin ning; (c) that a test should never be started when the producer has been standing idle for some time with " banked fires," as the fuel bed will not be in the average condition under which it will be required to work during the test; (d) that if, as the appointed hour for closing the test approaches, the fuel bed is not in the proper condition, the time of closing the test should be postponed until the bed naturally assumes the proper thickness and character! No forcing of conditions should be allowed simply to bring the test to an end at a previously determined hour.
0 These logs for tests 25-168 will appear in a bulletin entitled " Producer-gas tests, .1905-1907," now in preparation for publication by the United States Geological Survey. The logs for tests 1-124, made in 1904, appeared in Prof. Paper U. S. Geol. Survey No. 48, part 3.
14 PEOBLEMS GAS-PRODUCER TESTS.
TABLE 1. Results of gas-producer tests at Norfolk.
Divided into periods of 8 hours. 6 Divided into periods of 24 hours.
TEMPERATURE DIFFERENCES IN FUEL BED.
By J. K. CLEMENT and H. A. GRINE.
PURPOSE AND METHOD OF EXPERIMENTS.
The object, of the experiments here described was to determine as nearly as possible the differences of temperature in the fuel bed of the gas producer, and the influence of such differences on the chemical reactions taking place within the producer.
To allow the introduction of the pyrometer and gas-sampling tubes required in making these observations, a number of holes large enough to receive l|-inch wrought-iron pipes were cut through the side of the producer, as shown in figure 3. The pipes projected about an inch beyond the outer shell of the producer and were provided with cast- iron caps.
Temperature measurements were made by means of a Le Chatelier platinum, platinum-rhodium thermocouple and a direct-reading semi- portable galvanometer. The thermocouple was calibrated from time to time by determinations of the melting points of zinc and copper, and the correction required by the deviation of the temperature of the cold junction from zero was applied.
The arrangement of the thermocouple is shown in figure 4. The wires were insulated by tubes of porcelain or fused silica, and the couple was inclosed in a large tube of one or the other of these ma terials. The outer tube was incased in a protecting tube of extra heavy wrought-iron pipe.
To determine the temperature in the hotter portion of the producer proved to be no easy undertaking. Frequently, owing to the com pactness of the fuel bed, the iron tube had to be driven through the bed with a sledge hammer. Ten minutes, or longer, was required for the pyrometer to assume the temperature of the surrounding fuel.
15
16 PROBLEMS IN GAS-PRODUCER TESTS.
FIGURE-3. Cross section of gas producer.
TEMPERATURE DIFFERENCES IN FUEL BED. 17
Water
At the higher temperatures this time Avas sufficient for the iron pipe to bend and, with the aid of the reducing gases, to slag and break both the" porcelain tube and the thermocouple.
When temperature observations Avere made, gas samples Avere usu ally taken. The sampling tube is shoAvn in figure 5. In order to eliminate as far as possible any variation in the composition of the
gas through contact with a hot metallic surface, the tube Avas Avater jack eted to within 1^ inches from the end.
The method of pro cedure Avas as folloAvs: The pyrometer tube (fig. 4) was introducedthrough one of the holes in the side of the pro ducer (see fig. 3), and observations made at different elevations and at any desired distance from the axis of the pro ducer. To make a series of observations at one test hole required half an hour or more. The pyrometer tube Avas then AArithdraAvn from the producer and the gas- sampling tube inserted in its place, and samples taken at several different places. When the de sired number of observa
tions had been made at one test hole, the pyrometer tube Avas removed to another hole and the process repeated.
TEMPERATURE AT DIFFERENT HEIGHTS.
The first series of observations are contained in Tables 2 and 3. These results shoAv that the temperature is highest, about 1,300° C., at a distance of 1 foot above the base of the hood. From this point upAvard the temperature falls gradually to 400° C. near the upper surface of the bed.
869S9 Bull. 393 09 2
FIGURE 4. Pyrometer 'tube.
FIGUUE 5.- Gas-sampling tube.
18 PROBLEMS IN GAS-PRODUCER TESTS.
TABLE 2. Temperatures at specified .points in, gas producer.
A rapid fall of temperature from the lower part of the producer, where combustion is taking place, to the freshly fired fuel at the surface of the bed was to be expected, as was also the corresponding increase in the amount of combustible gases exhibited by the analyses in Table 3. In addition to this vertical temperature gradient, how ever, an unlooked-for horizontal temperature variation was observed.
DIFFERENT HORIZONTAL POSITIONS.
Table 3 shows that running through the center of the fuel bed, along the axis of the producer, is a region whose temperature is 300° or 400° C. below that of the outer portion of the bed. It seemed not
TEMPEKATURE DIFFEBENCES IN FUEL BED. 19
unlikely that the low temperature of the inner portion of the fuel bed Avould result in the formation of a gas loAver in combustible con stituents than the gas from, the outer part of the bed. In order to determine, if possible, the extent of variation of the quality of the gas from the axis toward the wall of the producer, in connection with further temperature observations, gas samples were taken at varying distances from the axis of the producer. The results of observations made in this manner are contained in Table 4.
TABLE 4. Temperatures at specified points in- gas producer, with analyses and British tJtcrmal units of yas samples taken at different li,eigli,ts and distances.
" Test 20 was made Immediately after test 19. water cooled and in test 20 it was uncooled.
In test 19 the gas-sampling tube was
In every case there is a rise of 300° or 400° C. from the interior to the exterior region of the fuel bed. Analyses of the gas samples fail to show any corresponding systematic variation in the amount of combustibles present. This can be explained, in part at least, by the circumstance that when the sampling tube was in position 'in the furnace, though an attempt was made to close the space between the sampling tube and the wall of the test hole, usually the excess pressure
20 PEOBLEMS IN GAS-PRODUCEE TESTS.
within the producer forced a passage between sampling tube and producer wall, through which poured a current of hot gasses. Con sequently a current of gas, drawn from all parts of the producer, is continually flowing past the end of the sampling tube, and the gas drawn through the sampler probably does not represent the normal condition at the point of sampling.
CAUSES OF IRREGULARITIES.
A comparison of the temperature observations of Table 4 shows that there is a considerable deviation between observations made at the same points in the fuel bed but on different days. The tempera ture at any point in the producer is dependent on the depth of fuel bed, the draft, poking, and firing. As these conditions can not be maintained absolutely constant, the temperature varies accordingly. In order to obtain results which are strictly comparable, temperature measurements and gas sampling should take place simultaneously in various parts of the fuel bed. This is obviously impossible on account of the great amount of apparatus that would have to be handled and the rapidity with which the pyrometer and sampling tubes are attacked and destroyed in the hotter parts of the fuel bed. So much time was required for each observation that relatively few could be made in one day. Moreover, during a series of observations extending over a day, the condition of the fuel bed was continually changing, so that results obtained on the same day may disagree.
AVERAGE RESULTS FOR EACH POINT.
In Table 5 all the results in Tables 2, 3, and 4 have been combined by averaging the observations for each point in the producer. The observations are grouped with respect to their distance from the axis and in the order of their height above the hood.
TABLE 5. Average of observed temperatures and gas analyses for specified points in gas producer, grouped by distances from axis.
Distance from axis of producer.Height above base of hood.
Ft. in.{ 4 3
3 32 3
I 1 3 I 4 3 1 3 3 1 2 3
1 3
Gas analysis.
CO 2.
7.0 7.2 6.4
12.0
CO.
21.2 21.0 27.5 16.3
H2.
16.5 20.7 16.4 7.6
CH4 .
6.0 3.6 2.1 .45
N2:
49.3 47.4 47.3'
63.6
British thermal units of gasper cubic foot.
195.5 183.6 175.5 88.0
Tem pera ture.
°C.445 521 867
1,151 419 526
1,098 1.220
TEMPERATURE DIFFERENCES IF FUEL BED. 21
TABLE 5. Average of observed temperatures and (/as analyses for specified points in gas producer, grouped l)y distance from axis Continued.
Distance from axis of producer.
S4 Indies
Height above base of hood.
Ft. in. f 4 3
3 3 \ 2 3
1 3 f 4 3 1 3 3 I 2 3 I 1 3 ( 4 3 1 3 3
1 2 3 I 1 3
Gas analysis.
C02.
4.8 5.3
10.5 9.0
4.9 5.9 0.5
CO.
25.6 24.3
23.2 22.7
21.4 27.6 28.0
Ha.
17.4 19.07.7 8.2
22.2 12.3 10.6
CH<.
2.4 2.7 1.2 .9
3.7 .6 .6
N 2 .
49.4 48.5 57.3 59.2
46.7 53.6 54.3
British thermal units of gas per cubic foot.
182.1 178.6 123.1 117.3
191.8 145.3 141.0
Tem pera ture.
°C. 515 877
1, 140 1,185
706 1,014 1,144 1,074
840 1,057 1,169 1,015
The variations both of temperature and of composition of gases are more marked than in the preceding tables. The temperature
1200
1000
o°. 800
f, 600
400
200
100
334 from ax s of producer
is of producer
of producer
2 3 Height above base of hood, feet
FIGURE 6. Curves of temperature variation with height above base of fuel bed.
gradients along vertical lines located 7, 22, and 34 inches from the axis are illustrated graphically in figure 6. Here the curve for the temperatures nearest the axis (7 inches) falls rapidly from 1,150° to 500° C. The middle curve of temperatures, midway between axis and wall, is flat for a distance representing a foot or more in height and then falls off as it approaches the top of the fuel bed. Finally the top curve for temperatures, near the furnace wall, rises gradually to a maximum and then falls off slowly. The low temperature at the
22 PROBLEMS IN GAS-PRODUCER TESTS.
lower part of the fuel bed and near the wall is due to the accumula tion of ashes at that point.
These temperature variations are further illustrated-in figure 8, in which curves are drawn through points of equal temperature. The absolute temperature at any point in the fuel bed varies with, the conditions of operation for example, with the depth, draft, poking, and grinding of the bed. The curves in figure 8 have there fore a relative value only. They serve to show, however, that running through the center of the fuel bed is a region of low temperature, 300° to 400° C. below the temperature of the outer zones.
PROCESS OF. GAS FORMATION.
In addition to combustion, the two principal reactions that take place in the producer are CO2+C=2CO and H2O+C=CO-f-H2 . The temperature in the central portion of the fuel bed is so low that these reactions can not take place there to an appreciable extent. Consequently a considerable proportion of the producer fuel bed is not effective in forming producer gas, and the producer is operating at a far lower capacity than if the temperature of the inner region were maintained equal to that of the outer zone.
Figure 8 furnishes an explanation of the irregular temperature distribution in the fuel bed. The current of air and steam proceed ing from the mouth of the blower at a has two paths open to it, one straight ahead through c and one under the base of the hood at &. From the direction of the isothermal lines in figure 8, it seems likely that the greater portion of the incoming air passes out under the base of the hood and up through the outer part of the fuel bed. Either the opening at c is too small or it is clogged with ash and fuel.
In Table 5 the process of formation of producer gas may be tracedroughly in each of the three groups of samples. The proportion of C02 and nitrogen decreases in each group from the level of test hole No. 2, which is a foot above the hood, to the surface of the fuel bed. There is a marked increase in the percentage of hydrogen and methane (CHJ from the lower to the upper test hole. A corre sponding increase in the amount of carbon monoxide (CO) might be expected. The CO values in Table 5, however, exhibit no sys tematic variation.
The variations are more clearly shown in Table 6, in which the means of all the values for each height, irrespective of distance from the axis, are arranged in the order of .the height of the points of observation above the hood.
TEMPERATURE DIFFERENCES IN- FUEL BED. 23
TABLE 6. Average of observed temperatures and gas analyses for specified heights, irrespective of distance, in gas producer.
Height above base of hood.Gas analysis.
C0 2.
7.2 5.6 0.1 7.8
10.5
CO.
22.9 22.7 24.3 26.2 19.5,
Ha.
15.0 18.7 17.3 11.6 7.9
CH4 .
1.8 4.0 2.3 1.3.7
N 2 .
53.1 48.5 49.8 53.0 61.4
British thermal units of gas per cubic foot.
152.9 189.8 169.2 146.5 102.6
Tem pera ture.
°C.
585 799
1,084 1,129
The values of Table 6 are represented graphically by the curves, in figure 7. The vertical line at the right of the figure (abscissa=5 feet
2 3 .4
Height above base of hood, feet
FIGURE 7. Variation of gas combustion temperature and British thermal units with height above base of fuel bed.
6 inches) represents the approximate level of the surface of the fuel bed. The points lying on this line and connected with the appropriate curves by means of dotted lines are the mean values of the percentage of the various gases and of the calorific values in British thermal
PROBLEMS IN GAS-PRODUCER, TESTS.
units for the gas leaving the producer. The data are taken from the official gas analyses. The temperature is that of the gas just above the fuel bed.
The conclusions or results shown by Table 6 and figure 7 are of interest only as a confirmation of the generally accepted theory of the gas producer and offer nothing novel.
DIFFERENCES WITH DISTANCE FROM AXIS.
In Table 7 the results of Table 5 have been grouped in accordance with their height above the base of the hood, to permit a comparison of gas samples taken from the same height in the producer but at different distances from the axis.
TABLE 7. Average of observed temperatures and gas analyses for specified points in gas producer, grouped l>y heights.
It has been shown above (p. 22 and fig. 8) that the low tempera ture of the interior of the producer is not favorable to the formation of CO and H2 . It was to be expected, therefore, that samples taken in the outer portions of the fuel bed would show a higher percentage of H2 and CO and a lower percentage of CO2 than those taken along the same radius nearer the axis of the producer.
Assuming that the temperature distribution in the producer is represented correctly by the curves of figure 8, and assuming further that the lines of flow of the gas are approximately vertical, then samples from the same level, up to the level of test hole No. 3, should not be expected to show any great variation.
Above the level of hole 3 the temperature of the interior of the bed is below the temperature necessary for the formation of appreci-
TEMPERATURE DIFFERENCES IN FUEL BED. 25
able quantities of CO and EL A marked difference might therefore be expected between samples from the inner and outer portions of the bed taken through test hole 4 or 5. Table 7 does not show any such systematic difference. Whereas at an elevation of 4 feet 3 inches above the base of the hood (hole 5) the hydrogen content is appre ciably higher near the wall of the producer than near the axis, the
FIGURE 8. Section of producer showing temperature variation for height and distancefrom sides of producer.
samples taken a foot lower (hole 4) show a variation in the opposite direction. The methane content alone shows a systematic variation, being higher in samples from the inner portion of the bed. This is probably because methane, being readily liberated at relatively low temperatures, is mostly given off before the coal reaches the hot region of the outer zone.
26 PEOBLEMS IN GAS-PRODUCER TESTS.
REQUISITE TEMPERATURE FOR FORMATION OF CO.
The experiments show a gradual increase in the amount of com bustible constituents and a corresponding decrease in the amount of CO2 from the level of test hole 2 to the surface of the bed. While the percentage of hydrogen is more than doubled between holes 2 and 5, the increase in CO is less than a fourth as great. Apparently the formation of CO from CO 2 takes place for the most part below hole 2, in the lower part of the bed.
The analyses of gas samples offer no evidence to confirm the sup position that the lower temperature of the inner portion of the bed would give rise to a gas lower in CO and EL, than that of the outer regions. These facts especially made it desirable to determine, if possible, the temperature requisite for the formation of gas rich in CO and H2J or in. other words to determine at what temperatures the reaction CO2+C=2CO and H,O+C=CO+H2 may be complete.
An extensive series of investigations on the relative proportions of CO2 and CO in equilibrium with carbon at different temperatures has been carried out by Boudouard.a He found the respective per centages of CO 2 and CO in equilibrium with carbon at 650° C. to be 61 and 39; at 800° C., 7 and 93; and at 925° C., 4 and 96.
1 These results of Boudouard have been used by writers on the theory of the gas producer to demonstrate the temperature in the fuel bed necessary for the formation of rich CO gas. Boudouard's results ap ply to mixtures of C02 and CO which have been in contact with hot carbon for a considerable length of time until equilibrium has been reached. In his experiments at 650° and 800° C. sealed glass tubes containing carbon and CO 2 were heated for a period of several hours.
Since for the reaction CO 2 -|-C=2CO an appreciable amount oftime is required that is, the reaction does not take place instanta neously the direct application of Boudouard's results to the process in the gas producer, in which the gas rushes through the fuel bed at a high velocity is not justifiable. Recent experiments under the direc tion of one of the authors of this report, the results of which will be 'published in forthcoming bulletins, have established that, with the rate of flow of gas and the depth of fuel bed which obtain in a gas producer a temperature of 1,100° C. or more is required for the for mation of 90 per cent CO gas from CO, and charcoal, and 1,300° for the same percentage from C0 2 and coke and from CO 2 and anthracite coal. With a temperature 100° C. lower than these the resultant gas will contain about 50 per cent CO. It follows that the temperature of the fuel bed of the gas producer must be at least 1,300° C. in.order to yield the highest possible percentage of CO.
<*Boudouard, Compt. Rend. Acad. Sci. Paris, vol 28, 1890, pp. 824, ,1542; vol. 130, 1000, p. 132; vol. 131, 1000, p. 1204. See also Haber, Thermodynamics of technical gas reactions, London, 1908, p. 311.
TEMPERATURE DIFFERENCES IN FUEL BED. ' 27
SUMMARY.
1. Temperature observations were made and gas samples taken in different parts of the fuel bed of the gas producers. The temperature was found to be highest at the bottom of the fuel bed and to decrease from this point to the top of the bed.
2. The temperature of the inner region of the fuel bed was found to be 300° or 400° lower than that of the outer layers. A correspond ing inferiority in the quality of the gas in the center of the producer could not be established; probably on account of the defective method of sampling.
3. It has been suggested that by an improvement in the method of admitting the draft to the fuel bed a more uniform distribution of temperature, and consequently a gain in the capacity of the producer and in the quality of the gas, might be obtained.
4. Reference has been made to recent experiments by one of the authors which have established 1,300° C. as the lower limit of tem perature for the formation of a gas rich in CO.
SURVEY PUBLICATIONS ON FUEL TESTING.
A classified list of Survey papers dealing with coal is given in Bul letin 316, and in an abstract from that bulletin, pp. 439 to 532, pub lished separately.
The following publications on fuel testing, except those to which a price is affixed, can be obtained free by applying to the Director, Geological Survey, Washington, D. C. The priced publications can be purchased from the Superintendent of Documents, Government Printing Office, Washington, D. C.
BULLETIN 261. Preliminary report on the operations of the coal-testing plant of the United States Geological Survey at the Louisiana Purchase Exposition, in St. Louis, Mo., 1904; E. W. Parker, J. A. Holmes, M. R. Campbell, committee in charge. 1905. 172 pp. 10 cents.
PROFESSIONAL PAPER 48. Report on the operations of the coal-testing plant of the United States Geological Survey1 at the Louisiana Purchase Exposition, St. Louis, Mo., 1904; E. W. Parker, J. A. Holmes, M. R. Campbell, committee in charge. 1906. In three parts. 1492 pp., 13 pis. $1.50.
BULLETIN 290. Preliminary report on the operations of the fuel-testing plant of the United States Geological Survey at St. Louis, Mo., 1905, by J. A. Holmes. 1906. 240 pp. 20 cents.
BULLETIN 323. Experimental work conducted in the chemical laboratory of the United States fuel-testing plant at St. Louis, Mo., January 1, 1905, to July 31, 1906, by N. -W. Lord. 1907. 49 pp. 10 cents.
BULLETIN 325. A study of four hundred steaming tests, made at the fuel-test ing plant, St. Louis, Mo., 1904, 1905, and 1Q06, by L. P. Breckenridge. 1907. 196 pp. 20 cents.
BULLETIN 332. Report of the United States fuel-testing plant at St. Louis, Mo., January 1, 1906, to June 30, 1907; J. A. Holmes, in charge. 1908. 299 pp.
BULLETIN 334. The burjiing of coal without smoke in boiler plants; a prelimi nary report, by D. T. Randall. 1908. 26 pp. 5 cents.
BULLETIN 336. Washing and coking tests of coal and cupola tests of coke, by Richard Moldenke, A. W. Belden, and G. R. Del.amater. 190S. 76 pp. 10 cents.
BULLETIN 339. The purchase of coal under government and commercial speci fications on the basis of its heating value, with analyses of coal delivered under government contracts, by D. T. Randall. 1908. 27 pp. 5 cents.
BULLETIN 343.'Binders for coal briquets, by J. E. Mills. 1908? 56 pp.BULLETIN 362. Mine sampling and chemical analyses of coals tested at the
United States fuel-testing plant, Norfolk, Va., in 1907, by J. S. Burrows. 1908. 23 pp. 5 cents.
BULLETIN 363. Comparative tests of run-of-mine and briquetted coal on loco motives, by W. F. M. Goss. 1908. 57 pp.
BULLETIN 366. Tests of coal and briquets as fuel for house-heating boilers, by D. T. Randall. 1908. 44 pp.
28
SURVEY PUBLICATIONS ON FUEL TESTING. 29
BULLETIN 367. Significance of drafts in stearn-boiler practice, by W. T. Ray and Henry Kreisinger. 1909. 61 pp.
BULLETIN 368. Washing and coking tests of coal at Denver, Colo., by A. W. Belden, G. R. Delamater, and J. W. Groves. 1909. 54 pp., 2 pis.
BULLETIN 373. The smokeless combustion of coal in boiler plants, by D. T. Randall and H. W. Weeks. 1909. 188 pp.
BULLETIN 378. Results of purchasing coal under government specifications, by J. S. Burrows; Burning the small sizes of anthracite for heat and power purposes, by D. T. Randall. 1909. 44 pp.
BULLETIN 385. Briquetting tests at Norfolk, Va., by C. L. Wright. 1909. 41 pp., 9 pis. ' '
BULLETIN 392. Gasoline and. alcohol tests on iuternal-combustion engines, by R. M. Strong. 1909.