JANUARY 14, 2013 Gun Rights Proponents More Politically Active In Gun Control Debate, Several Options Draw Majority Support FOR FURTHER INFORMATION CONTACT: Michael Dimock Director Carroll Doherty Associate Director 1615 L St, N.W., Suite 700 Washington, D.C. 20036 Tel (202) 419-4350 Fax (202) 419-4399 www.peoplepress.org
Transcript
JANUARY 14, 2013
Gun Rights Proponents More Politically Active
In Gun Control Debate, Several Options Draw Majority Support
FOR FURTHER INFORMATION CONTACT:
Michael Dimock
Director
Carroll Doherty
Associate Director
1615 L St, N.W., Suite 700
Washington, D.C. 20036
Tel (202) 419-4350
Fax (202) 419-4399
www.peoplepress.org
Gun Rights Proponents More Politically Active
In Gun Control Debate, Several Options Draw
Majority Support
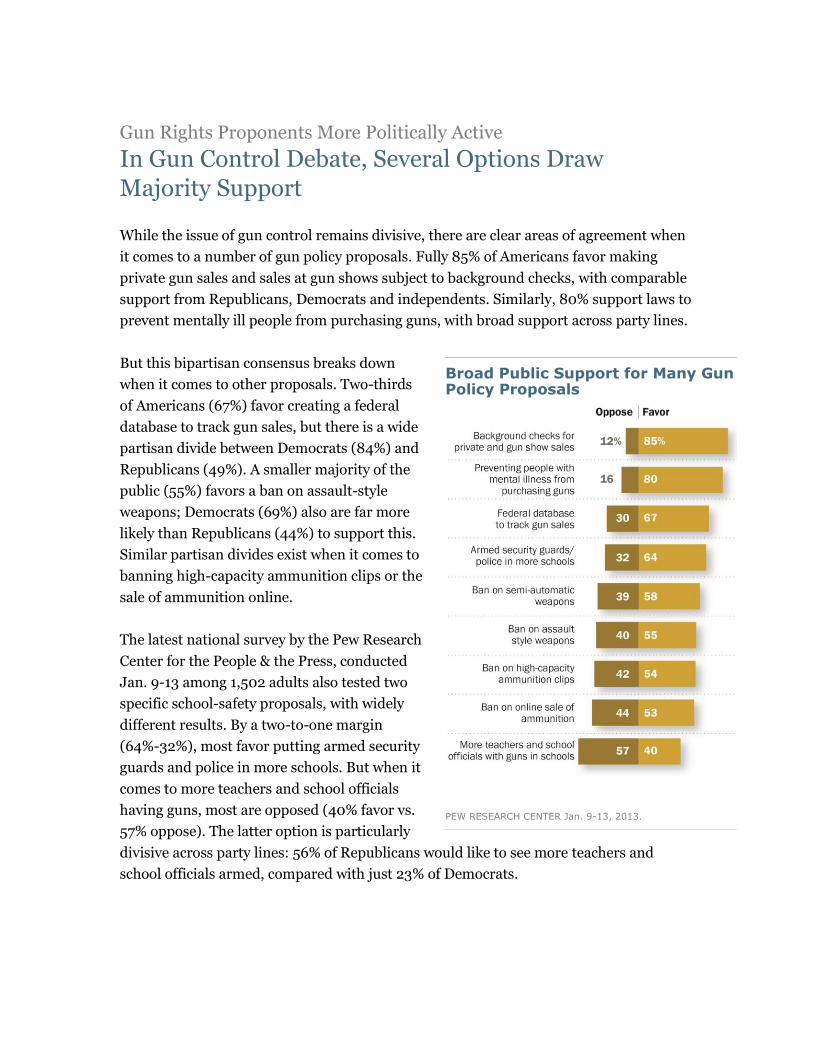
While the issue of gun control remains divisive, there are clear areas of agreement when
it comes to a number of gun policy proposals. Fully 85% of Americans favor making
private gun sales and sales at gun shows subject to background checks, with comparable
support from Republicans, Democrats and independents. Similarly, 80% support laws to
prevent mentally ill people from purchasing guns, with broad support across party lines.
But this bipartisan consensus breaks down
when it comes to other proposals. Two-thirds
of Americans (67%) favor creating a federal
database to track gun sales, but there is a wide
partisan divide between Democrats (84%) and
Republicans (49%). A smaller majority of the
public (55%) favors a ban on assault-style
weapons; Democrats (69%) also are far more
likely than Republicans (44%) to support this.
Similar partisan divides exist when it comes to
banning high-capacity ammunition clips or the
sale of ammunition online.
The latest national survey by the Pew Research
Center for the People & the Press, conducted
Jan. 9-13 among 1,502 adults also tested two
specific school-safety proposals, with widely
different results. By a two-to-one margin
(64%-32%), most favor putting armed security
guards and police in more schools. But when it
comes to more teachers and school officials
having guns, most are opposed (40% favor vs.
57% oppose). The latter option is particularly
divisive across party lines: 56% of Republicans would like to see more teachers and
school officials armed, compared with just 23% of Democrats.
Broad Public Support for Many Gun Policy Proposals
PEW RESEARCH CENTER Jan. 9-13, 2013.
2
www.people-press.org
23
15
19
12
5
8
15
10
Gun rights Gun control
Among those who prioritize...
Expressed opinion on gun policy on a social network
like Facebook or Twitter
Contributed money to an organization that takes a
position on gun policy
Contacted a public official to express
opinion on gun policy
Signed a petition on gun policy
42
25 NET: One or more activity
The Activism Gap
The survey finds that 51% of Americans say it
is more important to control gun ownership,
while 45% say it is more important to protect
gun rights. This balance of opinion is virtually
unchanged from mid-December when, in the
immediate wake of the Newtown, CT shooting,
public opinion shifted modestly in the
direction of gun control. These are the only
surveys since Obama became president in
which significantly more have prioritized gun
control than gun rights.
There is a wide gap between those who
prioritize gun rights and gun control when it
comes to political involvement. Nearly a
quarter (23%) of those who say gun rights
should be the priority have contributed money
to an organization that takes a position on gun
policy, compared with just 5% of those who
prioritize gun control. People who favor gun
rights are also about twice as likely as gun
control supporters to have contacted a public
official about gun policy (15% vs. 8%).
By contrast, comparable percentages of gun
rights supporters (19%) and those who
prioritize gun control (15%) say they have
expressed their opinion about gun policy on
social networks. And about one-in-ten in each
group says they have signed a petition on gun
policy (12% of gun rights supporters, 10% of
gun control supporters).
No Change in Gun Control Views Since Shortly After Newtown
Control gun
ownership
Protect the right of
Americans to own guns DK
Recent trend % % %
Jan 9-13, 2013 51 45 5=100
Dec 17-19, 2012 49 42 9=100
July 2012 47 46 6=100
Apr 2012 45 49 6=100
Previous years
Mar 2011 47 48 6=100
Mar 2010 46 46 7=100
Apr 2009 49 45 6=100
Apr 2008 58 37 5=100
Apr 2007 60 32 8=100
PEW RESEARCH CENTER Jan. 9-13, 2013. Q40. Figures may not add to 100% because of rounding.
Republicans, 42% of independents and just 23% of Democrats favor arming more
teachers and school officials.
There also are substantial partisan gaps over banning assault-style and semi-automatic
weapons (25 points and 19 points respectively), and banning the online sale of
ammunition and high capacity ammunition clips (20 points, 18 points).
However, two proposals draw overwhelming support from Republicans, Democrats and
independents -- making private gun sales and sales at gun shows subject to background
checks, and laws to prevent people with mental illness from purchasing guns.
Majorities in each political group also favor putting armed security guards or police in
more schools, though this proposal garners more support from Republicans (73% favor)
than from Democrats (62%) or independents (59%).
Bipartisan Support for Regulations on Gun Shows and Mentally Ill, More School Guards
% who favor…
Rep Ind Dem D-R gap
% % %
Creating a federal database to track gun sales 49 68 84 D+35
Ban on assault-style weapons 44 50 69 D+25
Ban on online sale of ammunition 41 54 61 D+20
Ban on semi-automatic weapons 49 56 68 D+19
Ban on high-capacity ammunition clips 46 53 64 D+18
Background checks for private & gun show sales 85 85 87 D+2
Laws to prevent mentally ill people from purchasing guns 86 82 78 R+8
Putting armed security guards or police in more schools 73 59 62 R+11
More teachers and officials with guns in schools 56 42 23 R+33
PEW RESEARCH CENTER Jan. 9-13, 2013. Q42.
4
www.people-press.org
There are intra-party differences, as well as
differences between parties, over several of
these proposals. This is reflected in opinions
about proposals to ban semi-automatic or
assault-style weapons.
Opinions about both proposals are similar
across party lines: 49% of Republicans favor a
ban on semi-automatic weapons, while 44%
favor banning assault-style. Among
Democrats, 68% favor banning semi-automatic
weapons and 69% support banning assault-
style weapons.
Combining results from the two questions,
62% of moderate and liberal Republicans favor
banning semi-automatic or assault-style weapons compared with 40% of conservative
Republicans. While 78% of liberal Democrats (78%) favor banning semi-automatic or
assault weapons, a smaller majority of conservative and moderate Democrats (65%) do
so.
Views of Banning Semi-Automatic, Assault-Style Weapons
Favor Oppose DK
% % %
Total 56 40 4=100
Republican 47 48 5=100
Conservative Rep 40 52 7=100
Mod/Lib Rep 62 38 0=100
Independent 53 43 4=100
Democrat 69 29 2=100
Cons/Mod Dem 65 32 2=100
Liberal Dem 78 21 1=100
PEW RESEARCH CENTER Jan. 9-13, 2013. Results based on combination of Q42a (ban on semi-automatic weapons) and Q42f (ban on assault-style weapons). Figures may not add to 100% because of rounding.
5
www.people-press.org
Gender, Education Differences over Gun Proposals
Men are divided over whether it is more important to protect the right of Americans to
own guns or to control gun ownership (51% vs. 44%). Women, by contrast, prioritize
controlling gun ownership: 57% view this as more important compared with 38% who
prioritize gun rights.
There also are sizable gender
differences over some
specific gun policy proposals:
Fully two-thirds of women
(67%) favor a ban on semi-
automatic weapons, while
men are divided – 48% favor
such a ban while 50% are
opposed.
Majorities of women and
men favor creating a federal
database to track gun sales,
but this proposal draws more
support from women (73%) than men (61%). By contrast, men are more likely than
women to favor more teachers and school officials having guns at school (47% vs. 32%).
Large majorities of men and women favor background checks for private gun sales and
gun shows and laws to prevent mentally ill people from buying guns. There also is broad,
though less overwhelming, support among both men and women for putting armed
security guards or police in schools.
Far More Women than Men Favor Banning Semi-Automatic Weapons
% who favor…
Men Women Gap
% %
Ban on semi-automatic weapons 48 67 W+19
Creating a federal database to track gun sales 61 73 W+12
Ban on assault-style weapons 50 59 W+9
Ban on online sale of ammunition 48 57 W+9
Ban on high-capacity ammunition clips 50 57 W+7
Background checks for private & gun show sales 83 88 W+5
Laws to prevent mentally ill people from purchasing guns 82 79 M+3
Armed security guards or police in more schools 66 63 M+3
More teachers and officials with guns in schools 47 32 M+15
PEW RESEARCH CENTER Jan. 9-13, 2013. Q42.
6
www.people-press.org
There also are educational
differences over gun policy
proposals. A proposal to put
armed security guards or
police in more schools
attracts widespread support
among those with no more
than a high school education
(75% favor) and those with
only some college experience
(68% favor). Fewer than half
of college graduates (44%)
support this proposal.
College graduates are much more supportive than those with less education of banning
high-capacity ammunition clips and assault-style weapons.
Gun Owners and Gun Policy
A third (33%) of Americans
say there are guns, rifles or
pistols in their home, which
is little changed from recent
surveys. More than twice as
many gun owners (65%) as
those who do not own guns
(30%) say it is more
important to protect gun
rights than to control gun
ownership.
However, majorities of gun
owners favor a number of the
gun policy proposals tested
in this survey: Fully 90%
favor laws to prevent mentally ill people from buying guns and 85% favor making private
Wide Educational Differences over Putting Armed Security Guards in More Schools
% who favor…
Coll grad+
Some coll
HS or less
Hi-Lo gap
% % %
Ban on high-capacity ammunition clips 70 52 45 +25
Ban on assault-style weapons 68 53 47 +21
Background checks for private & gun show sales 90 88 80 +10
Laws to prevent mentally ill people from purchasing guns 84 83 75 +9
Creating a federal database to track gun sales 73 66 65 +8
Ban on online sale of ammunition 56 54 49 +7
Ban on semi-automatic weapons 62 53 58 +4
More teachers and officials with guns in schools 30 46 41 -11
Armed security guards or police in more schools 44 68 75 -31
PEW RESEARCH CENTER Jan. 9-13, 2013. Q42.
Most Gun Owners Favor a Federal Database to Track Gun Sales
Have a gun at home?
% who favor…
Yes No Gap
% %
Ban on assault-style weapons 43 63 -20
Creating a federal database to track gun sales 60 74 -14
Ban on high-capacity ammunition clips 49 58 -9
Ban on semi-automatic weapons 54 62 -8
Ban on online sale of ammunition 51 56 -5
Background checks for private & gun show sales 85 87 -2
Armed security guards or police in more schools 63 64 -1
Laws to prevent mentally ill people from purchasing guns 90 76 +14
More teachers and officials with guns in schools 48 33 +15
PEW RESEARCH CENTER Jan. 9-13, 2013. Q42.
7
www.people-press.org
gun sales and sales at gun shows subject to background checks. By 60% to 37%, gun
owners also favor the creation of a federal
government database to track all gun sales.
The Political Landscape
As has been the case over the past decade,
neither party has a clear political advantage
when it comes to the gun control issue: 38%
feel the Republican Party does a better job of
reflecting their views, while 40% say the
Democratic Party. Not surprisingly, gun
owners and those who prioritize gun rights see
the GOP as more in line with their thinking,
while non-gun owners and those who favor
gun control say the Democratic Party shares
their views.
Vice President Joe Biden, who is leading the
White House effort to formulate new proposals
to reduce gun violence, gets mixed ratings from
the public: 42% have a favorable impression of
him, 42% unfavorable. This is virtually
unchanged since late October on the eve of the
election (44% favorable, 42% unfavorable).
Views of Biden are deeply divided along
partisan lines – 77% of Republicans have an
unfavorable opinion of him, while 75% of
Democrats have a favorable opinion. Biden is
viewed unfavorably by 63% of people who say
the priority should be protecting the rights of
gun owners, and favorably by 60% of those
who prioritize controlling gun ownership.
Neither Party Has Advantage on Gun Control
Which party could do a better job of reflecting your views about gun control?
Rep Party
Dem Party
Both/ Neither
(vol) DK
% % % %
January 2013 38 40 11 11=100
December 2012* 27 28 27 18=100
July 2004 34 36 9 21=100
April 2000 30 36 11 23=100
June 1999 34 42 12 12=100
December 1993 32 42 8 18=100
Jan 2013 among…
Gun owner
Yes 51 29 9 12=100
No 29 48 12 10=100
Policy priority
Gun rights 61 17 11 10=100
Gun control 21 60 10 10=100
PEW RESEARCH CENTER Jan. 9-13, 2013. Q34l. *Asked as a stand-alone item in Dec. 12. Figures may not add to 100% because of rounding.
Divided Views of Joe Biden
Favor-able
Unfav-orable
Other/ DK
% % %
Total 42 42 16=100
Republican 13 77 10=100
Democrat 75 14 12=100
Independent 36 42 22=100
Gun owner
Yes 29 60 11=100
No 52 29 19=100
Policy priority
Gun rights 23 63 14=100
Gun control 60 23 17=100
PEW RESEARCH CENTER Jan 9-13, 2013. Q17g. Figures may not add to 100% because of rounding.
8
www.people-press.org
About the Survey The analysis in this report is based on telephone interviews conducted January 9-13, 2013 among a national sample of 1,502 adults, 18 years of age or older, living in all 50 U.S. states and the District of Columbia (752 respondents were interviewed on a landline telephone, and 750 were interviewed on a cell phone, including 369 who had no landline telephone). The survey was conducted by interviewers at Princeton Data Source under the direction of Princeton Survey Research Associates International. A combination of landline and cell phone random digit dial samples were used; both samples were provided by Survey Sampling International. Interviews were conducted in English and Spanish. Respondents in the landline sample were selected by randomly asking for the youngest adult male or female who is now at home. Interviews in the cell sample were conducted with the person who answered the phone, if that person was an adult 18 years of age or older. The combined landline and cell phone sample are weighted using an iterative technique that matches gender, age, education, race, Hispanic origin and nativity and region to parameters from the 2011 Census Bureau's American Community Survey and population density to parameters from the Decennial Census. The sample also is weighted to match current patterns of telephone status and relative usage of landline and cell phones (for those with both), based on extrapolations from the 2012 National Health Interview Survey. The weighting procedure also accounts for the fact that respondents with both landline and cell phones have a greater probability of being included in the combined sample and adjusts for household size among respondents with a landline phone. Sampling errors and statistical tests of significance take into account the effect of weighting. The following table shows the sample sizes and the error attributable to sampling that would be expected at the 95% level of confidence for different groups in the survey:
Group Unweighted sample size Plus or minus…
Total sample 1,502 2.9 percentage points
Form 1 727 4.2 percentage points
Form 2 775 4.1 percentage points
Men 725 4.2 percentage points
Women 777 4.1 percentage points
Republicans 403 5.7 percentage points
Democrats 473 5.2 percentage points
Independents 557 4.8 percentage points
Gun in household 529 5.0 percentage points
No gun in household 867 3.9 percentage points
Note that the individual gun policy questions on this survey (Q42) were each asked only of about half of respondents (one form); as a result, the margin of error for those questions is about double than for questions asked of the entire sample. Sample sizes and sampling errors for other subgroups are available upon request. In addition to sampling error, one should bear in mind that question wording and practical difficulties in conducting surveys can introduce error or bias into the findings of opinion polls.
Pew Research Center for the People & the Press, Jan 9-13, 2013
Q.40 What do you think is more important—to protect the right of Americans to own guns, or to control gun ownership?
July 2012 December 2012 January 2013
Protect right to own guns
Control ownership
Protect right to own guns
Control ownership
Protect right to own guns
Control ownership
Jan N
% % % % % %
Total 46 47 42 49 45 51 1502
Men 57 38 51 41 51 44 725
Women 37 56 33 57 38 57 777
18-29 37 55 36 55 39 59 229
30-49 51 45 48 42 48 47 400
50-64 45 50 44 50 44 51 455
65+ 48 42 34 54 45 47 391
Men 18-49 53 41 53 38 52 44 349
Women 18-49 39 56 33 58 37 59 280
Men 50+ 61 34 48 46 51 44 368
Women 50+ 33 58 34 55 39 55 478
White, non-Hispanic 56 38 51 42 53 42 1087
Black, non-Hispanic 23 73 24 68 24 66 127
Hispanic -- -- -- -- 27 72 142
White men 67 27 62 32 63 34 504
White women 37 56 40 51 45 50 583
College grad+ 43 50 35 55 39 55 574
Some college 51 43 49 47 52 45 429
HS or less 45 48 42 47 43 52 496
Republican 71 26 69 27 70 27 403
Democrat 21 72 20 72 22 73 473
Independent 50 43 47 42 49 47 557
Conservative Rep -- -- 72 24 74 23 287
Mod/Lib Rep -- -- -- -- 60 38 108
Cons/Mod Dem -- -- 23 68 25 70 273
Liberal Dem -- -- 14 79 15 81 186
Among Republicans...
Republican men 76 23 75 23 71 28 194
Republican women 66 30 63 31 69 27 209
Among Democrats…
Democratic men 28 66 22 66 26 71 190
Democratic women 17 76 18 76 20 75 283
Among independents…
Independent men 61 34 58 33 58 38 309
Independent women 38 55 33 52 36 60 248
10
www.people-press.org
Attitudes About Gun Control Cont…
Pew Research Center for the People & the Press, Jan 9-13, 2013
Q.40 What do you think is more important—to protect the right of Americans to own guns, or to control gun ownership?
July 2012 December 2012 January 2013
Protect right to own guns
Control ownership
Protect right to own guns
Control ownership
Protect right to own guns
Control ownership
Jan N
% % % % % %
Parents 48 48 45 47 46 51 357
Non-parents 46 47 40 50 44 51 1140
Urban 37 57 35 56 37 57 493
Suburban 48 45 43 47 44 51 700
Rural 61 30 52 39 60 37 307
Northeast 32 59 29 65 38 56 269
Midwest 46 47 45 45 48 48 333
South 53 43 48 44 47 49 546
West 48 46 40 48 43 53 354
11
www.people-press.org
PEW RESEARCH CENTER FOR THE PEOPLE & THE PRESS JANUARY 2013 POLITICAL SURVEY
FINAL TOPLINE January 9-13, 2013
N=1,502
QUESTIONS 1-2, 9-12, 16 HELD FOR FUTURE RELEASE NO QUESTIONS 3-8, 14-15 ASK ALL: Q.17 And is your overall opinion of [INSERT NAME; RANDOMIZE; OBSERVE FORM SPLITS] very
favorable, mostly favorable, mostly UNfavorable, or very unfavorable? How about [NEXT NAME]? [IF NECESSARY: Just in general, is your overall opinion of [NAME] very favorable, mostly favorable, mostly UNfavorable, or very unfavorable?] [INTERVIEWERS: PROBE TO DISTINGUISH BETWEEN “NEVER HEARD OF” AND “CAN’T RATE.”]
QUESTIONS 17a-17f.F1 AND 17h.F2-17j.F2 HELD FOR FUTURE RELEASE
(VOL.) (VOL.) -------Favorable------- ------Unfavorable------ Never Can’t Total Very Mostly Total Very Mostly heard of rate/Ref ASK FORM 2 ONLY [N=775]: g.F2 Joe Biden Jan 9-13, 2013 42 14 28 42 20 21 8 8 Oct 24-28, 2012 44 17 27 42 26 16 5 10 Oct 4-7, 2012 38 13 24 46 26 21 5 11 Sep 12-16, 2012 41 15 26 43 22 21 4 11 Jun 7-17, 2012 40 10 30 37 18 19 6 17 Jan 11-16, 2012 38 10 28 41 18 22 9 12
QUESTIONS 18, 20-25, 30, 31-32 HELD FOR FUTURE RELEASE NO QUESTIONS 19, 26-29, 33 Thinking about some issues… ASK ALL: Q.34 Which party could do a better job of [INSERT FIRST ITEM; RANDOMIZE; OBSERVE FORM
SPLITS]? How about [NEXT ITEM]? [IF NECESSARY: Which party could do a better job of ITEM?]
QUESTIONS 34aF1-34jF2 HELD FOR FUTURE RELEASE (VOL.) Republican Democratic Both (VOL.) (VOL.)
Party Party equally Neither DK/Ref ASK ALL: l. Reflecting your views about gun control Jan 9-13, 2013 38 40 5 6 11 Dec 17-19, 20121 27 28 12 15 18 July, 2004 34 36 3 6 21
1 In December 2012 and earlier, asked as a stand alone question.
12
www.people-press.org
Q.34 CONTINUED… (VOL.) Republican Democratic Both (VOL.) (VOL.) Party Party equally Neither DK/Ref June, 1999 34 42 4 8 12 December, 1993 32 42 0 8 18
QUESTIONS 35-36 HELD FOR FUTURE RELEASE NO QUESTIONS 37-39 ASK ALL: On a different subject … Q.40 What do you think is more important – to protect the right of Americans to own guns, OR to control
gun ownership? IF OPINION GIVEN (Q.40=1,2) ASK: Q.41 Do you feel strongly about that, or not?
ASK ALL: Q.42 Please tell me if you would favor or oppose the following proposals about gun policy. First, [INSERT
ITEM; RANDOMIZE; OBSERVE FORM SPLITS]? What about [NEXT ITEM]? [IF NECESSARY: Would you favor or oppose [ITEM]?]
(VOL.) Favor Oppose DK/Ref ASK FORM 1 ONLY [N=727]: a.F1 A ban on semi-automatic weapons Jan 9-13, 2013 58 39 3 b.F1 A ban on the sale of ammunition online
Jan 9-13, 2013 53 44 3 c.F1 Putting armed security guards or police in more schools Jan 9-13, 2013 64 32 4
Protect the right of Americans to own guns
Control gun ownership
Net Strongly Not
strongly (VOL.) DK/Ref
Net Strongly
Not strongly
(VOL.) DK/Ref
(VOL.)DK/Ref
Jan 9-13, 2013 45 39 5 * 51 41 9 * 5
Dec 17-19, 2012 42 37 4 * 49 42 6 2 9
July 26-29, 2012 46 -- -- -- 47 -- -- -- 6
Apr 4-15, 2012 49 -- -- -- 45 -- -- -- 6
Sep 22-Oct 4, 2011 47 -- -- -- 49 -- -- -- 5
Feb 22-Mar 1, 2011 48 -- -- -- 47 -- -- -- 6
Jan 13-16, 2011 49 -- -- -- 46 -- -- -- 6
Aug 25-Sep 6, 2010 46 -- -- -- 50 -- -- -- 4
Mar 10-14, 2010 46 -- -- -- 46 -- -- -- 7
Mar 31-Apr 21, 2009 45 -- -- -- 49 -- -- -- 6
April, 2008 37 -- -- -- 58 -- -- -- 5
November, 2007 42 -- -- -- 55 -- -- -- 3
April, 2007 32 -- -- -- 60 -- -- -- 8
February, 2004 37 31 6 * 58 46 11 1 5
June, 2003 42 -- -- -- 54 -- -- -- 4
May, 2000 38 -- -- -- 57 -- -- -- 5
April, 2000 37 -- -- -- 55 -- -- -- 8
March, 2000 29 -- -- -- 66 -- -- -- 5
June, 1999 33 -- -- -- 62 -- -- -- 5
May, 1999 30 -- -- -- 65 -- -- -- 5
December, 1993 34 -- -- -- 57 -- -- -- 9
13
www.people-press.org
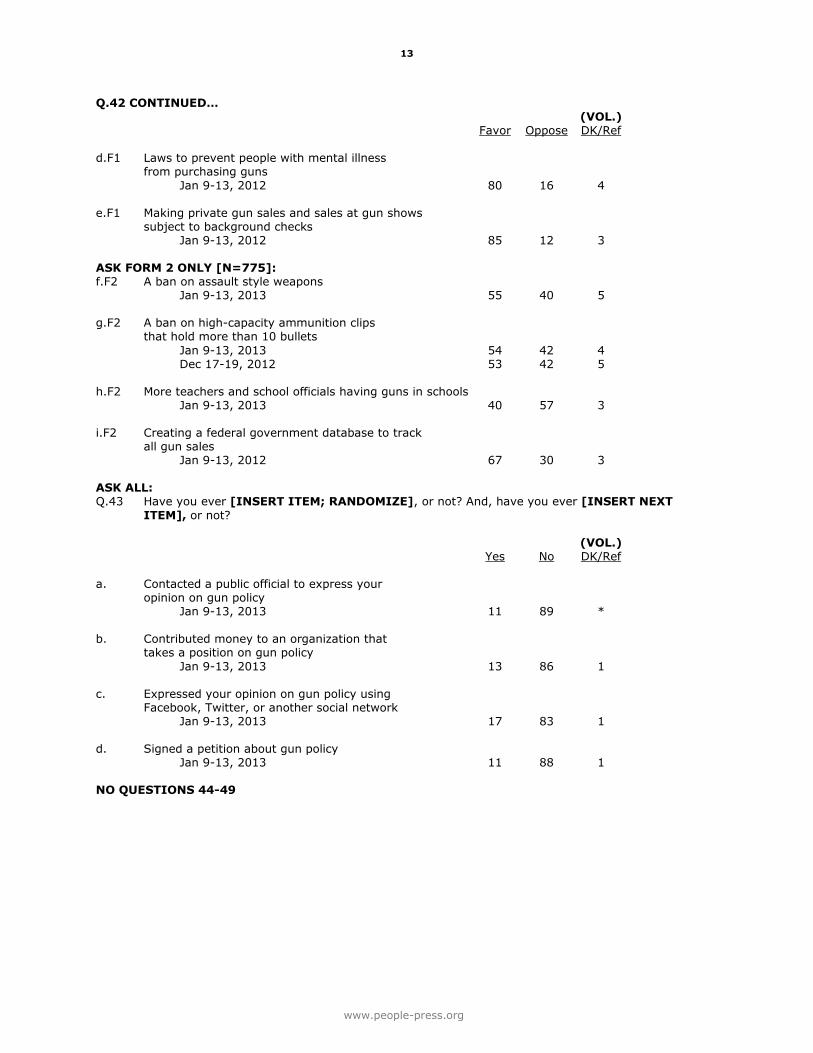
Q.42 CONTINUED… (VOL.) Favor Oppose DK/Ref d.F1 Laws to prevent people with mental illness from purchasing guns
Jan 9-13, 2012 80 16 4 e.F1 Making private gun sales and sales at gun shows subject to background checks Jan 9-13, 2012 85 12 3 ASK FORM 2 ONLY [N=775]: f.F2 A ban on assault style weapons Jan 9-13, 2013 55 40 5 g.F2 A ban on high-capacity ammunition clips that hold more than 10 bullets
Jan 9-13, 2013 54 42 4 Dec 17-19, 2012 53 42 5 h.F2 More teachers and school officials having guns in schools Jan 9-13, 2013 40 57 3 i.F2 Creating a federal government database to track all gun sales Jan 9-13, 2012 67 30 3 ASK ALL: Q.43 Have you ever [INSERT ITEM; RANDOMIZE], or not? And, have you ever [INSERT NEXT
ITEM], or not? (VOL.) Yes No DK/Ref a. Contacted a public official to express your opinion on gun policy Jan 9-13, 2013 11 89 * b. Contributed money to an organization that takes a position on gun policy
Jan 9-13, 2013 13 86 1 c. Expressed your opinion on gun policy using Facebook, Twitter, or another social network Jan 9-13, 2013 17 83 1 d. Signed a petition about gun policy Jan 9-13, 2013 11 88 1 NO QUESTIONS 44-49
14
www.people-press.org
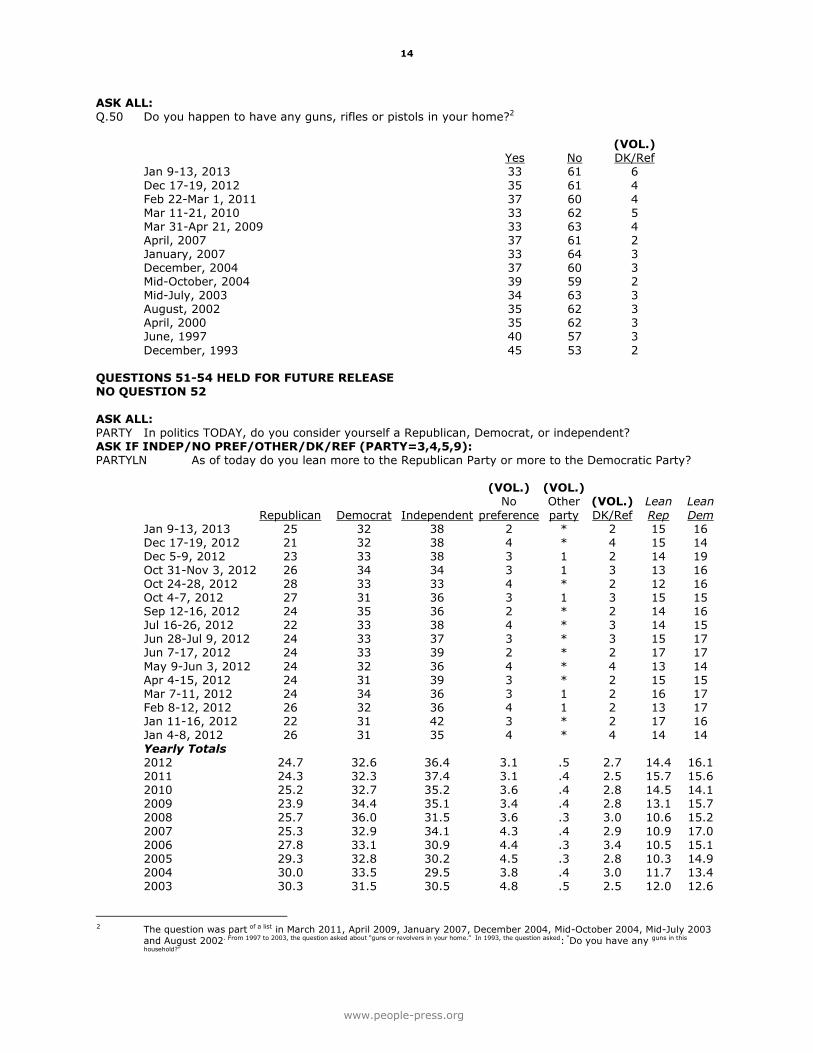
ASK ALL: Q.50 Do you happen to have any guns, rifles or pistols in your home?2 (VOL.) Yes No DK/Ref Jan 9-13, 2013 33 61 6
December, 1993 45 53 2 QUESTIONS 51-54 HELD FOR FUTURE RELEASE NO QUESTION 52 ASK ALL: PARTY In politics TODAY, do you consider yourself a Republican, Democrat, or independent? ASK IF INDEP/NO PREF/OTHER/DK/REF (PARTY=3,4,5,9): PARTYLN As of today do you lean more to the Republican Party or more to the Democratic Party? (VOL.) (VOL.) No Other (VOL.) Lean Lean
2 The question was part of a list in March 2011, April 2009, January 2007, December 2004, Mid-October 2004, Mid-July 2003
and August 2002. From 1997 to 2003, the question asked about “guns or revolvers in your home.” In 1993, the question asked: “Do you have any guns in this
household?”
15
www.people-press.org
PARTY/PARTYLN CONTINUED… (VOL.) (VOL.) No Other (VOL.) Lean Lean Republican Democrat Independent preference party DK/Ref Rep Dem 2002 30.4 31.4 29.8 5.0 .7 2.7 12.4 11.6 2001 29.0 33.2 29.5 5.2 .6 2.6 11.9 11.6