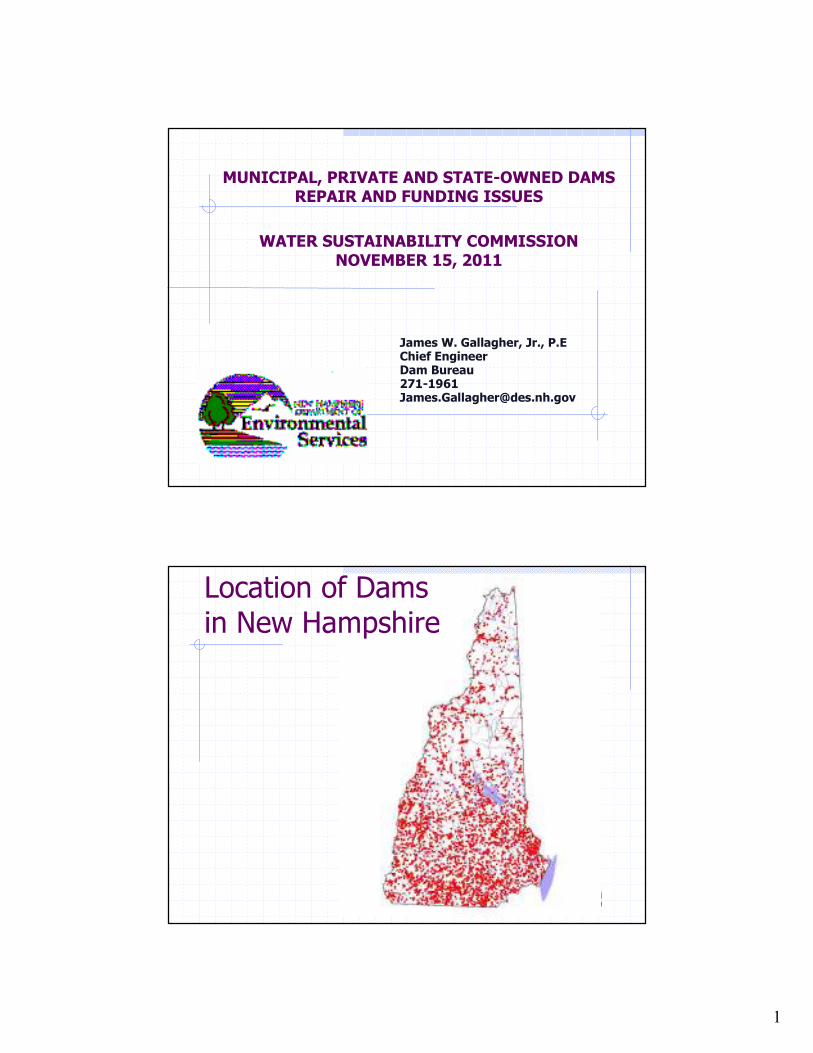
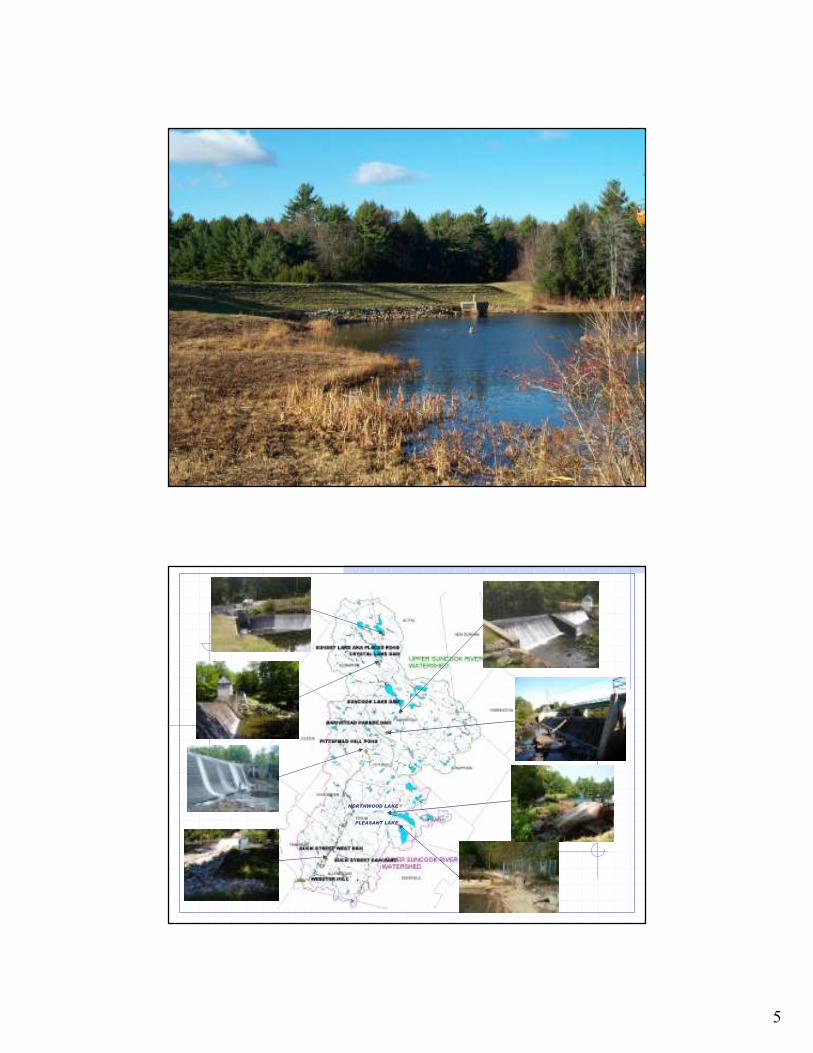
1
James W. Gallagher, Jr., P.EChief EngineerDam [email protected]
MUNICIPAL, PRIVATE AND STATE-OWNED DAMSREPAIR AND FUNDING ISSUES
WATER SUSTAINABILITY COMMISSIONNOVEMBER 15, 2011
Location of Damsin New Hampshire
2
Municipal
12.7%
Private
76.8%
Federal
1.3%Utility
0.4%State
8.8%
Dam Ownership in New Hampshire
Recreation
47%
Water Supply
2%
Mill
1%
Sewer Lagoon
2%
Hydropower
4%
Flood Control
1%
Cons./Agriculture
25%
Stormwater
Detention
10%
Fire Protection
8%
Functions of Dams in New Hampshire
6
CRITICAL INFRASTRUCTURE IN NEW HAMPSHIRE'S DAM SECTOR
TIER I DAMS
DAM POPULATION AT RISK POWER WATER SUPPLY
NO. HOUSES STATE ROADS TOWN ROADS CAPACITY (KW) ENERGY (MWH) POPULATION SERVED
140.17 MOORE RESERVOIR DAM TRANSCANADA HYDRO NORTHEAST LITTLETON Pow er 4,370 190,000 302,600 N/A
162.01 COMERFORD STORAGE DAM TRANSCANADA HYDRO NORTHEAST MONROE Pow er 2,185 140,400 344,800 N/A
194.12 MURPHY DAM AKA LAKE FRANCIS NH DES WATER DIVISION PITTSBURG Multi-Purpose 1,058 21 161 N/A N/A N/A
134.15 WILDER DAM TRANSCANADA HYDRO NORTHEAST LEBANON Pow er 1,017 150 11 35,600 170,400 N/A
209.05 ARLINGTON MILLS RES WHEELER DAM TOWN OF SALEM SALEM Water Supply 862 14 42 N/A N/A 18,000
150.06 MASSABESIC LAKE DAM MANCHESTER WATER WORKS MANCHESTER Water Supply 126 6 20 N/A N/A 133,000
13.01 TOWER HILL POND DAM MANCHESTER WATER WORKS AUBURN Water Supply 28 4 30 N/A N/A 133,000
165.04 BOWERS DAM PENNICHUCK WATER WORKS INC NASHUA Water Supply 8 2 8 N/A N/A 90,000
165.05 HARRIS POND DAM PENNICHUCK WATER WORKS INC NASHUA Water Supply 4 0 4 N/A N/A 90,000
165.06 SUPPLY POND DAM PENNICHUCK WATER WORKS INC NASHUA Water Supply 3 0 3 N/A N/A 90,000
TIER II DAMS
DAM POPULATION AT RISK POWER WATER SUPPLY
NO. HOUSES STATE ROADS TOWN ROADS CAPACITY (KW) ENERGY (MWH) POPULATION SERVED
51.13 PENACOOK LAKE DAM CITY OF CONCORD CONCORD Water Supply 33 1 4 N/A N/A 43,000
148.13 BELLAMY RESERVOIR DAM CITY OF PORTSMOUTH PUBLIC WORKS DEPT MADBURY Water Supply 128 4 18 N/A N/A 33,000
206.01 WOODWARD POND DAM CITY OF KEENE PUBLIC WORKS DEPT ROXBURY Water Supply N/A N/A 25,000
206.03 BABBIDGE RESERVOIR DAM CITY OF KEENE PUBLIC WORKS DEPT ROXBURY Water Supply N/A N/A 25,000
82.02 EXETER RESERVOIR DAM TOWN OF EXETER PUBLIC WORKS EXETER Water Supply 7 1 1 N/A N/A 11,000
47.14 RICE RESERVOIR DAM CITY OF CLAREMONT CLAREMONT Water Supply 35 10 2 N/A N/A 9,000
47.30 WHITEWATER BROOK DAM CITY OF CLAREMONT CLAREMONT Water Supply 92 2 20 N/A N/A 9,000
108.05 LOWER RESERVOIR DAM HANOVER WATER WORKS CO HANOVER Water Supply 1 1 2 N/A N/A 8,500
108.06 UPPER RESERVOIR DAM HANOVER WATER WORKS CO HANOVER Water Supply 3 0 4 N/A N/A 8,500
108.14 HANOVER CENTER RESERVOIR DAM HANOVER WATER WORKS CO HANOVER Water Supply 27 0 8 N/A N/A 8,500
117.01 VERNON DAM TRANSCANADA HYDRO NORTHEAST HINSDALE Pow er 28,000 122,300 N/A
150.01 AMOSKEAG DAM PSNH MANCHESTER Pow er 16,000 83,000 N/A
24.04 SMITH DAM PSNH BERLIN Pow er 18 0 3 13,000 104,261 N/A
27.12 GARVINS FALLS DAM PSNH BOW Pow er 53 1 18 12,100 53,000 N/A
162.02 MCINDOES RESERVOIR DAM TRANSCANADA HYDRO NORTHEAST MONROE Pow er 10,560 51,000 N/A
93.01 GREGG FALLS DAM NH DES WATER DIVISION GOFFSTOWN Pow er 258 2 32 3,820 8,733 N/A
116.04 JACKMAN RESERVOIR DAM PSNH HILLSBOROUGHPow er 163 2 22 3,200 9,340 N/A
121.19 HOPKINTON FLOOD CTRL DAM US ARMY CORP OF ENGINEERS HOPKINTON Flood Control 262 3 44 N/A N/A N/A
DAM NAME OW NER TOW N PURPOSE
OW NERDAM NAME TOW N PURPOSE
7
Hazard Classification of Damsin New Hampshire
2,615TOTAL
1,773Non-Menace
544Low Hazard
164Significant Hazard
134High Hazard
8
Emergency Action Plans Inundation Mapping
16
More than 26,000 houses
More than 560 State Road Crossings
More than 2,500 Town Road Crossings
Population At Risk Downstream ofHigh and Significant Hazard DamsIn New Hampshire
9
Periodic Inspection Schedule
14975 yrs485Low
7492 yrs147Significant
14991 yrs99High
Scheduled Inspections Per Month
Scheduled Inspections Per Year
Inspection interval
Number of Structures
Hazard Potential
Classification
7 month average inspection year, May through November
2011 Report Card
C-Dams
10
2011 Report Card
Growing and aging inventory of dams
Increased number of deficiencies
Lack of resources to maintain private and municipally-owned dams
Outstanding Letters of Deficiency
9383TOTAL
7833Low
Hazard
1427Significant Hazard
1923High Hazard
PrivateMunicipal
11
ESTIMATE OF NEEDS
Approximately 50% of dams with outstanding letters of deficiency require major structural reconstruction
Per project cost estimate = $750k
SUMMARY OFDAM INFRASTRUCTURE NEEDSMUNICIPAL AND PRIVATELY-OWNED DAMS
$63,750,00085TOTAL
$33,750,00045Private
$30,000,00040Municipal
Estimated Total
Present Costs
Estimated No.
of ProjectsOwner
12
Chapter 272:5 Laws of 2008
Established Dam Maintenance Revolving
Loan Fund in RSA 482:5-a to provide low interest loans for repair of privately-owned dams.
No loans until fund balance >$25,000
DES must establish rules for disbursement and repayment of loans
13
DES River Restorationand Dam Removal Program
We assist� Dam owners
� General public
� Government agencies
� Consultants
Information about dam removal as an option
Help in obtaining funds to offset costs
Guidance throughout the permitting process
State Dams
Hazard Classification
HIGH SIG. LOW NM
DES 40 24 43 6 113
NHFG 4 7 45 46 102
DRED 2 3 9 14 28
DOT 0 4 3 16 23
UNH 1 1 0 2 4
Glencliff 0 0 0 2 2
Veterans Home 0 0 0 2 2
TOTAL 47 39 100 88 274
AGENCY TOTALS
14
Lake Winnipesaukee
Winnisquam Lake
Newfound Lake
Recreational Resources
Squam Lake
Ossipee Lake
Lake Sunapeee
28
More than 4,000 houses
More than 130 State Road Crossings
More than 800 Town Road Crossings
Population At Risk Downstream of State Owned High and Significant Hazard Dams
16
Dam Maintenance Crew
Recently Completed Projects
Pittsfield Mill
Big Bog Brook
Melvin Pope
DeeringReservoir
17
Dams in Need of Repair
Ossipee Dam, Effingham
Pawtuckaway Lake, Nottingham
Souhegan #15 Dam, Wilton
Seaver Dam, Harrisville
Mendums Dam, NottinghamPittsfield Mill Dam, Pittsfield
Leased Dams Pontook
Lakeport
Avery
Lochmere
Pittsfield
WatsonKelley Falls
Gregg Falls
Hadley Falls
Steels Pond
York
Squam Lake
18
Lease TermsPurchase
Power Rate
Dam Lease Terms Purchaser ($/kwh)
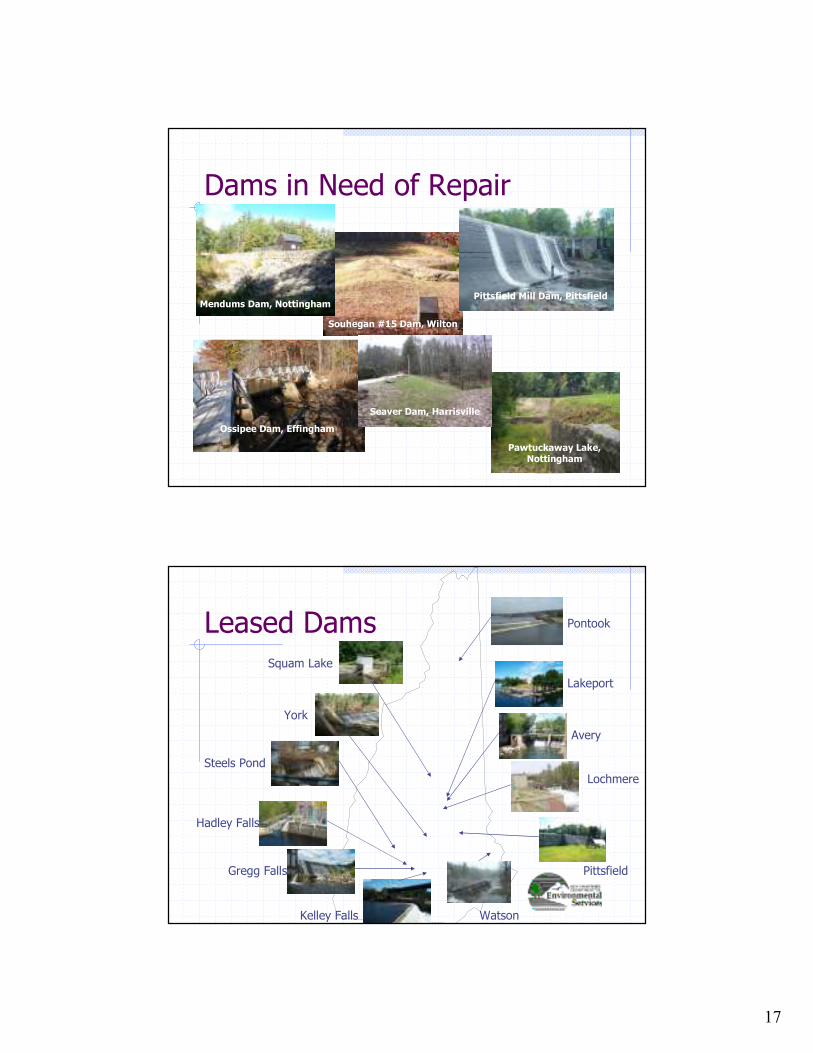
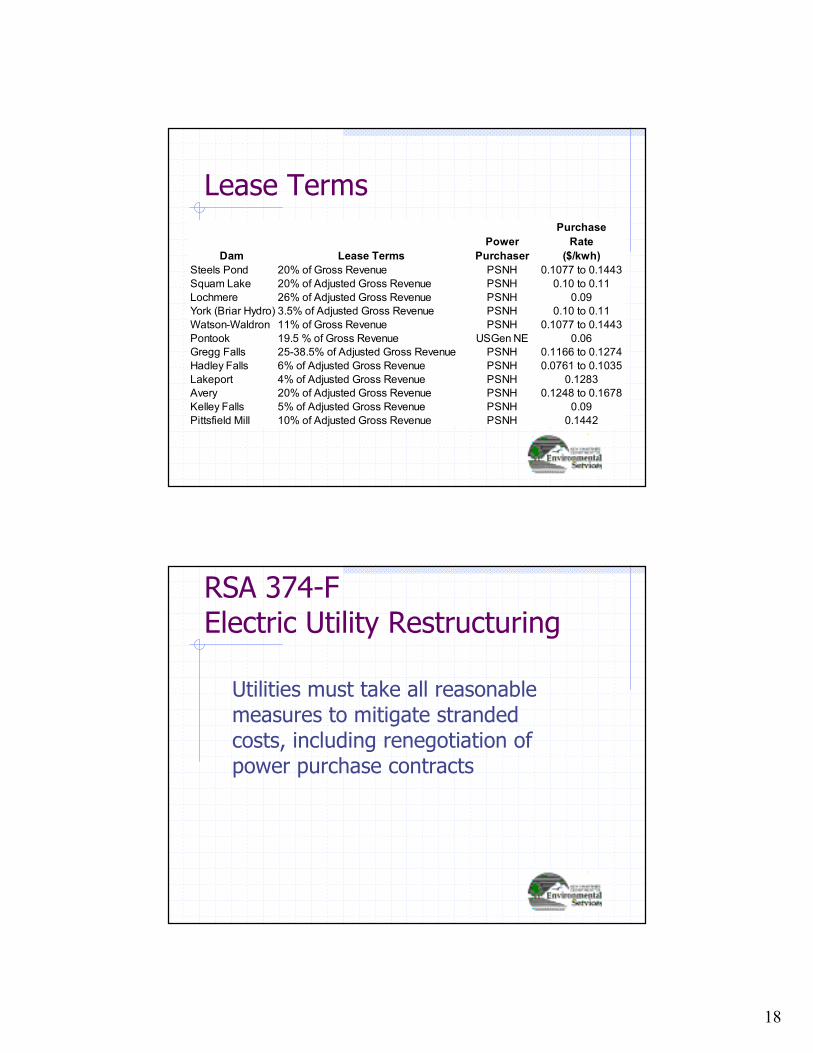
Steels Pond 20% of Gross Revenue PSNH 0.1077 to 0.1443
Squam Lake 20% of Adjusted Gross Revenue PSNH 0.10 to 0.11
Lochmere 26% of Adjusted Gross Revenue PSNH 0.09
York (Briar Hydro) 3.5% of Adjusted Gross Revenue PSNH 0.10 to 0.11
Watson-Waldron 11% of Gross Revenue PSNH 0.1077 to 0.1443
Pontook 19.5 % of Gross Revenue USGen NE 0.06
Gregg Falls 25-38.5% of Adjusted Gross Revenue PSNH 0.1166 to 0.1274
Hadley Falls 6% of Adjusted Gross Revenue PSNH 0.0761 to 0.1035
Lakeport 4% of Adjusted Gross Revenue PSNH 0.1283
Avery 20% of Adjusted Gross Revenue PSNH 0.1248 to 0.1678
Kelley Falls 5% of Adjusted Gross Revenue PSNH 0.09
Pittsfield Mill 10% of Adjusted Gross Revenue PSNH 0.1442
RSA 374-FElectric Utility Restructuring
Utilities must take all reasonable measures to mitigate stranded costs, including renegotiation of power purchase contracts
19
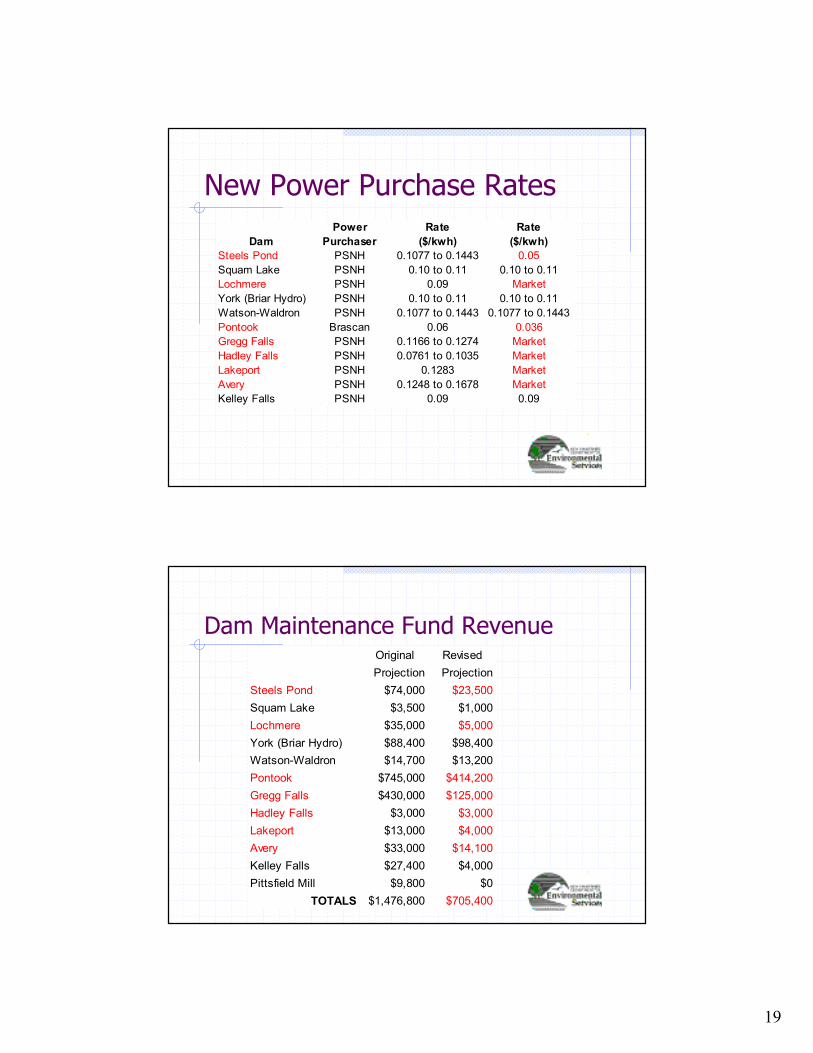
New Power Purchase RatesPower Rate Rate
Dam Purchaser ($/kwh) ($/kwh)
Steels Pond PSNH 0.1077 to 0.1443 0.05
Squam Lake PSNH 0.10 to 0.11 0.10 to 0.11
Lochmere PSNH 0.09 Market
York (Briar Hydro) PSNH 0.10 to 0.11 0.10 to 0.11
Watson-Waldron PSNH 0.1077 to 0.1443 0.1077 to 0.1443
Pontook Brascan 0.06 0.036
Gregg Falls PSNH 0.1166 to 0.1274 Market
Hadley Falls PSNH 0.0761 to 0.1035 Market
Lakeport PSNH 0.1283 Market
Avery PSNH 0.1248 to 0.1678 Market
Kelley Falls PSNH 0.09 0.09
Dam Maintenance Fund RevenueOriginal Revised
Projection Projection
Steels Pond $74,000 $23,500
Squam Lake $3,500 $1,000
Lochmere $35,000 $5,000
York (Briar Hydro) $88,400 $98,400
Watson-Waldron $14,700 $13,200
Pontook $745,000 $414,200
Gregg Falls $430,000 $125,000
Hadley Falls $3,000 $3,000
Lakeport $13,000 $4,000
Avery $33,000 $14,100
Kelley Falls $27,400 $4,000
Pittsfield Mill $9,800 $0
TOTALS $1,476,800 $705,400
20
State Legislative Actions
SB 488 committee to study the effects of electric utility restructuring on state dams and the alternatives for funding the operation and maintenance of state-owned dams
� Final Report submitted December 1, 2004
� Proposed recommendations for alternative funding sources
� Unrefunded gas tax
� Shoreland assessment fees
State Owned Dams in Need of Repair
Average capital cost is approximately $365,000 per project
48 dams, given the 6/yr. completion rate, results in meeting the identified dam infrastructure needs by the close of 2017
In reality, an additional demand of 3 to 5 dams can be expected to be added to the list of 48 each year – increasing the annual infrastructure funding need by over $2M