In-plane properties of composite laminates with through-thickness pin reinforcement Craig A. Steeves, Norman A. Fleck * Cambridge University, Engineering Department, Trumpington Street, Cambridge CB2 1PZ, UK Received 11 February 2005; received in revised form 18 May 2005 Available online 5 July 2005 Abstract Laminated fibre-reinforced composites can be reinforced by through-thickness pins to reduce their susceptibility to delamination. However, the presence of the pins creates resin pockets and disrupts the alignment of the fibres, and may thereby lead to a degradation of the in-plane strength of the composite. Experiments and numerical simulations show that the presence of through-thickness reinforcing pins decreases the tensile strength of the composite by 27%, and the compressive strength of the composite by at least 30%. It is also shown that the pattern in which the pins are inserted has a strong influence on the compressive strength. A pin pattern is identified in order to minimise fibre alignment disruption and thereby maximise the compressive strength. Ó 2005 Elsevier Ltd. All rights reserved. Keywords: Compression test; Scanning electron microscopy; Polymer matrix composites; Finite element analysis; Microbuckling 1. Introduction Laminated composites are notoriously susceptible to delamination. Through-thickness pins, known as Ôz-pinsÕ, have been proposed to increase delamination strength and toughness (Freitas et al., 1996). These pins are made from structural materials such as pultruded carbon fibre–epoxy composite, glass fibre com- posite or titanium alloy. The z-pins comprise rods inserted in the through-thickness direction (the ÔzÕ-direc- tion) of a laminated composite, and they serve to stitch the material together by a combination of friction and adhesion. The insertion process is as follows. Rods of diameter 0.1–1 mm are cut to a length of approx- imately 4 mm, with chamfered ends to improve the ease of insertion. They are inserted into a polymer foam 0020-7683/$ - see front matter Ó 2005 Elsevier Ltd. All rights reserved. doi:10.1016/j.ijsolstr.2005.05.017 * Corresponding author. Tel.: +44 1223 332650; fax: +44 1223 332662. E-mail address: [email protected](N.A. Fleck). International Journal of Solids and Structures 43 (2006) 3197–3212 www.elsevier.com/locate/ijsolstr
Transcript
International Journal of Solids and Structures 43 (2006) 3197–3212
www.elsevier.com/locate/ijsolstr
In-plane properties of composite laminates withthrough-thickness pin reinforcement
Craig A. Steeves, Norman A. Fleck *
Cambridge University, Engineering Department, Trumpington Street, Cambridge CB2 1PZ, UK
Received 11 February 2005; received in revised form 18 May 2005Available online 5 July 2005
Abstract
Laminated fibre-reinforced composites can be reinforced by through-thickness pins to reduce their susceptibility todelamination. However, the presence of the pins creates resin pockets and disrupts the alignment of the fibres, and maythereby lead to a degradation of the in-plane strength of the composite. Experiments and numerical simulations showthat the presence of through-thickness reinforcing pins decreases the tensile strength of the composite by 27%, and thecompressive strength of the composite by at least 30%. It is also shown that the pattern in which the pins are insertedhas a strong influence on the compressive strength. A pin pattern is identified in order to minimise fibre alignmentdisruption and thereby maximise the compressive strength.� 2005 Elsevier Ltd. All rights reserved.
Keywords: Compression test; Scanning electron microscopy; Polymer matrix composites; Finite element analysis; Microbuckling
1. Introduction
Laminated composites are notoriously susceptible to delamination. Through-thickness pins, known as�z-pins�, have been proposed to increase delamination strength and toughness (Freitas et al., 1996). Thesepins are made from structural materials such as pultruded carbon fibre–epoxy composite, glass fibre com-posite or titanium alloy. The z-pins comprise rods inserted in the through-thickness direction (the �z�-direc-tion) of a laminated composite, and they serve to stitch the material together by a combination of frictionand adhesion. The insertion process is as follows. Rods of diameter 0.1–1 mm are cut to a length of approx-imately 4 mm, with chamfered ends to improve the ease of insertion. They are inserted into a polymer foam
0020-7683/$ - see front matter � 2005 Elsevier Ltd. All rights reserved.doi:10.1016/j.ijsolstr.2005.05.017
3198 C.A. Steeves, N.A. Fleck / International Journal of Solids and Structures 43 (2006) 3197–3212
carrier and arranged in a square pattern. The foam carrier is then placed on one face of an uncured compos-ite laminate and an ultrasonic horn is used to drive the pins into the composite laminate. The laminate is aircooled in a freezer, allowing the excess pin material to be sheared off with a razor blade. Finally, the plate isautoclaved using the standard cure cycle for the composite laminate. This approach to through-thicknessreinforcement offers an alternative to stitching, and can provide much higher areal densities ofreinforcement.
A substantial literature exists on the mechanics of crack bridging by fibres. The Aveston–Cooper–Kelly(ACK) model, presented in Aveston and Kelly (1973), is an approximate elastic shear lag model for fibresreinforcing cracked ceramic materials. Budiansky et al. (1986) analysed the steady-state cracking strengthof a brittle matrix reinforced with long fibres, and Budiansky and Amazigo (1989) then extended this modelto the small-scale bridging of cracks in fibre-reinforced brittle materials. Mai and his co-workers (Shu andMai, 1993; Hu and Mai, 1993; Jain and Mai, 1995; Dransfield et al., 1998; Jain et al., 1998) considereddelamination-buckling of laminated composites with cracks opening in mixed mode. They used fracturemechanics concepts to predict the toughening due to crack bridging by both stitches and misaligned fibres.Cox (1999) developed a constitutive framework for a large-scale bridging model for a fibre or pin spanninga delamination crack opening in Mode II or in mixed mode. While this theory was developed for the stitch-ing of composites, his model can also be applied to the case of z-pins.
A small literature already exists on the enhancement of out-of-plane properties (such as delaminationtoughness) due to the presence of z-pins. Freitas et al. (1996) presented strength data on a proprietary brandof z-pins, called Z-Fibers.1 While they gave no quantitative information on the elevation in delaminationresistance imparted by z-pins, they suggested that some degradation of the in-plane properties will occur.Barrett (1996) performed axisymmetric and three-dimensional finite element analysis of the delaminationbehaviour of carbon fibre–epoxy z-pins in a carbon fibre–epoxy laminate, including the effects of thermalexpansion mismatch. Grassi et al. (2002) performed finite element computations of z-pinned reinforcedlaminates to determine in-plane moduli in tension and compression, and found that the knockdown inmodulus was 7–10%. An analytical model for delamination of composites reinforced with z-pins was devel-oped by Ratcliffe and O�Brien (2004). Cartie and Partridge (2005) carried out an experimental study on theimprovement in delamination resistance offered by z-pins. Using double cantilever beams to measure themode I delamination resistance, they found that z-pins gave a 6-fold to 25-fold increase in toughness asthe areal density of pins was increased from 1% to 2%. Similar elevations in toughness were noted for mixedmode loading. No systematic studies have been found, however, on the knockdown of in-plane propertiesdue to the presence of z-pins.
The current study examines the effect of z-pins upon the in-plane tensile and compressive stress versusstrain responses of composite laminates. It is anticipated that the insertion of z-pins into a fibre laminateleads to both local stress concentrations and to fibre waviness. In tension, some reduction in strength isexpected due to the stress concentrations. In compression, we expect that the stress concentrations andthe fibre waviness will lead to a reduced fibre microbuckling strength of the laminate (Fleck, 1997). Theexperiments performed in this study confirm these conjectures. Finite element simulations are also reportedfor fibre microbuckling, and they reveal that the observed compressive strengths are consistent with thedegree of as-manufactured fibre waviness.
2. Experimental procedure
The z-pins used in this study comprise pultruded composite rods of diameter 280 lm, made fromBMI carbon fibre and an epoxy matrix. The following sequence of tests were performed on z-pinned
1 Manufactured by Aztec Inc., 303 Bear Hill Road, Waltham, MA, 02154, USA.
C.A. Steeves, N.A. Fleck / International Journal of Solids and Structures 43 (2006) 3197–3212 3199
unidirectional T300/914C and IMS/924C carbon fibre–epoxy laminates of thickness 1.5 mm. First, speci-mens with pins present and with pins absent (�control specimens�) were tested in uniaxial tension to deter-mine the effect of z-pins upon tensile strength. Second, pinned and control specimens were tested in uniaxialcompression. Several z-pin configurations were used in the compression tests to explore the sensitivity ofcompressive strength to the geometric arrangement of pins. Third, z-pinned specimens were tested in uni-axial compression within the scanning electron microscope in order to observe the failure mechanisms.
2.1. Tensile tests
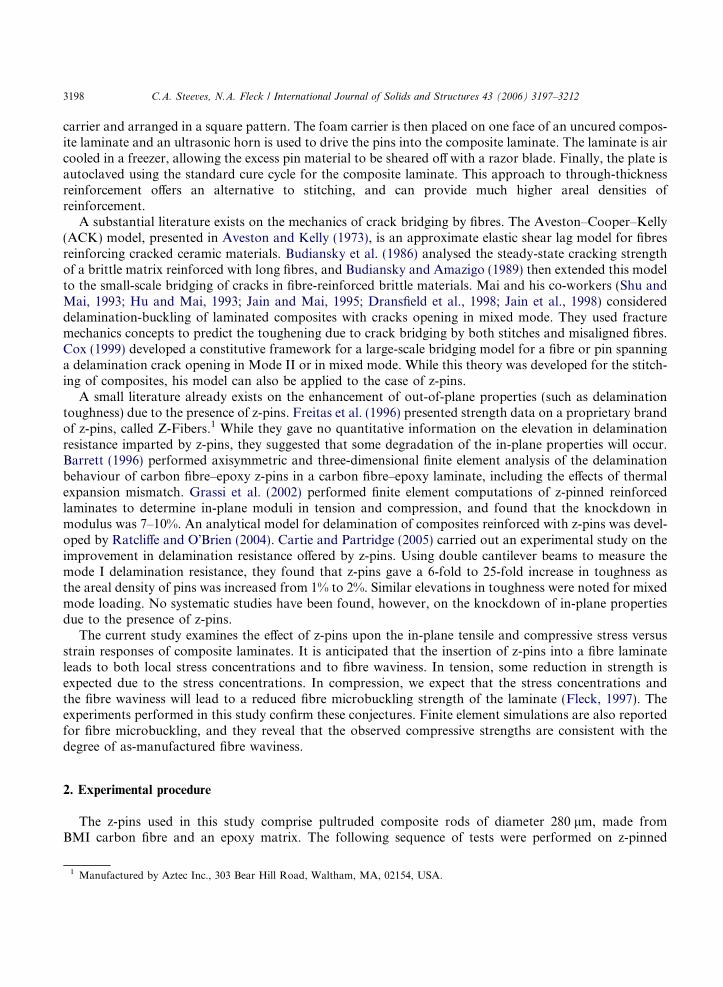
Unidirectional T300/914C laminates were reinforced with pultruded carbon-fibre/BMI rods of diameter280 lm in a square configuration. The rods were spaced 1.75 mm centre-to-centre, giving an areal pin den-sity of 2%. The principal directions of the pin arrangement were aligned with the specimen axes, such thatthe pin orientation angle is x = 0�, as defined in Fig. 1. All specimens were cut from the composite plateswith a diamond-grit saw and ground to a width of 10 mm. Aluminium tabs of length 65 mm and thickness1 mm were adhered to the specimens using Hexcel Redux 322 heat-cured epoxy sheet leaving a 50 mmgauge length. The recommended cure cycle was used: 1 h at 180 � C under pressure, with suitable heatingand cooling rates. The tensile specimens were loaded in displacement-control in a screw-driven test ma-chine, using an axial strain rate of 1.67 · 10�4 s�1. A clip gauge of gauge length 27.5 mm was attachedto the specimen in order to measure the average axial strain within the pinned region. The specimens wereloaded to failure, and both the load and average axial strain were logged at a sampling rate of 1 Hz.
2.2. Compression tests
Direct compression tests were performed on z-pinned specimens made from unidirectional T300/914Cand IMS/924C carbon fibre–epoxy laminates in order to determine the effect of z-pin arrangement uponthe in-plane compressive strength. The z-pins were arranged in a square configuration of spacing 3.5 mmor 1.75 mm at a pin orientation angle x in the range 0–45�, as defined in Fig. 1.
There are three groups of test specimens as shown in Table 1. The first group comprises the control andpinned specimens of the unidirectional IMS/924C composite. The second group contains the control andpinned specimens of unidirectional T300/914C composite. In this group, the pinned specimens possess onlya single row of three z-pins, aligned perpendicular to the axis of the specimen and placed at mid-length. Thethird group of specimens is also made from unidirectional T300/914C composite, but contains a grid ofapproximately 5 · 5 pins at an orientation of x = 0�, 23�, and 45�.
Fig. 1. Orientation of z-pin pattern. The orientation angle is x.
Table 1Summary of z-pinned compression specimens
Group Composite system Specimen set Pin spacing (mm) Orientation angle x (deg)
1 UD IMS/924C Control n/a n/aPinned 1.75 0
2 UD T300/914C Control n/a n/aOne row 3.5 0
3 UD T300/914C Control n/a n/a0� 1.75 023� 1.75 2345� 1.75 45
3200 C.A. Steeves, N.A. Fleck / International Journal of Solids and Structures 43 (2006) 3197–3212
The specimens of width 10 mm were cut from the composite laminates using a diamond-grit saw. Alu-minium tabs, of length 65 mm and thickness 1 mm, were adhered to both ends of the specimens for grip-ping, leaving a 10 mm gauge length. Except for two groups of unpinned control specimens, 120 X straingauges of length 1 mm were adhered in the axial direction to each face of the specimen, using cyanoacrylateadhesive. The strain gauges were coated with several layers of quick-drying liquid latex for protection, andwere used to monitor both the axial strain and the degree of unwanted bending.
Uniaxial compression tests were performed on the three groups of specimens of Table 1 using a Celanesetest rig. In this rig, a set of nested cones and cylinders grip the specimen with a pair of self-tightening jaws.The specimen is loaded by shear, eliminating the problem of end-brooming. The Celanese rig was placed ina screw-driven test machine, and the cross-head was displaced at a rate of 0.0083 mm s�1 until the specimenfailed, giving a strain rate of approximately 1 · 10�4 s�1. During each test, the load and strain gauges werelogged automatically on a PC-based data logger; the axial strain was taken as the mean of the readings onthe front and back face strain gauges. Videos were also taken of the gauge section in order to record thefailure mode.
2.3. In situ scanning electron microscopy
Compression tests, performed in situ within the scanning electron microscope (SEM), can provide qual-itative information about the nature of failure in the z-pinned specimens. The high stiffness of the test rigminimises the elastic energy stored within the test rig at peak load, and thereby minimises the degree ofdamage to the specimen post-peak load. This allows for the observation of damage evolution within thespecimen.
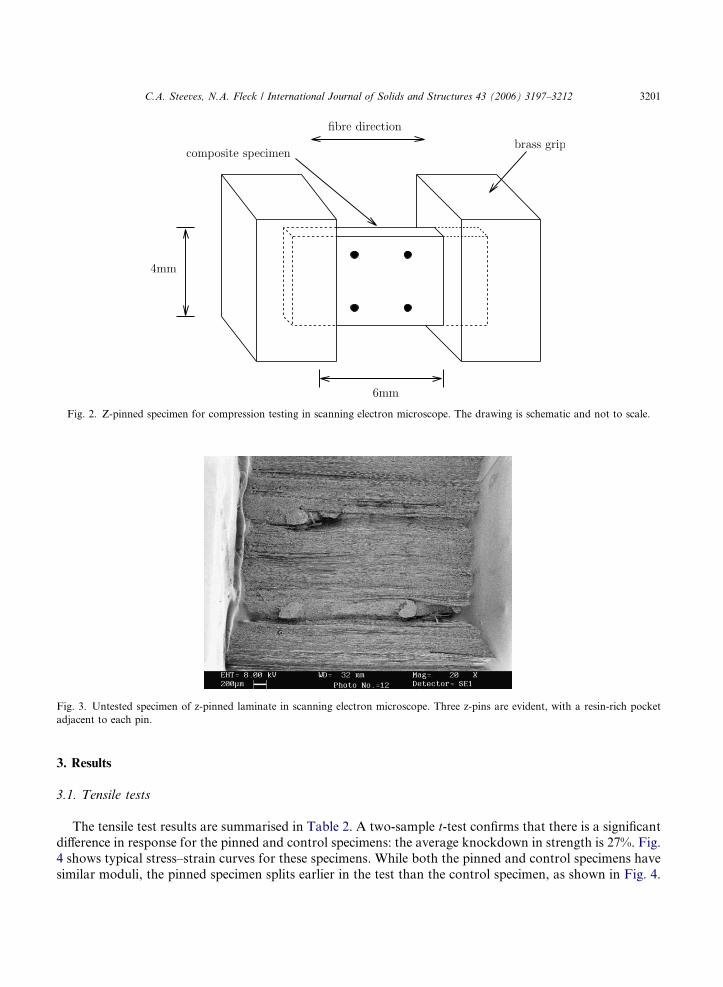
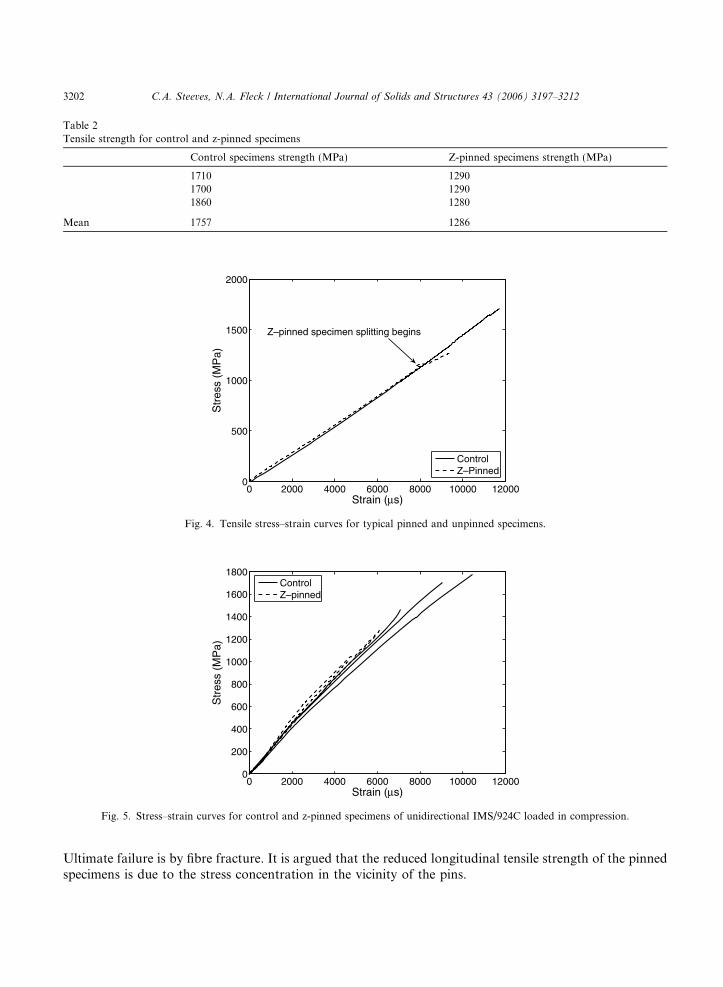
The geometry of the specimens used for compression tests in the scanning electron microscope is shownin Fig. 2. Specimens of length 10 mm, width 4 mm and thickness 0.75 mm were cut from plates of IMS/924C composite reinforced with 280 lm diameter z-pins of centre-to-centre spacing 1.75 mm. The endsof the specimen were potted into brass grips with epoxy adhesive, and the specimen and grips were thengold-coated. A typical specimen, prior to testing, is shown in Fig. 3. Three z-pins are clearly visible in thisspecimen, with fibre waviness in the vicinity of each pin; there should be a fourth z-pin in the top right handcorner of this image, but it is missing; this illustrates the irregularity of the as-manufactured specimens.
Specimens were loaded by a screw-driven compression rig in situ within the scanning electron micro-scope (SEM) at a displacement rate of approximately 0.0033 mm s�1, giving a compressive strain rate of5.5 · 10�4 s�1. Both video and still images were taken of the specimens as they were loaded to failure. Afterfailure the specimens were removed from the electron microscope, re-coated with gold, and were thenreturned to the electron microscope for further examination.
Fig. 2. Z-pinned specimen for compression testing in scanning electron microscope. The drawing is schematic and not to scale.
Fig. 3. Untested specimen of z-pinned laminate in scanning electron microscope. Three z-pins are evident, with a resin-rich pocketadjacent to each pin.
C.A. Steeves, N.A. Fleck / International Journal of Solids and Structures 43 (2006) 3197–3212 3201
3. Results
3.1. Tensile tests
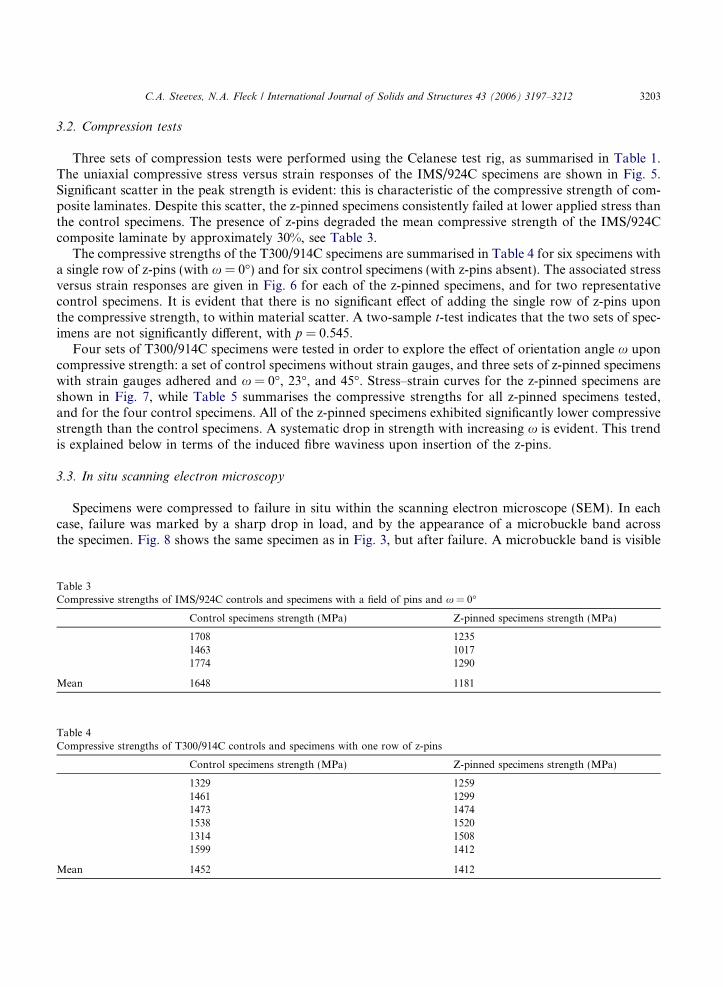
The tensile test results are summarised in Table 2. A two-sample t-test confirms that there is a significantdifference in response for the pinned and control specimens: the average knockdown in strength is 27%. Fig.4 shows typical stress–strain curves for these specimens. While both the pinned and control specimens havesimilar moduli, the pinned specimen splits earlier in the test than the control specimen, as shown in Fig. 4.
Table 2Tensile strength for control and z-pinned specimens
Control specimens strength (MPa) Z-pinned specimens strength (MPa)
1710 12901700 12901860 1280
Mean 1757 1286
0 2000 4000 6000 8000 10000 120000
500
1000
1500
2000
Strain (μs)
Str
ess
(MP
a)
Z–pinned specimen splitting begins
ControlZ–Pinned
Fig. 4. Tensile stress–strain curves for typical pinned and unpinned specimens.
0 2000 4000 6000 8000 10000 120000
200
400
600
800
1000
1200
1400
1600
1800
Strain (μs)
Str
ess
(MP
a)
ControlZ–pinned
Fig. 5. Stress–strain curves for control and z-pinned specimens of unidirectional IMS/924C loaded in compression.
3202 C.A. Steeves, N.A. Fleck / International Journal of Solids and Structures 43 (2006) 3197–3212
Ultimate failure is by fibre fracture. It is argued that the reduced longitudinal tensile strength of the pinnedspecimens is due to the stress concentration in the vicinity of the pins.
C.A. Steeves, N.A. Fleck / International Journal of Solids and Structures 43 (2006) 3197–3212 3203
3.2. Compression tests
Three sets of compression tests were performed using the Celanese test rig, as summarised in Table 1.The uniaxial compressive stress versus strain responses of the IMS/924C specimens are shown in Fig. 5.Significant scatter in the peak strength is evident: this is characteristic of the compressive strength of com-posite laminates. Despite this scatter, the z-pinned specimens consistently failed at lower applied stress thanthe control specimens. The presence of z-pins degraded the mean compressive strength of the IMS/924Ccomposite laminate by approximately 30%, see Table 3.
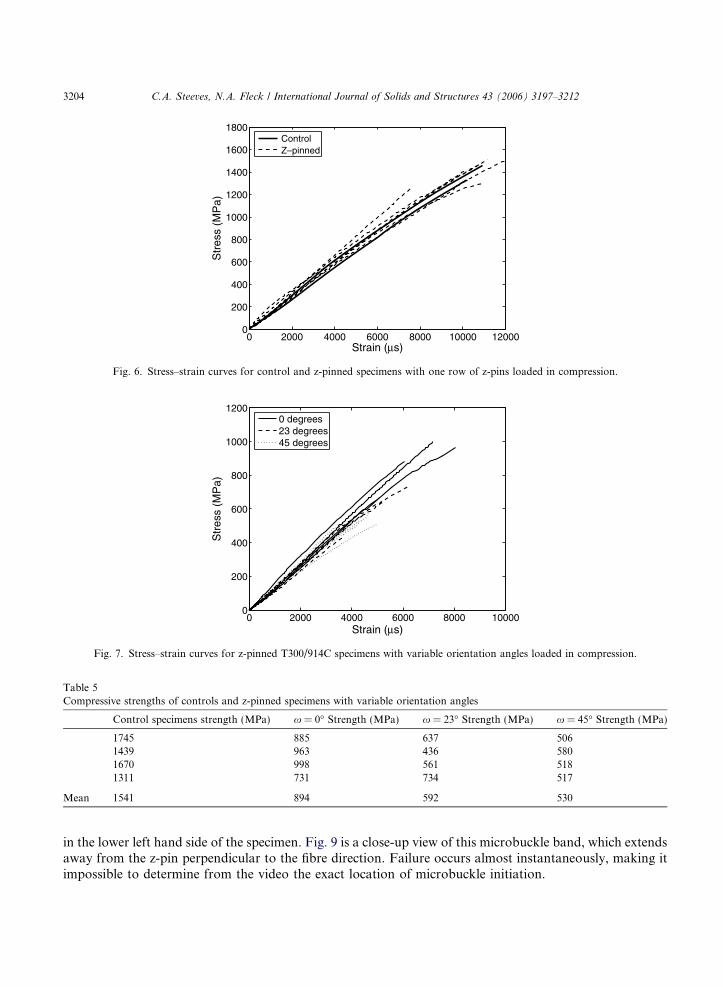
The compressive strengths of the T300/914C specimens are summarised in Table 4 for six specimens witha single row of z-pins (with x = 0�) and for six control specimens (with z-pins absent). The associated stressversus strain responses are given in Fig. 6 for each of the z-pinned specimens, and for two representativecontrol specimens. It is evident that there is no significant effect of adding the single row of z-pins uponthe compressive strength, to within material scatter. A two-sample t-test indicates that the two sets of spec-imens are not significantly different, with p = 0.545.
Four sets of T300/914C specimens were tested in order to explore the effect of orientation angle x uponcompressive strength: a set of control specimens without strain gauges, and three sets of z-pinned specimenswith strain gauges adhered and x = 0�, 23�, and 45�. Stress–strain curves for the z-pinned specimens areshown in Fig. 7, while Table 5 summarises the compressive strengths for all z-pinned specimens tested,and for the four control specimens. All of the z-pinned specimens exhibited significantly lower compressivestrength than the control specimens. A systematic drop in strength with increasing x is evident. This trendis explained below in terms of the induced fibre waviness upon insertion of the z-pins.
3.3. In situ scanning electron microscopy
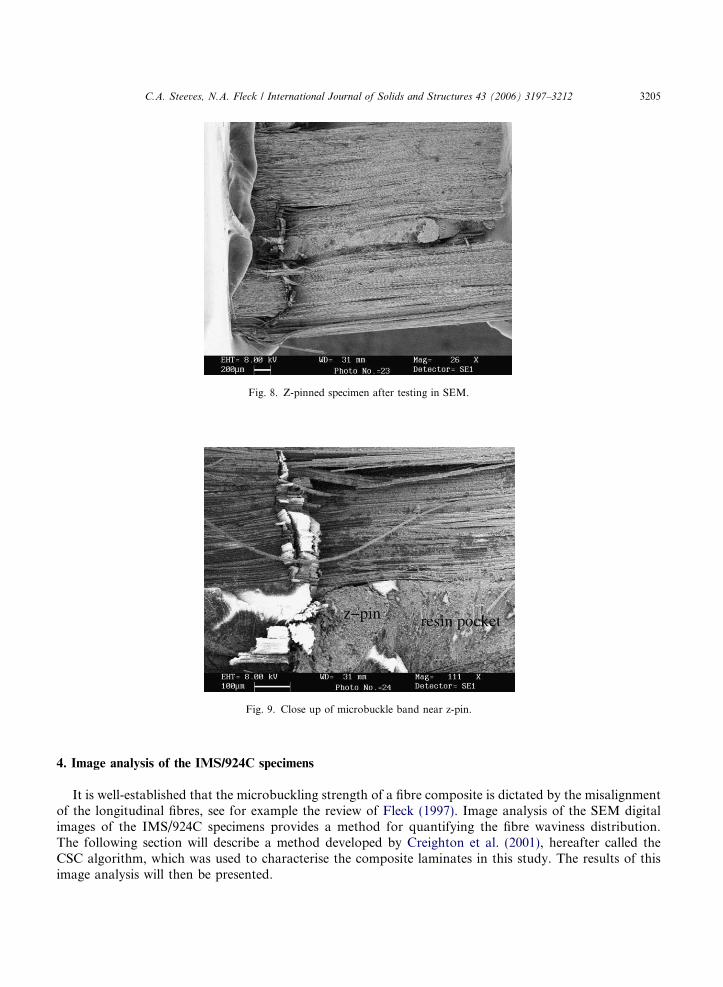
Specimens were compressed to failure in situ within the scanning electron microscope (SEM). In eachcase, failure was marked by a sharp drop in load, and by the appearance of a microbuckle band acrossthe specimen. Fig. 8 shows the same specimen as in Fig. 3, but after failure. A microbuckle band is visible
Table 3Compressive strengths of IMS/924C controls and specimens with a field of pins and x = 0�
Control specimens strength (MPa) Z-pinned specimens strength (MPa)
1708 12351463 10171774 1290
Mean 1648 1181
Table 4Compressive strengths of T300/914C controls and specimens with one row of z-pins
Control specimens strength (MPa) Z-pinned specimens strength (MPa)
3204 C.A. Steeves, N.A. Fleck / International Journal of Solids and Structures 43 (2006) 3197–3212
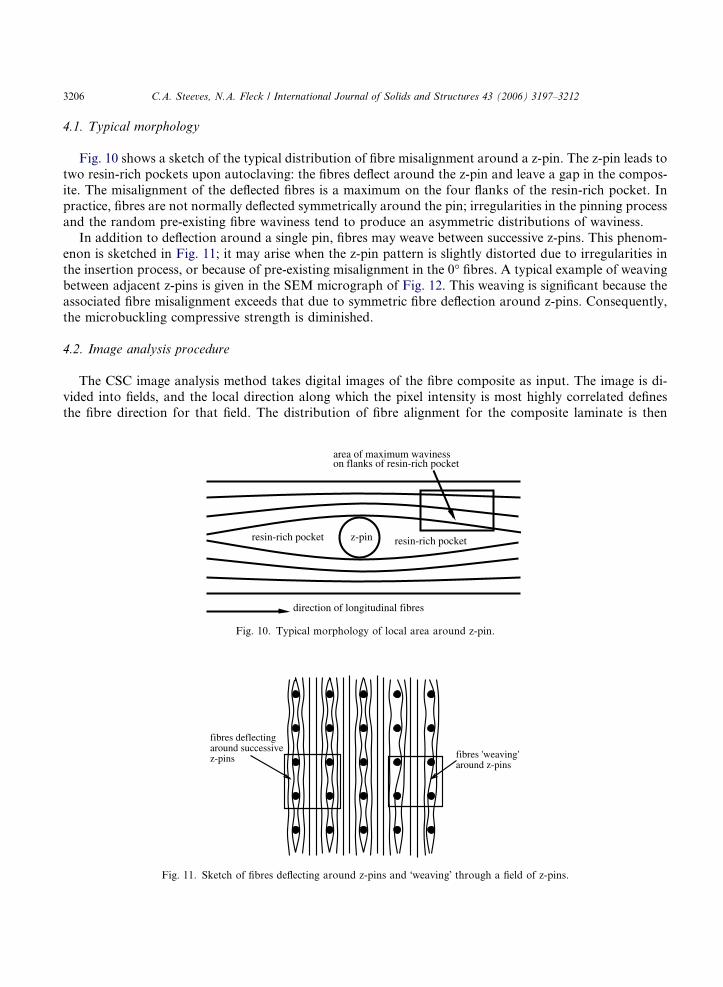
in the lower left hand side of the specimen. Fig. 9 is a close-up view of this microbuckle band, which extendsaway from the z-pin perpendicular to the fibre direction. Failure occurs almost instantaneously, making itimpossible to determine from the video the exact location of microbuckle initiation.
Fig. 8. Z-pinned specimen after testing in SEM.
Fig. 9. Close up of microbuckle band near z-pin.
C.A. Steeves, N.A. Fleck / International Journal of Solids and Structures 43 (2006) 3197–3212 3205
4. Image analysis of the IMS/924C specimens
It is well-established that the microbuckling strength of a fibre composite is dictated by the misalignmentof the longitudinal fibres, see for example the review of Fleck (1997). Image analysis of the SEM digitalimages of the IMS/924C specimens provides a method for quantifying the fibre waviness distribution.The following section will describe a method developed by Creighton et al. (2001), hereafter called theCSC algorithm, which was used to characterise the composite laminates in this study. The results of thisimage analysis will then be presented.
3206 C.A. Steeves, N.A. Fleck / International Journal of Solids and Structures 43 (2006) 3197–3212
4.1. Typical morphology
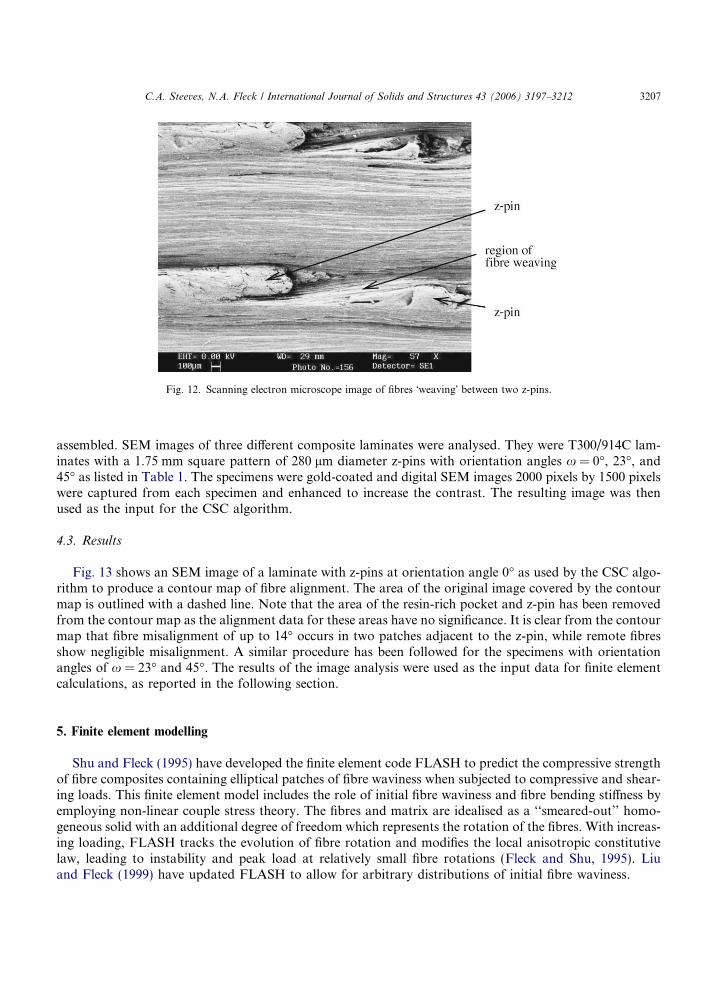
Fig. 10 shows a sketch of the typical distribution of fibre misalignment around a z-pin. The z-pin leads totwo resin-rich pockets upon autoclaving: the fibres deflect around the z-pin and leave a gap in the compos-ite. The misalignment of the deflected fibres is a maximum on the four flanks of the resin-rich pocket. Inpractice, fibres are not normally deflected symmetrically around the pin; irregularities in the pinning processand the random pre-existing fibre waviness tend to produce an asymmetric distributions of waviness.
In addition to deflection around a single pin, fibres may weave between successive z-pins. This phenom-enon is sketched in Fig. 11; it may arise when the z-pin pattern is slightly distorted due to irregularities inthe insertion process, or because of pre-existing misalignment in the 0� fibres. A typical example of weavingbetween adjacent z-pins is given in the SEM micrograph of Fig. 12. This weaving is significant because theassociated fibre misalignment exceeds that due to symmetric fibre deflection around z-pins. Consequently,the microbuckling compressive strength is diminished.
4.2. Image analysis procedure
The CSC image analysis method takes digital images of the fibre composite as input. The image is di-vided into fields, and the local direction along which the pixel intensity is most highly correlated definesthe fibre direction for that field. The distribution of fibre alignment for the composite laminate is then
area of maximum wavinesson flanks of resin-rich pocket
direction of longitudinal fibres
resin-rich pocket z-pin resin-rich pocket
Fig. 10. Typical morphology of local area around z-pin.
Fig. 11. Sketch of fibres deflecting around z-pins and �weaving� through a field of z-pins.
Fig. 12. Scanning electron microscope image of fibres �weaving� between two z-pins.
C.A. Steeves, N.A. Fleck / International Journal of Solids and Structures 43 (2006) 3197–3212 3207
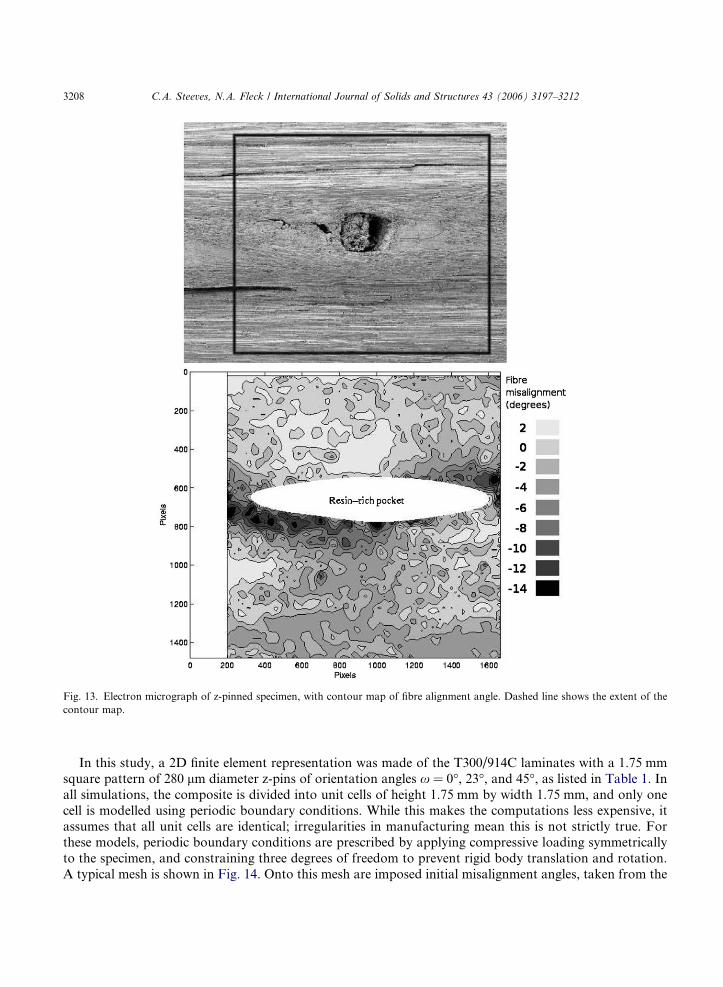
assembled. SEM images of three different composite laminates were analysed. They were T300/914C lam-inates with a 1.75 mm square pattern of 280 lm diameter z-pins with orientation angles x = 0�, 23�, and45� as listed in Table 1. The specimens were gold-coated and digital SEM images 2000 pixels by 1500 pixelswere captured from each specimen and enhanced to increase the contrast. The resulting image was thenused as the input for the CSC algorithm.
4.3. Results
Fig. 13 shows an SEM image of a laminate with z-pins at orientation angle 0� as used by the CSC algo-rithm to produce a contour map of fibre alignment. The area of the original image covered by the contourmap is outlined with a dashed line. Note that the area of the resin-rich pocket and z-pin has been removedfrom the contour map as the alignment data for these areas have no significance. It is clear from the contourmap that fibre misalignment of up to 14� occurs in two patches adjacent to the z-pin, while remote fibresshow negligible misalignment. A similar procedure has been followed for the specimens with orientationangles of x = 23� and 45�. The results of the image analysis were used as the input data for finite elementcalculations, as reported in the following section.
5. Finite element modelling
Shu and Fleck (1995) have developed the finite element code FLASH to predict the compressive strengthof fibre composites containing elliptical patches of fibre waviness when subjected to compressive and shear-ing loads. This finite element model includes the role of initial fibre waviness and fibre bending stiffness byemploying non-linear couple stress theory. The fibres and matrix are idealised as a ‘‘smeared-out’’ homo-geneous solid with an additional degree of freedom which represents the rotation of the fibres. With increas-ing loading, FLASH tracks the evolution of fibre rotation and modifies the local anisotropic constitutivelaw, leading to instability and peak load at relatively small fibre rotations (Fleck and Shu, 1995). Liuand Fleck (1999) have updated FLASH to allow for arbitrary distributions of initial fibre waviness.
Fig. 13. Electron micrograph of z-pinned specimen, with contour map of fibre alignment angle. Dashed line shows the extent of thecontour map.
3208 C.A. Steeves, N.A. Fleck / International Journal of Solids and Structures 43 (2006) 3197–3212
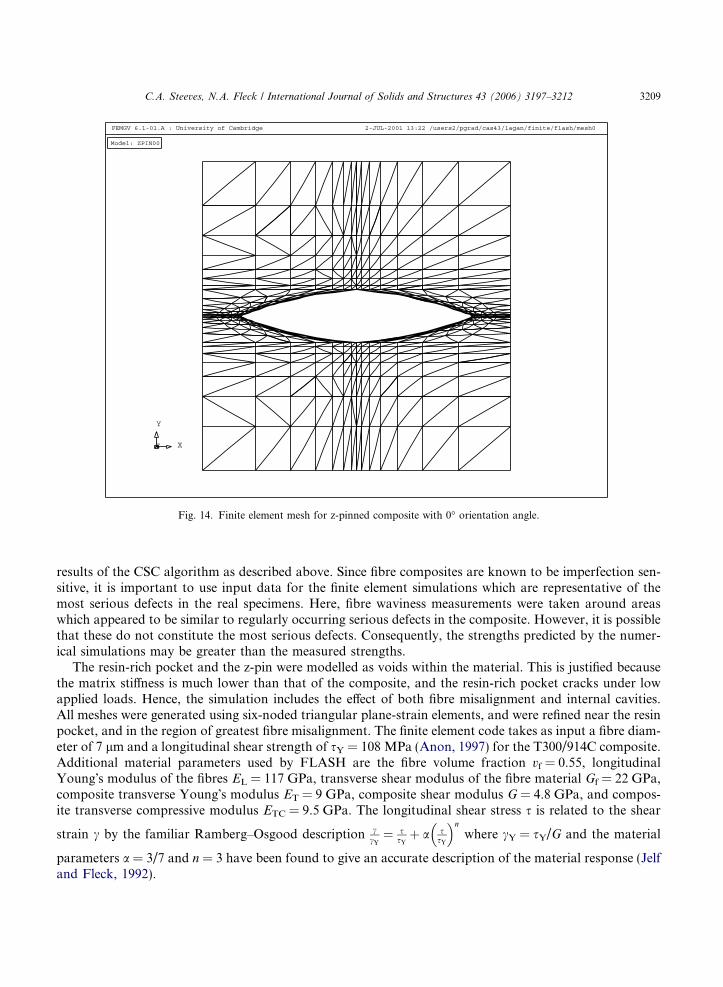
In this study, a 2D finite element representation was made of the T300/914C laminates with a 1.75 mmsquare pattern of 280 lm diameter z-pins of orientation angles x = 0�, 23�, and 45�, as listed in Table 1. Inall simulations, the composite is divided into unit cells of height 1.75 mm by width 1.75 mm, and only onecell is modelled using periodic boundary conditions. While this makes the computations less expensive, itassumes that all unit cells are identical; irregularities in manufacturing mean this is not strictly true. Forthese models, periodic boundary conditions are prescribed by applying compressive loading symmetricallyto the specimen, and constraining three degrees of freedom to prevent rigid body translation and rotation.A typical mesh is shown in Fig. 14. Onto this mesh are imposed initial misalignment angles, taken from the
X
Y
Z
Model: ZPIN00
2-JUL-2001 13:22 /users2/pgrad/cas43/lagan/finite/flash/mesh0FEMGV 6.1-01.A : University of Cambridge
Fig. 14. Finite element mesh for z-pinned composite with 0� orientation angle.
C.A. Steeves, N.A. Fleck / International Journal of Solids and Structures 43 (2006) 3197–3212 3209
results of the CSC algorithm as described above. Since fibre composites are known to be imperfection sen-sitive, it is important to use input data for the finite element simulations which are representative of themost serious defects in the real specimens. Here, fibre waviness measurements were taken around areaswhich appeared to be similar to regularly occurring serious defects in the composite. However, it is possiblethat these do not constitute the most serious defects. Consequently, the strengths predicted by the numer-ical simulations may be greater than the measured strengths.
The resin-rich pocket and the z-pin were modelled as voids within the material. This is justified becausethe matrix stiffness is much lower than that of the composite, and the resin-rich pocket cracks under lowapplied loads. Hence, the simulation includes the effect of both fibre misalignment and internal cavities.All meshes were generated using six-noded triangular plane-strain elements, and were refined near the resinpocket, and in the region of greatest fibre misalignment. The finite element code takes as input a fibre diam-eter of 7 lm and a longitudinal shear strength of sY = 108 MPa (Anon, 1997) for the T300/914C composite.Additional material parameters used by FLASH are the fibre volume fraction vf = 0.55, longitudinalYoung�s modulus of the fibres EL = 117 GPa, transverse shear modulus of the fibre material Gf = 22 GPa,composite transverse Young�s modulus ET = 9 GPa, composite shear modulus G = 4.8 GPa, and compos-ite transverse compressive modulus ETC = 9.5 GPa. The longitudinal shear stress s is related to the shear
strain c by the familiar Ramberg–Osgood description ccY¼ s
sYþ a s
sY
� �nwhere cY = sY/G and the material
parameters a = 3/7 and n = 3 have been found to give an accurate description of the material response (Jelfand Fleck, 1992).
3210 C.A. Steeves, N.A. Fleck / International Journal of Solids and Structures 43 (2006) 3197–3212
5.1. Finite element predictions
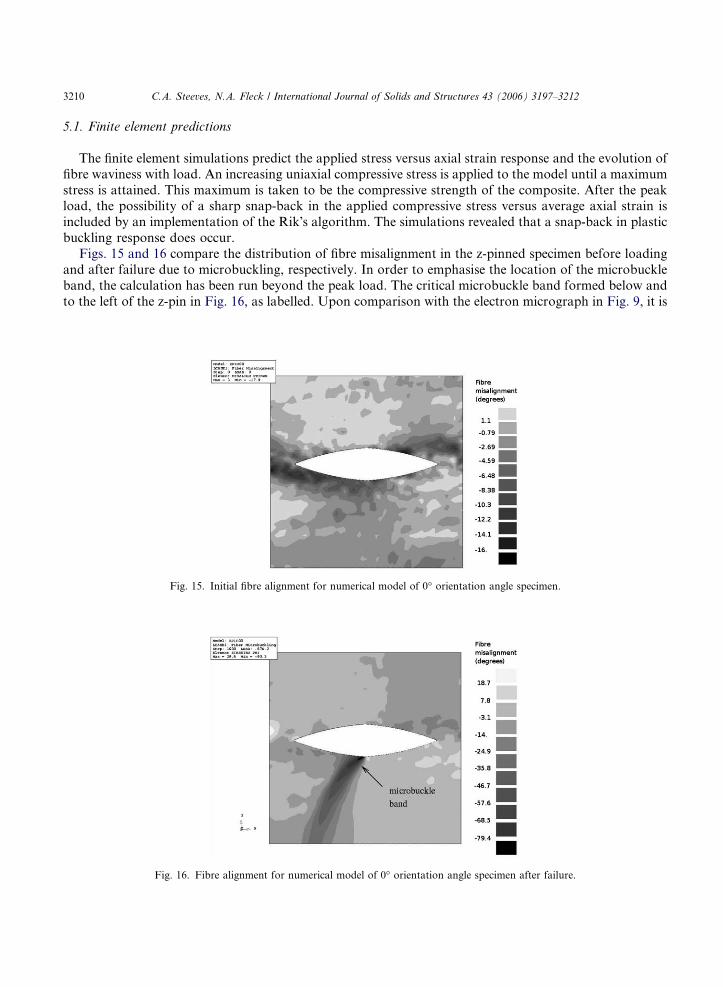
The finite element simulations predict the applied stress versus axial strain response and the evolution offibre waviness with load. An increasing uniaxial compressive stress is applied to the model until a maximumstress is attained. This maximum is taken to be the compressive strength of the composite. After the peakload, the possibility of a sharp snap-back in the applied compressive stress versus average axial strain isincluded by an implementation of the Rik�s algorithm. The simulations revealed that a snap-back in plasticbuckling response does occur.
Figs. 15 and 16 compare the distribution of fibre misalignment in the z-pinned specimen before loadingand after failure due to microbuckling, respectively. In order to emphasise the location of the microbuckleband, the calculation has been run beyond the peak load. The critical microbuckle band formed below andto the left of the z-pin in Fig. 16, as labelled. Upon comparison with the electron micrograph in Fig. 9, it is
Fig. 15. Initial fibre alignment for numerical model of 0� orientation angle specimen.
Fig. 16. Fibre alignment for numerical model of 0� orientation angle specimen after failure.
Table 6Predicted and experimental strengths for specimens with variable orientation angle
Orientation angle x (deg) Measured strength (MPa) Predicted strength (MPa)
0 894 88723 592 78845 530 643
C.A. Steeves, N.A. Fleck / International Journal of Solids and Structures 43 (2006) 3197–3212 3211
clear that the location of the microbuckle failure predicted numerically is the same as that observed withinthe SEM. Further comparison with the initial distribution of fibre waviness in Fig. 15 shows that this failurelocation on the flank of the resin-rich pocket is in the region of large initial fibre misalignment, approxi-mately 12�. Similarly, in the simulations of the specimens with x equal to 23� and 45�, the microbucklebands formed near the resin pockets in the regions of large initial fibre waviness.
The average values of observed strength and the predicted strengths from the finite element simulationsare given in Table 6. Both the measured and predicted strengths reduce with increasing inclination x,although the observed decline is the more marked. This may be a consequence of the difficulty of choosingimages which correctly represent the most severe fibre misalignment in the specimens.
6. Concluding remarks
Experimental evidence and numerical simulations show that z-pins reduce the in-plane strength of com-posite laminates. The observed tensile strength of the unidirectional composites is reduced by approxi-mately 27% while the compressive strength is reduced by at least 30% due to the presence of the z-pins.
The compression tests on the z-pinned specimens show a clear correlation between the knock-down ofcompressive strength and the degree of fibre misalignment. For example, the waviness induced by an in-clined pattern of pins exceeds that for an aligned pattern of pins, and in turn exceeds that for a singlerow of pins; the measured compressive strength ranks in the inverse order. In principle, z-pins can be in-serted in any desired pattern, and hence it may be possible to optimise the geometrical arrangement ofthe z-pins to reduce the degree of induced fibre waviness and thereby to maximise the in-plane compressiveand tensile strengths.
The compressive strength of the z-pinned laminates is reduced by the misalignment of the fibres adjacentto the z-pins. The worst fibre misalignments are caused when fibres �weave� through a field of z-pins, and�weaving� is both more likely and more severe for 23� and 45� orientation angles than for the 0� orientationangle. As a consequence, the compressive strengths of the z-pinned composites are inversely related to theorientation angle. The �weaving� effect dominates the compressive strength of the z-pinned laminates; whena single row of pins is inserted, so that no �weaving� is possible, the compressive strength is not reduced fromthe unpinned compressive strength.
The combined procedure of image analysis using the Creighton–Sutcliffe–Clyne (CSC) algorithm in or-der to determine the distribution of fibre misalignment distribution and finite element simulations give pre-dictions of compressive strength which follow the trends of the experimental data. However, fibrecomposites in compression are highly imperfection sensitive, and it is difficult to determine the most seriousflaw inherent in a material by subjective means. In this study, the CSC algorithm was used to analyse thefibre waviness around a small number of selected z-pins. There are several limitations associated with thisprocedure: (i) the images are a two-dimensional slice of a three-dimensional solid; (ii) fibre waviness is notconstant through the thickness of a laminate with the most severe flaws existing sub-surface; and (iii) only asmall proportion of the z-pins can be analysed, possibly missing the worst flaws.
3212 C.A. Steeves, N.A. Fleck / International Journal of Solids and Structures 43 (2006) 3197–3212
Acknowledgements
The authors would like to thank John Ellis of Hexcel Composites for prepregs and autoclaving facilities,Denis Cartie and Ivana Partridge of Cranfield University for access to z-pin preforms and insertion equip-ment, and Alan Heaver of CUED for the SEM images.
References
Anon, 1997. NCF stage 2 option 0 T300/914C material properties. Technical report, British Aerospace, Airbus Division.Aveston, J., Kelly, A., 1973. Theory of multiple fracture of fibrous composites. Journal of Materials Science 8, 352–362.Barrett, J.D., 1996. The mechanics of z-fiber reinforcement. Composite Structures 36, 23–32.Budiansky, B., Amazigo, J.C., 1989. Toughening by aligned, frictionally constrained fibers. Journal of Mechanics and Physics of Solids
37 (1), 93–109.Budiansky, B., Hutchinson, J.W., Evans, A.G., 1986. Matrix fracture in fiber-reinforced ceramics. Journal of Mechanics and Physics of
Solids 34 (2), 167–189.Cartie, D.D.R., Partridge, I., 2005. Delamination resistant laminates by z-fiber pinning. Part I: Manufacture and fracture performance.
Composites Part A: Applied Science and Manufacturing 36 (1), 55–64.Cox, B.N., 1999. Constitutive model for a fibre tow bridging a delamination crack. Mechanics of Composite Structures and Materials
6 (2), 117–138.Creighton, C.J., Sutcliffe, M.P.F., Clyne, T.W., 2001. A multiple field image analysis procedure for characterisation of fibre alignment
in composites. Composites Part A: Applied Science and Manufacturing 32 (2), 221–229.Dransfield, K.A., Jain, L.K., Mai, Y.-W., 1998. On the effect of stitching in CFRPs—I. Mode I delamination toughness. Composites
Science and Technology 58, 815–827.Fleck, N.A., 1997. Compressive failure in fiber composites. Advances in Applied Mechanics 33, 43–117.Fleck, N.A., Shu, J.Y., 1995. Microbuckle initiation in fibre composites: a finite element study. Journal of Mechanics and Physics of
In: AGARD Conference Proceedings 590: Bolted/Bonded Joints in Polymeric Composites, Advisory Group for AerospaceResearch and Development, pp. 17-1–17-8.
Grassi, M., Zhang, X., Meo, M., 2002. Prediction of stiffness and stresses in z-fibre reinforced composite laminates. Composites Part A:Applied Science and Manufacturing 33 (12), 1653–1664.
Hu, X.-Z., Mai, Y.-W., 1993. Mode I delamination and fibre bridging in carbon–fibre/epoxy composites with and without pvalcoating. Composites Science and Technology 46, 147–156.
Jain, L.K., Mai, Y.-W., 1995. Determination of mode II delamination toughness in stitched laminated composites. Composites Scienceand Techonology 55, 241–253.
Jain, L.K., Dransfield, K.A., Mai, Y.-W., 1998. On the effect of stitching in CFRPs—II. Mode II delamination toughness. CompositesScience and Techonology 58, 829–837.
Jelf, P.M., Fleck, N.A., 1992. Compression failure mechanisms in unidirectional composites. Journal of Composite Materials 26 (18),2706–2726.
Liu, D., Fleck, N.A., 1999. User�s manual II for finite element code FLASH for fibre microbuckling. Technical Report CUED/C-MICROMECH/TR.29, Cambridge University Engineering Department, November.
Ratcliffe, J.G., O�Brien, T.K., 2004. Discrete spring model for predicting delamination growth in z-fiber reinforced DCB specimens.In: Proceedings of the American Society for Composites, Nineteenth Technical Conference, Atlanta, GA, 17–24 October 2004,American Society for Testing and Materials Committee D30.
Shu, D., Mai, Y.-W., 1993. Effect of stitching on interlaminar delamination extension in composite laminates. Composites Science andTechnology 49, 165–171.
Shu, J.Y., Fleck, N.A., 1995. User�s manual for finite element code for fibre microbuckling. Technical Report CUED/C-MATS/TR.224, University of Cambridge Department of Engineering, May.