Page 1
Abstract—High Peak-to-Average Power Ratio (PAPR) of the
transmitted OFDM signal and the Carrier Frequency Offset
(CFO) are well-known major drawbacks of the Orthogonal
Frequency-Division Multiplexing (OFDM). Therefore, to avoid
the High-Power Amplifier (HPA) inefficient operation with large
back-off between the operating input power and its saturation
region, specifically with the Long-Term Evolution (LTE) systems
downlink, PAPR and CFO must be minimized. Considering that
in many practical situations, this task demands (often
unavailable) complex test equipment, such as e.g. Vector Signal
Analyzer (VSA), in this paper, we develop a simple model for
estimating the (residual) PAPR and CFO-induced peak phase
deviation, by applying link abstraction, i.e. considering the easy-
measurable BER degradation due to HPA non-linearity, as if it
were the consequence of the according additive white Gaussian
noise (AWGN). Moreover, the classic out-of-service BER testing,
which requires network operator to interrupt its revenue-
generating traffic, is substituted by in-service BER estimation
from in-phase and quadrature-phase eye diagram closures,
measured on live traffic, by means of a simple oscilloscope. The
analytical model is verified by the appropriate Monte-Carlo
simulations.
Index Terms— PAPR, OFDM, LTE, BER.
I. INTRODUCTION
Orthogonal Frequency-Division Multiplexing (OFDM)
offers high-speed and excellent-performance data transmission
over time-dispersive channels [1]. Therefore, it has been
extensively used throughout the second consecutive decade,
ever since it started to be deployed with the wireless local-area
networks, through digital video broadcasting, and finally to the
fourth-generation (4G) mobile communication systems – the
Long-Term Evolution (LTE), in particular [2-5].
However, two main imperfections of OFDM systems still
remain in focus when the OFDM transmission performance is
in question, namely the Carrier Frequency Offset (CFO) that
disrupts the orthogonality and so causes the Inter-Carrier
Interference (ICI), as well as the excessive Peak-to-Average
Power Ratio (PAPR) that is immanent even to the ideal
OFDM signal, as its particular subcarriers combine one with e-
Manuscript received September 5, 2018; revised November 26, 2018. Date
of publication February 15, 2019.
Authors are with the University of Dubrovnik, Croatia (e-mails:
[email protected] , [email protected] ). Digital Object Identifier (DOI): 10.24138/jcomss.v15i1.614.
ach other either constructively, or destructively [6-7].
On the other hand, at the transmitter, large OFDM signal
peaks pass through the High-Power Amplifier (HPA), which
therefore is necessary to operate in its linear region, i.e. with
large back-off between the operating input power and its value
at which the HPA starts entering its saturation region.
Specifically with LTE downlink, some kind of PAPR
reduction must be utilized, while in LTE uplink, the Single-
Carrier-Frequency–Division Multiple Access (SC-FDMA),
characterized by lower PAPR, and the mobile station – User
Equipment (UE) operating at much lower power level, both
imply that no PAPR reduction needs to be done.
However, as LTE-Advanced enables carrier aggregation in
the downlink, even higher PAPR values can be expected,
demanding wider linear HPA dynamic range, while the
clustered SC-FDMA implies the same in the uplink [3].
With this regard, specifically with LTE-Advanced downlink,
quick and simple OFDM PAPR estimation can be of interest.
Therefore, in this paper the link abstraction principle is applied
on the BER considered to be determined just by the HPA
nonlinear distortion, i.e. provided that the channel is noiseless
and time-dispersion-free (so that errors occur just due to HPA
nonlinearity and the actual PAPR).
Finally, we extend the model to include the BER based
estimation of CFO-induced peak phase deviation.
In Section 2, concepts of DPD and PAPR reduction are
presented as well as relevant measurement examples. Then, in
Section 3, we present the BER based PAPR, as well as CFO-
induced peak phase deviation estimation, for the high-Signal-
to-Noise Ratio (SNR) and multipath-free common AWGN
channel that would have produced the same BER value. In
Section 4, we review the in-service BER estimation from eye
diagram closures measured on live traffic, using an
oscilloscope. The analytical model is verified by means of Monte
Carlo (MC) simulations, while conclusions are summarized in
Section 5.
II. HPA NONLINEARITY COMPENSATION
Linear HPA operation implies low power efficiency:
DC
inout
P
PP (1)
In-Service BER Based Estimation of OFDM
PAPR and CFO-induced Peak Phase Deviation
Adriana Lipovac, and Ante Mihaljević
44 JOURNAL OF COMMUNICATIONS SOFTWARE AND SYSTEMS, VOL. 15, NO. 1, MARCH 2019
1845-6421/03/614 © 2019 CCIS
Page 2
where Pout, Pin and PDC denote output and input powers, and
the power taken from a battery, respectively, Fig.1.
Fig. 1. HPA characteristics
With low in linear regime, typically less than 10%, i.e.
with more than 90% of the DC power dissipated into heat, the
HPA operating costs become unacceptable, especially for
mobile devices.
However, when an HPA operates in its saturation region, it
introduces spectral regrowth that interferes with adjacent
channels, Fig. 2.
Fig. 2. 4QAM spectrum spreading by HPA
Therefore the signal dynamic range must be accommodated
to (mostly) fit the HPAs linear region either by digital
predistortion (DPD) or by crest factor reduction (CFR)
Whatever the means to reduce OFDM signal peaks, the
benefit is the possibility to increase the allowed average signal
power, which implies the higher DC power usage efficiency,
i.e. shifting the operating point to the right, and enabling
longer distance coverage by a mobile station [1].
The effect on the Error Vector Magnitude (EVM) is
presented in Fig. 3.
Fig. 3. EVM vs output power with and w/o DPD [3]
Various means to reduce PAPR in OFDM systems have
been proposed so far [8-9], ranging from amplitude clipping
[9-10], through coding methods [12], as well as the ones that
introduce no distortion, with or without side information sent
to the receiver [13-15].
III. TESTING PAPR REDUCTION
Testing PAPR without and with reduction can discover
effectiveness of the applied PAPR reduction algorithm. It can
be accomplished in a number of ways.
Specifically, the LTE lab with the state-of-the-art vector
signal analysis (VSA) and Error Vector Magnitude (EVM)
measurements [16] is the best solution for the analysis with
this regard [17-18].
The exemplar PAPR complementary cumulative distribution
function (CCDF) curve is presented in Fig. 4, where we can
see that the probability that PAPR without CFR gets larger
than 8.9 dB equals 0.1%, which holds already for the PAPR of
7.2 dB, with CFR applied.
Fig. 4. CCDF of PAPR for with and w/o implementation of CFR in LTE-
Advanced with 2x20 MHz contiguous CA [3]
A. LIPOVAC et al.: IN-SERVICE BER BASED ESTIMATION OF OFDM PAPR AND CFO-INDUCED PEAK PHASE DEVIATION 45
Page 3
However, in many practical situations no complex test
equipment is available or affordable, so a simple and effective
quick (residual) PAPR estimation can be of interest.
Although state-of-the-art wireless systems transmission
performance specifications for network operators, such as the
LTE ones, are block-error oriented, rather than bit-error based
[4], still BER is inevitable performance indicator in research,
product design and manufacturing, and is frequently and
widely used. So, the idea here is to estimate the post-
reduction PAPR by means of BER, which ultimately reflects
the transmission performance [1].
Thereby, as common BER testing is much easier to
accomplish than the VSA, it could be useful to relate PAPR
directly to BER targets, rather than the EVM ones, as it
follows.
A. BER based PAPR Estimation
Essentially, the wideband signals’ PAPR can be quite large,
with the values of up to 13dB and more, so CFR can
supplement DPD, significantly reducing the necessary back-
off from saturated power, and thus increasing the HPA
efficiency at no cost of signal degradation.
On this way, the distortion metric due to PAPR reduction is
usually expressed in terms of EVM. Accordingly, for the CFR
of the LTE-Advanced 20MHz downlink, the EVM target
values for the QPSK, 16QAM and 64QAM are below 10%,
8% and 6%, respectively [3].
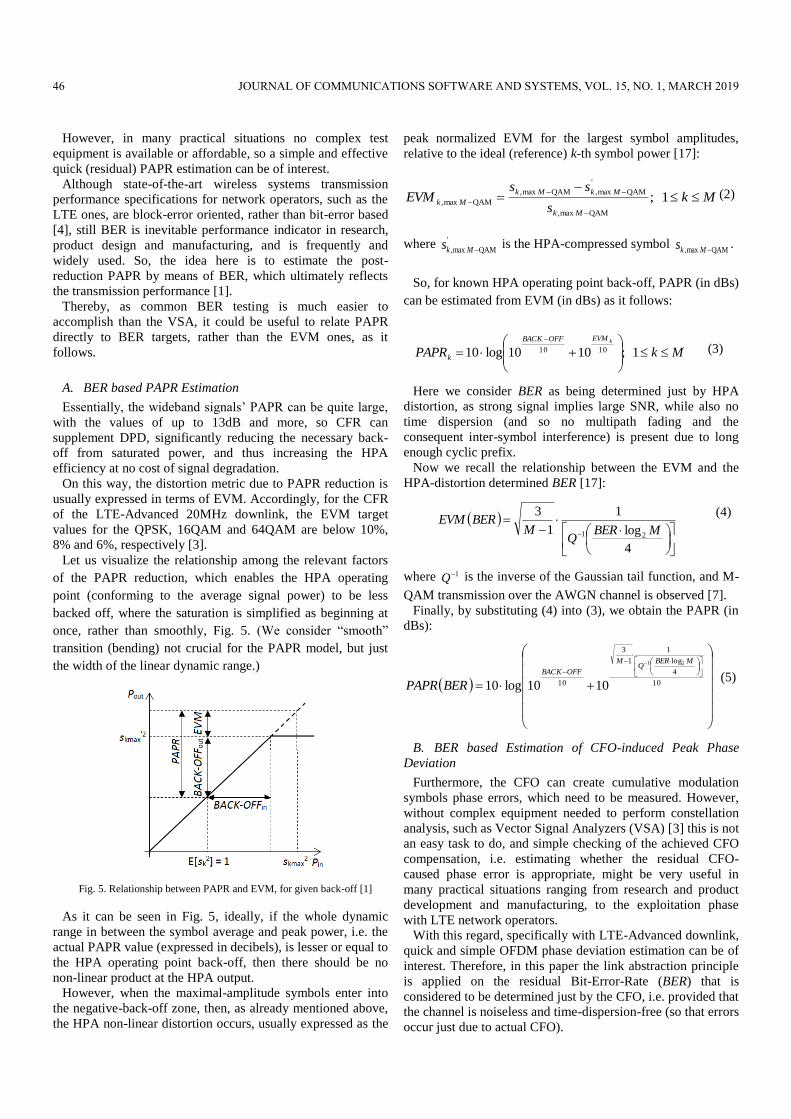
Let us visualize the relationship among the relevant factors
of the PAPR reduction, which enables the HPA operating
point (conforming to the average signal power) to be less
backed off, where the saturation is simplified as beginning at
once, rather than smoothly, Fig. 5. (We consider “smooth”
transition (bending) not crucial for the PAPR model, but just
the width of the linear dynamic range.)
Fig. 5. Relationship between PAPR and EVM, for given back-off [1]
As it can be seen in Fig. 5, ideally, if the whole dynamic
range in between the symbol average and peak power, i.e. the
actual PAPR value (expressed in decibels), is lesser or equal to
the HPA operating point back-off, then there should be no
non-linear product at the HPA output.
However, when the maximal-amplitude symbols enter into
the negative-back-off zone, then, as already mentioned above,
the HPA non-linear distortion occurs, usually expressed as the
peak normalized EVM for the largest symbol amplitudes,
relative to the ideal (reference) k-th symbol power [17]:
Mks
ssEVM
Mk
MkMk
Mk
1;QAMmax,
'
QAMmax,QAMmax,
QAMmax,(2)
where '
QAMmax, Mks is the HPA-compressed symbol QAMmax, Mks .
So, for known HPA operating point back-off, PAPR (in dBs)
can be estimated from EVM (in dBs) as it follows:
MkPAPRkEVMOFFBACK
k
1;1010log10 1010 (3)
Here we consider BER as being determined just by HPA
distortion, as strong signal implies large SNR, while also no
time dispersion (and so no multipath fading and the
consequent inter-symbol interference) is present due to long
enough cyclic prefix.
Now we recall the relationship between the EVM and the
HPA-distortion determined BER [17]:
4
log
1
1
3
21 MBERQ
MBEREVM
(4)
where 1Q is the inverse of the Gaussian tail function, and M-
QAM transmission over the AWGN channel is observed [7].
Finally, by substituting (4) into (3), we obtain the PAPR (in
dBs):
10
4
log
1
1
3
10
21
1010log10
MBERQ
M
OFFBACK
BERPAPR (5)
B. BER based Estimation of CFO-induced Peak Phase
Deviation
Furthermore, the CFO can create cumulative modulation
symbols phase errors, which need to be measured. However,
without complex equipment needed to perform constellation
analysis, such as Vector Signal Analyzers (VSA) [3] this is not
an easy task to do, and simple checking of the achieved CFO
compensation, i.e. estimating whether the residual CFO-
caused phase error is appropriate, might be very useful in
many practical situations ranging from research and product
development and manufacturing, to the exploitation phase
with LTE network operators.
With this regard, specifically with LTE-Advanced downlink,
quick and simple OFDM phase deviation estimation can be of
interest. Therefore, in this paper the link abstraction principle
is applied on the residual Bit-Error-Rate (BER) that is
considered to be determined just by the CFO, i.e. provided that
the channel is noiseless and time-dispersion-free (so that errors
occur just due to actual CFO).
46 JOURNAL OF COMMUNICATIONS SOFTWARE AND SYSTEMS, VOL. 15, NO. 1, MARCH 2019
Page 4
Moreover, recently, it has been shown that the maximal
CFO-caused squared phase deviation is linear with the
instantaneous (per-OFDM-symbol) PAPR. This implies that
any PAPR reduction technique, such as e.g. simple clipping or
coding, indirectly suppresses the CFO-induced phase
deviation, too [6]. On the other hand this enables determining
the CFO-induced phase deviation simply from BER
degradation by applying the link abstraction method.
Thereby, it could be useful to relate the peak CFO-induced
phase error to BER, by using the CFO’s relationship with
PAPR [6] that is expressed by BER applying link abstraction
principle.
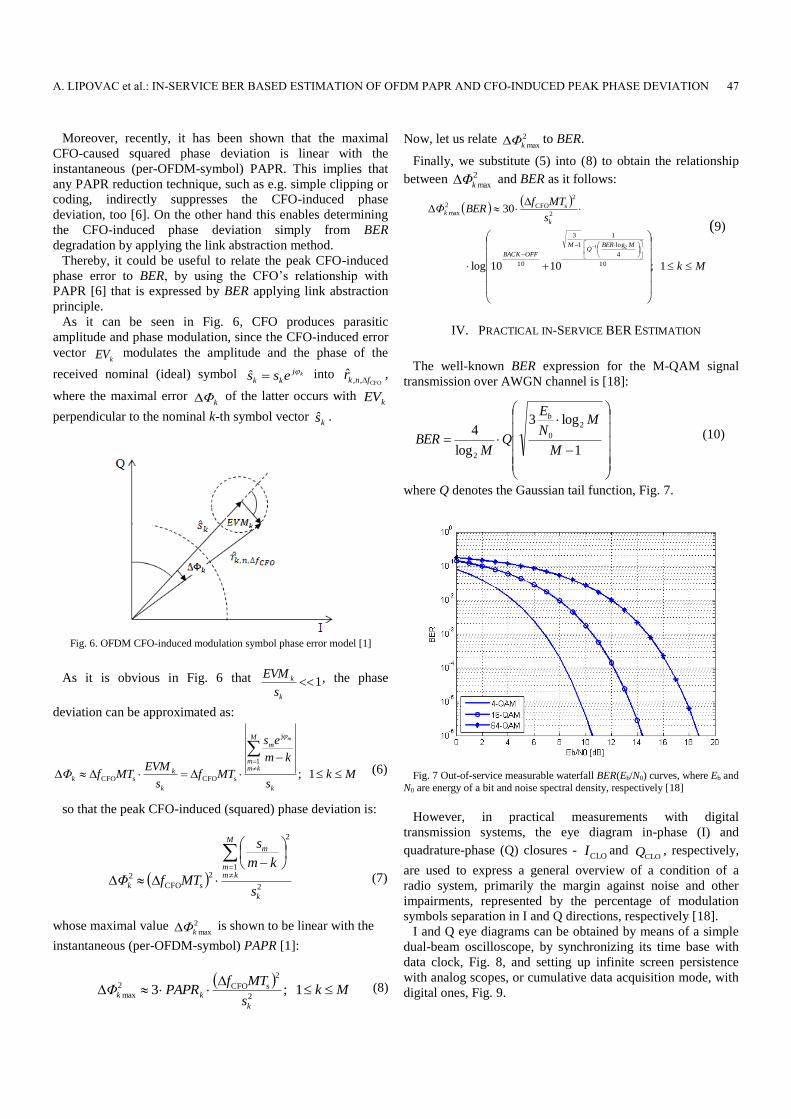
As it can be seen in Fig. 6, CFO produces parasitic
amplitude and phase modulation, since the CFO-induced error
vector kEV modulates the amplitude and the phase of the
received nominal (ideal) symbol kj
kk ess
ˆ into CFO,,
ˆfnkr
,
where the maximal error kΦ of the latter occurs with
kEV
perpendicular to the nominal k-th symbol vector ks .
Fig. 6. OFDM CFO-induced modulation symbol phase error model [1]
As it is obvious in Fig. 6 that 1k
k
s
EVM , the phase
deviation can be approximated as:
Mks
km
es
MTfs
EVMMTfΦ
k
M
kmm
m
k
kk
m
1;
1
j
sCFOsCFO
(6)
so that the peak CFO-induced (squared) phase deviation is:
2
1
2
2
sCFO
2
k
M
kmm
m
ks
km
s
MTfΦ
(7)
whose maximal value 2
maxkΦ is shown to be linear with the
instantaneous (per-OFDM-symbol) PAPR [1]:
Mk
s
MTfPAPRΦ
k
kk
1;32
2
sCFO2
max (8)
Now, let us relate 2
maxkΦ to BER.
Finally, we substitute (5) into (8) to obtain the relationship
between 2
maxkΦ and BER as it follows:
Mk
s
MTfBERΦ
MBERQ
M
OFFBACK
k
k
1;1010log
30
10
4
log
1
1
3
10
2
2
sCFO2
max
21
(9)
IV. PRACTICAL IN-SERVICE BER ESTIMATION
The well-known BER expression for the M-QAM signal
transmission over AWGN channel is [18]:
1
log3
log
42
0
2 M
MN
E
QM
BER
b
(10)
where Q denotes the Gaussian tail function, Fig. 7.
Fig. 7 Out-of-service measurable waterfall BER(Eb/N0) curves, where Eb and
N0 are energy of a bit and noise spectral density, respectively [18]
However, in practical measurements with digital
transmission systems, the eye diagram in-phase (I) and
quadrature-phase (Q) closures - CLOI and
CLOQ , respectively,
are used to express a general overview of a condition of a
radio system, primarily the margin against noise and other
impairments, represented by the percentage of modulation
symbols separation in I and Q directions, respectively [18].
I and Q eye diagrams can be obtained by means of a simple
dual-beam oscilloscope, by synchronizing its time base with
data clock, Fig. 8, and setting up infinite screen persistence
with analog scopes, or cumulative data acquisition mode, with
digital ones, Fig. 9.
A. LIPOVAC et al.: IN-SERVICE BER BASED ESTIMATION OF OFDM PAPR AND CFO-INDUCED PEAK PHASE DEVIATION 47
Page 5
Fig. 8. Measuring eye diagrams with a dual-beam oscilloscope [1]
Fig. 9. Practical eye diagram (the percentage denotes eye openess, i.e. the complement of the noise margin) [1]
So, to estimate BER(Eb/N0) in (10), we need to calculate
Eb/N0 from closure. It has been shown that the closure is
related to C/N as it follows [18]:
2
CLO
2
CLO
1100log20
QI
C
N
C (11)
where the constant C1 represents the rms power of the carrier,
and depends on the actual modulation scheme (e.g. 10 for
16 QAM).
Furthermore, as:
TBN
C
N
Eb N
0
(12)
then, taking into account (11), (12) can be rewritten as:
TBQI
C
N
Eb
N
2
CLO
2
CLO
1
0
100log20 (13)
For the LTE receiver noise bandwidth of BN= 1.25 MHz,
(13) can be presented in tabular form, which, for 16 QAM
modulation, is Table 1.
TABLE I
EQUIVALENT EB/N0 AS A FUNCTION OF I AND Q CLOSURES FOR 16 QAM [18]
This way, the closure values in (13) or Table 1 can be
substituted into (9).
So, e.g. for 16 QAM, where M=16, substituting (13) into
(10), provides BER as it follows:
TB
QIQBER N
2
CLO
2
CLO
10100log4 (14)
Finally, for complete in-service PAPR estimation, (14) has
to be substituted into (5).
V. VERIFICATION
In order to verify (5), it was necessary to conduct Monte
Carlo (MC) simulations of various symbols belonging to the
three LTE-relevant modulation types: 4-QAM, 16-QAM and
64-QAM, and perform uncoded BER tests without time
dispersion (equivalent to the perfect CP-protected channel),
and with high SNR [1].
A. Verification of PAPR Estimation
With back-off values ranging from 0 to 12 dB, the HPA
non-linearity was introduced just to the maximal-amplitude
outer symbols in the constellation, so reducing the PAPR and
enabling bit error occurrences to be counted for the short-term
BER calculation and checking (5).
In the simplified PAPR model, we considered that without
normalization, the I and Q component of the maximal 4, 16
and 64-QAM modulation symbols’ amplitudes are equal to 1,
3 and 7, respectively. The normalization is performed by
dividing the above values by 2 , 10 and 42 , respectively,
so enabling the unit mean symbol energy [4], i.e.:
1E 2 ks
(15)
This implies:
33.27742
1
1:8.13310
1
1112
1
222
QAM64max,
222
QAM16max,
222
QAM4max,
k
k
k
s
Mks
s
(16)
48 JOURNAL OF COMMUNICATIONS SOFTWARE AND SYSTEMS, VOL. 15, NO. 1, MARCH 2019
Page 6
The instantaneous (per-OFDM-symbol) PAPR, defined as
[4]:
M
m
m
M
m
mm
M
m
m
M
m
mm
avg
peak
k
s
s
s
s
P
PPAPR
1
2
1
2
1
2
1
2 max
2
1
2
1max
(17)
can be regarded as determined by the maximal amplitude of
the 64-QAM symbols only, providing the highest PAPR
values:
Mk
s
sMPAPR
M
m
m
k
k
1;
1
2
2
QAM64max,
absmax
(18)
On the other hand, more realistic PAPR values are obtained
by accordingly modifying (17) to take into account not only
the (rarely appearing) 64-QAM highest-amplitude symbols,
but all maximal amplitudes’ values from (16), weighted by
their probabilities of occurrence in the OFDM symbol, which
can take various values, such as e.g. [19]:
1.0QAM64
1;5.0QAM16
4.0QAM4
k
k
k
sP
MksP
sP
(19)
Accordingly, the corresponding PAPR plots for the three
LTE-relevant modulations, and back-off values of 5, 10 and
15dB, are presented in Figures 10, 11 and 12, respectively.
Observed intra-figures, the below plots reflect dispersion
among the modulation types for the same PAPR value, where
the higher modulation order implies the larger BER. Moreover,
observed inter-figures, it is obvious that for any modulation
algorithm, the larger back-off values increase the
corresponding tolerable PAPR values for the same BER value.
Fig. 10. PAPR vs BER with 5 dB HPA back-off
Fig. 11. PAPR vs BER with 10 dB HPA back-off
Fig. 12. PAPR vs BER with 15 dB HPA back-off
Finally, in Table II the exemplar PAPR vs BER relationship
with 5 dB back-off for 4-QAM, 16-QAM and 64-QAM
modulation schemes, are presented, as coming out of the
estimation (5) and MC simulations.
As it can be seen from the table, excellent matching
between the estimated and the MC-simulated PAPR values is
found (with the tolerance to PAPR decreasing with the order
of QAM), which verifies the model under the presumed
conditions.
B. Verification of Estimation of CFO-induced Phase
Deviation
Furthermore, the corresponding phase deviation plots for the
three LTE-relevant modulations, and the CFO values of 5, 70
and 300 Hz, are presented in Figures 13, 14 and 15,
respectively.
A. LIPOVAC et al.: IN-SERVICE BER BASED ESTIMATION OF OFDM PAPR AND CFO-INDUCED PEAK PHASE DEVIATION 49
Page 7
Fig. 13. 2
maxkΦ vs BER with 5 dB HPA back-off, 4 QAM
Fig. 14. 2
maxkΦ vs BER with 5 dB HPA back-off, 16 QAM
Fig. 15. 2
maxkΦ vs BER with 5 dB HPA back-off, 64 QAM
If compared intra-figures, the above plots reflect dispersion
among the CFO values for the same modulation type, where
the higher CFO implies the larger BER. Moreover, compared
inter-figures, the higher modulation order is less tolerable to
CFO for the same BER value.
Finally, in Table III, the exemplar 2
maxkΦ vs BER
relationship with 5 dB back-off and 300 Hz CFO, for 4-QAM,
16-QAM and 64-QAM modulation schemes, are presented, as
coming out of the estimation (5) and MC simulations.
The table exhibits excellent matching found between the
estimated and the MC-simulated BER values, with the
tolerance to CFO phase deviation decreasing with the order of
QAM. This verifies the model under the presumed conditions.
TABLE II
PAPR vs. BER; 4-QAM
TABLE III
CFO PHASE DEVIATION vs. BER; 4-QAM
Estimation (5) MC simulations
4-QAM 16-QAM 64-QAM 4-QAM 16-QAM 64-QAM
BER 10-3 1.27 ˑ10-2 1.53ˑ10-2 1.12 ˑ10-3 1.36 ˑ10-2 1.58ˑ10-2
PAPR [dB] 12.50 12.50 12.50 12.50 12.50 12.50
Estimation (5) MC simulations
4-QAM 16-QAM 64-QAM 4-QAM 16-QAM 64-QAM
BER 10-3 1.27 ˑ10-2 1.53ˑ10-2 1.12 ˑ10-3 1.36 ˑ10-2 1.58ˑ10-2 2
maxkΦ [rad] 0.062 0.062 0.062 0.062 0.062 0.062
50 JOURNAL OF COMMUNICATIONS SOFTWARE AND SYSTEMS, VOL. 15, NO. 1, MARCH 2019
Page 8
VI. CONCLUSION
In many practical situations, specifically with OFDM
transmission over LTE-Advanced downlink, applying carrier
aggregation, PAPR values can be excessive, so quick and
simple PAPR estimation can be of interest. Therefore, in this
paper the link abstraction principle is applied on BER that is
considered to be determined just by the HPA nonlinear
distortion, i.e. that errors occur just due to HPA nonlinearity
and the inadequate PAPR vs back-off relationship.
Moreover, by capitalizing on its relationship with PAPR, the
other dominant OFDM-inherent impairment - the CFO-caused
phase deviation in particular, can also be estimated by means
of common BER testing.
However, as network operators consider out-of-service BER
testing not preferable, under such circumstances, we propose
simple in-service BER estimation from I and Q eye diagrams,
and then using the obtained value for the so achieved complete
in-service PAPR estimation.
The proposed algorithm for estimating both PAPR and CFO-
induced phase deviation from BER, is verified by its excellent
matching with the corresponding MC-simulated scenario.
REFERENCES
[1] A. Lipovac, A. Mihaljević,” BER Based OFDM PAPR Estimation”, Proc. 26th International Conference on Software, Telecommunications
and Computer Networks – SoftCOM, pp.1-6, Split-Supetar, 2018. DOI:
10.23919/SOFTCOM.2018.8555780 [2] A. Lipovac, V. Lipovac and B. Modlic, “Modeling OFDM Irreducible
BER with Impact of CP Length and CFO in Multipath Channel with
Small Delay Dispersion”, Wireless Communications and Mobile Computing, vol. 16, no. 9, pp. 1065-1077, 2016. DOI:
10.1002/wcm.2586 [3] M. Rumnay, LTE and the Evolution of 4G Wireless; Design and
Measurements Challenges, 2nd edition, John Wiley & Sons, 2013.
[4] A. Molisch, Wireless Communications, 2nd ed., New York, Wiley, 2011.
[5] L. Korowajczuk, LTE,WiMAX and WLAN Network Design,
Optimization and Performance Analysis. Wiley 2011. [6] R. Prasad, OFDM for Wireless Communications Systems, Artech
House, Boston, Mass., 2004.
[7] A. A. Hassan, I. S. Ahmed, and S. H. Hossam, “Bit Error Rate
Performance of Orthogonal Frequency-Division Multiplexing Relaying
Systems with High Power Amplifiers and Doppler Effects“, Wireless
Communications and Mobile Computing, vol. 13, no. 8, pp. 734–744, 2013. DOI:10.1002/wcm.1135
[8] T. Jiang and Y. Wu, “An overview: Peak-to-average power ratio
reduction techniques for OFDM signals”, IEEE Trans. on Broadcasting, vol. 54, no. 2, pp. 257-268, 2008. DOI: 10.1109/TBC.2008.915770
[9] S. H. Han and J. H. Lee, “An Overview of Peak-to-Average Power Ratio
Reduction Techniques for Multicarrier Transmission”, IEEE Wireless Communications, vol. 12, issue 2, pp. 56-65, 2005. DOI:
10.1109/MWC.2005.1421929
[10] D. Guel and J. Palicot “Analysis and Comparison of Clipping Techniques for OFDM Peak-To-Average Power Ration reduction”,
IEEE Transactions on Broadcasting, vol 53, no. 3, pp 719-724, 2007.
[11] H. Ochiai and H. Imai, “Performance analysis of deliberately clipped OFDM signals”, IEEE Trans. on Communications, vol. 50, no. 1, pp. 89-
101, 2002. DOI: 10.1109/26.975762
[12] S. B. Slimane, “Reducing the Peak-to-Average Power Ratio of OFDM
Signals Through Precoding”, IEEE Transactions on Vehicular
Technology, vol. 56, issue 2, pp. 686 – 695, 2007. DOI:
10.1109/TVT.2007.891409 [13] S. Y. Le Goff, S. S. Al-Samahi, B. K. Khoo, C. C. Tsimenidis,and B. S.
Sharif, “Selected Mapping without Side Information for PAPR
Reduction in OFDM”, IEEE Transactions on Wireless Communications, vol. 8, no. 7, pp. 3320-3325, 2009. DOI: 10.1109/TWC.2009.070463
[14] T. G. Pratt, N. Jones, L. Smee, and M. Torrey, “OFDM Link
Performance with Companding for PAPR Reduction in the Presence of Nonlinear Amplification”, IEEE Transactions on Broadcasting, vol. 52,
issue. 2, pp. 261–267, 2006. DOI: 10.1109/TBC.2006.875613
[15] T. Jiang, W. Xiang, P. C. Richardson, J. Guo, and G. Zhu, “PAPR Reduction of OFDM Signals Using Partial Transmit Sequences With
Low Computational Complexity”, IEEE Transactions on Broadcasting,
vol. 53, no. 3, pp. 719–724, 2007. DOI: 10.1109/TBC.2007.899345 [16] H. A. Mahmoud and H. Arslan, "Error Vector Magnitude to SNR
Conversion for Nondata-Aided Receivers", IEEE Trans. on Wireless
Communications, vol.8, issue.5, pp.2694-2704, May 2009. DOI: 10.1109/TWC.2009.080862
[17] A. Lipovac, B. Modlic, and M. Grgić,”OFDM Error Floor Based EVM
Estimation”, Proc. 24rd International Conference on Software, Telecommunications and Computer Networks – SoftCOM, pp.1-5, Split,
2016. DOI: 10.1109/SOFTCOM.2016.7772163
[18] A. Lipovac, V. Lipovac, and M. Hamza, "Verification of OFDM Error Floor Prediction in Time-Dispersive LTE FDD DL Channel", Wireless
Personal Communications, vol. 93, no. 3, pp. 853-875, 2017. DOI:
10.1007/s11277-014-2232-y [19] A. Lipovac, S. Isak-Zatega, and P. Njemčević,” In-service Testing
OFDM Error Floor by Constellation Analysis”, Proc. 25th International
Conference on Software, Telecommunications and Computer Networks – SoftCOM, pp.1-6, Split, 2017. DOI:
10.23919/SOFTCOM.2017.8115549
[20] J. C. Ikuno, C. Mehlführer and M. Rupp, “A Novel Link Error Prediction Model for OFDM Systems with HARQ”, Proc. 2011 IEEE
International Conference on Communications (ICC), pp. 1-5, Kyoto,
2011. DOI: 10.1109/icc.2011.5962464
Adriana Lipovac took her Bachelor degree from the
University of Sarajevo, in 2010, and her Master
degrees in both Electrical Engineering and in
Computing from the University of Dubrovnik, in
2012, when she also received Rector’s award as the best student in her generation. Following graduation,
she continued her work in the field of mobile
communications as a teaching assistant at the University of Dubrovnik, while conducting her
research on modelling 4G wireless systems physical
layer performance, at the University of Zagreb, where she received her Ph.D. in 2014. Since 2015, she has been working as an assistant professor at the
Department of Electrical Engineering and Computing, University of
Dubrovnik, where she also holds the position of Head of the Laboratory for Communications Technology. She was the local organizing co-chair for the
International Wireless Communications and Mobile Computing Conference
IWCMC and the Global Wireless Summit GWS, in 2015 and 2016, respectively. During and after her OFDM symbols transfer performance on the
radio channel based research, she published several scientific papers in
relevant journals, cited in WoS databases, as well as in the proceedings of
international scientific conferences.
Ante Mihaljević received his Bachelor’s and
Master’s degrees in Marine Electrical Engineering
and Communication Technologies from the University of Dubrovnik, Croatia, in 2016 and 2018,
respectively. Currently he is a teaching assistant at
the Department of Electrical Engineering and Computing, University of Dubrovnik. He is also a
PhD student at the Faculty of Electrical Engineering
and Computing, University of Zagreb, Croatia.
A. LIPOVAC et al.: IN-SERVICE BER BASED ESTIMATION OF OFDM PAPR AND CFO-INDUCED PEAK PHASE DEVIATION 51