Page 1
1
In silico pace-mapping: prediction of 1
left vs right outflow tract origin in 2
idiopathic ventricular arrhythmias with 3
patient-specific electrophysiological 4
simulations 5
6
7
Ruben Dostea,∗, Rafael Sebastianb , Juan Francisco Gomezc , David Soto-Iglesiasd , Alejandro Alcainea , 8
Lluis Monte , Antonio Berruezod , Diego Penelad , Oscar Camaraa9
10
11
12
a Physense, Department of Information and Communication Technologies, Universitat Pompeu Fabra, 13
Barcelona, Spain 14
b Computational Multiscale Simulation Lab (CoMMLab), Department of Computer Science, Universitat 15
de Valencia, Valencia, Spain 16
c International University of Valencia (VIU), Valencia, Spain 17
d Heart Institute, Teknon Medical Center, Barcelona, Spain 18
e Department of Cardiology, Unitat de Fibril·lacio Auricular (UFA), Hospital Clínic, Universitat de 19
Barcelona, Barcelona , Spain 20
21
22
23
*Corresponding author24
Email address: [email protected] (Ruben Doste) 25
Tel: +34 636593577 26
Address: Departament de Tecnologies de la Informació i les Comunicacions 27
Roc Boronat, 138 08018 Barcelona, Spain (office 55.121) 28
29
Page 2
2
Abstract 30
31
Aims: A pre-operative non-invasive identification of the site of origin (SOO) of outflow tract 32
ventricular arrhythmias (OTVAs) is important to properly plan radiofrequency ablation procedures. 33
Although some algorithms based on electrocardiograms (ECG) have been developed to predict left 34
versus right ventricular origins, their accuracy is still limited, especially in complex anatomies. The aim 35
of this work is to use patient-specific electrophysiological simulations of the heart to predict the SOO in 36
OTVA patients. 37
Methods and results: An in silico pace-mapping procedure was designed and used on eleven heart 38
geometries, generating for each case simulated ECGs from twelve clinically plausible SOO. 39
Subsequently, the simulated ECGs were compared with patient ECG data obtained during the clinical 40
tachycardia using the 12-lead correlation coefficient (12- lead ρ). Simulated ECGs that had virtual sites 41
close to the ablation points that stopped the arrhythmia presented higher correlation coefficients. 42
Additionally, we computed the LV/RV ratio for each patient, obtained by dividing the average 12-lead ρ 43
value of the LV- and RV-SOO simulated ECGs, respectively. The LV/RV ratio correctly predicted LV vs 44
RV SOO in 10/11 cases; 1.07 vs 0.93 p < 0.05 for 12-lead ρ. 45
Conclusion: The obtained results demonstrate the potential of the developed in silico pace-mapping 46
technique to complement standard ECG for the pre-operative planning of complex ventricular 47
arrhythmias. 48
49
Keywords: in silico pace-mapping, radiofrequency ablation, electrophysiological simulations, 50
outflow tract ventricular arrhythmia 51
52
53
54
55
56
57
Page 3
3
What’s new? 58
Patient-specific electrophysiological models realistically simulate important ECG features in59
outflow tract ventricular arrhythmias such as the QRS transition, lead I polarity, or notching. 60
61
Classification between LV and RV site of origin (SOO) can be performed by comparing the62
simulated and real patient 12-lead ECG. 63
64
The in silico pace-mapping technique presented here can be used to support65
66
67
68
69
70
71
72
73
74
75
76
77
78
79
80
81
82
83
84
85
electrophysiologists in finding the SOO pre-operatively.
Introduction
The estimation of the site of origin (SOO) location in outflow tract ventricular arrhythmias (OTVAs) is an
important step before radiofrequency ablation (RFA) procedures since it affects the planning and
timing of the ablation, the risk e valuation, and the catheter approach. The prediction of the SOO is
usually made pre-operatively from the visual inspection of the 12-lead electrocardiogram, whose
different patterns have information about the arrhythmic exit site and the plausible SOO [1, 2, 3].
During RFA intervention, the SOO is normally identified analysing the local activation maps obtained
from electroanatomical mapping (EAM) data or by a pace-mapping technique. Right ventricle outflow
tract (RVOT) origin has been reported to be the most common site (∼75%) [1], although recent studies
suggest that left ventricle outflow tract (LVOT) has an incidence of nearly 50% of the OTVA cases [4].
Additionally, epicardial SOO are 15% of the LVOT arrhythmias and generally come from the left
ventricular summit [2]. Other anatomical structures where LVOT arrhythmias can emerge are the distal
coronary sinus, the aortic root or the aorto-mitral continuity [3]. Note that the earliest activated point
detected in an electroanatomical map would correspond to the arrhythmic exit site, and not the so-
called SOO. However, in this work we adopted the broadly used term SOO, which in our study exactly
matches the arrhythmic exit site.
Estimating the SOO from the ECG pre-operatively is often a difficult task due to the complex anatomy
of the outflow tracts, which leads to ECG patterns that may not provide enough information to discern
between left and right origins. Several studies have proposed algorithms to predict the SOO based on 86
Page 4
4
87
88
89
90
91
92
93
94
95
96
97
98
99
100
101
102
103
104
105
106
107
108
109
110
111
112
113
114
115
standard ECG recordings of the patient, which are mainly based on the existence of transitions in the
precordial leads and the amplitude of the QRS [2]. Some of these algorithm-derived indices include the
R-wave duration and R/S amplitude ratio indices [5], the V2 transitional ratio [6] and the V2S/V3R [7]
indices. These studies particularly stressed the relevance of having incorrect ECG lead placement since
it would affect the morphology of the ECG signal and therefore algorithm performance. Other studies
[8, 9] proposed to modify some of the standard precordial lead positions to improve the accuracy of
the ECG-based predictions. In particular, moving leads V5 and V6 to more posterior locations (V7, V8,
V9) [8], or modifying leads V1 and V2 [9], seems to provide more information about the wave
propagation and to increase the effectiveness of the prediction. Some not ECG-based approaches
have also shown good accuracy (>90% sensitivity, >80% specificity), in differentiating RVOT vs LVOT
origins using indices such as the aorto- pulmonary valvular planar angulation [4] or the area and
longitudinal/perpendicular ratio of the 10 ms isochronal activation pattern in the RVOT [10] obtained
from the patient’s EAM. However, these algorithms present several drawbacks. All the ECG-based
algorithms show good results in their original publication (>80% sensitivity, >80% specificity [1]), but
their accuracy highly decrease when tested with different populations, especially when applied to
patients with V3 transition [4], which are approximately the 40% of OTVA patients.
We hypothesized that personalized multi-scale electrophysiological simulations of the heart could
provide added value to the electrophysiologists for the pre-operative non-invasive localization of the
SOO in OTVA patients. Personalized electrophysiological simulations have already shown promising
results to support clinical decision-making in cardiology [11]. In order to reach clinical use, simulation of
the ECG arises as a fundamental step since it is the most common non-invasive signal used in clinical
practice. Although several works have been focused on performing electrophysiological simulations, only
a small portion of them have tried to simulate and compare patient-specific ECGs [12, 13]. Moreover,
simulations of cardiomyopathies where RV or OT structures have a crucial role are scarce due to the
difficulties to get good anatomical and functional data in these regions, including cardiomyocyte
orientation and EAM characterization.
Therefore, we propose a modelling pipeline based on 3D anatomical models of the heart personalized
from patient’s CT images where regional tissue characterization (cardiomyocyte orientation, tissue
conductivity) is based on population data. Multi-scale biophysical models of cardiac electrophysiology
can be used to simulate the electrical activity from cell to body scale obtaining the in silico patient ECG. 116
Page 5
5
117
118
119
Using that approach we have performed a retrospective computational study on 11 patients where we
have virtually performed a pace-mapping procedure, by simulating surface ECGs from most frequent
ectopic focus location, and have compared the QRS of these ECGs with the patient clinical ECG to
identify the most likely SOO. 120
121
122
123
124
125
126
127
128
129
130
131
132
133
134
135
136
137
138
139
140
141
142
143
144
145
Page 6
6
146
147
148
149
150
151
152
153
154
155
156
157
158
159
160
161
162
163
164
165
166
167
168
169
170
171
172
173
Methods
General Overview
The methodology to simulate the in silico pace-mapping process is illustrated in Figure 1. Medical data
from eleven OTVA patients obtained pre- and post-ablation were used to construct the models in which
electrophysiology simulations were performed. Firstly, patient-specific biventricular geometrical models
were built from segmentations of CT stacks. Next, the 3D models were meshed, and cardiomyocyte
orientation was assigned using the outflow tract rule-based method (OT-RBM) [14], a mathematical
model that reproduces cardiomyocyte orientation in the ventricles and OTs observed in histological data.
A total of 12 electrophysiological simulations were carried out in each geometry based on the most
frequent ectopic SOO according to clinical reports [15]. Simulated electrical activity was interpolated
from the biventricular model to the torso surface, where the simulated ECG was computed. Finally,
several indices were calculated to quantify the accuracy of the prediction when comparing with ablation
sites.
Clinical Data
Patient-specific biventricular geometries were reconstructed from the processing of CT images that
corresponded to eleven patients with idiopathic OTVAs submitted for ablation procedure at Hospital
Clínic de Barcelona. A multidetector CT ECG-gated study was performed on a 128 x 2 -slice CT scanner
(Somatom Definition Flash, Siemens Healthcare, Erlangen, Germany). Images were acquired during an
inspiration breath-hold using a retrospective ECG-gating technique with tube current modulation set
between 50% and 100% of the cardiac cycle. The isotropic spatial resolution was 0.4 x 0.4 x 0.4 mm.
All patients underwent a RFA procedure. The study was approved by the local ethics committee and
written informed consent was obtained from all participants. EAM was acquired by CARTO 3 navigation
system (Biosense Webster, Diamond Bar, CA) with a 3.5 mm irrigated tip catheter (NaviStar, Biosense
Webster). Anti-arrhythmic drugs and beta-blockers were discontinued for 5 half-lives prior to the
procedure. No patient received isoproterenol during mapping. During the procedure, 12-lead surface
ECG and intracardiac recordings were obtained and displayed by an electrophysiology data acquisition
system (Bard LabSystem, CR Bard Inc, Lowell, MA; or EP-Tracer, CardioTek, Maastricht, The
Netherlands). Ablation was considered successful if the targeted OTVA was eliminated and it was non-174
Page 7
7
eliminated the OTVA was 175 inducible after isoproterenol infusion. The site where RFA application
considered the SOO and was labelled and saved in the EAM data. 176
177
178
179
180
181
182
183
184
185
186
187
188
189
190
191
192
193
194
195
196
197
198
199
200
201
202
203
3D model construction
Biventricular geometries were generated from CT images as described in Supplementary Appendix 1.
Cardiomyocyte orientation, which determines the preferential electrical wave propagation, was included
in the model using the OT-RBM methodology [14]. This method creates detailed cardiomyocyte
orientation in regions that play a key role in the OTVAs such as the outflow tracts, RV and the inter-
ventricular septum according to histological information. Conduction velocity along cardiomyocyte
direction was 0.68 m/s and 0.26 m/s in transverse direction. More information can be found in
Supplementary Appendix 1.
A 3D torso model was used to simulate body surface potential maps (BSPMs) that represent the
electrical activity at body scale after the propagation of the electrical wave originated in the heart. The
torso mesh included the principal organs and anatomical structures, as can be seen in Figure 1. For
each patient, the original heart in the torso model was replaced by the particular patient-specific heart.
Electrophysiological modelling and simulation experiments
A total of twelve simulations were performed in each of the eleven patient-specific geometries. Detailed
information of the electrophysiological modelling and the simulation procedure can be found in
Supplementary Appendix 1. In each simulation the origin of the ectopic focus was changed according
to the most common SOO found in clinical studies [3, 15]. OTVAs were first simulated at the organ level
(biventricular model) from which resulting transmembrane potentials were used to calculate the BSPM
and ECGs. A mesh node placed in the ectopic focus was stimulated, obtaining a 300 ms OTVA
simulation of the ventricular depolarization. For each patient, seven and five ectopic foci had left and
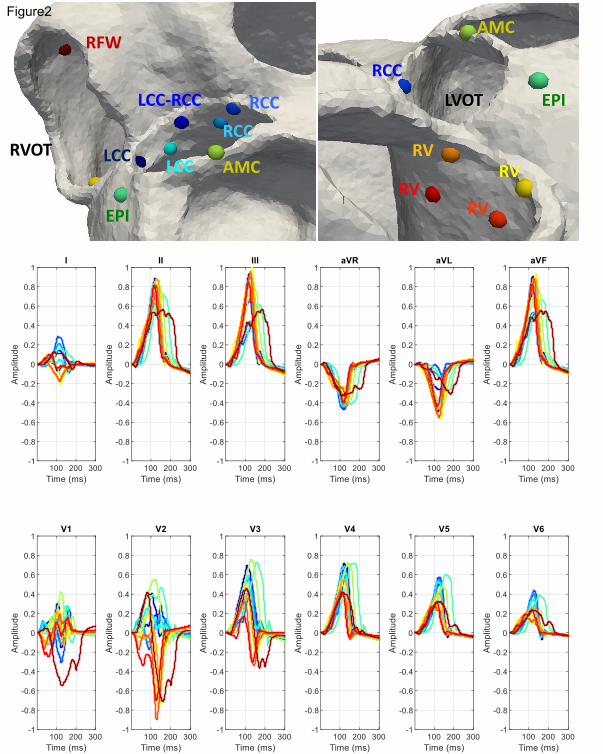
right ventricle SOO, respectively, as can be observed in Figure 2. The number and location of these
points were chosen according to clinical observations [3, 15]. The seven LV-SOO (blue and green
colours in Figure 2) were distributed as follows: two in the left coronary cusp (LCC), two in the right
coronary cusp (RCC), one in the LCC-RCC commissure, one in the aorto-mitral continuity (AMC) and
one in the LV summit, at the epicardium. The five RV-SOO (red, orange and yellow colours in Figure 2) 204
Page 8
8
were distributed as follows: four in the septal side of the RV, including two in the posteroseptal RVOT 205
and two in the anteroseptal RVOT, as well as one in the free-wall. Points in the same region were placed 206
in two different apicobasal levels; one just below the pulmonary or aortic valve, and the other at 207
208
209
210
211
212
213
214
215
216
217
218
219
220
221
222
approximately 1 cm below the valves. In the end, a total of 132 simulations were carried out.
ECGs were obtained by selecting the electrical potential of the closest torso mesh nodes to standard
12-lead ECG electrode location, as depicted in Figure 1. In addition, in order to include variability to the
results and replicate possible lead misplacement and different heart-torso orientations, 13 different
precordial lead configurations were used for each simulation scenario, slightly moving each electrode
position between the different configurations within a range of 2 cm (see supplementary Figure S1.2).
For visualization purposes, only the simulated ECGs obtained with the original lead configuration are
represented in the Figures. A 12-lead ECG with a duration of 300 ms was then obtained for each SOO
(12 sites) and lead configuration (13) for each geometry (11 patients), resulting in a total of 1716
simulated 12-lead ECGs.
Metrics and experiments for the comparison of simulated ECGs
Simulated QRS complexes of the ECGs were quantitatively compared with patient-specific ECGs using
the correlation coefficient (ρ) metric. The expression of the ρ metric for two signals X and Y is given by:
223
𝜌 =∑ (𝑋𝑖 − ��)(𝑌𝑖 − ��)𝑛
𝑖=1
√∑ (𝑋𝑖 − ��)2𝑛𝑖=1 ∑ (𝑌𝑖 − ��)2𝑛
𝑖=1
224
225
226
227
228
229
230
231
where signals are equally sampled with n points and X represents the average of all X samples. In our
application, ρ was independently computed for each lead of the ECG signals, comparing simulated and real data.
Additionally, we also estimated the 12-lead correlation coefficient (12-lead ρ) metric by averaging each
individual lead-based ρ values using the Fisher Z-transformation. This score, which has been previously
proposed for ECG signal comparison [13], returns a number for every two 12-lead ECG comparison,
being 1 when the waveforms are identical.
Signal processing was carried out using the MATLAB software (MathWorks, Natick, MA). For
visualization purposes, all (simulated and patient-specific) 12-lead ECGs were normalized in amplitude 232
Page 9
9
233
234
235
236
237
238
239
240
241
242
243
244
245
246
247
248
249
250
251
252
253
between -1 to 1, which corresponded to the minimum or maximum values of the 12-lead ECGs,
respectively. Prior to calculating the 12-lead ρ metric, QRS complexes were manually extracted for each lead of
the real patient ECGs. Then, signals were aligned by maximizing the value of the cross-correlation
between the real patient signal and the simulated ones. Next, the 12-lead ρ metric was calculated for
each simulation case. Since our simulations were carried out using 13 different lead configurations,
only the maximum 12-lead ρ score was chosen among the (13) possible ones in each case. We also derived a LV/RV
ratio in order to determine the LVOT vs RVOT origin in each patient: it was calculated by dividing the mean of
the ρ values of all the LV-SOO simulations by the one corresponding to the RV-SOO simulations. A LV/RV
ratio larger and smaller than 1 will indicate a LVOT and RVOT origins, respectively.
For validation purposes, the QRS complexes of the simulated 12-lead ECGs were initially qualitatively
compared with patterns found in the literature for different SOO. We then used the correlation
coefficient ρ to quantitatively compare the simulated and real ECG data. The LV/RV ratio was derived from the 156
calculated 12-lead ρ in each patient. Classification into LV or RV SOO (in silico based SOO assignment to
each patient) was performed using the LV/RV ratio, while the maximum 12-lead ECG ρ value was used
for a more detailed location of the SOO. Alternative metrics such as the ratio of the maximum LV and
RV 12-lead ρ or rankings according the maximum 12-lead ρ of each SOO were also studied for
classification between LV and RV. The assigned simulation-based SOO label was finally evaluated
against the clinically found SOO, which was determined during the RFA intervention. The EAMs
acquired during the ablation treatment for each patient were used to analyse the LAT isochrones at
different cardiac cycle time points and were visualized together with the simulated isochrones.
Statistical comparisons were made using a Student t-test; a p value ≤ 0.05 was considered statistically
significant. 254
255
256
257
258
259
260
261
262
Page 10
10
263
264
265
266
267
268
269
270
271
272
273
274
275
276
277
278
279
280
281
282
283
284
285
286
287
288
289
290
Results
Qualitative analysis of ECG features in simulated signals
Figure 3 shows the simulated ECG signals with the 12 different SOO of one of the studied patients
(Patient 11), which will be used to visually analyse and identify the typical ECG features characteristic
for each SOO according to literature [1, 2, 3]. A complete set of simulated ECG signals for the
11 biventricular geometries studied in this work can be found in Supplementary Appendix 2. The
following observations were found for the different SOO:
LCC. The simulated ECG signals with LCC-SOO (Figure 3, columns 1 and 5) present a multi-phasic
(or notched M- or W-shaped) V1 lead, which is the main morphological ECG feature for this SOO;
moreover, they have narrower QRS complexes than RCC-SOO (columns 3 and 4 of the figure);
other features properly simulated include a large R wave amplitude, negative lead I, aVR and aVL
leads as well as an early precordial transition in V1-V2.
LCC-RCC. This type of SOO is usually characterized by a QS notch in the downward deflection in V1,
which is not clearly observable in the simulated signals of Patient 11 (Figure 3, column 2); clearer
examples of this ECG feature can be found in other studied cases (see Patient 2, Patient 4, Patient 5,
Patient 9 in Supplementary Appendix 2); on the other hand, it correctly shows a transition in V2-V3
and an Rs wave in lead I.
RCC. As expected, the simulated ECG signals with RCC-SOO (Figure 3, columns 3 and 4) have a
precordial transition in V2-V3, slightly later than LCC-SOO in the same case; they also present a
positive lead I, with large R waves in II and III, an rS pattern in V1 and a broad R-wave in V2, as it is
common in this type of SOO.
AMC. An AMC-SOO is usually identified by a positive precordial concordance and no S wave in V6 as
well as with a qR pattern V1. Those features appear in the simulated signal with this SOO (Figure 3,
column 6); however, we need to be cautious on any ECG feature from the V1-V2 leads in this particular 291
Page 11
11
case, since they present a non-negligible level of noise that make them difficult to interpret; finally, an R 292
or Rs pattern is seen in lead I, as expected. 293
294
295
296
297
298
299
300
301
302
303
304
305
306
307
308
309
310
311
312
313
314
315
316
317
318
319
320
Epi / LV summit. This type of SOO should present a V2 lead pattern break that cannot be appreciated
in our simulations (column 7 in Figure 3); moreover, the expected rS/QS pattern is not found in V1; on
the other hand, lead I is rightly negative, aVL is more negative than aVR and we can observe a larger
R-wave in lead III compared to II.
RV, anteroseptal RVOT. As expected, the precordial transition in this RV-based SOO occurs in V3,
later than in LV-based SOO; in addition, lead I for this particular SOO (Figure 3, columns 8 and 10)
shows a negative S pattern and we can appreciate a larger Q-wave aVL/aVR ratio. A negative QS
pattern in the aVR and positive R wave in the inferior leads are also obtained.
RV, posteroseptal RVOT. The main morphological ECG feature to identify a posteroseptal RVOT
origin against an anteroseptal RVOT origin, is a positive R wave in lead I, which is correctly captured in
our simulations (Figure 3, columns 9 and 11). In addition, posteroseptal RVOT ECG signals show a
later precordial transition (≥ V3).
RV free wall, anterior. Finally, the simulated ECG signals corresponding to this SOO, shown in the
last column of Figure 3, present a late precordial transition in V4 and a wide QRS with inferior
notching, as expected; inferior leads also have a smaller amplitude than in other RVOT septal origins.
However, it is not obvious to confirm if our simulations can replicate some secondary ECG patterns,
sometimes associated to this SOO, such as a negative lead I or an rS pattern in V1.
Qualitative comparison of simulated and measured electrophysiological data
We analysed the 156 simulated ECGs obtained for each patient, comparing them with the corresponding
recorded ECG and EAM studies. Figure 4 shows a visual comparison of the simulated and recorded
ECGs for a couple of patients with clinically confirmed LV-SOO (Patient 2) and RV-SOO (Patient 7)
cases. Simulated ECG signals corresponding to RV-SOO and LV-SOO are uniformly coloured in red and
blue, respectively, while the recorded ECG is represented as a black line. The visual inspection of 321
Page 12
12
322
323
324
325
326
327
328
329
330
331
332
333
334
335
336
337
338
339
340
341
342
343
344
345
346
347
348
349
350
recorded ECG data of Patient 2 in Figure 4 confirms the multi- phasic waveform in the V1 lead that is
characteristic of a LCC-SOO. Simulations from LV-SOO (blue curves) also present negative and positive
polarity curves in this lead when compared with RV-SOO signals that are predominantly negative. The
recorded ECG data clearly shows a V3 transition. The obtained simulations also provided a precordial
transition on LV SOO of V3 (blue colour), whereas RV-based ones (red colour) definitively changed
polarity in V4. The equivalent analysis for Patient 7 (RV origin), also shown in Figure 4, confirms that
the simulated ECG signals from the actual ventricular origin are more similar to the clinical ECGs than
those from the other ventricle. For instance, a better matching of RV-SOO curves (in red) with real ECG
(black curve) can clearly be seen in lead 1 (negative polarity) than with LV-SOO ones. Moreover, the
clinical ECG data suggest a precordial transition in V4, while simulated LV-SOO curves (in blue) are
already predominantly positive in V3; on the contrary, several simulated RV-SOO curves show a
significant negative polarity in V3, suggesting a transition in V4. It can easily be appreciated a better
matching of real data with RV-SOO curves (red colour), compared to LV-SOO ones (blue colour) in other
leads such as V2.
The same conclusions can be drawn from the visual comparison of measured and simulated LAT
isochronal maps. Figure 5 depicts the 60 ms and 120 ms isochronal maps (left and right column,
respectively) that represent the electrical wave propagation in the biventricular geometry of Patient 2.
The EAM acquired during the ablation treatment is located in the top panel A, whereas the equivalent
simulations with a LV and RV-SOO are in the middle B and bottom C panels in Figure 5, respectively.
Red and pink colours indicate the earliest and the latest activated points, respectively. It can be seen
that LCC-SOO simulated isochrones (B) have closer morphological characteristics than RV-SOO ones
(C). Notably, the latter shows a more anisotropic behaviour due to longitudinal cardiomyocyte orientation
in the RV pointing to the outflow tract.
Prediction of the site of origin estimating the similarity between simulated and real ECGs
The validation metrics presented in the Methods section help to quantify the accuracy of the developed
modelling pipeline for the prediction of the ventricular origin of the ectopic foci in OTVAs. Table 1 shows
the average and standard deviation of the 12-lead ρ between the clinical and the simulated QRS
complexes of the ECGs for LV-SOO and RV-SOO (Sim LV SOO and Sim RV SOO in the table) for each
patient. Additionally, the LV/RV ratio that indicates the predicted ventricular origin (> 1 for LV-SOO; RV-351
Page 13
13
352
353
354
355
356
357
358
359
360
361
362
363
364
365
366
367
368
369
370
371
372
373
374
SOO otherwise) is also included. It can be seen in Table 1 that the modelling pipeline correctly predicted
the ventricular origin in 10/11 cases (91%). Only Patient 6 was incorrectly labelled from the simulations
as RV-SOO, which clinically a RCC-LV SOO was found. All patients presented significant statistical
differences between the average 12-lead correlation coefficient for RV-SOO vs LV-SOO (p<0.05). In
general, the LV/RV ratio of clinically-determined LV-SOO was higher than those originated from the
RV: 1.07 vs 0.93, respectively; p < 0.05.
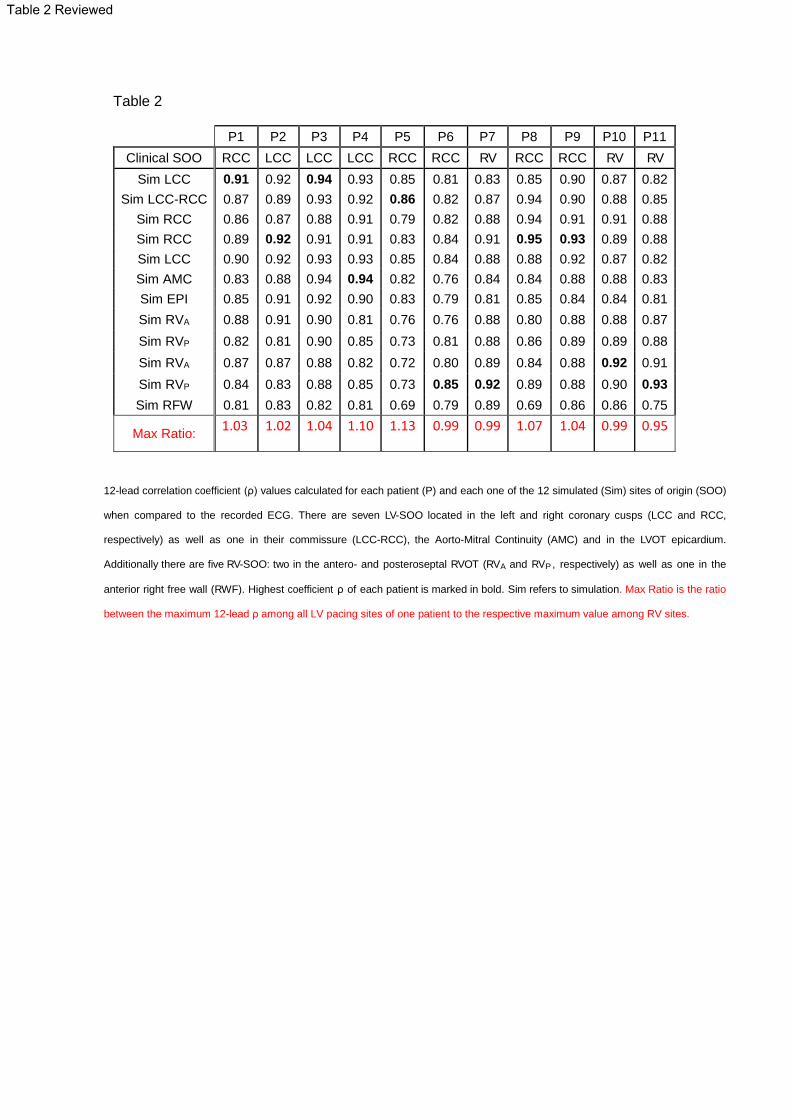
In order to achieve a more precise localization of the SOO within each ventricular outflow tract, not only
the LV vs RV origin, results of the maximum 12-lead ρ in each simulation were computed (see Table 2).
The highest score per patient represent the most similar signal compared to the patient clinical ECG,
which is marked in bold. Using a straightforward approach for classification based on the correlation
coefficient values, i.e. labelling each case only based on the highest ρ value per SOO, the modelling
pipeline correctly predicts the exact localization of the clinical SOO in 7/11 cases (64%). More
specifically, the 3 RV-SOO cases were rightly predicted (100%), while labels for the LCC and RCC SOO
were the most difficult to classify: the correct prediction of LCC-SOO occurred in only 1/3 cases (33%)
and in 3/5 for RCC-SOO (60%). The results presented in Table 2 were also used to find new indexes
for the classification between LV and RV SOO. A new ratio using the values of the Table 2 (maximum
12-lead ρ for each simulated SOO) is also able to classify the same 10 out of 11 patients between LV and RV
SOO. Furthermore, a ranking of these 12-lead ρ is represented in Table S1.1 of Supplementary
Appendix 1, together with the geodesic distance between points. The evaluation of the results
presented in Table S1.1 shows that at least two of the three highest 12-lead ρ are placed in the correct
ventricle in each patient. A detailed analysis to the geodesic distance also reveals that some of the
incorrect predictions corresponded to simulations with the SOO located very close to the SOO clinically
determined from the EAM (Patient 1, 2 and 4). In addition, the ρ values of the clinical and wrongly
predicted SOO were very similar, with differences lower than 0.02 in all incorrect cases. 375
376
377
378
379
380
381
Page 14
14
382
383
384
385
386
387
388
389
390
391
392
393
394
395
396
397
398
399
400
401
402
403
404
405
406
407
408
409
410
Discussion
We have presented a modelling pipeline for in silico determination of the site of origin in OTVAs, with a
good LV vs RV SOO classification performance (91% in 11 cases). The methodology has potential to be
used in the future, in combination with other computational techniques and indices, to support clinical
decisions on this type of patients, in particular for pre-operative planning of radiofrequency ablation
treatment.
The obtained simulation results, thoroughly described for some illustrative cases in the Results section
and listed for all the studied patients in Supplementary Appendix 2, are in close agreement with clinical
descriptions reported in the literature [1, 2, 3] for most scenarios. Performing multi-scale (cell to body
scale) electrophysiological simulations on eleven different patient-specific biventricular geometries and
with 12 different SOOs, covering the most frequent OTVA anatomical locations, has never been done
before. It is difficult to obtain the necessary clinical data for model building and validation, as well as
developing the appropriate tools and knowledge necessary to create realistic simulations. To get to
this point, we needed to develop a modelling pipeline to process patient-specific data and generate
the required finite-element meshes. More importantly, OTVA simulations were only possible due to the
use of the OT-RBM method to include realistic cardiomyocyte orientation in the OTs and guiding the
electrical wave propagation and thus, the ECG simulations. It has been shown that the specific OT
cardiomyocyte orientation generated by the OT-RBM is needed in order to have simulated electrical
patterns in the OTs closer to the ones measured with EAM data [14]. In addition, some authors [12, 13,
16] have confirmed good quality patient-specific geometry and cardiomyocyte orientation as key aspects
for realistic electrophysiological and electrocardiogram simulations.
As seen in Supplementary Appendix 2 the different QRS complexes of the simulated ECGs presented
great variability due to the use of different patient geometries and SOOs. Most key morphological ECG
features for each SOO were well captured in the simulations, especially the correct SOO-dependent
precordial transition. Still, some complicated and less well-defined SOO such as the AMC and the LV
summit could be better simulated with our pipeline. Furthermore, in some cases certain leads
presented artefacts preventing a reliable identification of ECG features (e.g. lead V1 in Patient 11, as it
can be seen in Figure 3). However, even with the limitations of the modelling pipeline, the proposed
evaluation metrics such as the correlation coefficient ρ showed a very good agreement between
simulated and
411
Page 15
15
412
413
414
415
416
417
418
419
420
421
422
423
424
425
426
427
428
429
430
431
432
433
434
435
436
437
438
439
440
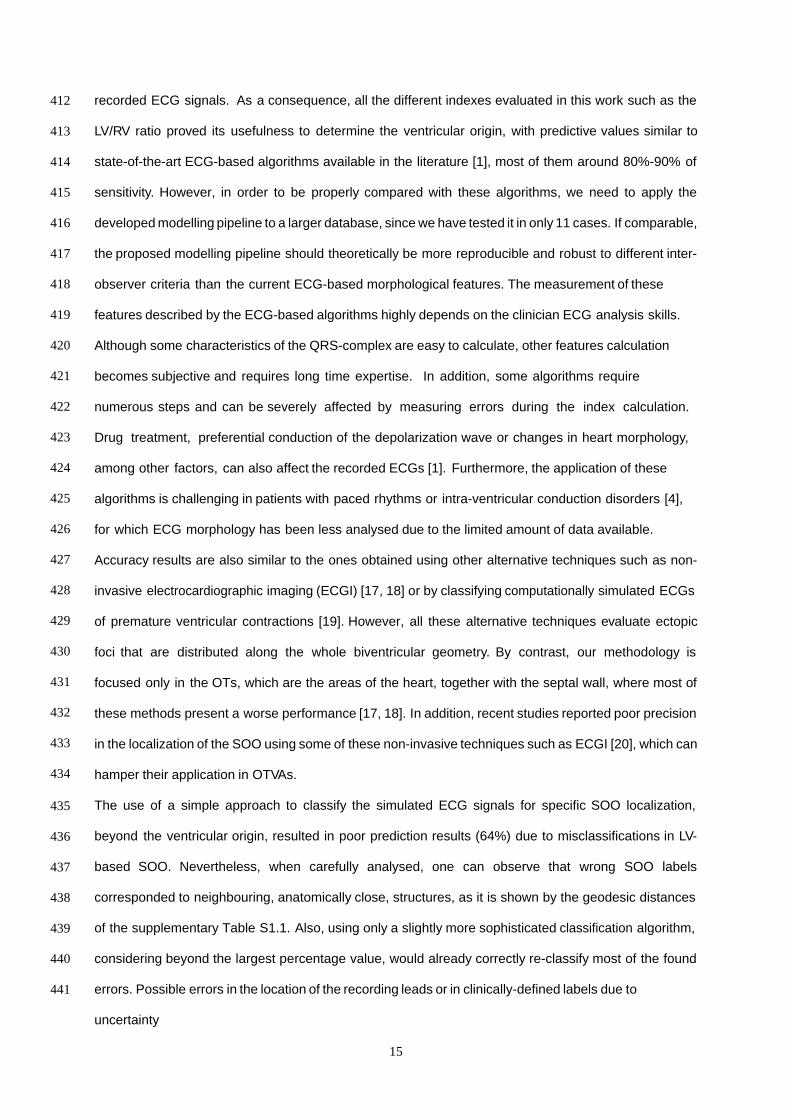
recorded ECG signals. As a consequence, all the different indexes evaluated in this work such as the
LV/RV ratio proved its usefulness to determine the ventricular origin, with predictive values similar to
state-of-the-art ECG-based algorithms available in the literature [1], most of them around 80%-90% of
sensitivity. However, in order to be properly compared with these algorithms, we need to apply the
developed modelling pipeline to a larger database, since we have tested it in only 11 cases. If comparable,
the proposed modelling pipeline should theoretically be more reproducible and robust to different inter-
observer criteria than the current ECG-based morphological features. The measurement of these
features described by the ECG-based algorithms highly depends on the clinician ECG analysis skills.
Although some characteristics of the QRS-complex are easy to calculate, other features calculation
becomes subjective and requires long time expertise. In addition, some algorithms require
numerous steps and can be severely affected by measuring errors during the index calculation.
Drug treatment, preferential conduction of the depolarization wave or changes in heart morphology,
among other factors, can also affect the recorded ECGs [1]. Furthermore, the application of these
algorithms is challenging in patients with paced rhythms or intra-ventricular conduction disorders [4],
for which ECG morphology has been less analysed due to the limited amount of data available.
Accuracy results are also similar to the ones obtained using other alternative techniques such as non-
invasive electrocardiographic imaging (ECGI) [17, 18] or by classifying computationally simulated ECGs
of premature ventricular contractions [19]. However, all these alternative techniques evaluate ectopic
foci that are distributed along the whole biventricular geometry. By contrast, our methodology is
focused only in the OTs, which are the areas of the heart, together with the septal wall, where most of
these methods present a worse performance [17, 18]. In addition, recent studies reported poor precision
in the localization of the SOO using some of these non-invasive techniques such as ECGI [20], which can
hamper their application in OTVAs.
The use of a simple approach to classify the simulated ECG signals for specific SOO localization,
beyond the ventricular origin, resulted in poor prediction results (64%) due to misclassifications in LV-
based SOO. Nevertheless, when carefully analysed, one can observe that wrong SOO labels
corresponded to neighbouring, anatomically close, structures, as it is shown by the geodesic distances
of the supplementary Table S1.1. Also, using only a slightly more sophisticated classification algorithm,
considering beyond the largest percentage value, would already correctly re-classify most of the found
errors. Possible errors in the location of the recording leads or in clinically-defined labels due to
uncertainty
441
Page 16
16
442
443
444
445
446
447
448
449
450
451
452
453
454
455
456
457
458
459
460
461
462
463
464
465
466
467
468
469
470
and current spatio-temporal resolution i n electrophysiological measurements should also be
considered. These errors could also be the cause of the misclassification of Patient 6, which presented
the lowest set of 12-lead ρ values.
One of the main limitations of the study is the lack of personalized tissue conductivities, which could
mainly affect the QRS-width. Nonetheless, we do not expect additional substantial changes in the
overall pattern of the ECG. A personalization of conductivity parameters will require a set of simulations
that will increase substantially the computational cost, making the tool more difficult to translate to the
clinics. One potential complementary alternative could be to use Eikonal-based models for performing
fast simulations of cardiac electrophysiology that allow the fast estimation of the desired parameters,
but will not be able to reproduce complex physiological states.
Furthermore, more realistic simulated ECG signals could be obtained by including a personalized torso
surface mesh or a more precise heart-torso registration, since it has been shown that torso shape can
affect the simulated ECG [16]. The simulation of the repolarization phase could also help in the
classification of the simulated ECGs.
Conclusions
We have proposed a simulation pipeline mimicking the pace-mapping process. The pipeline was used
retrospectively to predict the SOO of OTVA by simulating ECGs from different origins and comparing
the QRS section with real ECG data. Simulated ECG reproduced most of the relevant ECG features in
OTVA, according to literature. Best results were obtained for the classification of the RVOT vs LVOT
SOO, which reveals its potential to be used as a non-invasive tool to support clinical decisions prior to
RFA interventions. As a future work, we expect to exploit the pipeline extending the current set of
patients to a much larger population to be able to use more sophisticated classification algorithms
including machine learning techniques for SOO prediction based on the combination of simulated and
real ECG data. We also want to perform more simulations triggered from new SOO, especially from
the epicardium, since in this work we only considered one epicardial SOO for the tachycardias. These
new datasets can help us to further validate the pipeline, and to improve the accuracy of the classifiers
built based on the simulation data. The present study serves as an example of how computational
simulations
471
Page 17
17
can be combined with clinical expertise to face and solve different electrophysiological challenges 472
related to therapy planning and optimization. 473
474
475
476
References477
[1] Anderson RD, Kumar S, Parameswaran R, Wong G, Voskoboinik A, Sugumar H, et al. Differentiating Right- and Left-Sided478
Outflow Tract Ventricular Arrhythmias. Circulation: Arrhythmia and Electrophysiology. 2019 6;12(6):e007392. 479
480
[2] Enriquez A, Baranchuk A, Briceno D, Saenz L, Garcia F. How to use the 12-lead ECG to predict the site of origin of idiopathic481
ventricular arrhythmias. Heart Rhythm. 2019 10;16(10):1538–1544. 482
483
[3] Lerman BB. Mechanism, diagnosis, and treatment of outflow tract tachycardia. Nature Reviews Cardiology. 2015;12(10):597–484
608. 485
486
[4] Korshunov V, Penela D, Linhart M, Acosta J, Martinez M, Soto-Iglesias D, et al. Prediction of premature ventricular complex487
origin in left vs. right ventricular outflow tract: a novel anatomical imaging approach. EP Europace. 2019 1;21(1):147–153 488
489
[5] Ouyang F, Fotuhi P, Ho SY, Hebe J, Volkmer M, Goya M, et al. Repetitive monomorphic ventricular tachycardia originating from490
the aortic sinus cusp. Journal of the American College of Cardiology. 2002;39(3):500–508. 491
492
[6] Betensky BP, Park RE, Marchlinski FE, Hutchinson MD, Garcia FC, Dixit S, et al. The V2 transition ratio: A new493
electrocardiographic criterion for distinguishing left from right ventricular outflow tract tachycardia origin. Journal of the American 494
College of Cardiology.2011;57(22):2255–2262. 495
496
[7] Yoshida N, Yamada T, McElderry HT, Inden Y, Shimano M, Murohara T, et al. A novel electrocardiographic criterion for497
differentiating a left from right ventricular outflow tract tachycardia origin: The V2s/V3R index. Journal of Cardiovascular 498
Electrophysiology. 2014;25(7):747–753. 499
500
[8] Cheng D, Ju W, Zhu L, Chen K, Zhang F, Chen H, et al. V3R/V7 Index. Circulation Arrhythmia and electrophysiology.501
2018;11(11):e006243. 502
503
[9] Anter E, Frankel DS, Marchlinski FE, Dixit S. Effect of electrocardiographic lead placement on localization of outflow tract504
tachycardias. HRTHM. 2012;9(5):697–703. 505
506
Page 18
18
507
508
509
510
511
512
513
514
515
516
517
518
519
520
521
522
523
524
525
526
527
528
529
530
531
532
533
534
535
536
537
538
539
540
541
[10] Acosta J, Penela D, Herczku C, Macıas Y, Andreu D, Fernandez-Armenta J, et al. Impact of earliest activation site location
in the septal right ventricular outflow tract for identification of left vs right outflow tract origin of idiopathic ventricular arrhythmias.
Heart Rhythm. 2015;12(4):726–734.
[11] Prakosa, A., Arevalo, H. J., Deng, D., Boyle, P. M., Nikolov, P. P., Ashikaga, H, et al. Personalized virtual-heart technology
for guiding the ablation of infarct-related ventricular tachycardia. Nature Biomedical Engineering. 2018; 2(10), 732–740.
[12] Cardone-Noott L, Bueno-Orovio A, Minchole´ A, Zemzemi N, Rodriguez B. Human ventricular activation sequence and the
simulation of the electrocardiographic QRS complex and its variability in healthy and intraventricular block conditions.
EP Europace. 2016 12;18(suppl 4):iv4– iv15.
[13] Okada JI, Sasaki T, Washio T, Yamashita H, Kariya T, Imai Y, et al. Patient Specific Simulation of Body Surface ECG
using the Finite Element Method. PACE - Pacing and Clinical Electrophysiology. 2013;36(3):309–321.
[14] Doste R, Soto-Iglesias D, Bernardino G, Alcaine A, Sebastian R, Giffard-Roisin S, et al. A rule-based method to model
myocardial fiber orientation in cardiac biventricular geometries with outflow tracts. International Journal for Numerical Methods
in Biomedical Engineering. 2019 4;35(4):e3185.
[15] Kamakura S, Shimizu W, Matsuo K, Taguchi A, Suyama K, Kurita T, et al. Localization of Optimal Ablation Site of
Idiopathic Ventricular Tachycardia from Right and Left Ventricular Outflow Tract by Body Surface ECG. Circulation. 1998;p. 5–7.
[16] Minchole A, Zacur E, Ariga R, Grau V, Rodriguez B. MRI-Based Computational Torso/Biventricular Multiscale Models
to Investigate the Impact of Anatomical Variability on the ECG QRS Complex. Frontiers in Physiology. 2019;10(August).
[17] Wissner E, Revishvili A, Metzner A, Tsyganov A, Kalinin V, Lemes C, et al. Noninvasive epicardial and endocardial
mapping of premature ventricular contractions. Europace. 2017;19(5):843–849.
[18] Misra S, van Dam P, Chrispin J, Assis F, Keramati A, Kolandaivelu A, et al. Initial validation of a novel ECGI system for
localization of premature ventricular contractions and ventricular tachycardia in structurally normal and abnormal hearts. Journal
of Electrocardiology. 2018;51(5):801–808.
[19] Yang T, Yu L, Jin Q, Wu L, He B. Localization of Origins of Premature Ventricular Contraction by Means of Convolutional
Neural Network from 12-lead ECG. IEEE Transactions on Biomedical Engineering. 2017;9294(c).
[20] Duchateau J, Sacher F, Pambrun T, Derval N, Chamorro-Servent J, Denis A, et al. Performance and limitations
of noninvasive cardiac activation mapping. Heart Rhythm. 2019;16(3):435–442 542
543
544
Page 19
19
545
546
547
548
549
550
Figure Legends 551
552
553
554
555
556
557
558
559
560
561
562
563
564
565
566
567
568
569
570
571
572
573
574
575
576
Figure 1: Scheme of the proposed methodology: 1) Patient-specific geometries were created from medical
computed tomography scans. Cardiomyocyte orientation was assigned using the OT-RBM algorithm [14]; 2)
Electrophysiological simulations were run from different sites of origin (SOO) and electrocardiograms (ECGs)
were calculated after the propagation to the torso surface; 3) Simulated ECGs were compared with the patient
ECG in order to find the most similar pattern and therefore the best candidate for the SOO; 4) Suggested SOO
were then validated against the ablation site. PV: Pulmonary valve, AV: Aortic valve; LCC: Left coronary cusp;
RCC: Right coronary cusp; NCC: non-coronary cusp.
Figure 2: Top row: spheres show the 12 different locations used as site of origin (SOO) in the simulations on a
patient geometry. Seven were LV-SOO (bluish and greenish colours): 2 in the LCC and 2 in the RCC (left and
right coronary cusps, respectively), 1 in the LCC-RCC commissure, 1 in the AMC (aorto-mitral continuity) and 1
in the LV summit (at the epicardium, EPI). The five RV-SOO were distributed as follows: 4 in the septal side of
the RV, including two close (orange and yellow colours) and two distant (red colours) from the pulmonary valve,
as well as 1 in the free-wall (RFW). Second and third rows: Simulated 12-lead electrocardiogram. Each signal
colour matches with the colour of the point that represents the SOO.
Figure 3: Twelve-lead simulated signals for the 12 different sites of origin of Patient 11.
Figure 4: Comparison between the clinical patient 12-lead ECG (black) and the simulated ECGs:
curves simulated with the origin in the LV are plotted in blue color whereas RV-SOO curves are in red. Two
patients (Patient 2 and Patient 7) with different ablation sites are shown. Represented curves are not aligned
temporally.
Figure 5: Comparison of measured and simulated local activation time (LAT) isochrones in Patient 2, who had a
clinical left ventricle site or origin (LV-SOO) with a successful ablation on the left coronary cusp (LCC). Red and
pink colours indicate the earliest and the latest activated regions, respectively. First and second columns show
577
Page 20
20
the isochrones 60 ms and 120 ms after the trigger, respectively. A) LATs measured with the electroanatomical 578
map system during the ablation intervention. B) and C) Isochronal maps from electrophysiological simulations 579
with a LCC and a right ventricle site or origin (RV-SOO), respectively. The simulated electrical patterns with a LV 580
SOO (B) are more similar to the ones seen in the acquired data (A) than with a simulated RV SOO (C). 581
582
583
584
Page 21
1
RFW
RCC
LCC
LCC-RCC
EPI
AMC
EPI
AMC
RCC
RV
RV RV
RV
RCC
LCC RVOT
LVOT
Figure2
Page 23
A
C
60 ms isochrones 120 ms isochrones
B LCC SOO LCC SOO
LCC SOO LCC SOO
RV SOO RV SOO
Figure5
Page 24
CT imaging Measured ECG
SOO simulation Electrical propagation Simulated ECGs
Ablation site
Model construction
QRS comparison SOO validation
Myofiber assignation 3D Torso model
1 3 4
2
PV
PV
AV
NCC
LCCRCC
Figure 1 Revised
Page 25
CT imaging Measured ECG
SOO simulation Electrical propagation Simulated ECGs
Ablation site
Model construction
QRS comparison SOO validation
Myofiber assignation 3D Torso model
1 3 4
2
PV
PV
AV
NCC
LCCRCC
Representative Figure
Page 26
Patient 2 (LCC origin)
Patient 7 (RV origin)
Patient ECG LV SOO RV SOO
Figure4 Revised
Page 27
Table 1
Clinical RCC-LV SOO P1 P5 P6 P8 P9
Sim LV SOO 0.83±0.02 0.81±0.04 0.78±0.02 0.87±0.07 0.91±0.02 Sim RV SOO 0.75±0.02 0.71±0.02 0.82±0.04 0.84±0.05 0.89±0.02
LV/RV ratio 1.11 1.15 0.95 1.03 1.03
Clinical LCC-LV SOO Clinical RV SOO P2 P3 P4 P7 P10 P11
Sim LV SOO 0.88±0.02 0.88±0.03 0.86±0.03 0.82±0.04 0.80±0.04 0.77±0.05
Sim RV SOO 0.84±0.04 0.85±0.03 0.72±0.03 0.88±0.03 0.84±0.04 0.85±0.05
LV/RV ratio 1.05 1.04 1.19 0.93 0.96 0.91
Average and standard deviation of correlation coefficient (ρ) and left ventricle / right ventricle (LV/RV)
ratios from the simulated ECGs for each patient (P). Sim LV-SOO and RV-SOO indicate LV and RV site
of origin in the simulations, respectively. RCC-LV and LCC-LV indicate left and right coronary cusp
ectopic foci, i.e. LV-SOO. Highest values for simulated SOO of each patient are marked in bold. Bold
values for the simulated LV/RV ratio indicate agreement between the predicted SOO from simulations
and the clinical SOO.
Table1
Page 28
Table 2
P1 P2 P3 P4 P5 P6 P7 P8 P9 P10 P11
Clinical SOO RCC LCC LCC LCC RCC RCC RV RCC RCC RV RV
Sim LCC 0.91 0.92 0.94 0.93 0.85 0.81 0.83 0.85 0.90 0.87 0.82
Sim LCC-RCC 0.87 0.89 0.93 0.92 0.86 0.82 0.87 0.94 0.90 0.88 0.85
Sim RCC 0.86 0.87 0.88 0.91 0.79 0.82 0.88 0.94 0.91 0.91 0.88
Sim RCC 0.89 0.92 0.91 0.91 0.83 0.84 0.91 0.95 0.93 0.89 0.88
Sim LCC 0.90 0.92 0.93 0.93 0.85 0.84 0.88 0.88 0.92 0.87 0.82
Sim AMC 0.83 0.88 0.94 0.94 0.82 0.76 0.84 0.84 0.88 0.88 0.83
Sim EPI 0.85 0.91 0.92 0.90 0.83 0.79 0.81 0.85 0.84 0.84 0.81
Sim RVA 0.88 0.91 0.90 0.81 0.76 0.76 0.88 0.80 0.88 0.88 0.87
Sim RVP 0.82 0.81 0.90 0.85 0.73 0.81 0.88 0.86 0.89 0.89 0.88
Sim RVA 0.87 0.87 0.88 0.82 0.72 0.80 0.89 0.84 0.88 0.92 0.91
Sim RVP 0.84 0.83 0.88 0.85 0.73 0.85 0.92 0.89 0.88 0.90 0.93
Sim RFW 0.81 0.83 0.82 0.81 0.69 0.79 0.89 0.69 0.86 0.86 0.75
Max Ratio: 1.03 1.02 1.04 1.10 1.13 0.99 0.99 1.07 1.04 0.99 0.95
12-lead correlation coefficient (ρ) values calculated for each patient (P) and each one of the 12 simulated (Sim) sites of origin (SOO)
when compared to the recorded ECG. There are seven LV-SOO located in the left and right coronary cusps (LCC and RCC,
respectively) as well as one in their commissure (LCC-RCC), the Aorto-Mitral Continuity (AMC) and in the LVOT epicardium.
Additionally there are five RV-SOO: two in the antero- and posteroseptal RVOT (RVA and RVP , respectively) as well as one in the
anterior right free wall (RWF). Highest coefficient ρ of each patient is marked in bold. Sim refers to simulation. Max Ratio is the ratio
between the maximum 12-lead ρ among all LV pacing sites of one patient to the respective maximum value among RV sites.
Table 2 Reviewed
Page 29
SupplementaryAppendix 1
Click here to access/downloadSupplementary file
Doste_InSilicoPM_SupplementaryAppendix_1_Revised.docx
Page 30
SupplementaryAppendix 2
Click here to access/downloadSupplementary file
Doste_InSilicoPM_SupplementaryAppendix_2_Revised.docx
Page 31
CT imaging Measured ECG
SOO simulation Electrical propagation Simulated ECGs
Ablation site
Model construction
QRS comparison SOO validation
Myofiber assignation 3D Torso model
1 3 4
2
PV
PV
AV
NCC
LCCRCC
Graphical Abstract
View publication statsView publication stats


![In silico CD4+, CD8+ & humoral immunity associated ...In silico epitope prediction and HLA distribution analysis of HTLV-I 1515 JBUON 2018; 23(5): 1515 Sjogren’s syndrome [6]. ATL](https://static.documents.pub/doc/80x56/5ffb953e60586734ba04b701/in-silico-cd4-cd8-humoral-immunity-associated-in-silico-epitope-prediction.jpg)


