In Silico Prediction of Aqueous Solubility: A Multimodel ProtocolBased on Chemical SimilarityFlorent Chevillard,†,‡ David Lagorce,† Christelle Reynes,†,§ Bruno O. Villoutreix,† Philippe Vayer,*,∥
and Maria A. Miteva*,†
†Universite Paris Diderot, Sorbonne Paris Cite, Molecules Therapeutiques in silico, Inserm UMR-S 973, 35 rue Helene Brion, 75013Paris, France‡Institute of Pharmaceutical Chemistry, Phillips University Marburg, Marbacher Weg 6-10, 35037 Marburg, Germany§Lab. Physique Industrielle et Traitement de l’Information EA 2415, UFR Pharmacie - Univ. Montpellier 1, 15 avenue CharlesFlahault - BP 14491, 34093 Montpellier Cedex 5, France∥BioInformatic Modelling Department, Technologie Servier, 45007 Orleans cedex1, France
*S Supporting Information
ABSTRACT: Aqueous solubility is one of the most importantADMET properties to assess and to optimize during the drugdiscovery process. At present, accurate prediction of solubilityremains very challenging and there is an important need ofindependent benchmarking of the existing in silico modelssuch as to suggest solutions for their improvement. In thisstudy, we developed a new protocol for improved solubilityprediction by combining several existing models available incommercial or free software packages. We first performed anevaluation of ten in silico models for aqueous solubilityprediction on several data sets in order to assess the reliabilityof the methods, and we proposed a new diverse data set of 150molecules as relevant test set, SolDiv150. We developed arandom forest protocol to evaluate the performance of different fingerprints for aqueous solubility prediction based on molecularstructure similarity. Our protocol, called a “multimodel protocol”, allows selecting the most accurate model for a compound ofinterest among the employed models or software packages, achieving r2 of 0.84 when applied to SolDiv150. We also found thatall models assessed here performed better on druglike molecules than on real drugs, thus additional improvement is needed inthis direction. Overall, our approach enlarges the applicability domain as demonstrated by the more accurate results for solubilityprediction obtained using our protocol in comparison to using individual models.
KEYWORDS: solubility prediction, chemical structure similarity, QSPR models, multimodel optimization
■ INTRODUCTION
Aqueous solubility is one of the most important ADMET(absorption, distribution, metabolism, excretion and toxicity)properties to be optimized during the drug discovery process.1,2
Poor solubility has been identified as the cause of many drugdevelopment failures,3 and improving the aqueous solubility ofbioactive molecules is a major issue in medicinal chemistry.1−4
The rate of dissolution and permeability of drugs3 stronglydepend on its solubility. In addition, high concentrations ofpoorly soluble drugs in the human body may result incrystallization and toxicity. Recently, it has been found thatreal drugs are much more soluble5 than those druglikemolecules in the ZINC database passing Lipinski’s rule offive.1 Considering the critical role of solubility, its evaluation iscrucial in all drug discovery projects. However, measuringexperimentally the solubility for thousands and millions ofmolecules used in high throughput screening (HTS) isunrealistic6 and impossible for millions of virtual molecules
not yet synthesized but of potential interest. Therefore,prediction of solubility by in silico approaches would be highlyvaluable as it will assist the design and the prioritization of smallmolecules during the first steps of the drug discovery processbut should also be beneficial to other commercially importantcompounds such as agrochemicals.The thermodynamic solubility, denoted as S in moles per
liter, is the maximum amount of the most stable crystal form ofa compound that can remain in solution under thermodynamicequilibrium between the solid and dissolved state at a giventemperature.2 Considering the un-ionized form of the molecule,the thermodynamic solubility is stated as intrinsic solubility.Generally, thermodynamic solubility tends to be lower than
Received: April 26, 2012Revised: October 9, 2012Accepted: October 16, 2012
kinetic solubility, the latter depending on the compound crystalform or polyforms. The kinetic solubility is typically measuredin a stock solution of the compound in dimethyl sulfoxide(DMSO), from which a sequential dilution is done in water.2
Allowing sufficient time, the final form will be the most stablecrystal form, and the solubility will approach the truethermodynamic solubility. The in silico predictions addressmainly the thermodynamic solubility.Accurate prediction of the solubility is a tremendous
challenge for a large number of compounds since intermo-lecular adhesive interactions between solute−solute, solute−solvent, and solvent−solvent molecules involved in thedissolution process should be evaluated (those could bepredicted by the first principle methods).7 Thus, many differentin silico approximations have been developed aiming at fastand, in some cases, accurate estimation of aqueous solubility ofchemicals.8−12 Historically, the first models were based onexperimentally measured boiling/melting points, pKa and theoctanol−water partition coefficient (logP) values of thecompounds. The classic way was indeed to combine themelting point with logP of the un-ionized molecule using thegeneral solubility equation (GSE).13−18 This technique cannotbe applied to salt or lyophilized forms. Given that suchexperimental data are available for a limited number ofcompounds, other approaches are being developed, e.g., byusing predicted logP.7 Today the most commonly usedmethods are based on quantitative structure property relation-ship (QSPR) models allowing to correlate the aqueoussolubility with various molecular descriptors (physicochemical,topological, 2D or 3D) using mathematical models.5,19−21
Recent analyses stressed that sometimes the relationshipbetween computed descriptors and the solubility is notstraightforward22 and that the applicability domain has to beconsidered.23 Further, QSPR models need a high quality ofexperimentally measured solubility for the training sets, while itshould be borne in mind that it has been estimated that theaverage error on the experimental values of aqueous solubility isprobably more than 0.6 log unit for organic compounds.24
Altogether, the availability of proper experimental solubilitydata, the applicability domain, as well as imperfections of theemployed in silico techniques, demonstrate the need ofindependent benchmarking of the existing models and theirimprovement. Along these lines, a competition for accurateprediction of intrinsic solubility of 32 diverse druglikemolecules with uniformly measured data, as in the proposedtraining set of 100 compounds, has recently been organized,“the Solubility Challenge”.8−10
In this work, we developed a protocol that should improve insilico solubility prediction. First, we performed an evaluation often in silico models for aqueous solubility prediction on severaldata sets in order to assess the reliability of the methods. Then,we developed a random forest protocol with the goal toevaluate the performance of different fingerprints for theaqueous solubility prediction based on molecular structuresimilarity. Finally, we suggested and validated a new protocol,called a “multimodel protocol”, combining several existingmodels available in commercial or free software, which allowedfinding and selecting the most accurate model for a compoundof interest among all the available models or software packages.
■ EXPERIMENTAL SECTIONData Sets’ Preparation. Four different data sets with
available experimental values of intrinsic solubility (expressed in
molar units mol/L10) were selected for solubility models’evaluation. We used FAF-Drugs225 to remove duplicatemolecules (using canonical smiles), salts and inorganiccompounds. We performed also filtering with FAF-Drugs2for some physicochemical properties since solubility modelshave often been trained on druglike molecules5,26 (MW < 500,hydrogen bond donors (HBD) < 5, hydrogen bond acceptors(HBA) < 10, number of heavy atoms < 37, −4 < logP < 5,rotatables bonds < 15; toxic/reactive groups were notremoved). The Standardize protocol in Pipeline Pilot (www.accelrys.com/products/pipeline-pilot) with the parameterNeutralizeBondedZwitterion was used for the neutralization ofmolecules since the models assessed here predict intrinsicsolubility that requires the neutral form of molecules.5 Inaddition, the solubility software (except Pipeline) assessed hereemploy an internal standardization of the compounds. For theQikProp and VolSurf+ models using 3D descriptors, the 3Dstructures of the compounds were generated with Corina 3.4(http://www.molecular-networks.com/products/corina). Onlythe lowest energy conformation among the 20 generated oneswas kept for each molecule. In order to have differentmolecules in each data set the duplicates were removed asexplained below.
Solubility Challenge Test Set. The Solubility Challenge dataset is divided into two parts: Solubility Challenge training set of100 compounds and Solubility Challenge test set of 32compounds recently published.8−10 The main strength of thisdata set is that it contains very diverse compounds with uniformexperimental data of solubility. The intrinsic solubility wascalculated using the CheqSol approach.27 Among the 32compounds, six were removed because reliable experimentalvalues were not available. This procedure yielded 26compounds.
PhysProp. 6152 compounds were extracted from thecommercial PhysProp data set.28 After applying the FAF-Drugs2 protocol (explained above) and removing duplicateswith the Solubility Challenge test set, the number ofcompounds was reduced to 3970.
Solubility Challenge Training Set. The Solubility Challengetraining set was prepared in the same way that the SolubilityChallenge test set, but the duplicates with the PhysProp dataset were removed, reducing the number of compounds to 71.
Huuskonen. This data set has been selected from the twocommercial databases AQUASOL14,29 and PhysProp,28 and hasbeen used as training set for creation of many models.30,31 Afterapplying the FAF-Drugs2 protocol and removing duplicateswith all the other data sets, the number was decreased to 830.
Keys To Select the Most Appropriate SolubilityModel. To determine the best fingerprint for the solubilityprediction, we created models based on different molecularfingerprints using a nonparametric regression method foraqueous solubility prediction.
Random Forest Algorithm (RF). For the regression method,the Random Forest algorithm32 was chosen. The method isbased on an ensemble of decision trees, from which theprediction of a continuous variable, in this case the aqueoussolubility, is obtained as the average of the predicted values ofall trees. Each tree is an unpruned usual regression tree built ona subset of features and observations. Indeed, as the regressiontree is a deterministic method, in order to obtain different trees,perturbations are added to each tree by performing a doublerandomization on features and observations. Random Forests
were trained using the randomForest library in the statisticalcomputing environment R.33
Optimization of the Parameters for RF. Several statisticalparameters can be tuned in order to improve the learning in aRandom Forest algorithm. In this study, the most twoinfluential parameters were optimized: ntree, which is thenumber of trees used to compute the final average predictedvalue, and mtry, which is the number of variables randomlychosen to build each individual tree. Scripts from R33 wereused, and both parameters were simultaneously optimized byusing a grid search. The following ranges were proceeded: ntree,from 100 to 1000 by steps of 100, and mtry, from 20 to 200 bysteps of 10. Both parameters, ntree and mtry, were optimized foreach tested fingerprint independently.Quality Measures. Criteria To Evaluate Solubility Models.
To compare the performance of the solubility predictionmodels (solubility unit used is log(mol/L)) four criteria wereused:
r2, the squared regression coefficient for the correlationbetween experimental and predicted values;P1, the ratio of molecules with a predicted error within0.5 log (mol/L);P2, the ratio of molecules with a predicted error within 1log (mol/L);RMSE, the root mean squared error.
Molecular similarity Evaluation. Molecular similarity usedfor the multimodel protocol was evaluated using the MACCSkey fingerprints. These fingerprints were developed forsubstructure searching or for entire structure comparison.34
They code the presence or absence of 166 molecularsubstructures. As a measure of similarity between twostructures, the Tanimoto coefficient was applied, defined by
=+ −
∩
∩
NN N N
similarity A B
A B A B
where NA and NB are the numbers of bits in bitstrings A and B,respectively, and NA∩B is the number of bits which are commonbetween the two bitstrings A and B. The measure of similarityis between 0.0 and 1.0, where 1.0 indicates strict equivalence ofthe bitstrings. Using the MACCS keys, a similarity of 1.0usually means that the structures are identical (or at least veryclosely related) apart from stereochemistry, which is not takeninto account by the keys.Mean Absolute Error. In the multimodel protocol, the mean
absolute error (MAE) for a target compound A was estimatedusing the absolute prediction errors of three compounds B, Cand D (eB, eC and eD) with known experimentally measuredsolubility, which are structurally similar to compound A, usingthe following equation:
= | | + | | + | |MAE
eB eC eD3
■ RESULTS AND DISCUSSIONChemical Space of Data Sets Used for Solubility
Model Evaluation. An important criterion for this study wasthe chemical diversity of the data sets. Our study is based onfour data sets filtered for physicochemical properties importantfor druglikeness (for details see Experimental Section):Huuskonen29 (number of compounds = 830), PhysProp(www.srcinc.com) (number of compounds = 3970), and the
Solubility Challenge test (number of compounds = 26) andtraining sets (number of compounds = 71).8−10
In order to analyze the data sets’ chemical space, we used aprincipal component analysis (PCA) learned on all compoundsfrom the four data sets (4897 compounds) using the LearnMolecular PCA model available in Pipeline Pilot (www.accelrys.com). Nine properties of the compounds (molecular weight,logP, HBD, HBA, numbers of aromatic rings, rings, rotatablebonds, atoms and fragments) which are critical for solubilityprediction4,26,35 were used to compute the principal compo-nents (PC). The first two PC scores (with percentage of thevariance 51 and 12) which explain best the global variability ofthe data (63%) were selected to be presented here. In thiscontext, the compounds of each data set were then projected
Figure 1. The first two PC scores for all data sets: The dots representthe Huuskonen data set (in green), the PhysProp (in orange), theSolubility Challenge training set (in red) and the Solubility Challengetest set (in blue).
Figure 2. Representation of the 150 centroids selected for the test setSolDiv150 in the chemical space according to the two first PC scores.Blue dots represent the centroids; the orange dots represent thePhysProp data set.
together onto this subspace in order to study their diversity(Figure 1).In addition to the above-mentioned data sets, another diverse
test set was prepared for solubility evaluation, called SolDiv150,that can also be useful for other benchmark studies. This dataset contains 150 compounds from the PhysProp data setselected by clustering. The 150 centroids selected for theSolDiv150 set are shown in Figure 2, and their structures aregiven in Figure 3. These compounds were chosen because theyrepresent the chemical space of PhysProp as illustrated inFigure 2, and as centroids of the obtained diverse clusters. Theclustering protocol was performed with the MACCS keyfingerprints (see Experimental Section for details) in PipelinePilot using a maximum distance of 0.3 (the Tanimotocoefficient) within the clusters. The centroid of each clusterwas taken for the test set, if the cluster contained at least 4compounds. As seen from Figure 3 the clustering approach
allowed the selection of compounds from different chemicalseries.
Comparison of Existing Solubility Models. Ten QSPRmodels using 2D or 3D descriptors from commercial softwareor freeware available online were selected for evaluation (Table1). QSPR models do not need any experimental data for thecompound of interest but only the chemical structure of thecompounds to predict its property (here solubility). However,the application of such a model is limited to the chemical spacespanned by the compounds used to train the model, i.e., theapplicability domain. QSPR models can be based on fragment-based approaches estimating the solubility by summing up thecontribution of different fragments.7,31,36,37 Yet, distinguishingisomers and/or missing fragments can be a problem for suchmethods.5 Another type of model is based on molecularproperties’ similarity and requires various descriptor computa-tions. All tools assessed here predict the intrinsic solubility and
Figure 3. Molecular structures of the SolDiv150 data set with the experimental values of solubility taken from PhysProp. Ten molecules with anabsolute error >2.0 log unit for the solubility logS as predicted by ISIDA are highlighted by red lines.
provide values in molar units (mol/L). The results obtainedindependently on the 5 different data sets are shown for eachdata set in Table 2.According to the results, it is important to underline the fact
that there is no model that truly outperforms the others. Forinstance, ACD, ADMET Predictor and VCC lab perform wellon the PhysProp data set, but perform poorly on the SolubilityChallenge sets. Similarly, the two PP models and FAF do notperform satisfactory on both Solubility Challenge sets. In fact,most of the software do not perform very well on the SolubilityChallenge test set, stressing that the current models will have tobe improved. If we focus on the SolDiv150 set, we note that thesolubility values were poorly predicted by ISIDA (P1 = 0.33).The worst predictions for ISIDA with an absolute error for logS> 2.0 were obtained for 10 molecules underlined in red inFigure 3. In this case, all compounds were predicted to be moresoluble than the experimental data. We can distinguish 3common fragments for these molecules shown in Figure 4 thatmay have been insufficiently represented when the model wastrained. Another reason for the first two fragments could beplanarity that may not be sufficiently taken into considerationin the model, since usually the planarity of the molecules canlead to a decreased solubility.4
Overall, only the results on the Huuskonen’s data set aresatisfactory for all models, possibly because many models weretrained on these data. This observation outlines the difficulty totest models with public data because often the test sets containcompounds similar to those of the training sets and the need todevelop new freely available and clean, experimentallymeasured, solubility data sets for benchmarking.Since the performance of the assessed models significantly
varies depending on the test sets used, we decided to combineall models in an attempt to improve the accuracy of theprediction. A combination of these models could increase theeffectiveness of the prediction for new compounds by enlargingthe applicability domain due to the different training sets usedinitially to develop the different modelsMultimodel Protocol. The above presented analysis
further demonstrates the need of finding ways for improvingthe accuracy of the prediction. To this end we developed a newprotocol based on molecular structure similarity search andemploying widely used solubility prediction models asimplemented in free or commercial software. Similarity search
of compounds has already been exploited for solubilityprediction.11,46 The common idea is to select the modelwhich achieves the best solubility prediction for the mostsimilar compounds of the targeted one. Our approach bringsthe following additional improvements: an algorithmicoptimization through the implementation of a Random Forestscheme in order to find the best performing fingerprint forsimilarity search used for solubility prediction (see Figure 1S inthe Supporting Information).Keys To Select the Most Appropriate Model. In order to
choose appropriate fingerprints allowing a satisfactory molec-ular similarity search, we investigated which fingerprintsrepresented the best solubility. To address this problem,several models based on different molecular fingerprints werecreated using a nonparametric regression method for aqueoussolubility prediction, a Random Forest algorithm (see inExperimental Section for details) shown previously to besuitable for solubility prediction.47 The data set used for thetraining was the PhysProp data set with the largest number ofcompounds. Five fingerprints were compared: MACCS keys,ECFP and FCFP, both from length of 4 and 6.The PhysProp data set was split into 7 folds of 500 random
compounds, but the last, 8th fold contained the 457 remainingcompounds. To avoid overfitting and provide a robust model,which can be applied to new data, an 8-fold cross validation wasperformed. This procedure divides the data set into 8
subsamples, learns a model using 7 subsamples and tests iton the remaining set. This iterative procedure is then repeateduntil each fold has served as test set. At the end of the process,the whole sample has been used as test and it is possible tocompute the global model quality quantified by r2. Thisprocedure was repeated for each value of the parameters ntreeand mtry (see Experimental Section), and those final values that
Figure 4. Three fragments found to be badly predicted by ISIDA.
Figure 5. Schematic description of the Random Forest algorithm for the selection of the best fingerprint.
Table 3. Values of the r2, RMSE and Ratio of CorrectPrediction (P1 and P2) Obtained for Each Fingerprint
led to the maximal cross-validated r2 were chosen. Thisprotocol is illustrated in Figure 5.Finally, 5 new models, one for each fingerprint, were trained
using the same 8-fold cross validation techniques with the
optimized parameters. The results of the r2, RMSE and ratio ofcorrect prediction for each model are presented in Table 3.According to the results, the MACCS keys are best
fingerprint descriptors among the five tested for aqueoussolubility prediction, and thus we decided to choose MACCSkeys for the selection of most similar compounds in ourmultimodel protocol.
Multimodel Protocol Scheme. For a target compound, ourprotocol selects the model providing the best solubilityprediction for structurally similar compounds. We used a k =3 nearest neighbors approach based on a structure similaritymeasure. This value was chosen because we obtained the best r2
for k = 3 when varying k from 1 to 6 (tests performed on theSolubility Challenge test set as containing reliable experimentaldata; shown in Figure S2 in Supporting Information). Thethree most similar compounds are taken into account accordingto the Tanimoto similarity coefficient of 0.7 using the MACCSkeys fingerprints. A schematic description of the algorithm isgiven in Figure 6 and Figure 1S in the Supporting Information.The entire protocol was implemented in Pipeline Pilot. ThePhysProp data set was taken as a reference for the experimentalsolubility data. The protocol chooses the model achieving theminimal mean error MAE for the three reference compounds. Ifthe best chosen model exhibits a mean error of more than 1 log,no prediction is proposed. We also explored the possibility toemploy the protocol in case of absence of 3 compounds withsimilarity values of 0.7 by decreasing this barrier to 0.5.However, in such cases, the performance is not satisfactory as itis shown below. In fact, missing experimental solubility data forcompounds similar to the target molecule indicates that it maynot belong to the applicability domain and limits significantlythe applicability of the method leading to worse prediction asalready observed in ref 11.
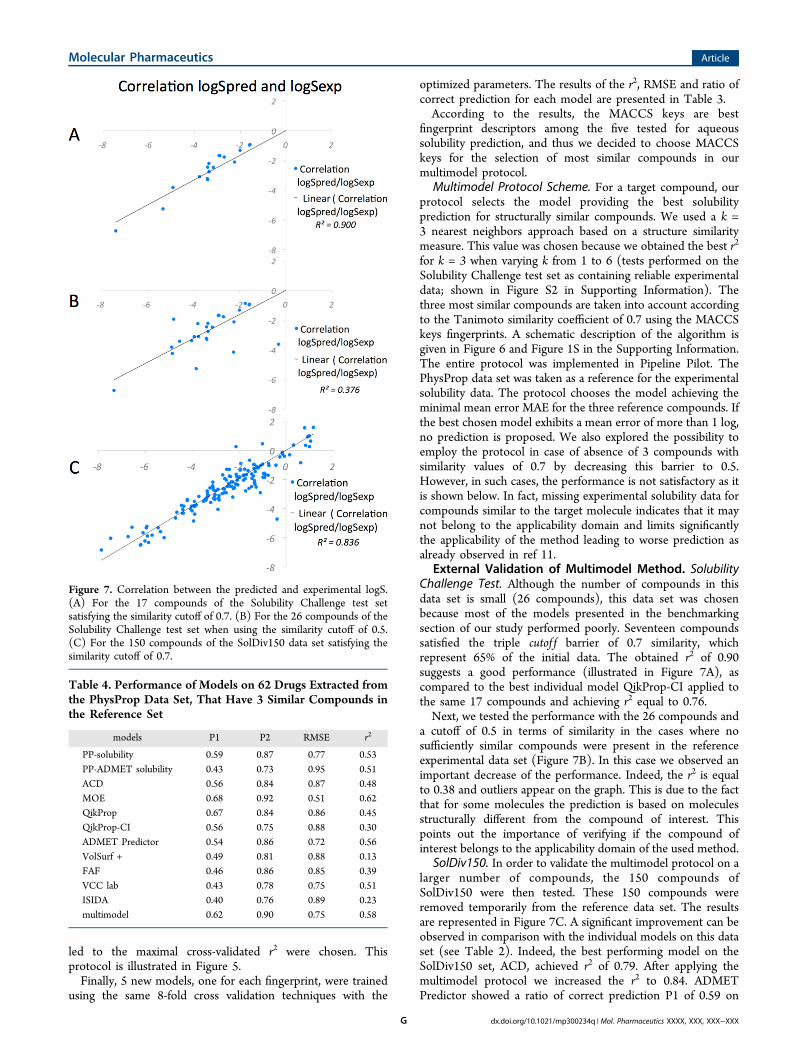
External Validation of Multimodel Method. SolubilityChallenge Test. Although the number of compounds in thisdata set is small (26 compounds), this data set was chosenbecause most of the models presented in the benchmarkingsection of our study performed poorly. Seventeen compoundssatisfied the triple cutof f barrier of 0.7 similarity, whichrepresent 65% of the initial data. The obtained r2 of 0.90suggests a good performance (illustrated in Figure 7A), ascompared to the best individual model QikProp-CI applied tothe same 17 compounds and achieving r2 equal to 0.76.Next, we tested the performance with the 26 compounds and
a cutoff of 0.5 in terms of similarity in the cases where nosufficiently similar compounds were present in the referenceexperimental data set (Figure 7B). In this case we observed animportant decrease of the performance. Indeed, the r2 is equalto 0.38 and outliers appear on the graph. This is due to the factthat for some molecules the prediction is based on moleculesstructurally different from the compound of interest. Thispoints out the importance of verifying if the compound ofinterest belongs to the applicability domain of the used method.
SolDiv150. In order to validate the multimodel protocol on alarger number of compounds, the 150 compounds ofSolDiv150 were then tested. These 150 compounds wereremoved temporarily from the reference data set. The resultsare represented in Figure 7C. A significant improvement can beobserved in comparison with the individual models on this dataset (see Table 2). Indeed, the best performing model on theSolDiv150 set, ACD, achieved r2 of 0.79. After applying themultimodel protocol we increased the r2 to 0.84. ADMETPredictor showed a ratio of correct prediction P1 of 0.59 on
Figure 7. Correlation between the predicted and experimental logS.(A) For the 17 compounds of the Solubility Challenge test setsatisfying the similarity cutoff of 0.7. (B) For the 26 compounds of theSolubility Challenge test set when using the similarity cutoff of 0.5.(C) For the 150 compounds of the SolDiv150 data set satisfying thesimilarity cutoff of 0.7.
Table 4. Performance of Models on 62 Drugs Extracted fromthe PhysProp Data Set, That Have 3 Similar Compounds inthe Reference Set
SolDiv150, while our protocol improved it to 0.63. The RMSEis also slightly decreased since ACD obtained 0.82 and ourprotocol 0.71. Overall, our protocol combining different modelsfor solubility prediction gave more accurate results than theindividual ones by enlarging the applicability domain. The mostimportant value of such an approach is the possibility todetermine which is the most appropriate model that can beused on specific chemotypes. In fact, the applicability domain ofour method depends on the applicability domains of eachindividual QSAR model. One can speculate that our approachcould also be employed to other available solubility modelswhile implementing larger in-house reference data sets.Drugs. In order to assess the prediction performance on real
drugs, we repeated the evaluation analysis for extracted drugsfrom PhysProp; we found 62 molecules that have 3 similarcompounds in the reference set. As can be seen from Table 4,all models perform unsatisfactorily on this drug data set, interms of r2, compared to the druglike compounds used. Thebest performing approaches are MOE and the multimodelprotocol. Detailed information for solubility prediction of thesetwo models can be found in Table 1S in the SupportingInformation. However, MOE performs poorly on PhysProp,both Solubility Challenge data sets and SolDiv150. As weobtained the best results on the drugs’ data set with MOE, itmight be suggested drug molecules could be well represented inits training set, which is apparently not the situation for theother models. Regarding the multimodel protocol, for only 6drugs the absolute error of logS > 1 log unit, and only for 1drug the absolute error > 2 log units, which is still acceptable.
■ CONCLUSION
We have presented a new protocol that improves solubilityprediction based on optimized structure similarity search, datasets and the combination of several packages. Our multimodelprotocol allows selecting the most accurate model for acompound of interest among several possible models. Weevaluated the performance of different fingerprints for aqueoussolubility prediction based on molecular structure similaritythrough a Random Forest approach. Our analysis demonstratedthat the multimodel protocol significantly improves solubilityprediction on a large number of diverse compounds ascompared to the ten individual models thoroughly assessedhere. Yet, additional improvement is needed for real drugs. Wenote that missing experimental solubility data for compoundssimilar to the target compound/drug generally limit signifi-cantly the applicability of the method leading to worseprediction. Yet, these compounds are flagged and it is thenpossible to measure experimentally solubility for thesemolecules such as to maintain the high level of accuracyprediction seen for the other compounds.
■ ASSOCIATED CONTENT
*S Supporting InformationFigure 1S, visualization of the developed multimodel protocol;Figure 2S, performance of the multimodel protocol dependingon the numbers of nearest neighbors (NN) as applied to theSolubility Challenge test set; Table 1S, experimental andpredicted solubility data for 62 drugs extracted from PhysProp;SDF file containing the 150 molecules of SolDiv150.This information is available free of charge via the Internet at
NotesThe authors declare no competing financial interest.
■ ACKNOWLEDGMENTS
Support from Servier, the French National Research InstituteInserm, and the University Paris Diderot is greatly appreciated.We thank Schrodinger for providing the evaluation version ofthe QikProp program and the Simulations Plus company forproviding the evaluation version of the ADMET Predictorsoftware.
■ REFERENCES(1) Lipinski, C. A.; Lombardo, F.; Dominy, B. W.; Feeney, P. J.Experimental and computational approaches to estimate solubility andpermeability in drug discovery and development settings. Adv. DrugDelivery Rev. 1997, 23, 3−25.(2) Di, L.; Kerns, E. H. Biological assay challenges from compoundsolubility: strategies for bioassay optimization. Drug Discovery Today2006, 11, 446−451.(3) Alelyunas, Y. W.; Empfield, J. R.; McCarthy, D.; Spreen, R. C.;Bui, K.; Pelosi-Kilby, L.; Shen, C. Experimental solubility profiling ofmarketed CNS drugs, exploring solubility limit of CNS discoverycandidate. Bioorg. Med. Chem. Lett. 2010, 20, 7312−7316.(4) Ishikawa, M.; Hashimoto, Y. Improvement in Aqueous Solubilityin Small Molecule Drug Discovery Programs by Disruption ofMolecular Planarity and Symmetry. J. Med. Chem. 2011, 54, 1539−1554.(5) Wang, J.; Hou, T. Recent Advances on Aqueous SolubilityPrediction. Comb. Chem. High Throughput Screening 2011, 14, 328−338.(6) van de Waterbeemd, H. Improving Compound Quality throughin vitro and in silico Physicochemical Profiling. Chem. Biodiversity2009, 6, 1760−1766.(7) Wang, J.; Krudy, G.; Hou, T.; Zhang, W.; Holland, G.; Xu, X.Development of Reliable Aqueous Solubility Models and TheirApplication in Druglike Analysis. J. Chem. Inf. Model. 2007, 47, 1395−1404.(8) Hopfinger, A. J.; Esposito, E. X.; Llinas, A.; Glen, R. C.;Goodman, J. M. Findings of the Challenge To Predict AqueousSolubility. J. Chem. Inf. Model. 2008, 49, 1−5.(9) Llinas, A.; Glen, R. C.; Goodman, J. M. Solubility Challenge: CanYou Predict Solubilities of 32 Molecules Using a Database of 100Reliable Measurements? J. Chem. Inf. Model. 2008, 48, 1289−1303.(10) Hewitt, M.; Cronin, M. T. D.; Enoch, S. J.; Madden, J. C.;Roberts, D. W.; Dearden, J. C. In Silico Prediction of AqueousSolubility: The Solubility Challenge. J. Chem. Inf. Model. 2009, 49,2572−2587.(11) Kuhne, R.; Ebert, R.-U.; Schormann, G. Model Selection Basedon Structural Similarity: Method Description and Application to WaterSolubility Prediction. J. Chem. Inf. Model. 2006, 46, 636−641.(12) Delaney, J. S. Predicting aqueous solubility from structure. DrugDiscovery Today 2005, 10, 289−295.(13) Ran, Y.; Yalkowsky, S. H. Prediction of Drug Solubility by theGeneral Solubility Equation (GSE). J. Chem. Inf. Comput. Sci. 2001, 41,354−357.(14) Yalkowsky, S. H.; Valvani, S. C. Solubility and partitioning I:Solubility of nonelectrolytes in water. J. Pharm. Sci. 1980, 69, 912−922.
(15) Jain, N.; Yalkowsky, S. H. Estimation of the aqueous solubility I:Application to organic nonelectrolytes. J. Pharm. Sci. 2001, 90, 234−252.(16) Sanghvi, T.; Jain, N.; Yang, G.; Yalkowsky, S. H. Estimation ofAqueous Solubility By The General Solubility Equation (GSE) TheEasy Way. QSAR Comb. Sci. 2003, 22, 258−262.(17) Wassvik, C. M.; Holmen, A. G.; Draheim, R.; Artursson, P.;Bergstrom, C. A. Molecular characteristics for solid-state limitedsolubility. J. Med. Chem. 2008, 51, 3035−3039.(18) Ali, J.; Camilleri, P.; Brown, M. B.; Hutt, A. J.; Kirton, S. B.Revisiting the General Solubility Equation: In Silico Prediction ofAqueous Solubility Incorporating the Effect of Topographical PolarSurface Area. J. Chem. Inf. Model. 2012, 52, 420−428.(19) McElroy, N. R.; Jurs, P. C. Prediction of Aqueous Solubility ofHeteroatom-Containing Organic Compounds from Molecular Struc-ture. J. Chem. Inf. Comput. Sci. 2001, 41, 1237−1247.(20) McFarland, J. W.; Avdeef, A.; Berger, C. M.; Raevsky, O. A.Estimating the Water Solubilities of Crystalline Compounds fromTheir Chemical Structures Alone. J. Chem. Inf. Comput. Sci. 2001, 41,1355−1359.(21) Butina, D.; Gola, J. M. R. Modeling Aqueous Solubility. J. Chem.Inf. Comput. Sci. 2003, 43, 837−841.(22) Hou, T.; Wang, J. Structure - ADME relationship: still a longway to go? Expert Opin. Drug Metab. Toxicol. 2008, 4, 759−770.(23) Tropsha, A.; Gramatica, P.; Gombar, V. K. The Importance ofBeing Earnest: Validation is the Absolute Essential for SuccessfulApplication and Interpretation of QSPR Models. QSAR Comb. Sci.2003, 22, 69−77.(24) Jorgensen, W. L.; Duffy, E. M. Prediction of drug solubility fromstructure. Adv. Drug Delivery Rev. 2002, 54, 355−366.(25) Lagorce, D.; Maupetit, J.; Baell, J.; Sperandio, O.; Tuffery, P.;Miteva, M. A.; Galona, H.; Villoutreix, B. O. The FAF-Drugs2 server: amultistep engine to prepare electronic chemical compound collections.Bioinformatics 2011, 27, 2018−2020.(26) Cheng, A.; Merz, K. M. Prediction of Aqueous Solubility of aDiverse Set of Compounds Using Quantitative Structure PropertyRelationships. J. Med. Chem. 2003, 46, 3572−3580.(27) Stuart, M.; Box, K. Chasing Equilibrium: Measuring the IntrinsicSolubility of Weak Acids and Bases. Anal. Chem. 2005, 77, 983−990.(28) PhysProp. http://www.syrres.com/, 2012.(29) Huuskonen, J.; Salo, M.; Taskinen, J. Aqueous SolubilityPrediction of Drugs Based on Molecular Topology and NeuralNetwork Modeling. J. Chem. Inf. Comput. Sci. 1998, 38, 450−456.(30) Tetko, I. V.; Tanchuk, V. Y.; Kasheva, T. N.; Villa, A. E. P.Estimation of Aqueous Solubility of Chemical Compounds Using E-State Indices. J. Chem. Inf. Comput. Sci. 2001, 41, 1488−1493.(31) Hou, T. ADME evaluation in drug discovery. 4. Prediction ofaqueous solubility based on atom contribution approach. J. Chem. Inf.Comput. Sci. 2004, 44, 266−275.(32) Breiman, L. Random Forests. Mach. Learn. 2001, 45, 5−32.(33) R Development Core Team. R Foundation for StatisticalComputing. R: A language and environment for statistical computing.http://www.R-project.org, 2005.(34) McGregor, M. J.; Pallai, P. V. Clustering of Large Databases ofCompounds: Using the MDL Keys as Structural Descriptors. J. Chem.Inf. Comput. Sci. 1997, 37, 443−448.(35) Delaney, J. S. ESOL: Estimating Aqueous Solubility Directlyfrom Molecular Structure. J. Chem. Inf. Comput. Sci. 2004, 44, 1000−1005.(36) Klopman, G.; Wang, S.; Balthasar, D. M. Estimation of aqueoussolubility of organic molecules by the group contribution approach.Application to the study of biodegradation. J. Chem. Inf. Comput. Sci.1992, 32, 474−482.(37) Klopman, G.; Zhu, H. Estimation of the Aqueous Solubility ofOrganic Molecules by the Group Contribution Approach. J. Chem. Inf.Comput. Sci. 2001, 41, 439−445.(38) MOE. Chemical Computing Group, Inc., 2010.(39) ACD/Labs. http://www.acdlabs.com/products/pc_admet/physchem/physchemsuite/, 2012.
(40) Schrodinger. http://www.schrodinger.com/products/14/17/,2009.(41) Simulation-Plus. http://www.simulations-plus.com/Products.aspx?grpID=1&cID=11&pID=13, 2012.(42) Cruciani, G.; Pastor, M.; Guba, W. VolSurf: a new tool for thepharmacokinetic optimization of lead compounds. Eur. J. Pharm. Sci.2000, 11 (Suppl. 2), S29−S39.(43) Volsurf. http://www.moldiscovery.com, 2011.(44) Tetko, I. V.; Tanchuk, V. Y. Application of Associative NeuralNetworks for Prediction of Lipophilicity in ALOGPS 2.1 Program. J.Chem. Inf. Comput. Sci. 2002, 42, 1136−1145.(45) Infochimie, L. ISIDA. www.infochim.u-strasbg.fr, 2012.(46) Zhang, H.; Ando, H. Y.; Chen, L.; Lee, P. H. On-the-flyselection of a training set for aqueous solubility prediction. Mol.Pharmaceutics 2007, 4, 489−497.(47) Palmer, D. S.; O’Boyle, N. M.; Glen, R. C.; Mitchell, J. B. O.Random Forest Models To Predict Aqueous Solubility. J. Chem. Inf.Model. 2006, 47, 150−158.