39
IN SILICO STUDY OF PATHOGENICITY ISLANDS OF Salmonella enterica serovar Typhi ONG SU YEAN UNIVERSITI SAINS MALAYSIA 2011

IN SILICO STUDY OF PATHOGENICITY ISLANDS
OF Salmonella enterica serovar Typhi
ONG SU YEAN
UNIVERSITI SAINS MALAYSIA
2011

IN SILICO STUDY OF PATHOGENICITY ISLANDS OF Salmonella enterica
serovar Typhi
by
ONG SU YEAN
Thesis submitted in fulfillment of the requirements
for the degree of
Master of Science
February 2011

ii
Acknowledgements
The work of this thesis will not have been possible without the grace of God and efforts
from faculty members, colleagues and friends. I would like to especially thank my
supervisor, Prof. Maqsudul Alam, for his critical and constructive advice. Deepest
gratitude to my co-supervisor, Dr. Anton Yuryev, for his consistent guidance and
sharing of knowledge. Thank you to Prof. Nazalan Najimudin for his valuable opinions
and Dr. Jennifer Saito for her help and dedication especially in critical reading of the
thesis.
I would also like to thank my friends and colleagues at CCB@USM for their continuous
support, help and sharing especially to Muhd. Khairul Luqman and SheriAnn Tan.
Thank you to Ng Fui Ling, Siti Suriawati Badai and Patrick Tan Hock Siew for
generating the initial data of this study and the teamwork. Thank you to Dr. Shaobin
Hou for assisting in this project, Tracey Freitas and Alexandre Dionne-Laporte for
teaching me scripting and command lines.
Last but not least, I would like to thank my beloved family members and my friends who
are always there by my side to give me support and encouragement. All glory to God.

iii
TABLE OF CONTENTS
Acknowledgement.............................................................................................................. ii
Table of Contents .............................................................................................................. iii
List of Tables................................................................................................................... viii
List of Figures .................................................................................................................... x
List of Abbreviations....................................................................................................... xiv
Abstrak ............................................................................................................................. xv
Abstract .......................................................................................................................... xvii
CHAPTER 1 - INTRODUCTION
1.1 Salmonella Typhi and Typhoid Fever ................................................................... 1
1.1.1 Salmonella serovars .................................................................................. 2
1.1.2 Salmonella enterica serovar Typhi ........................................................... 5
1.1.3 Typhoid Fever ............................................................................................ 6
1.1.4 Pathophysiology - Infection of Salmonella Typhi ..................................... 7
1.1.5 Typhoid Carrier…….............. .................................................................. 10
1.1.6 Biofilm ..................................................................................................... 11
1.1.7 Diagnostic kit for Typhoid Fever ............................................................. 13
1.2 Genome and genetics of S. Typhi ........................................................................ 15
1.2.1 Microbial genome sequencing ................................................................. 15
1.2.2 Genome of Salmonella Typhi .................................................................. 16
1.2.3 Lateral gene transfer ................................................................................. 21
1.2.4 Pathogenicity islands (PAIs) and its components .................................... 22

iv
1.2.5 Salmonella pathogenicity islands (SPIs) .................................................. 26
1.3 Objective of study ................................................................................................ 31
CHAPTER 2 – MATERIALS AND METHODS
2.1 Materials
2.1.1 Pathway Studio ........................................................................................ 33
2.1.2 Medscan Reader ....................................................................................... 35
2.1.3 BLAST ..................................................................................................... 36
2.1.4 INTERPROSCAN ................................................................................... 36
2.1.5 CLUSTALW2 .......................................................................................... 37
2.1.6 EMBOSS-ALIGN .................................................................................... 37
2.1.7 PFAM ....................................................................................................... 37
2.1.8 KEGG ....................................................................................................... 38
2.1.9 ENTREZ .................................................................................................. 38
2.1.10 BRENDA ................................................................................................. 42
2.1.11 PAIDB – Pathogenicity Island Database ................................................. 42
2.1.12 CLC Genomics Workbench ..................................................................... 43
2.1.13 SEQUENCE VIEWER ............................................................................ 44
2.2 Methodology ........................................................................................................ 45
2.2.1 Construction of Biological Associations Database for
Salmonella ................................................................................................ 46
2.2.2 Prediction of interactions for Salmonella from other
bacterial species ....................................................................................... 49
2.2.3 Construction of pathways controlling expression of SPIs ....................... 50
2.2.4 Network analysis of gene expression microarray data ............................. 52

v
2.2.5 Identification of gene expression clusters in SPI pathways ..................... 55
2.2.6 Interolog prediction for S. Typhi draft genomes ...................................... 56
2.2.7 Comparison of SPIs between different S. Typhi strains .......................... 58
2.2.8 Revisiting the missing protein of interest ................................................ 58
2.2.9 Manual curation of the SPI genes ............................................................ 59
2.2.10 Phylogenetic tree building method........................................................... 60
CHAPTER 3 - RESULTS
3.1 Construction of pathogenicity islands of S. Typhi ............................................... 62
3.1.1 Salmonella pathogenicity island 1 (SPI-1) ............................................... 63
3.1.2 Salmonella pathogenicity island 2 (SPI-2) ............................................... 67
3.1.3 Salmonella pathogenicity island 3 (SPI-3) ............................................... 70
3.1.4 Salmonella pathogenicity island 4 (SPI-4) ............................................... 73
3.1.5 Salmonella pathogenicity island 5 (SPI-5) ............................................... 77
3.1.6 Salmonella pathogenicity island 6 (SPI-6) ............................................... 79
3.1.7 Salmonella pathogenicity island 7 (SPI-7) ............................................... 83
3.1.8 Salmonella pathogenicity island 8 (SPI-8) ............................................... 88
3.1.9 Salmonella pathogenicity island 9 (SPI-9) ............................................... 91
3.1.10 Salmonella pathogenicity island 10 (SPI-10) ........................................... 93
3.1.11 Salmonella pathogenicity island 11 (SPI-11) ........................................... 96
3.1.12 Salmonella pathogenicity island 12 (SPI-12) ........................................... 99
3.1.13 Salmonella pathogenicity island 13 (SPI-13) ......................................... 101
3.1.14 Salmonella pathogenicity island 15 (SPI-15) ......................................... 104
3.1.15 Salmonella pathogenicity island 16 (SPI-16) ......................................... 107

vi
3.1.16 Salmonella pathogenicity island 17 (SPI-17) ......................................... 109
3.1.17 Salmonella pathogenicity island 18 (SPI-18) ......................................... 111
3.2 Network analysis of gene expression microarray data and
identification of gene expression clusters in SPI pathway ................................. 113
3.2.1 Network analysis of gene expression microarray data ........................... 113
3.2.2 Identification of gene expression clusters in SPI pathways ................... 130
3.3 Comparison of SPIs in other S. Typhi genomes ................................................ 143
3.3.1 Mapping of SPI proteins for the 9 draft genomes of S. Typhi
into Pathway Studio ............................................................................... 143
3.3.2 Revisiting the missing SPI proteins in all the other S. Typhi
genomes.................................................................................................. 146
3.3.3 Manual curation and TBLASTN analysis .............................................. 149
3.3.4 Construction of phylogenetic tree using neighbour joining
algorithm ................................................................................................ 151
CHAPTER 4 – DISCUSSION
4.1 Construction of Salmonella Pathogenicity Islands in Salmonella
enterica serovar Typhi CT18 ............................................................................. 156
4.2 Network analysis of gene expression microarray data and
identification of gene expression clusters in SPI pathway ................................. 160
4.3 Comparison of SPIs in other S. Typhi genomes ................................................ 163
CHAPTER 5 – CONCLUSION
5.1 Final remarks ...................................................................................................... 168
5.2 Future work ........................................................................................................ 169

vii
REFERENCES
APPENDIX A
Detailed workflow for Chapter 2
APPENDIX B
Comparison of all SPI proteins with other S. Typhi strains
APPENDIX C
Result of genes checking in the assemblies of S. Typhi
APPENDIX D
Result of manual curation and TBLASTN for all draft S. Typhi genomes
APPENDIX E
Publication and Presentation

viii
LIST OF TABLES
Page
Table 1.1 Salmonella species, subspecies, serotypes and
their usual habitats 3
Table 1.2 Features of S. Typhi CT18 genome 19
Table 1.3 Typhi isolates sequenced by Holt et al., 2008 20
Table 1.4 Summary of the characteristics in each SPI 30
Table 2.1 Different BLAST programs 36
Table 2.2 Information for the S. Typhi strains used for comparative
analysis 40
Table 3.1 BLAST result for pseudogenes and hypothetical proteins
in SPI-1 66
Table 3.2 BLAST result for pseudogenes and hypothetical proteins
in SPI-2 70
Table 3.3 BLAST result for pseudogenes and hypothetical proteins
in SPI-3 71
Table 3.4 BLAST result for pseudogenes and hypothetical proteins
in SPI-4 73
Table 3.5 BLAST result for hypothetical proteins in SPI-5 77
Table 3.6 BLAST result for hypothetical and unconnected proteins
in SPI-6 82
Table 3.7 BLAST result for pseudogenes and hypothetical proteins
in SPI-7 85
Table 3.8 BLAST result for pseudogenes and unconnected proteins
in SPI-8 89
Table 3.9 BLAST result for SPI-9 proteins 91
Table 3.10 BLAST result for SPI-10 proteins 93
Table 3.11 BLAST result for pseudogenes and hypothetical proteins
in SPI-11 98
Table 3.12 BLAST result for SPI-12 proteins 99
ix
Table 3.13 BLAST result for SPI-13 unknown proteins 101
Table 3.14 BLAST result for SPI-15 proteins 104
Table 3.15 BLAST result for SPI-16 proteins 107
Table 3.16 BLAST result for SPI-17 proteins 109
Table 3.17 Significant transcription factors identified by sub-network
enrichment analysis (SNEA) from the time course of
Salmonella invasion of human macrophages in Bacteria
database 116
Table 3.18 Significant transcription factors identified by sub-network
enrichment analysis (SNEA) from the time course of
Salmonella invasion of human macrophages in Salmonella
database 117
Table 3.19 Description for the genes in Figure 3.30. The colour of the
gene corresponds to the colour of the line in the gene
expression graph in SPI-1 134
Table 3.20 Description for the genes in Figure 3.31. The colour of the
gene corresponds to the colour of the line in the gene
expression graph in SPI-1 136
Table 3.21 Description for the genes in Figure 3.32. The colour of the
gene corresponds to the colour of the line in the gene
expression graph in SPI-2 138
Table 3.22 Description for the genes in Figure 3.33. The colour of the
gene corresponds to the colour of the line in the gene
expression graph in SPI-2 140
Table 3.23 Description for the genes in Figure 3.34. The colour of the
gene corresponds to the colour of the line in the gene
expression graph in SPI-7 142
Table 3.24 Statistics of found and missing SPI genes for all the S. Typhi
strains using S. Typhi CT18 as the reference sequence 144
Table 3.25 Percentage of found genes based on mapping 148
Table 3.26 Statistics of found genes based on TBLASTN analysis 150

x
LIST OF FIGURES
Page
Figure 1.1 Topics of literature review 1
Figure 1.2 Salmonella enterica serovar Typhi 4
Figure 1.3 Distribution of Typhoid Fever worldwide 6
Figure 1.4 Biology of Salmonella infection 8
Figure 1.5 Route taken by S. Typhi during infection 9
Figure 1.6 Evolution of the complete and ongoing genome projects
monitored in Genomes OnLine Database (GOLD) from
December 1997 through September 2009 16
Figure 1.7 Circular representation of the S. Typhi genome 17
Figure 1.8 Circular genome map of Ty2 18
Figure 1.9 Model of TTSS in S. Typhimurium showing the needle
complex organization. 24
Figure 1.10 Bacterial secretion system 25
Figure 2.1 Pathway Studio pathway analysis software 33
Figure 2.2 Representation of entity and relation in Pathway Studio 34
Figure 2.3 Pipeline of MedScan Reader 35
Figure 2.4 Interface of BRENDA 42
Figure 2.5 Interface of CLC Workbench 43
Figure 2.6 Interface of NCBI sequence viewer 44
Figure 2.7 Pipeline for in silico study of pathogenicity islands 45
Figure 2.8 Flowchart for data mining and creating biological
associations database 47
Figure 2.9 Output of MedScan Reader 48
Figure 2.10 Output of Medscan Reader using the term “Typhoid Carrier” 48

xi
Figure 2.11 Flowchart of pathway construction 51
Figure 2.12 Functional class are named with canonical name (EC number) 52
Figure 2.13 Presentation of “seed” sub-network 53
Figure 2.14 Flowchart for network analysis of gene expression
microarray data 54
Figure 2.15 Flowchart for identification of SPI gene expression cluster 55
Figure 2.16 Workflow for orthologs mapping and annotation 57
Figure 2.17 Flowchart for comparative SPIs between S. Typhi strains
using 2 different approaches 59
Figure 2.18 Algorithm for Neighbour-Joining 60
Figure 2.19 Alignment for Lrp protein sequences 61
Figure 2.20 Phylogenetic tree of Lrp 61
Figure 3.1 Distribution of genes in each SPI 62
Figure 3.2 SPI-1 regulation pathway 65
Figure 3.3 SPI-2 regulation pathway 69
Figure 3.4 SPI-3 regulation pathway 72
Figure 3.6 SPI-4 regulation pathway 74
Figure 3.5 Multiple sequence alignment of STY4458, STY4459,
STM4261 using ClustalW 75
Figure 3.7 SPI-5 regulation pathway 78
Figure 3.8 SPI-6 proteins shown in pathway diagram form 80
Figure 3.9 SPI-7 regulation pathway 84
Figure 3.10 Location of SPI-8 in the genome of S. Typhi CT18 89
Figure 3.11 Distribution of SPI-8 proteins 90
Figure 3.12 Multidrug resistance efflux pumps encoded by SPI-9 92

xii
Figure 3.13 Distribution of SPI-10 proteins 95
Figure 3.14 SPI-11 regulation pathway 97
Figure 3.15 SPI-12 regulation pathway 100
Figure 3.17 SPI-13 regulation pathway 102
Figure 3.16 Degradative pathway of hexunorates in E. coli K-12 103
Figure 3.18 Proteins found in SPI-15 104
Figure 3.19 Domain hits for STY3188 105
Figure 3.20 Domain hits for STY3189 105
Figure 3.21 Domain hits for STY3191 106
Figure 3.22 Domain hits for STY3192 106
Figure 3.23 Proteins found in SPI-16 are mainly involved in
biosynthesis of O-antigen 108
Figure 3.24 Proteins found in SPI-17 110
Figure 3.25 Proteins found in SPI-18 112
Figure 3.26 Significant transcription factors and their targets
during the initial time, T = 0 118
Figure 3.27 Significant transcription factors and their targets
during the time of invasion, T = 2 121
Figure 3.28 Significant transcription factors and their targets
during the time of invasion, T = 8 124
Figure 3.29 Significant transcription factors and their targets
during the time of invasion, T = 24 127
Figure 3.30 Cluster 1A 133
Figure 3.31 Cluster 1B 135
Figure 3.32 Cluster 2A 137
Figure 3.33 Cluster 2B 139

xiii
Figure 3.34 Cluster 7A 141
Figure 3.35 Orthologous genes in S. Typhi genomes 145
Figure 3.36 Number of missing genes and genes recovered in SPIs 147
Figure 3.37 Phylogenetic tree for 16S rRNA 152
Figure 3.38 Phylogenetic tree for HilA 153
Figure 3.39 Phylogenetic tree for OmpR 153
Figure 3.40 Phylogenetic tree for SsrB 154
Figure 3.41 Phylogenetic tree for PhoP 154
Figure 3.42 Phylogenetic tree for RcsB 155
Figure 3.43 Phylogenetic tree for RpoN 155
Figure 4.1 Combination of all SPIs excluding unconnected proteins 158
Figure 4.2 Schematic diagram showing the interdependencies
between the 17 SPIs 159

xiv
LIST OF ABBREVIATIONS
The following abbreviations were used in the text:
404ty Salmonella enterica subsp. enterica serovar Typhi str. 404ty
AG3 Salmonella enterica subsp. enterica serovar Typhi str. AG3
bp basepair
E00-7866 Salmonella enterica subsp. enterica serovar Typhi str. E00-7866
E01-6750 Salmonella enterica subsp. enterica serovar Typhi str. E01-6750
E02-1180 Salmonella enterica subsp. enterica serovar Typhi str. E02-1180
E98-0664 Salmonella enterica subsp. enterica serovar Typhi str. E98-0664
E98-2068 Salmonella enterica subsp. enterica serovar Typhi str. E98-2068
E98-3139 Salmonella enterica subsp. enterica serovar Typhi str. E98-3139
kb kilobases
LGT Lateral gene transfer
M223 Salmonella enterica subsp. enterica serovar Typhi str. M223
nt nucleotide
ORF Open Reading Frame
PAI Pathogenicity island
SNEA Sub-network Enrichment Analysis
SPI Salmonella Pathogenicity Island
T1SS/TOSS Type I Secretion System
T6SS Type VI Secretion System
TTSS Type III Secretion System
Ty2 Salmonella enterica subsp. enterica serovar Typhi str. Ty2

xv
Kajian in silico pulau kepatogenan Salmonella enterica serovar Typhi
Abstrak
Salmonella enterica serovar Typhi adalah patogen yang spesifik kepada manusia
yang menyebabkan Demam Kepialu. Adalah dilaporkan bahawa 3-5% pesakit yang
dijangkiti Demam Kepialu akan menjadi pembawa. Bakteria ini mempunyai beberapa
pulau genom yang dikenali sebagai pulau kepatogenan Salmonella (SPI). Semua SPI ini
membawa gen kevirulenan dan gen perlu yang lain dalam jangkitan. Objektif kajian ini
adalah untuk mengenalpasti semua protein dan interaksi mereka dalam semua pulau
genomik tersebut. Secara selari, satu kajian perbandingan yang melibatkan kurasi
manual dan penentuan fungsi secara de novo telah dilakukan ke atas semua genom
lengkap dan draf strain S. Typhi yang sedia ada. Untuk julung kalinya kajian in silico
secara terperinci, meluas dan mendalam telah dilakukan untuk mengenalpasti semua
protein SPI dan pengawalaturan putatifnya. Teknologi pengekstrakan maklumat
MedScan dan perisian Pathway Studio telah digunakan untuk pembinaan semula laluan
SPI, manakala analisis BLAST secara meluas telah diaplikasikan untuk menganalisis
jujukan daripada strain S. Typhi yang lain. Kesimpulannya, koleksi 17 laluan SPI yang
dibina telah menunjukkan bahawa kesemua SPI adalah saling berinteraksi walaupun
terletak di lokasi yang berlainan di dalam genom. SPI-1 telah ditunjuk mempunyai
interaksi dengan bilangan SPI terbanyak kerana ia berhubung dengan SPI-2, 3, 4, 5, 7
and 18 menerusi sistem PhoP/PhoQ. Beberapa kumpulan gen yang diseekspresi semasa
serangan makrofag telah dikenalpasti dalam laluan SPI. Berdasarkan kajian
perbandingan antara genom S. Typhi yang lain, kebanyakan pemain utama di dalam
SPIs terutamanya faktor transkripsi dan pengawalatur global didapati sememangnya

xvi
terpelihara dalam seluruh garis keturunan Salmonella. Walaupun genom draf strain S.
Typhi digunakan dalam kajian perbandingan ini, namun kebanyakannya mempunyai
gen-gen SPI. Ini menyokong fakta bahawa strain S. Typhi memerlukan SPIs sebagai
jentera kepatogenannya. Pengetahuan mengenai mekanisme terperinci kevirulenan S.
Typhi di dalam sel perumah akan membantu dalam perkembangan pengesanan cekap
serta rawatan untuk Demam Kepialu pada masa hadapan.

xvii
In silico study of pathogenicity islands of Salmonella enterica serovar Typhi
Abstract
Salmonella enterica serovar Typhi is a human-specific pathogen that causes
Typhoid Fever. It is reported that 3-5% of infected patients end up as Typhoid Carriers.
This bacterium harbors several genomic islands known as Salmonella Pathogenicity
Islands (SPIs). The SPIs carry virulence and other genes essential for infection. The
objective of this study is to identify the SPI proteins and their interactions in these
genomic islands. In parallel, a comparative genomic study for all the SPIs using manual
curation and de novo functional assignment was performed in all available completed
and draft genomes of S. Typhi strains. For the first time, a thorough, extensive and in-
depth in silico study was undertaken to identify all SPI proteins and their putative
regulation. MedScan information extraction technology and Pathway Studio software
were the main tools used for the reconstruction of SPI pathways, while extensive
BLAST analysis were applied to analyze the sequences from other S. Typhi strains. In
summary, the collection of 17 constructed SPI pathways were shown to be
interconnected despite their different location on the genome and all of them played an
important role for Typhoid Fever. It was revealed that SPI-1 is interacting with the
largest number of SPIs, namely SPI-2, 3, 4, 5, 7, and 18 through the PhoP/PhoQ system.
Several clusters of genes co-expressed during macrophage invasion were identified in
the SPI pathways. Based on the comparative studies, it was discovered that most of the
key players in the SPIs especially the transcription factors and global regulators, were
indeed conserved throughout the Salmonella lineage. Although draft genomes of S.
Typhi strains were used in this comparative study, most of them have the SPI genes.

xviii
This supports the fact that S. Typhi needs SPIs as its pathogenicity machinery.
Understanding the detailed virulence mechanism of S. Typhi in host cells will help to
develop efficient detection and treatment of Typhoid Fever in the future.

1
CHAPTER 1
INTRODUCTION
The literature review for the research subject is discussed in several sections as shown in
Figure 1.1.
Figure 1.1: Topics of literature review
Literature review
Salmonellaserovars
Salmonella enterica
serovar Typhi
Typhoid Fever
Patho
physiology
Diagnostic Kit for
Typhoid Fever
Typhoid Carrier
Genome of Salmonella
enterica serovar Typhi
Pathogenicity islands and its components

2
1.1 Salmonella Typhi and Typhoid Fever
1.1.1 Salmonella serovars
Salmonella is a genus within the family Enterobacteriacea and thus are under the same
category of enteric bacteria such as Escherichia coli and Shigella species (Baker and
Dougan, 2007). The genus Salmonella was named after Daniel Elmer Salmon, an
American veterinary pathologist. With the advancement in genome sequencing and
microarray technology, the taxonomy of Salmonella is heavily revised. Sequence
comparisons revealed that many of the Salmonella are very closely related. This is
supported by the findings that the sequence identities of house-keeping genes and 16S
rRNA were between 96% and 99% for the different Salmonella investigated (Porwollik
and McClelland, 2003). The genus Salmonella contains two main species, namely the
Salmonella bongori with 20 different serotypes and Salmonella enterica which has 2463
different serotypes (Table 1.1). S. enterica can be classified into six subspecies: enterica
(subspecies I), salamae (subspecies II), arizonae (subspecies IIIa), diarizonae
(subspecies IIIb), houtenae (subspecies IV), and indica (subspecies VI) (Brenner et al.,
2000). This classification is based on the expression of somatic lipopolysaccharide O
antigens and flagellar H antigens according to the Kaufmann-White serotyping scheme
(Brenner et al., 2000). From the clinical point of view, the serovars of Salmonella are
usually divided into two broad groups. The first group consists of human-host restricted
pathogens and responsible for the systemic invasive disease such as enteric fever. These
include Salmonella Typhi and Salmonella Paratyphi A, B and C. The other serovars are
grouped as non-typhoidal Salmonella (NTS), which is usually self-limiting and cause a
less severe gastroenteritis (Cooke et al., 2007)

3
The most prevalent serovars which cause a major health threat to warm-blooded animals
are within S. enterica subspecies I while other subspecies and S. bongori are normally
restricted to cold-blooded hosts (Brenner et al., 2000). Although there is genetic
relatedness among the S. enterica serovars, they differ significantly in their disease
spectrum and host range. The best example for broad-host range serovar is S. enterica
serovar Typhimurium which causes disease in humans, cattle, pigs, horses, poultry,
rodents and sheep. On the other hand, some serovars are host-specific and have a narrow
spectrum of hosts. This is best represented by S. enterica serovar Typhi which affects
mainly humans and higher primates (Porwollik and McClelland, 2003). Most of the S.
enterica subspecies I serotypes especially the nontyphoidal Salmonella serotypes cause
infections in humans that are restricted to the intestine and mesenteric lymph node which
result in diarrhea. In contrast, the typhoidal Salmonella serotypes such as S. Typhi and
Paratyphi A cause systemic infections in human but diarrhea is an insignificant symptom
(Santos et al., 2001; Zhang et al., 2003).
Table 1.1: Salmonella species, subspecies, serotypes and their usual habitats

4
Microarray analysis and the complete genome of four S. enterica subspecies I serotypes;
S. enterica serovar Typhimurium LT2, S. enterica serovar Typhi Ty2, S. enterica
serovar Typhi CT18, and S. enterica serovar Paratyphi A, have provided a list of genes
which are considered as signature genes exclusive for S. enterica subspecies I (Andrews-
Polymenis and Baumler, 2006). The first group of genes encode products that are
located in the bacterial outer membrane (Porwollik et al., 2002), including the fimbrial
gene clusters stfACDEFG, safABCD, and stfABCD (Folkesson et al., 1999; Townsend et
al., 2001). The second group of genes encodes products that affect the properties of the
bacterial cell surface. This includes the O-antigen biosynthesis (rfb) genes such as rfbP,
rfbK, rfbU, rfbI, rfbC and rfbM (Porwollik et al., 2002) which are required for host-
pathogen interaction. The third group of genes encodes products that are involved in
transport and utilization of nutrients such as sugar phosphotransferase and phosphonate
transport system (Jiang et al., 1995). Figure 1.2 shows the shape of S. Typhi.
Figure 1.2: Salmonella enterica serovar Typhi
Image by Dr. Volker Brinkmann, Max Planck Institute for Infection Biology (Daily,
2006) Source: http://www.sciencedaily.com/releases/2006/11/061128092129.htm

5
1.1.2 Salmonella enterica serovar Typhi
S. enterica serovar Typhi is a rod-shaped, gram-negative facultative anaerobe bacterium
classified under Salmonella subgroup I. It belongs to the family of Enterobacteriaceae.
All Enterobacteriaceae ferment glucose, reduce nitrates and are oxidative negative. S.
Typhi is motile, produces minimal H2S and is resistant to bile acids (Rollins and Joseph,
2000). It has type IV pili, fimbriae for adherence and flagella. Fimbriae or pili are
defined as structures found on bacteria which mediate interaction with cells. They are
normally specific to a receptor and thus are used at different critical times during the
infection. Type IV pili in S. Typhi are used for adhesion to human monocytes and
epithelial cells by interaction with the cystic fibrosis transmembrane conductance
regulator receptor (Pier et al., 1998; Tsui et al., 2003; Zhang et al., 2000). Meanwhile,
Tcf fimbriae was recognized by human sera from typhoid patients (Harris et al., 2006)
and Stg fimbriae mediates adherence to epithelial cells and reduces phagocytosis (Forest
et al., 2007). The major subunit of flagella in Salmonella is generally encoded by fliC
and fliB, which correspond to the H1 and H2 variants of the H antigen, respectively
(Silverman and Simon, 1980). S. Typhi has 3 types of antigens, namely the H antigen for
motility, specific O antigen for synthesizing lipopolysaccharides and biofilm formation
and Vi antigen, a capsular polysaccharide which acts as a major virulence factor of S.
Typhi. S. Typhi can be identified in the laboratory by several biochemical and
serological tests. One of the most specific is that of polysaccharide capsule Vi, which is
present in about 90% of all freshly isolated S. Typhi and has a protective effect against
the bactericidal action of the serum of infected patients. This capsule provides the basis
for one of the commercially available vaccines.

6
1.1.3 Typhoid fever
Typhoid fever is a global health issue that is caused by S. enterica serovar Typhi (Figure
1.3). S. Typhi does not have an animal reservoir and is transmitted from human-to-
human through contaminated food or water (Raffatellu et al., 2007). In developing
countries, typhoid fever causes 5% or more deaths in areas with high transmission. The
estimated global incidence of typhoid is 16,000,000 cases with 500,000 deaths per year
(Pang et al., 1995). Typhoid fever can be classified into multiple stages: progressive
elevation of temperature, followed by bacteremia; rose spots in the skin, abdominal pain
and splenomegaly, and finally intensive intestinal inflammatory process especially in the
Peyer’s patches (de Andrade and de Andrade Junior, 2003).
Figure 1.3: Distribution of Typhoid Fever worldwide
Source: Figure released by Centers for Diseases Control and Prevention, (CDC)
(Review, 2009) (http://vaccinereview.com/who-needs-a-typhoid-vaccination)

7
1.1.4 Pathophysiology-Infection of Salmonella Typhi
The route of S. Typhi infection begins with the ingestion of S. Typhi orally (Figure 1.4
and Figure 1.5). The bacteria will first enter the small intestine through the M cells of
Peyer’s patches (PP), the main transmitting point for macrophages traveling from the gut
into the lymphatic system. S. Typhi has specialized fimbriae that enable it to adhere to
the epithelium over clusters of lymphoid tissue in the ileum (PP). This is then followed
by the migration into the mesenteric lymph nodes where multiplication of bacteria
happens. Multiplication also occurs in lymph nodes, spleen, bone marrow and liver.
Bacteria are released and disseminated into the bloodstream (Everest et al., 2001).
During invasion of intestinal epithelial cells, Type Three Secretion System (TTSS) in
SPI-1 is activated and the effector proteins are injected into the host cell causing the cell
to form membrane ruffles which will engulf the bacteria and create vesicles. The
bacteria are then carried in the vesicles across the membrane and presented to the
macrophages. Macrophages recognize pathogen-associated molecular patterns (PAMPs)
such as flagella and lipopolysaccharides with the presence of toll-like receptor (TLR)–5
and TLR-4/MD2/CD-14 complex. S. Typhi has a Vi capsular antigen that masks
PAMPs, avoiding neutrophil-based inflammation. TviA avoids interleukin-8 production
in the intestinal mucosa by repressing flagellin secretion, which reduces the recognition
and activation of TLR-5 (Raffatellu et al., 2005; Winter et al., 2008). The bacteria then
induce their host macrophages to attract more macrophages (Raffatellu et al., 2006). S.
Typhi uses macrophages as a vehicle to specific organs. Since they are undetected by the
immune system, they are resistant to digestion. Furthermore, S. Typhi has SPI-2 which
codes for virulence factors that prevent or alter the fusion of the vacuole with other

8
intracellular compartments. The presence of TTSS in SPI-2 causes pore insertion in the
vacuole membrane to deliver bacterial effectors. As a result, the macrophage
cytoskeleton is rearranged to carry S. Typhi in its vacuole to the Golgi apparatus where
it multiplies.
Figure 1.4: Biology of Salmonella infection – Orally ingested Salmonella survive at the
low pH of the stomach and evade the multiple defences of the small intestine in order to
gain access to the epithelium. Source: Adapted from (Haraga et al., 2008)

9
Figure 1.5: Route taken by S. Typhi during infection

10
1.1.5 Typhoid Carrier
Typhoid fever is mainly transmitted by the ingestion of food or water contaminated with
feces from the typhoid carrier. A typhoid carrier is normally asymptomatic but this
individual can carry S. Typhi for days to years without showing any symptom of
Typhoid fever. The gallbladder is the most common site for the chronic carriage of S.
Typhi as compared to other site. It was reported that women exceed men as carriers by a
ratio of 3:1 (Ames and Robins, 1943; Hornick et al., 1970). Typhoid carrier can be
divided into three categories according to the Health and Human Services Agency in the
State of California:
Convalesent carrier:
- A person who harbours S. Typhi for 3 or more months after the onset.
Convalescent carriers may be released from the hospital when three
consecutive negative specimens of feces and urine taken at intervals of not
less than one month, beginning at least one week after discontinuation of
specific therapy obtained.
Acute chronic carrier:
- A person who carries S. Typhi for more than 6 months and less than one year.
Chronic carrier:
- A person who continues to excrete S. Typhi for more than 12 months after
the onset of Typhoid fever.
- Any person who gives no history of having Typhoid fever or who had the
disease for more than one year previously, whose feces or urine are found to
contain S. Typhi on 2 separate examinations at least 48 hours apart,
confirmed by State’s Microbial Diseases Laboratory.
11
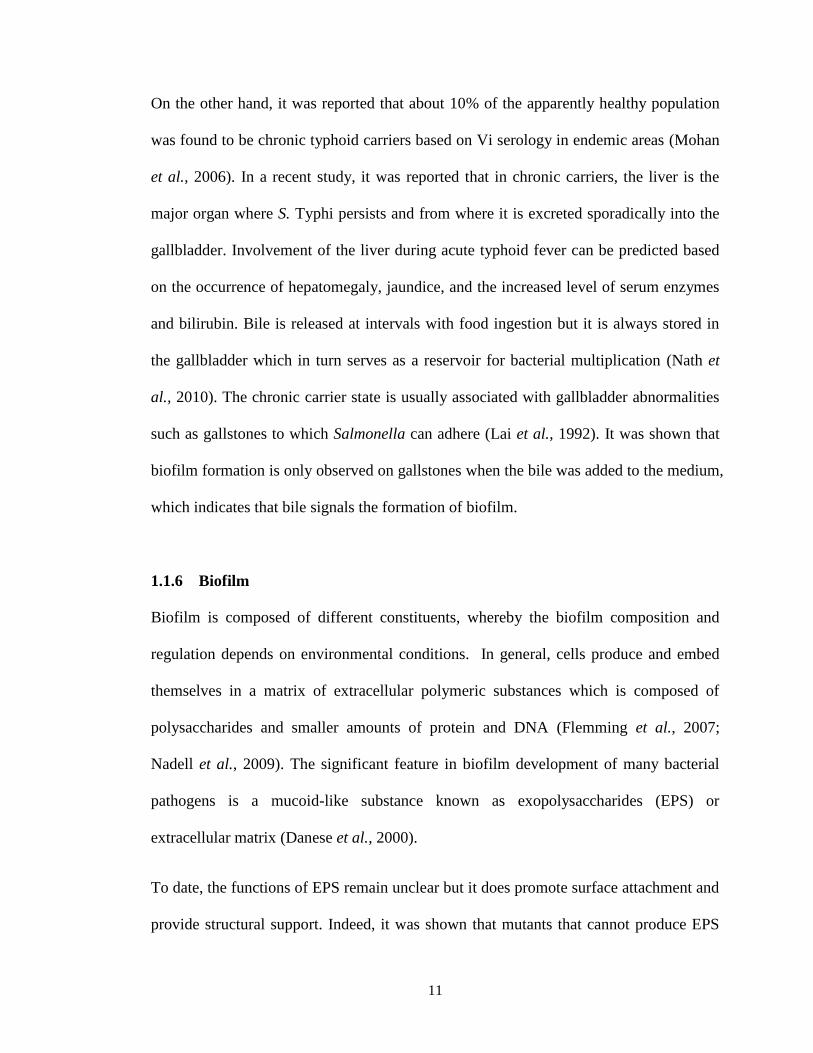
On the other hand, it was reported that about 10% of the apparently healthy population
was found to be chronic typhoid carriers based on Vi serology in endemic areas (Mohan
et al., 2006). In a recent study, it was reported that in chronic carriers, the liver is the
major organ where S. Typhi persists and from where it is excreted sporadically into the
gallbladder. Involvement of the liver during acute typhoid fever can be predicted based
on the occurrence of hepatomegaly, jaundice, and the increased level of serum enzymes
and bilirubin. Bile is released at intervals with food ingestion but it is always stored in
the gallbladder which in turn serves as a reservoir for bacterial multiplication (Nath et
al., 2010). The chronic carrier state is usually associated with gallbladder abnormalities
such as gallstones to which Salmonella can adhere (Lai et al., 1992). It was shown that
biofilm formation is only observed on gallstones when the bile was added to the medium,
which indicates that bile signals the formation of biofilm.
1.1.6 Biofilm
Biofilm is composed of different constituents, whereby the biofilm composition and
regulation depends on environmental conditions. In general, cells produce and embed
themselves in a matrix of extracellular polymeric substances which is composed of
polysaccharides and smaller amounts of protein and DNA (Flemming et al., 2007;
Nadell et al., 2009). The significant feature in biofilm development of many bacterial
pathogens is a mucoid-like substance known as exopolysaccharides (EPS) or
extracellular matrix (Danese et al., 2000).
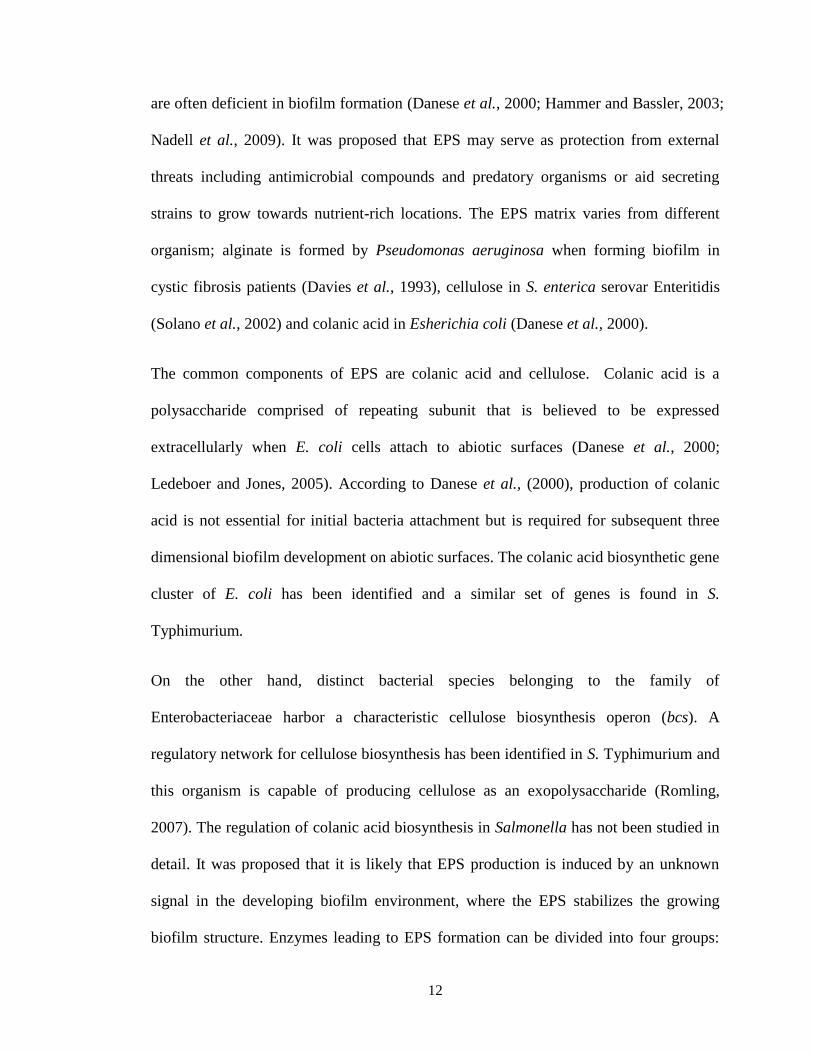
To date, the functions of EPS remain unclear but it does promote surface attachment and
provide structural support. Indeed, it was shown that mutants that cannot produce EPS
12
are often deficient in biofilm formation (Danese et al., 2000; Hammer and Bassler, 2003;
Nadell et al., 2009). It was proposed that EPS may serve as protection from external
threats including antimicrobial compounds and predatory organisms or aid secreting
strains to grow towards nutrient-rich locations. The EPS matrix varies from different
organism; alginate is formed by Pseudomonas aeruginosa when forming biofilm in
cystic fibrosis patients (Davies et al., 1993), cellulose in S. enterica serovar Enteritidis
(Solano et al., 2002) and colanic acid in Esherichia coli (Danese et al., 2000).
The common components of EPS are colanic acid and cellulose. Colanic acid is a
polysaccharide comprised of repeating subunit that is believed to be expressed
extracellularly when E. coli cells attach to abiotic surfaces (Danese et al., 2000;
Ledeboer and Jones, 2005). According to Danese et al., (2000), production of colanic
acid is not essential for initial bacteria attachment but is required for subsequent three
dimensional biofilm development on abiotic surfaces. The colanic acid biosynthetic gene
cluster of E. coli has been identified and a similar set of genes is found in S.
Typhimurium.
On the other hand, distinct bacterial species belonging to the family of
Enterobacteriaceae harbor a characteristic cellulose biosynthesis operon (bcs). A
regulatory network for cellulose biosynthesis has been identified in S. Typhimurium and
this organism is capable of producing cellulose as an exopolysaccharide (Romling,
2007). The regulation of colanic acid biosynthesis in Salmonella has not been studied in
detail. It was proposed that it is likely that EPS production is induced by an unknown
signal in the developing biofilm environment, where the EPS stabilizes the growing
biofilm structure. Enzymes leading to EPS formation can be divided into four groups:

13
enzymes responsible for the initial metabolism of a carbohydrate; enzymes involved in
sugar nucleotide synthesis and interconversion; glycosyltransferase that form the
repeating unit attached to the glycosyl carrier lipid; and translocases and polymerases
that form the polymer (Solano et al., 2002).
1.1.7 Diagnostic kit for Typhoid Fever
Knowing the fact that Typhoid fever is fatal, it is of much importance to design an
effective diagnostic kit to detect this disease. Indeed, any secreted or outer membrane
protein encoded by the SPIs could be used as a biomarker for diagnostic and treatment
purposes. There are a few diagnostic kits to detect typhoid fever such as the Felix-Widal
test, IDL Tubex® test, Typhidot®, Typhidot-M®, and IgM dipstick test. Felix-Widal
test measures agglutinating antibody levels against O and H antigens. Generally, O
antibodies appear on days 6-8 and H antibodies on days 10-12 after the onset of the
disease. The test is usually performed on an acute serum (at first contact with the
patient). It can be negative in up to 30% of culture-proven cases of typhoid fever, due to
the prior antibiotic therapy that has blunted the antibody response. Thus, the test has
only moderate sensitivity and specificity. On the other hand, S. Typhi shares O and H
antigens with other Salmonella serotypes and has cross-reacting epitopes with other
Enterobacteriacae, and this can lead to a false-positive result. The IDL Tubex® test
marketed by a Swedish company can detect IgM O9 antibodies from patients within a
few minutes. The Tubex® test is simple (essentially a one-step test) and rapid (taking
approximately two minutes). Specificity is improved by means of an inhibition assay
format and by detecting antibodies to a single antigen in S. Typhi only (WHO, 2003).

14
Another rapid serological test, Typhidot®, takes three hours to perform. It was
developed in Malaysia for the detection of specific IgM and IgG antibodies against a 50
kD antigen of S. Typhi (Ismail et al., 1991). This dot EIA test offers simplicity, speed,
specificity (75%), economy, early diagnosis, sensitivity (95%) and high negative and
positive predictive values. The detection of IgM reveals acute typhoid in the early phase
of infection, while the detection of both IgG and IgM suggests acute typhoid in the
middle phase of infection (WHO, 2003). Since IgG can persist for more than two years
after typhoid infection (Choo et al., 1999), the detection of specific IgG cannot
differentiate between acute and convalescent cases. Furthermore, false-positive results
attributable to previous infection may occur. A newer version of the test, Typhidot-M®,
was recently developed to detect specific IgM antibodies only. Evaluation studies have
shown that Typhidot-M® is superior than the culture method (Choo et al., 1997).
The dipstick test, developed in the Netherlands, is based on the binding of S. Typhi
specific IgM antibodies in samples to S. Typhi lipopolysaccharide (LPS) antigen and the
staining of bound antibodies by an anti-human IgM antibody conjugated to colloidal dye
particles. Evaluations of the dipstick test in laboratory-based studies in Indonesia (Hatta
et al., 2002; House et al., 2001), Kenya, Vietnam (Gasem et al., 2002) and Egypt (Ismail
et al., 2002) have shown consistent results. These studies indicated sensitivities of 65%
to 77% for samples collected at the time of first consultation from culture-confirmed
patients and specificities of 95% to 100%. The dipstick test provides a rapid and simple
alternative for the diagnosis of typhoid fever, particularly in situations where culture
facilities are not available.

15
Thus, understanding the pathogen and host interaction as well as the genome and
genetics of the pathogen is essential in order to unravel the underlying mechanism of
Typhoid fever.
1.2 Genome and Genetics of S. Typhi
1.2.1 Microbial genome sequencing
For the past decade, there is a rapid advancement in the DNA sequencing technology. In
a microbial genome project, whole genome sequencing represents the most powerful
approach for identification of genomic diversity among closely related strains or
isolates. A complete genome will provide the information about the presence or absence
of genes that are crucial to deduce the events in genome evolution such as gene loss,
gene duplication and lateral gene transfer (Fraser et al., 2002). It was postulated for the
next few years, more than 100 projects for sequencing microbial genomes should be
completed, providing the scientific community with information on more than 300,000
predicted genes with some of them being significant number of novel genes for future
research and potential biological resources. With more genomes becoming available, the
benefits of comparative genomics in understanding biochemical diversity, virulence,
pathogenesis, and the evolution of species has been explicitly demonstrated (Fraser et
al., 2000). The number of bacterial genome sequences available has increased
progressively as reported by the Genomes OnLine Database (Figure 1.6). The Genomes
OnLine Database (GOLD) is a comprehensive resource for centralized monitoring of
genome and metagenome projects worldwide. As of September 2009, GOLD contains
information for more than 5800 sequencing projects of which 1100 have been
completed.

16
Figure 1.6: Evolution of the complete and ongoing genome projects monitored in
Genomes OnLine Database (GOLD) from December 1997 through September 2009.
Source: Adapted from (Liolios et al., 2010).
1.2.2 Genome of Salmonella Typhi
To date, there are two complete genomes of S. Typhi have been deposited in Genbank. S.
Typhi CT18 (Figure 1.7) was the first S. Typhi genome sequenced by the Wellcome
Trust Sanger Institute in 2000, followed by S. Typhi Ty2 (Figure 1.8) which was
sequenced by the Laboratory of Genetics and Genome Center of Wisconsin in 2002. The
complete genome of S. Typhi CT18 consists of 4,809,037 base pair with over 200
pseudogenes, whereby several genes contribute to the virulence in S. Typhimurium.
Approximately 480 genes are unique to S. Typhimurium and roughly 600 genes are
unique to S. Typhi (Parkhill et al., 2001). However, it was shown that both serovars
share about 89% of the genes (McClelland et al., 2001). Similarly, the 4.8 Mb complete
genome sequence of S. Typhi Ty2 revealed that 4516 genes are shared with S. Typhi

17
CT18, 29 of the 4,646 predicted genes in Ty2 are unique to this strain while 84 genes are
unique to S. Typhi CT18.
Figure 1.7: Circular representation of the S. Typhi genome. The outer scale is marked in
megabases. Circles range from 1 (outer circle) to 9 (inner circle). Circles 1 and 2, genes
on forward and reverse strand; circles 3 and 4, genes conserved with E. coli; circles 5
and 6, genes unique to S. Typhi with respect to E. coli; circle 7, pseudogenes; circle 8,
G+C content; circle 9, GC bias ((G - C/G +C); khaki indicates values .1; purple ,1). All
genes are colour-coded by function: dark blue, pathogenicity/adaptation; black, energy
metabolism; red, information transfer; dark green, membranes/surface structures; cyan,
degradation of macromolecules; purple, degradation of small molecules; yellow, central/
intermediary metabolism; light blue, regulators; pink, phage/IS elements; orange,
conserved hypothetical; pale green, unknown function; brown, pseudogenes. Figure
reproduced from (Parkhill et al., 2001)

18
Figure 1.8: Circular genome map of Ty2. The Ty2 genome has 4,545 ORFs and
pseudogenes, 4,516 of which are shared with CT18 (outer circle, blue) and 29 of which
are unique (pink). Arrowheads within the second circle show the locations and
orientations of rRNA operons (red) and tRNAs (turquoise) (not drawn to scale). The
third circle shows insertion element distributions: blue, IS200; red, other IS elements.
The fourth circle shows the scale in base pairs. The fifth circle shows the C/G skew,
calculated for each sliding window of 10 kb along the genome. The sixth and seventh
(innermost) circles show the CT18 and Ty2 genome comparison: blue (and above the
axis in CT18) indicates colinear regions, red (and below the axis in CT18) indicates
inverted regions, green indicates a region that is translocated and inverted again within
the half-genome inversion region, and yellow indicates unique regions. The map was
created with GenVision (DNASTAR). Figure reproduced from (Deng et al., 2003)
It was revealed that both strains have significant differences in term of prophages,
insertion sequences, and island structures (Deng et al., 2003). One of the major
differences is that S. Typhi Ty2 has no plasmids and is sensitive to antibiotics. In
contrast, S. Typhi CT18 is multidrug resistant and has 2 plasmids: multiple-drug-
resistance incH1 plasmid, pHCM1 (218,150 bp), and a cryptic plasmid, pHCM2

19
(106,516 bp) (Parkhill et al., 2001). Details for genome S. Typhi CT18 is shown in
Table 1.2.
Table 1.2: Features of S. Typhi CT18 genome
Component of genome Property
Chromosome
Total size 4,809,307 bp
G+C content 52.09%
Coding sequences 4,599
…of which pseudogenes 204
Coding density 87.6%
Average gene length 958 bp
Ribosomal RNAs 6 x (16S-23S-5S), 1 x (16S-23S-5S-5S)
Transfer RNAs 78
Other stable RNAs 8
pHCM1
Total size 218,150 bp
G+C content 47.58%
Coding sequences 249
…of which pseudogenes 8
Coding density 83.8%
Average gene length 759 bp
pHCM2
Total size 106,516 bp
G+C content 50.6%
Coding sequences 131
…of which pseudogenes 0
Coding density 87.1%
Average gene length 708 bp
Transfer RNAs 1
In 2008, Holt and colleagues have generated whole-genome sequences for 19 Typhi
isolates (Table 1.3) using 454 (Roche) and Solexa (Illumina) (Holt et al., 2008). It was
discovered that this human-restricted bacterial pathogen shows limited genetic variation.
Based on the examination of DNA sequences and the rate of change of single-nucleotide
polymorphisms, it was proposed that S. Typhi could be only 50,000 years old, and thus it
is a short time frame for bacteria to accumulate diversity (Kidgell et al., 2002; Sabbagh

20
et al., 2010). This is in consensus with the suggestion that evolution of S. Typhi strain
population is mainly described by loss of gene function. Indeed, S. Typhi represents an
example of reductive evolution, whereby the adaptation to its human niche has caused
functional inactivation of genes, due to the fact that certain needs have been assured by
the host (Dagan et al., 2006; Sabbagh et al., 2010). As a result, there are more than 200
pseudogenes found in both the genome of S. Typhi CT18 and Ty2 (Deng et al., 2003).
Table 1.3: Typhi isolates sequenced by Holt et al., 2008
Isolate Country Year Haplotype 454
coverage
Solexa
coverage
Plasmid
E00-7866 Morocco 2000 H46 10.5x - -
E01-6750 Senegal 2001 H52 8.16x - -
E02-1180 India 2002 H45 13.1x - -
E98-0664 Kenya 1998 H55 10.8x - -
E98-2068 Bangladesh 1998 H42 10.9x - -
J185SM Indonesia 1985 H85 13.5x - -
M223 Unknown 1939 H8 11.1x - -
404ty Indonesia 1983 H59 8.49x 24.6x PBSSB1
AG3 Vietnam 2004 H58 10.1x 13.1x -
E98-3139 Mexico 1998 H50 11.1x 5.40x -
150(98)S Vietnam 1998 H63 - 8.60x -
8(04)N Vietnam 2004 H58 - 13.1x -
CT18 Vietnam 1993 H1 - 9.80x PHCM1,
PHCM2
E02-2759 India 2002 H58 - 65.5x PHCM2
E03-4983 Indonesia 2003 H59 - 7.42x PBSSB1
E03-9804 Nepal 2003 H58 - 8.19x PAKU1
ISP-03-
07467
Morocco 2003 H58 - 7.87x PAKU1
ISP-04-
06979
Central
Africa
2004 H58 - 72.9x PAKU1
Ty2 Russia 1916 H10 - 8.60x -


