Cod- 4G,077d.-- 1% In Situ Analysis of Ash Deposits from Black Liquor Combustion P. Bernath', Scott A. Sinquefield2, Larry L. Baxter, Gian Sclippa, C. Rohlfing, M. Barfield3 CombustionResearch Facility Sandia National Laboratories Livermore, California 94551-0969 i r;JGEIf 1-7 ?< 3iS ? ' 7 rj 8 3 I- APR 9 2 isgo Abstract Aerosols formed during combustionof black liquor cause a significantfire-side fouling problem in pulp mill recovery boilers. The ash deposits reduce heat transfer effectiveness, plug gas passages, and contribute to corrosion. Both. vapors and condensation aerosols lead to the formation of such deposits. The high ash content of the fuel and the low dew point of the condensate salts lead to a high aerosol and vapor concentration in most boilers. In situ measurements of the chemical composition of these deposits is an important step in gaining a fundamentalunderstanding of the deposition process. M a r e d emission spectroscopy is used to characterizethe composition of thin film deposits resulting fkom the combustion of black liquor and the deposition of submicronaerosols and vapors. New reference spectra of Na2S04, K2SO4, Na2C03 and KZC03 pure component films were recorded and compared with the spectra of the black liquor deposit. All of the black liquor emission bands were-identified using a combination of literature data and ab initio calculations. Ab initio calculations also predict the locations and intensities of bands for the alkali vapors of interest. This report was prepared as an account of work sponsored by an agency of the United States Government. Neither the United States Government nor any agency thereof, nor any of their employees, makes any warranty, express or implied, or assumes any legal liability or responsi- bility for the accuracy, completeness, or usefulness of any information, apparatus, product, or process disclosed, or represents that its use would not infringe privately'owned rights. Refer- ence herein to any specific commercial product, process, or service by trade name, trademark, manufacturer, or otherwise does not necessarily constitute or imply its endorsement, recom- mendation, or favoring by the United States Government or any agency thereof. The views and opinions of authors expressed herein do not necessarily state or reflect those of the United States Government or any agency thereof. .- ' University of Toronto * Oregon State University University of Arizona 3 SVER
Transcript
C o d - 4G,077d.-- 1 % In Situ Analysis of Ash Deposits from Black Liquor Combustion
P. Bernath', Scott A. Sinquefield2, Larry L. Baxter, Gian Sclippa, C. Rohlfing, M. Barfield3 Combustion Research Facility Sandia National Laboratories
Livermore, California 9455 1-0969 i r;JGEIf 1-7 ?< 3iS ? '7 rj
8 3 I- APR 9 2 isgo
Abstract Aerosols formed during combustion of black liquor cause a significant fire-side fouling problem in pulp mill recovery boilers. The ash deposits reduce heat transfer effectiveness, plug gas passages, and contribute to corrosion. Both. vapors and condensation aerosols lead to the formation of such deposits. The high ash content of the fuel and the low dew point of the condensate salts lead to a high aerosol and vapor concentration in most boilers. In situ measurements of the chemical composition of these deposits is an important step in gaining a fundamental understanding of the deposition process. Mared emission spectroscopy is used to characterize the composition of thin film deposits resulting fkom the combustion of black liquor and the deposition of submicron aerosols and vapors. New reference spectra of Na2S04, K2SO4, Na2C03 and KZC03 pure component films were recorded and compared with the spectra of the black liquor deposit. All of the black liquor emission bands were-identified using a combination of literature data and ab initio calculations. Ab initio calculations also predict the locations and intensities of bands for the alkali vapors of interest.
This report was prepared as an account of work sponsored by an agency of the United States Government. Neither the United States Government nor any agency thereof, nor any of their employees, makes any warranty, express or implied, or assumes any legal liability or responsi- bility for the accuracy, completeness, or usefulness of any information, apparatus, product, or process disclosed, or represents that its use would not infringe privately'owned rights. Refer- ence herein to any specific commercial product, process, or service by trade name, trademark, manufacturer, or otherwise does not necessarily constitute or imply its endorsement, recom- mendation, or favoring by the United States Government or any agency thereof. The views and opinions of authors expressed herein do not necessarily state or reflect those of the United States Government or any agency thereof.
.-
' University of Toronto * Oregon State University
University of Arizona 3
SVER
1.
2. 3. 4.
5.
6.
7.
8.
9.
10. , 11.
12.
13.
14.
15. 16.
17.
18.
19. 20.
21. 22.
23. 24.
25.
Huong, P.V. Advances in Infrared and Raman Spectroscopy. R.J.H. Clark andR.E.Hester, Heyden, London, 1978 Fabbri, G., and Baraldi, P. Applied Spectroscopy 26:593-599 (1972) Baraldi, P., and Fabbri, G. Spectrochimica Acta 39A:669-675 (1983) Baxter, L.L. Engineering Foundation Conference on The Impact of Ash Deposition on Coal-Fired Plants. 1993, Baxter, L.L., Richards, G.H., Ottesen, D.K., and Harb, J.N. Energy & Fuels 7:755-760 (1 993) Adams, T.N., and Fredrick, W.J. fia$ Recovery Boiler Physical and Chemical Processes. American Paper Institute, 1988 The Infared Spectra Handbook of Inorganic Compounds. Sadtler Research Laboratories, a Division of Bio-Rad Laboratories, Inc., Philadelphia, 1984 Nyquist, R.A., and Kagel, R.O. Infrared Spectra of Inorganic Compounds. Academic Press, Inc., San Diego, 1971 Ferraro, J.R., Eds., The Sadtler Infrared Spectra Handbook of Minerals and Clqys (Sadtler Research Laboratories, a Division of Bio-Rad Laboratories, Inc., Philadelphia, 1982). Vassallo, A.M., and Finnie, K.S. Applied Spectroscopy 46:1477-1482 (1992) Mikkanen, P., Kauppinen, E.I., Jokiniemi, E.I., Sinquefield, S.A., Frederick, W.J., and Miikinen, M. AIChE Symposium Series 90:46-54 (1994) Mikkanen, P., Kauppinen, E.I., Jokiniemi, J.K., Sinquefield, S.A., and Frederick, W.J.
Ramodo, F., Bencivenni, L., Caminiti, R., and Sadun, C. Chemical Physics 151:179-186
Spoliti, M., Bencivenni, L., Cesaro, S.N., Geghil, R., and Maltese, M. Journal of Molecular Structure 74:297-299 (1981) Atkins, R.M., and Gingerich, K.A. Chemical Physical Letters 53:347-349 (1978) Belyaeva, A.A., Dvorkin, M.I., and Shcherba, L.D. Journal of Structural Chemistry
Nagaratbna, H.M., Bencivenni, L., and Gingerich, K.A. Journal of Chemical Physics
Ogden, J.S., and Williams, S.J. Journal of the Chemical Society Dalton Translation:456- 462 (1981) Baxter, L.L. Combustion and Flame 90: 174-1 84 (1992) Bates, J.B., Brooker, M.H., Quist, A.S., and Boyd, G.E. Journal of Physical Chemistry
Bates, J.B., and Boyd, G.E. Applied Spectroscopy 27:1973 (1973) Bates, J.B., in Fourier Transform Infrared Spectroscopy (J. R. Ferraro, L. J. Basile, Eds.) Academic Press, New York, 1978 Brooker, M.H., and Bates, J.B. Journal of Chemical Physics 54:4788-4796 (1971) Nakamoto, K. Infrared and Raman Spectroscopy of Inorganic and Coordination Compounh. Wiley, New York, 1986 Ross, S.D. Spectrochimica Acta 18:1575-1578 (1962)
TAPPI 77~81-84 (1994)
(1991)
21 :73 8-744 (1 980)
81 :591-598 (1984)
76~1565-1571 (1 972)
. -.
. 'I
* ;, A '. : I .
,.
-'. Portions of this document may be illegible in electronic image products. Images are produced from the best available original dOCUment.
,
26. 27.
28.
29. 30.
31.
32. 33. 34.
35. 36. 37.
38.
39.
Hester, R.E., and Krishnan, K. Journal of Chemical Physics 43:479-482 (1965) Walrden, G.E., Irish, D.E., and Young, T.F. Journal of Chemical Physics 37:662-670 (1 962) Bohren, C.F., and Huffman, D.R. Absorption and Scattering of Light by Small Particles, John Wiley & Sons, New York, 1983 Jasperse, J.R., Kahan, A., and Plendl, J.N. Physical Review 146:526-542 (1966) Mitra, S.S., and Nudehan, S., Eds., Far-Inzared Properties of Solids (Plenum Press, New York, 1970). Baxter, L.L., and Hardesty, D.R., Sandia National Laboratories, The Fate of Mineral Matter During Pulverized Coal Combustion: Quarterly Report for July-September 1992, Sandia Report, SAND93-8230, (1993). Hvistendahl, J., Rytter, E., and 0ye, H.A. Applied Spectroscopy 37: 182-1 87 (1 983) Cubicciotti, D., and Keneshea, F.J. High Temperature Science 4:32-40 (1972) Weast, R.E., Eds., Handbook of Chemistry and Physics (CRC Press, Cleveland, Ohio, 1976). Simmons, L.L., Lowdeon, L.F., and Ehlert, T.C. Journal of Chemical Physics 8 1 :706-709
Kulikov, V.A., Ugarov, V.V., and Rambidi, N.G. Journal of Structural Chemistry 23:158- 160 (1982) Buchler, A., Stafler, J.L., and Klemperer, W. Journal of Chemical Physics 46:605-608a (1 967) Ramondo, F., and Bencivenni, L. Journal of Molecular Structure 221:169-174 (1990)
(1992)
In Situ Analysis of Ash Deposits from Black Liquor Combustion P. Bernath4, Scott A. Sinquefield’, Larry L. Baxter, Gian Sclippa, C. Rohlfing, M. Barfield6
, Combustion Research Facility Sandia National Laboratories
Livermore, California 9455 1-0969
Corresponding Author Larry Baxter Sandia National Laboratories 7011 East Ave./MS 9052 Livermore, CA 94550 USA
Abstract Aerosols formed during combustion of black liquor cause a significant fire-side fouling problem in pulp mill recovery boilers. The ash deposits reduce heat transfer effectiveness, plug gas passages, and contribute to corrosion. Both vapors and condensation aerosols lead to the formation of such deposits. The high ash content of the fuel and the low dew point of the condensate salts lead to a high aerosol and vapor concentration in most boilers. In situ measurements of the chemical composition of these deposits is an important step in gaining a fundamental understanding of the deposition process. Infrared emission spectroscopy is used to characterize the composition of thin film deposits resulting from the combustion of black liquor and the deposition of submicron aerosols and vapors. New reference spectra of Na2SO4, K2S04, Na2C03 and K2CO3 pure component films were recorded and compared with the spectra of the black liquor deposit. All of the black liquor emission bands were identified using a combination of literature data and ab initio calculations. Ab initio calculations also predict the locations and intensities of bands for the alkali vapors of interest.
Introduction ’ Infrstred emission spectroscopy of solids is well known, but the technique has not been widely used primarily because bulk and powdered solids tend to give poor spectra due to multiple absorption, emission, and scattering of the radiation before it has a chance to- escape the sample [l-31. However, high quality spectra are obtainable fiom thin films and small particles with dimensions less than about 100 microns. Infrared emission spectroscopy is an excellent tool for the characterization of the surface of catalysts and the deposits formed in combustion processes. The use of the technique for characterization of coal and biomass deposits was previously illustrated [4, 51. We illustrate the potential of the technique with the deposits formed during the combustion of black liquor. These deposits are almost entirely Na2C03 and Na2S04. Black liquor is a recycled byproduct formed during the pulping of wood in the papermaking industry [6]. Na2S and NaOH are used to break down the complex organic glue, known as ‘lignin’, that binds wood fibers. In this process large amounts of carbonate are formed fiom oxidation of the organics, and the sulfide is oxidized to sulfate. After the fibers are removed fiom the caustic solution the solution is burned in boilers to recover and reuse the inorganic chemicals and generate process steam and elec,lricity, usually for on-site use. Such boilers are called recovery boilers, with the dominant process and boiler design being that developed by =aft - hence the term Kraft recovery boilers. As fired, black liquor is approximately one third organics (mostly from the wood), one third inorganics (mostly fiom the process), and one third water. The liquor used in this work was diluted to approximately 80% water. In the combustion environment of the recovery boiler, a fiaction of the inorganics vaporize and recondense to form submicron aerosols which deposit and foul heat transfer surfaces. The resulting decrease in boiler efficiency motivates the study of these salt film deposits. The strong bands at 880 cm” and 1140 cm-’ found in the black liquor deposit could be easily assigned to Na2C03 and Na2S04, respectively, but the weaker bands were more difficult to
1 assign. The spectra of Na2SO4 and K2SO4 solids available in the literature [7-101 were not of sufficient quality, therefore new reference spectra of solid Na2SO4, K2SO4, Na2C03 and K2C03 were recorded. The comparison of the emission spectra of these salt films with the spectra of the black liquor deposit allowed the identification of all of the unknown bands. Black liquor combustion generates alkali vapors, predominantly sodium salts (Na2SO4 and Na2CO3). As gas composition and temperature in a boiler change, a portion of these vapors form condensation aerosols with a mean diameter of about 0.7 microns [ll, 121. The aerosols and vapors are carried into the upper furnace, where they accumulate on relatively cool heat transfer surfaces. This paper details in situ, time-resolved detection of the accumulation of these materials on surfaces and provides ab initio calculations for the vibrational spectra of the vapors. Some infrared spectra of matrix-isolated sulfates [13-171 and carbonates [18] are published.
Experimental The Multifuel Combustor (MFC) at the Combustion Research Facility, Sandia National Labs., California [19] was used to make thin films of the black liquor deposit constituents, Na2SO4, K2SO4, Na2CO3, and K2CO3. The MFC is a down-fired, turbulent flow reactor of small pilot- scale size that allows for particle and gas temperature histories to be adjusted over a wide range of conditions. Total fuel residence time can vary fiom milliseconds to 5 s in the facility. In these experiments, black liquor and pure alkali salts were fired separately in the combustor. Spectroscopic analyses of thin films collected on simulated boiler tubes in the MFC provided reference spectra and sample spectra, respectively. For the salts, .aqueous solutions with concentrations of nominally 100 g/L were aspirated into the top of the combustor and carried through the furnace by a flow of nominally 30,Lls of air. The combustor's gas-fired preheater was not lit, but the silicon carbide (Sic) walls of the combustor were held at a temperature of 1000-1100°C by electrical Sic heating elements. The deposits were collected a\ the bottom of the combustor on a hollow rotating stainless steel rod 1.7 cm in diameter. The air flow through the combustor maintained the temperature of the rod at about 400°C. The salt deposits on the rod had a thickness of about 100-200 microns at the end of the experiments. In situ emission spectra of the salt films were recorded at the resolution of 2 cm" with a Biorad Model FTS 40/60 Fourier transform infrared spectrometer (FT-IR) equipped with a KBr backed beamsplitter and a DTGS detector. Spectra of the original rod surface were recorded prior to salt accumulation and subtracted fkom the salt spectra. Scans were collected over 10 minutes (256 scans) and were co-added for each of the original surface and the salt spectra. The resulting spectra (Figs. 1-4) exhibited high signal-to-noise ratios and good peak definition in the mid- infrared (350-3000 cm-') region. The deposit fiom the black liquor was prepared in a similar manner as the reference salt films. In this case the temperature of the walls of the furnace was about 900°C while the rotating stainless steel rod was at 300°C. The black liquor contained about 10% organic material, mainly lignin and its degradation products, that burned before the residual deposit formed. A time series of emission spectra (Fig. 5) of the deposit on the rod was recorded with the spectrometer. For each spectrum, 16 scans were co-added in 0.5 minutes of integration. After 52 minutes the black liquor flow was stopped and a final spectrum (Fig. 6) was measured.
. : . . .. .. , .
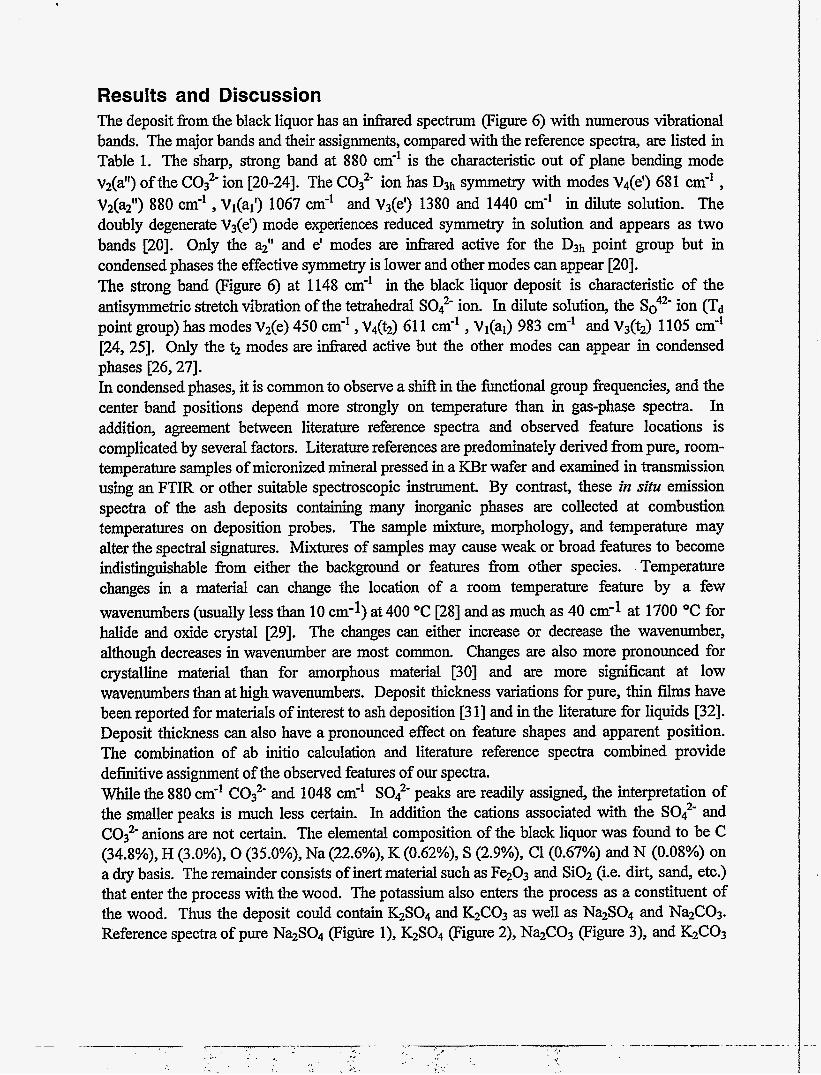
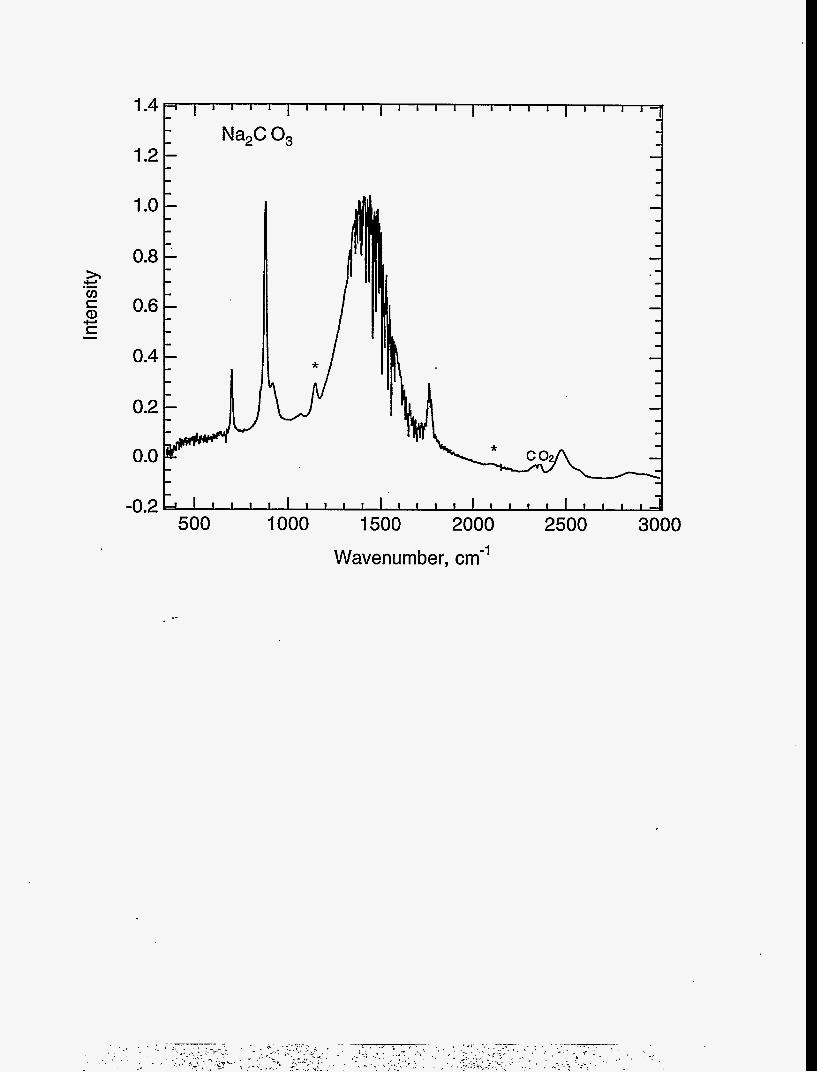
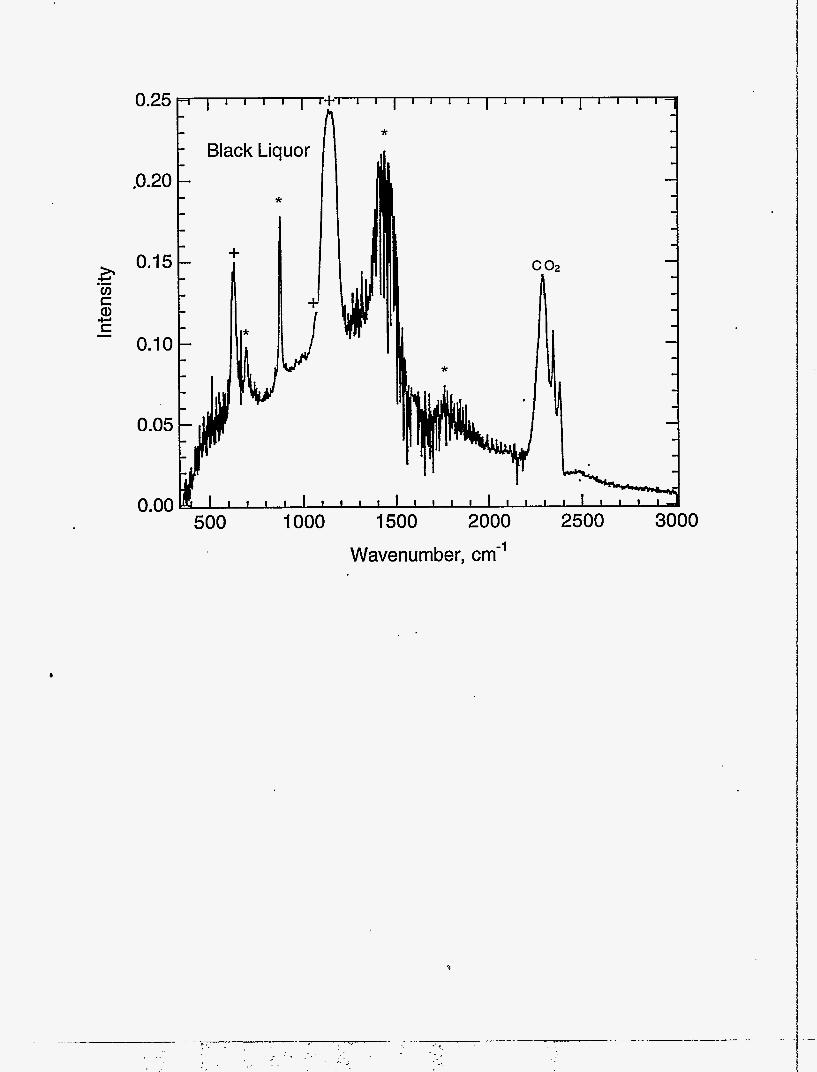
Results and Discussion The deposit from the black liquor has an infrared spectrum (Figure 6) with numerous vibrational bands. The major bands and their assignments, compared with the reference spectra, are listed in Table 1. The sharp, strong band at 880 cm-' is the characteristic out of plane bending mode v2(at') of the C0:- ion [20-241. The CO," ion has D3h symmetry with modes V4(e') 681 cm" , VZ(a$') 880 cm-' , V,(a,f) 1067 cm-' and V3(e') 1380 and 1440 cm-' in dilute solution. The doubly degenerate V3(e') mode experiences reduced symmetry in solution and appears as two bands [20]. Only the a i t and e' modes are infixed active for the D3h point group but in condensed phases the effective symmetry is lower and other modes can appear [20]. The strong band (Figure 6) at 1148 cm-' in the black liquor deposit is characteristic of the antisymmetric stretch vibration of the tetrahedral SO,"- ion. In dilute solution, the ion (Td point group) has modes V2(e) 450 cm" , v4(f2) 61 1 cm-' , Vl(a1) 983 cm-' and V3(t2) 1105 cm" [24, 251. Only the t2 modes are Mared active but the other modes can appear in condensed phases [26,27]. In condensed phases, it is common to observe a shift in the functional group frequencies, and the center band positions depend more strongly on temperature than in gas-phase spectra. In addition, agreement between literature reference spectra and observed feature locations is complicated by several factors. Literature references are predominately derived from pure, room- temperature samples of micronized mineral pressed in a KBr wafer and examined in transmission using an FTIR or other suitable spectroscopic instrument. By contrast, these in situ emission spectra of the ash deposits containing many inorganic phases are collected at combustion temperatures on deposition probes. The sample mixture, morphology, and temperature may alter the spectral signatures. Mixtures of samples may cause weak or broad features to become indistinguishable from either the background or features from other species. Temperature changes in a material can change the location of a room temperature feature by a few wavenumbers (usually less than 10 cm-1) at 400 "C [28] and as much as 40 cm-1 at 1700 "C for halide and oxide crystal [29]. The changes can either increase or decrease the wavenumber, although decreases in wavenumber are most common. Changes are also more pronounced for crystalline material than for amorphous material [30] and are more significant at low wavenumbers than at high wavenumbers. Deposit thickness variations for pure, thin films have been reported for materials of interest to ash deposition [3 11 and in the literature for liquids [32]. Deposit thickness can also have a pronounced effect on feature shapes and apparent position. The combination of ab initio calculation and literature reference spectra combined provide definitive assignment of the observed features of our spectra. While the 880 cm" CO?' and 1048 cm-' SO,"- peaks are readily assigned, the interpretation of the smaller peaks is much less certain. In addition the cations associated with the SO,"- and CO?- anions are not certain. The elemental composition of the black liquor was found to be C (34.8%), H (3.0%), 0 (35.0%), Na (22.6%), K (0.62%), S (2.9%), C1 (0.67%) and N (0.08%) on a dry basis. The remainder consists of inert material such as Fe2O3 and Si02 (i.e. dirt, sand, etc.) that enter the process with the wood. The potassium also enters the process as a constituent of the wood. Thus the deposit could confain K2SO4 and K2CO3 as well as Na2S04 and Na2CO3. Reference spectra of pure Na2S04 (Figtu-e l), K2SO4 (Figure 2), Na2C03 (Figure 3), and K2CO3
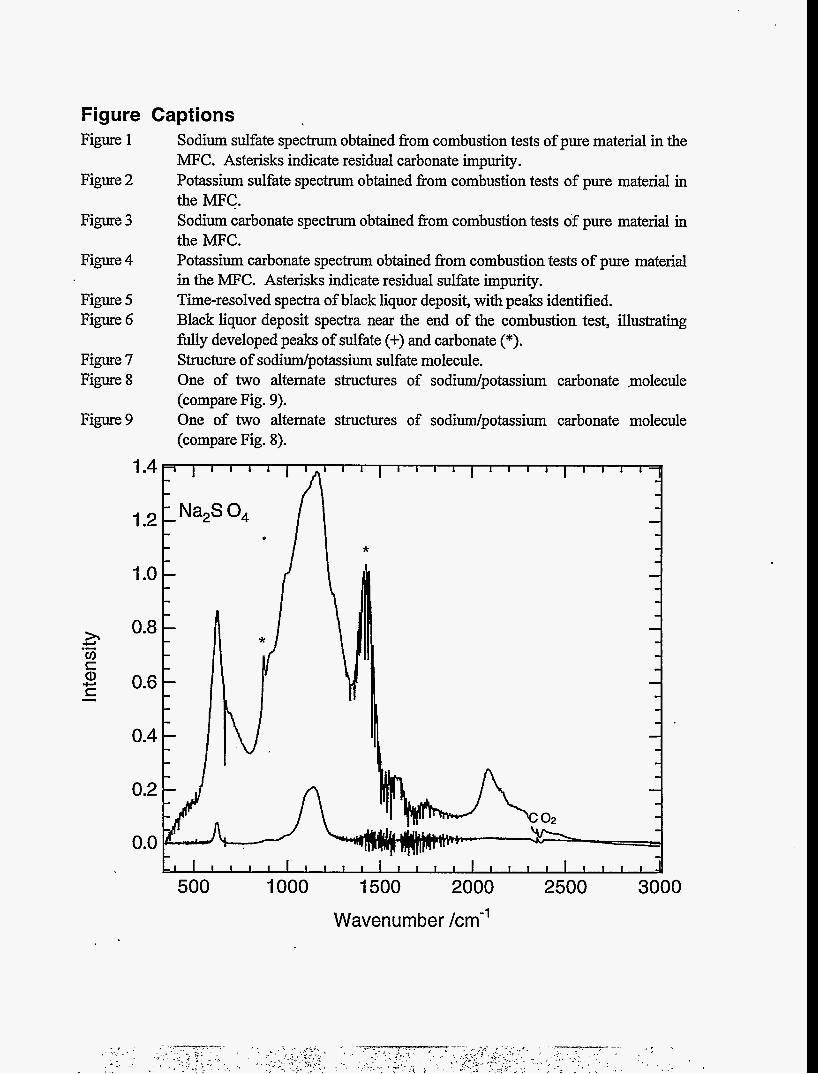
(Figure 4) were therefore recorded for comparison purposes and the bands measured (Tables 1 and 2). The observed sulfate bands were readily assigned on the basis of previous work [24-271. The forbidden V,(e) mode near 450 cm” was too weak to identifl but the symmetric stretching vibration Vl(a1) appeared as a shoulder. Two weak bands appeared near 2100 cm-’ and are assigned in the literature [26] as the V I + V3 combination band and the 2V3 overtone. The v1 + V3 assignment is plausible since the predicted band position is 2132 cm-’, but the 2V3 assignment for the 2153 cm-’ band (Na2SO4) is less certain since 2 x V3 = 2274 cm-’ . The assignments for the Na2C03 and K2CO3 spectra were also straightforward (Table 2). All of the four CO?‘ modes were found as well as several overtones and combination bands. Interestingly the overtones and combination bands which contain V3 are all split into two bands. This splitting of the V3 fundamental is well-known in solutions and melts [20] but is not obvious (Figures 3 and 4) in the spectra of the solids. The V3 fundamental is badly chopped up by water vapor in our spectra. The direct comparison of Figs 1-4 with Fig. 6 allows all of the bands in the black liquor deposit to be assigned (Table 1). There is no clear evidence for &SO4 and K2CO3 in the deposit, but they cannot be ruled out because most of their band positions are nearly co-incident with the corresponding Na2SO4 and Na2C03 bands. They would, in any case, be a fairly minor constituent of the deposit based on the black liquor composition. Surprisingly the high temperature behavior of Na2SO4 and Na2C03 is not well established. The decomposition reactions:
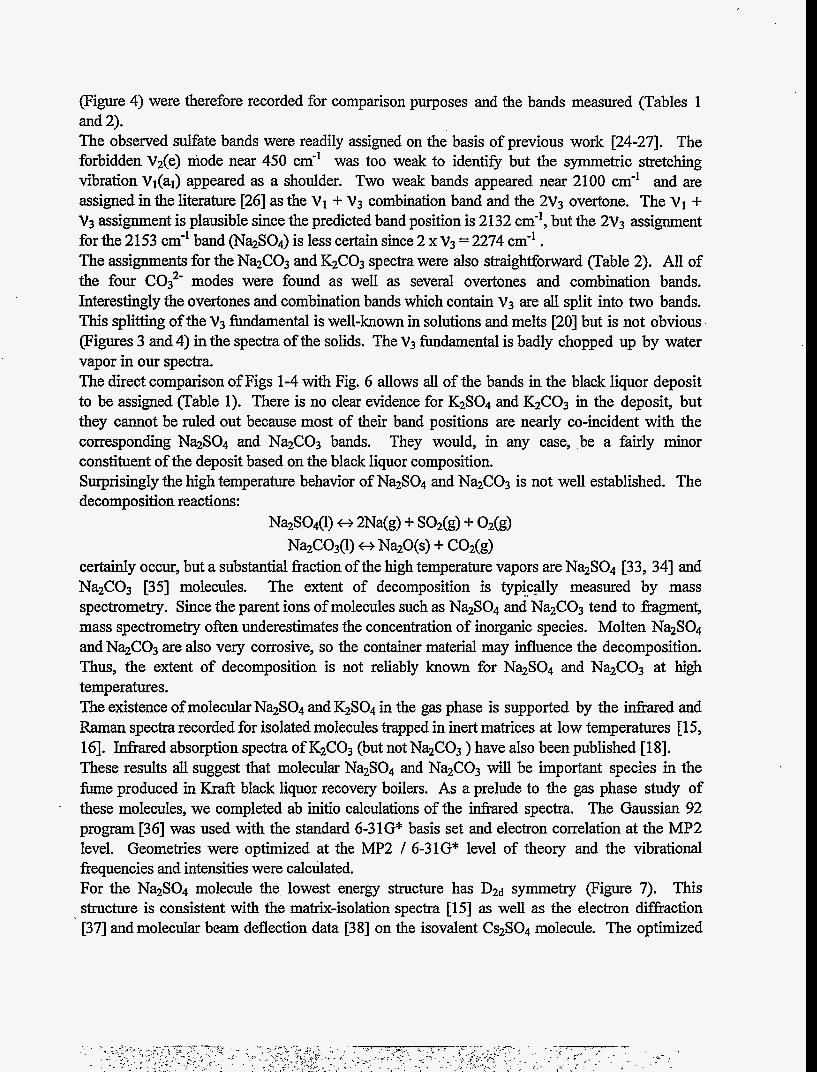
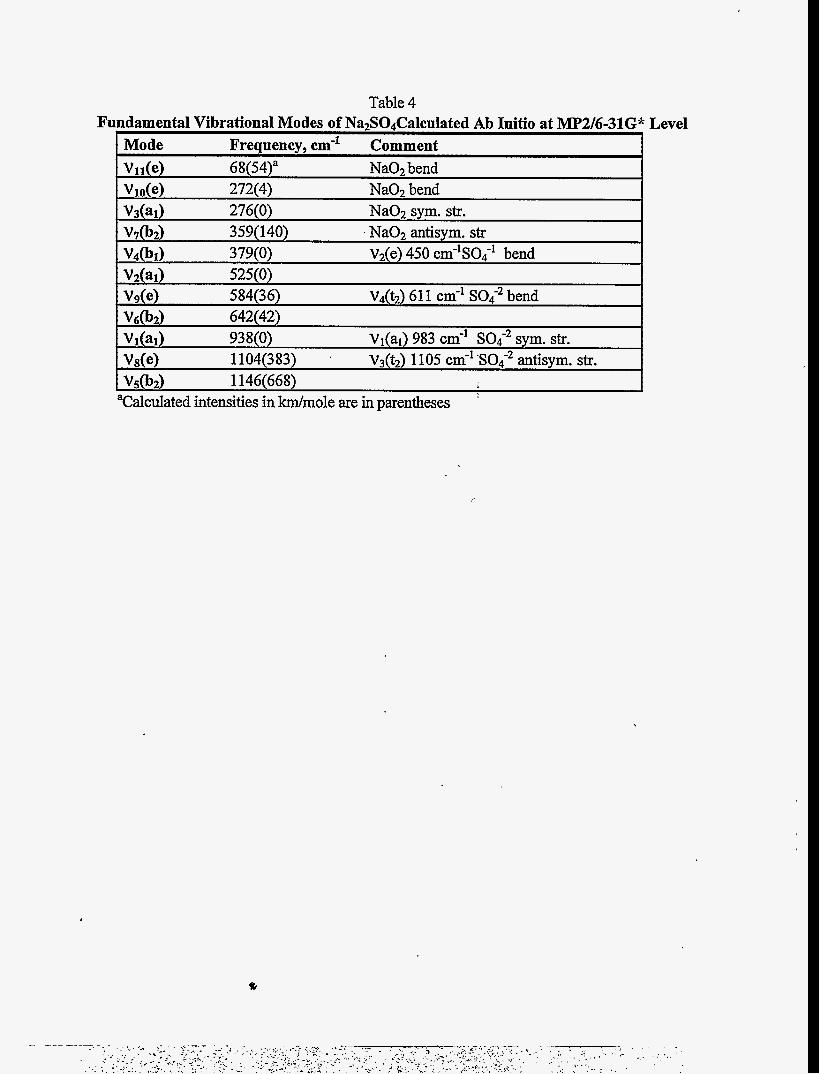
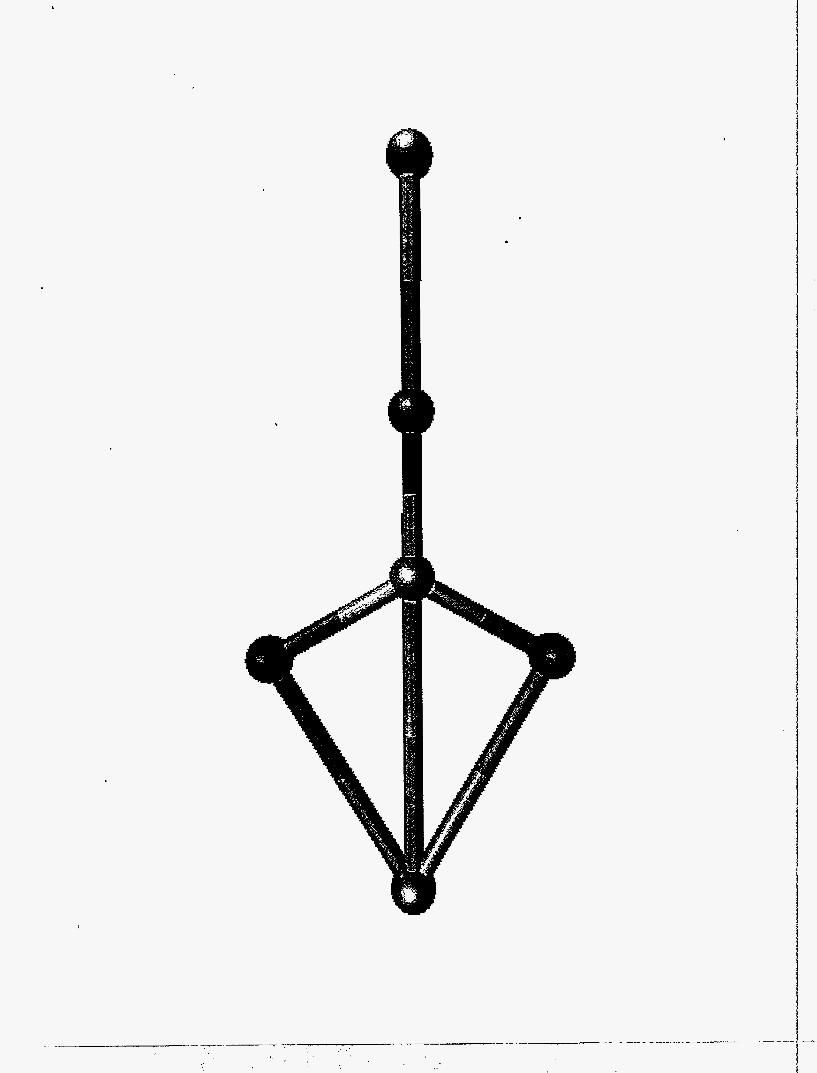
certainly occur, but a substantial fraction of the high temperature vapors are Na2SO4 [33, 341 and Na2C03 [35] molecules. The extent of decomposition is typically measured by mass spectrometry. Since the parent ions of molecules such as Na2S04 and Na2C03 tend to fragment, mass spectrometry often underestimates the concentration of inorganic species. Molten Na2SO4 andNa2CO3 are also very corrosive, so the container material may influence the decomposition. Thus, the extent of decomposition is not reliably known for Na2SO4 and Na2C03 at high temperatures. The existence of molecular Na2SO4 and &SO4 in the gas phase is supported by the infrared and Raman spectra recorded for isolated molecules trapped in inea matrices at low temperatures [ 15, 161. Mared absorption spectra of K2C03 (but not Na2C03 ) have also been published [18]. These results all suggest that molecular Na2S04 and Na2C03 will be important species in the fume produced in Kraft black liquor recovery boilers. As a prelude to the gas phase study of these molecules, we completed ab initio calculations of the infrared spectra. The Gaussian 92 program [36] was used with the standard 6-31G* basis set and electron correlation at the MP2 level. Geometries were optimized at the MP2 / 6-31G* level of theory and the vibrational frequencies and intensities were calculated. For the Na2S04 molecule the lowest energy structure has D2d symmetry (Figure 7). This structure is consistent with the matrix-isolation spectra [15] as well as the electron difflaction [37] andmolecular beam deflection data [38] on the isovalent Cs2SO4 molecule. The optimized
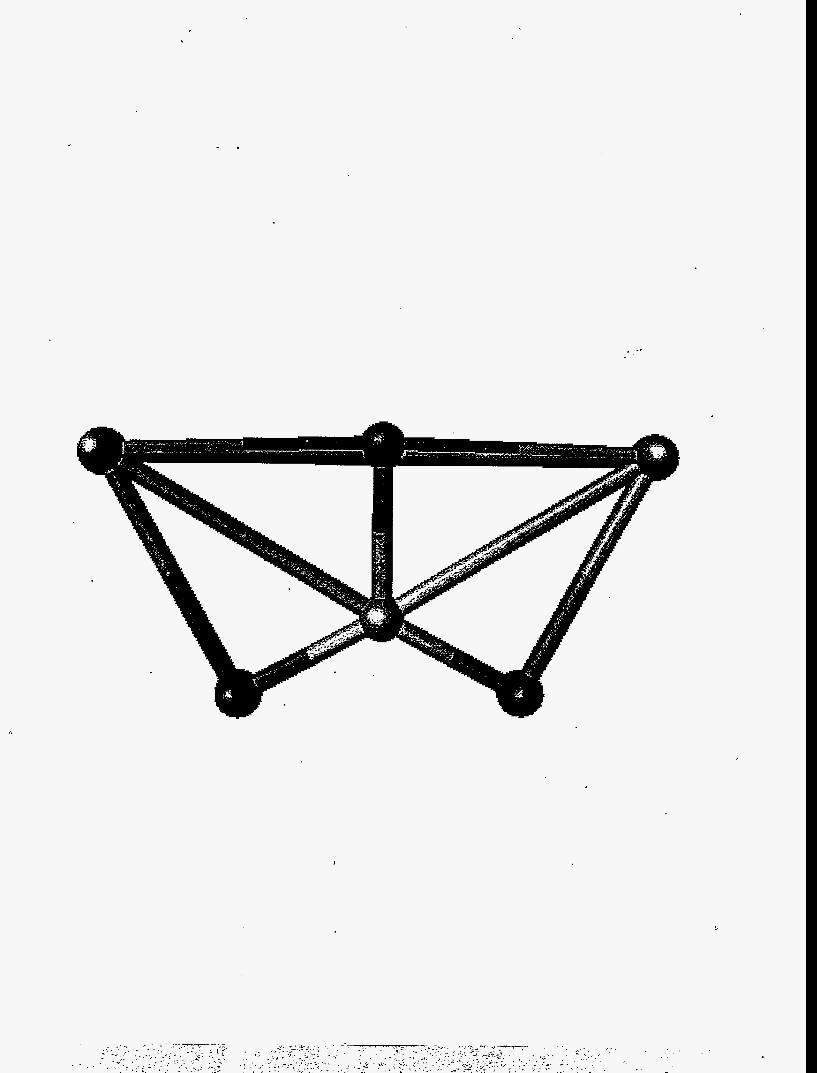
geometry has a S-0 bond length of 1.517A and a Na-0 bond length of 2.205 A. The S-0 bond lengths are typically 1.47 A for the SO,"- anion in crystals [13], 1.471 derived fiom the electron diffraction results on Cs2SO4 [38], and 1.48 A calculated for Li2SO4 [13]. The 0-S-0 bond angles are calculated to be 107.3" facing a Na atom and 1 10.6" facing away fiom Na. The predicted vibrational frequencies and intensities of Na2S04 are reported in Table 4. The only experimental values available for comparison are the N2 matrix values [15] of 113 1 cm-' V5(b2), 1103 cm" and 1097 cm" Vg(e), 961 cm" Vl(al), 640 cm-' V&2) and 610 cm-' V,(e). The calculations for Na2C03 were carried out for two molecular geometries of symmetry (Figures 8 and 9). The matrix isolation results are unable to distinguish between the two possibilities but calculations on Li2CO3 [39] indicate that the structure with two bidentate bonds to the Na atoms (Figure 9) as the ground state. For Na2C03 our calculations predict that the structure in Figure 8 is a local minimum in the total energy, but it lies 20.4 kdmole above the structure in Figure 9. The lowest energy structure (Figure 9) has two C-0 bond lengths of 1.285 A (on the left) and one of 1.367 A (on the right). The Na-0 bond lengths are 2.170 A (to the left) and 2.185 A (to the right). The 0-C-0 angles are close to 120" with two values of 118.1" facing Na atoms and 123.9" facing away fiom Na atoms. The calculated vibrational frequencies and intensities are reported in Table 5. There are no suitable experimental Na2C03 values for comparison.
Conclusions Inorganic material accumulating on surfaces during black liquor combustion lends itself to analysis by emission FTIR spectroscopy. Properly instrumented laboratory reactors and diagnostics allow the determination of emission spectra fiom thin films (=lo0 p) of alkali salts and of black liquor ash deposits on simulated heat transfer surfaces. Spectral analysis indicates agreement between the assignment of bands, using ab initio calculations in all cases and literature values in some cases. Spectra with good signal-to-noise ratios and well-defined structure are obtainable fiom both pure materials and mixed materials generated by the combustion of industrial feedstreams. Ab initio calculations also predict the band locations and intensities of allCali salt vapors, whose existence in practical combustion systems is suspected but has yet to be confirmed. The formation of ash deposits in the upper furnace of recovery boilers is dependent primarily on the concentrations and properties of these sdt vapors, their condensation aerosols, and their reaction products. . These data and calculations provide baseline information for quantitatively determining vapor concentrations and demonstrate the determination of the resulting ash deposits fiom such combustion systems.
1.
2. 3. 4.
5.
6.
7.
8.
9.
10. 11.
12.
13.
14.
15. 16.
17.
18.
19. 20.
21. 22.
23.
References Huong, P.V. Advances in Infrared and Raman Spectroscopy. R. J.H. Clark andR.E.Hester, Heyden, London, 1978 Fabbri, G., and Baraldi, P. Applied Spectroscopy 26:593-599 (1972) Baraldi, P., and Fabbri, G. Spectrochimica Acta 39A:669-675 (1983) Baxter, L.L. Engineering Foundation Conference on The Impact of Ash Deposition on Coal-Fired Plants. 1993, Baxter, L.L., Richards, G.H., Ottesen, D.K., and Harb, J.N. Energy & Fuels 7:755-760 (1 993) Adams, T.N., and Fredrick, W.J. Kba$ Recovery Boiler Physical and Chemical Processes. American Paper Institute, 1988 The Infrared Spectra Handbook of Inorganic Compounds. Sadtler Research Laboratories, a Division of Bio-Rad Laboratories, Inc., Philadelphia, 1984 Nyquist, R.A., and Kagel, R.O. Infrared Spectra of Inorganic Compounds. Academic Press, Inc., San Diego, 1971 Ferraro, J.R., Eds., The Sadtler Inpared Spectra Handbook of Minerals and Clays (Sadtler Research Laboratories, a Division of Bio-Rad Laboratories, Inc., Philadelphia, 1982). Vassallo, A.M., and Finnie, K.S. Applied Spectroscopy 46: 1477-1482 (1 992) Mikkanen, P., Kauppinen, E.I., Jokiniemi, E.I., Sinquefield, S.A., Frederick, W.J., and Miikhen, M. AIChE Symposium Series 90:46-54 (1994) Mikkanen, P., Kauppinen, E.I., Jokiniemi, J.K., Sinquefield, S.A., and Frederick, W.J.
Ramodo, F., Bencivenni, L., C d t i , R., and Sadun, C. Chemical Physics 151:179-186
Spoliti, M., Bencivenni, L., Cesaro, S.N., Geghil, R, and Maltese, M. Journal of Molecular Structure 74:297-299 (1 98 1) Atkins, R.M., and Gingerich, K.A. Chemical Physical Letters 53:347-349 (1978) Belyaeva, A.A., Dvorkin, M.I., and Shcherba, L.D. Journal of Structural Chemistry
Nagarathna, H.M., Bencivenni, L., and Gingerich, K.A. Journal of Chemical Physics
Ogden, J.S., and Williams, S.J. Journal of the Chemical Society Dalton Translation:456- 462 (1981) Baxter, L.L. Combustion and Flame 9OI174-184 (1992) Bates, J.B., Brooker, M.H., Quist, A.S., and Boyd, G.E. Journal of Physical Chemistry
Bates, J.B., and Boyd, G.E. Applied Spectroscopy 27: 1973 (1 973) Bates, J.B., in Fourier Transform Infrared Spectroscopy (J. R. Ferraro, L. J. Basile, Eds.) Academic Press, New York, 1978 Brooker, M.H., and Bates, J.B. Journal of Chemical Physics 54:4788-4796 (1971)
TMPI 7791-84 (1994)
(1991)
21:738-7;14 (1980)
8 1~591-598 (1984)
76~1565-1571 (1972)
24.
25. 26. 27.
28.
29. 30.
31.
32. 33. 34.
35. 36. 37.
38.
39.
Nakamoto, K. InJFared and Raman Spectroscopy of Inorganic and Coordination Compounds. Wiley, New York, 1986 Ross, S.D. Spectrochimica Acta 18:1575-1578 (1962) Hester, R.E., and Krishnan, K. Journal of Chemical Physics 43:479-482 (1 965) Walrden, G.E., Irish, D.E., and Young, T.F. Journal of Chemical Physics 37:662-670 (1 962) Bohren, C.F., and Huffinan, D.R. Absorption and Scattering of Light by Small Particles. John Wiley & Sons, New York, 1983 Jasperse, J.R, Kahan, A., and Plendl, J.N. Physical Review 146:526-542 (1966) Mitra, S.S., and Nudelman, S., Eds., Far-Inpared Properties of Solids (Plenum Press, New York, 1970). Baxter, L.L., and Hardesty, D.R., Sandia National Laboratories, The Fate of Mineral Matter During Pulverized Coal Combustion: Quarterly Report for July-September 1992, Sandia Report, SAND93-8230, (1993). Hvistendahl, J., Rytter, E., and 0ye, H.A. Applied Spectroscopy 37:182-187 (1983) Cubicciotti, D., and Keneshea, F.J. High Temperature Science 4:32-40 (1972) Weast, RE., Eds., Handbook of Chemistry and Physics (CRC Press, Cleveland, Ohio, 1976). Simmons, L.L., Lowdeon, L.F., and Ehlert, T.C. Journal of Chemical Physics 81:706-709
Kulikov, V.A., Ugarov, V.V., and Rambidi, N.G. Journal of Structural Chemistry 23:158- 160 (1982) Buchler, A., Stauffer, J.L., and Klemperer; W. Journal of Chemical Physics 46:605-608a (1 967) Ramondo, F., and Bencivenni, L. Journal of Molecular Structure 221:169-174 (1990)
(1 992)
Table 1. Vibrational Band Positions of the Black Liquor Deposit (cm-')
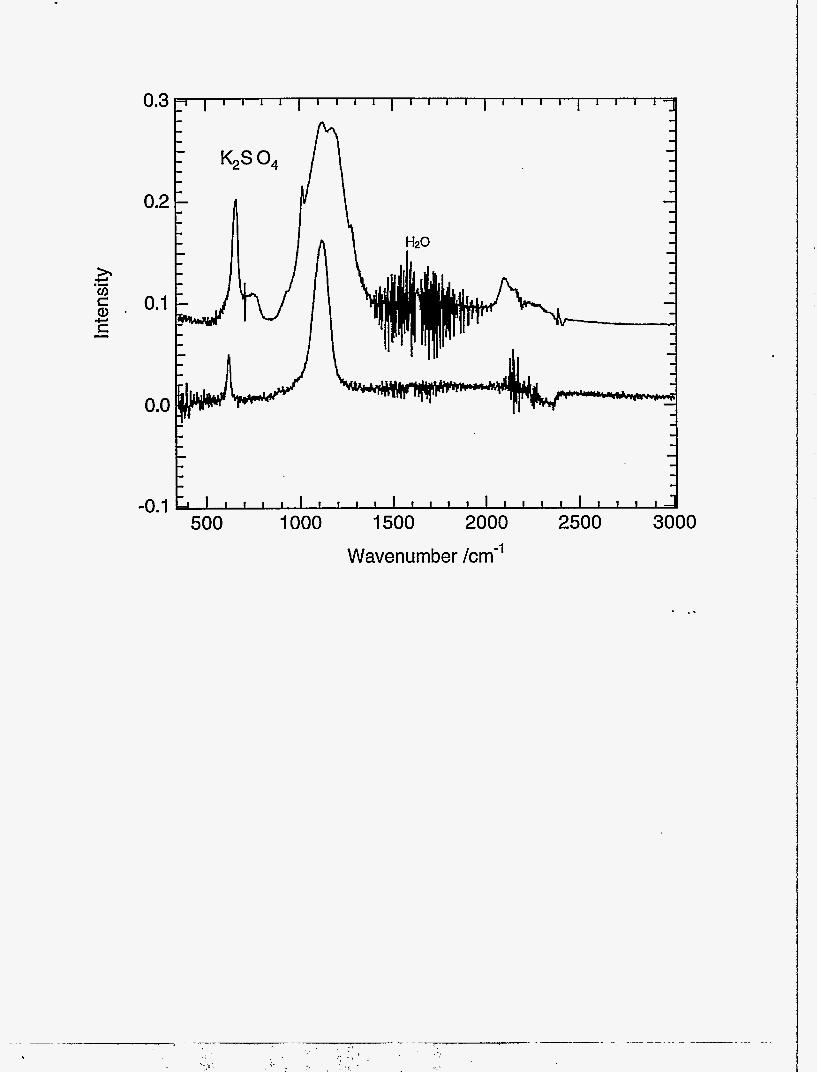
Sodium sulfate spectrum obtained from combustion tests of pure material in the MFC. Asterisks indicate residual carbonate impurity. Potassium sulfate spectrum obtained from combustion tests of pure material in the MFC. Sodium carbonate spectrum obtained from combustion tests of pure material in the MFC. Potassium carbonate spectrum obtained from combustion tests of pure material in the MFC. Asterisks indicate residual sulfate impurity. Time-resolved spectra of black liquor deposit, with peaks identified. Black liquor deposit spectra near the end of the combustion test, illustrating fully developed peaks of sulfate (+) and carbonate (*). Structure of sodidpotassium sulfate molecule. One of two alternate structures of sodidpotassium carbonate .molecule (compare Fig. 9). One of two alternate structures of soditudpotassium carbonate molecule (compare Fig. 8).
1.4
1.2
1 .o
0.8
0.6
0.4
0.2
0.0
500 1000 1500 2000 2500 3000
Wavenumber /cm-’
0.3
0.2
0.1
0.0
-0.1
1.4
1.2
1 .o
0.8
0.6
0.4
0.2
0.0
-0.2 500 1000 1500 2000 2500 3000
Wavenumber, cm-’
, _ _ , ., , ’ -.’ I ~- I.
. . . . - . . . > . - . . . . . . . . *
, I .
0.8 1 0.6
0.4
0.2
0.0
-0.2
Wavenumber /cm-’
0.30
0.25
0.20
0.1 5
0.1 0
0.05
0.00
I I ( I l I I l l l l ( l 1 l I l I l l ~ l I I l l l l l ~ l l l l 1 1 1 1 ~ 1 1 1 1 1 1 1 1 - - - Black Liquor Fume Deposit Sodium Carbonate w/ -- - - -- referenece (clean tube) Steam Interference -


![Liquor (Artisan Liquor) Amendment Bill 2020€¦ · (a) the total volume of craft beer that may be [s 10] Liquor (Artisan Liquor) Amendment Bill 2020 v21 Page 11 Authorised by the](https://static.documents.pub/doc/80x56/602eeddf375040488f6ed805/liquor-artisan-liquor-amendment-bill-2020-a-the-total-volume-of-craft-beer-that.jpg)


