Page 1
The Pennsylvania State University
The Graduate School
Department of Energy and Mineral Engineering
IN SITU DIAGNOSIS OF ELECTROLYTIC AND FUEL CELLS USING
ELECTROCHEMICAL IMPEDANCE SPECTROSCOPY
A Dissertation in
Energy and Mineral Engineering
by
Sanchit Khurana
2014 Sanchit Khurana
Submitted in Partial Fulfillment
of the Requirements
for the Degree of
Doctor of Philosophy
August 2014
Page 2
The thesis of Sanchit Khurana was reviewed and approved* by the following:
Serguei Lvov
Professor of Energy and Mineral Engineering & Materials Science and
Engineering, Director of Electrochemical Technologies Program
Dissertation Advisor
Chair of Committee
Derek Elsworth
Professor of Energy and Mineral Engineering & the Center for
Geomechanics, Geofluids, and Geohazards
Michael Hickner
Associate Professor of Materials Science and Engineering & Chemical
Engineering
Jeremy Gernand
Assistant Professor of Energy and Mineral Engineering
Luis F. Ayala H
Associate Professor of Petroleum and Natural Gas Engineering
Associate Department Head for Graduate Education
*Signatures are on file in the Graduate School
Page 3
iii
ABSTRACT
In situ EIS data are presented for the CuCl/HCl electrolyzer and Liquid Metal Anode
Solid Oxide Fuel Cells (LMA-SOFC) operating under different conditions. The durability
of the CuCl electrolyzer operating for 168 hours while maintaining the high current
density of 0.3 A cm-2
under 0.7 V is reported for the first time. The impedance spectra of
the cell, along with the polarization curves (V-I data), show the effect of operating
temperature and contact pressure at the end plates of the membrane electrode assembly
(MEA).
After the durability test, the potential required to maintain the cell at 0.3 A cm-2
increased from 630 mV of the fresh membrane electrode assembly (MEA) to 710 mV.
The increase in the ohmic resistance of the membrane by 41 % was observed to be the
primary cause of degradation. Starting from 0.6 Ω cm2, there was a small change in the
ohmic resistance of the cell during the first 90 hours, followed by a significant increase of
25 %, and then attained a steady value of 0.85 Ω cm2. Simultaneously, a change in the
decomposition potential was observed as it increased from 0.18 V in the beginning to
0.25 V at the end of testing. This is mainly due to the decrease in efficiency of the
regeneration column and dilution of the anolyte solution over time. Further, the use of
EIS in the through-plane conductivity cell proved to be a reliable and time-efficient
method for evaluation new and existing membranes before testing in the electrolyzer.
A liquid metal anode solid oxide fuel cell (LMA-SOFC) is constructed to study the
kinetics and transport properties of the system. The behavior of the system is investigated
by operating the cell as a metal-air battery while operating under argon, and as a fuel cell
Page 4
iv
with hydrogen and coal as the fuel feeds. EIS signatures and OCP analysis provides
insight into the reaction mechanism and indicate the formation of a SnO2 layer at the
electrolyte/anode interface. The OCP of 0.885 and 1.117 V was observed for the coal and
hydrogen powered fuel cell, respectively. The results show the gradual increase in
efficiency of the reduction of SnO2 by using carbon and hydrogen as the fuels. The EIS
spectra obtained for the hydrogen fed cell was a characteristic of the diffusion controlled
systems and equivalent circuit modeling was used to calculate the oxygen diffusion
coefficients. The effective oxygen diffusion coefficients of 1.9 10-3
cm2 s
-1 at 700 ºC, 2.3
10-3
cm2 s
-1 at 800 ºC and 3.5 10
-3 cm
2 s
-1 at 900 ºC are similar to the published results.
The resistance added by the SnO2 layer was the primary cause of degradation and further
improvements in performance rely heavily on minimizing losses in the liquid Sn layer.
Page 5
v
TABLE OF CONTENTS
List of Figures .............................................................................................................. vii
List of Tables ............................................................................................................... xi
Acknowledgements ...................................................................................................... xii
Chapter 1 .................................................................................................................................. 13
Introduction .............................................................................................................................. 13
1.1 Research Contributions and Motivation ................................................................... 13 1.2 Background .............................................................................................................. 15 1.3 Overview of the dissertation .................................................................................... 23
Chapter 2 Diagnosis and Modeling of the CuCl Electrolyzer Using Electrochemical
Impedance Spectroscopy .................................................................................................. 30
Preface to Chapter 2 ......................................................................................................... 30 Abstract ............................................................................................................................ 31 Introduction ...................................................................................................................... 31 Experimental .................................................................................................................... 33 Results and Discussions ................................................................................................... 36 Conclusions ...................................................................................................................... 43 Acknowledgements .......................................................................................................... 43
Chapter 3 State of Health of the CuCl electrolyzer during a 168 h test .................................. 46
Preface to Chapter 3 ......................................................................................................... 46 Abstract ............................................................................................................................ 47 Introduction ...................................................................................................................... 48 Experimental .................................................................................................................... 49 Results and Discussions ................................................................................................... 51 Conclusions ...................................................................................................................... 69 Acknowledgement ........................................................................................................... 70
Chapter 4 Performance analysis and characterization of a liquid tin anode solid oxide
fuel cell ............................................................................................................................. 75
Preface to Chapter 4 ......................................................................................................... 75
Introduction .............................................................................................................................. 76
Page 6
vi
Experimental ............................................................................................................................ 78
Cell preparation ................................................................................................................ 78 Electrochemical testing .................................................................................................... 79 Cathode symmetry cell ..................................................................................................... 80
Results and discussion ............................................................................................................. 80
AC impedance and OCP analysis .................................................................................... 80 Warburg impedance for the hydrogen fueled LMA-SOFC.............................................. 86 Performance degradation in LMA-SOFC ........................................................................ 88
Summary .................................................................................................................................. 91
Acknowledgement ................................................................................................................... 92
Chapter 4 References ............................................................................................................... 93
Chapter 5 Summary ................................................................................................................ 97
Chapter 6 .................................................................................................................................. 99
Conclusions and Future Work ................................................................................................. 99
Page 7
vii
LIST OF FIGURES
Figure 1- 1 Different circuit models fitting the same EIS data ................................................ 17
Figure 1- 2 A schematic of LMA-SOFC along with an equivalent circuit model to show
various resistances. ........................................................................................................... 20
Figure 1-3 Conceptual schematic of CuCl electrolysis with a proton exchange membrane;
adapted from [34] ............................................................................................................. 22
Figure 2- 1Conceptual schematic of CuCl electrolysis with a proton exchange membrane;
adapted from (15) ............................................................................................................. 34
Figure 2- 2 Schematic of the CuCl electrolyzer system describing the processes in the
CuCl electrolysis system. T-1: catholyte recirculation tank; T-2: anolyte
recirculation tank; T-3: H2 gas collection tank; T-4: displacement tank; T-5: vapor
diffuser tank ..................................................................................................................... 35
Figure 2- 3 Nyquist plots at 0 V of the CuCl electrolytic cell representing decrease in
overall impedance with increase in temperature. ............................................................. 36
Figure 2- 4 Polarization curves showing the increase in the current density as the
temperature was raised from 40 to 80 ºC ......................................................................... 37
Figure 2- 5. Equivalent circuit model used to simulate the experimental data: Rohm
represents the ohmic resistance of the cell, Rct; charge transfer resistance, and Rm;
interfacial resistance ......................................................................................................... 38
Figure 2- 6. Experimental data and the simulation results ....................................................... 39
Page 8
viii
Figure 2- 7. EIS data at 40 and 80 ºC for the cell operating under an applied potential of
0.4 V (left) and the zoomed in section (right) to highlight the change in impedance
as the temperature was increased. .................................................................................... 40
Figure 2- 8. The figure shows the decrease in ohmic resistance as the clamping torque
was increased from 10 to 20 Nm by altering the applied pressure from 3.2 psi to 6.3
psi. .................................................................................................................................... 41
Figure 2- 9. Polarization curves representing increase in the overall performance as the
clamping torque was increased by altering the applied pressure ..................................... 42
Figure 3- 1. Decrease in the current density during the 168 h test. .......................................... 51
Figure 3- 2. Gradual change in the EIS spectra at DP during a 16 h daily cycle (left) and
I-V curve showing the corresponding increase in the current density with time
(right) as the cell impedance decreased. .......................................................................... 52
Figure 3- 3. EIS spectra obtained at DP in the concluding phase of the test representing
the degraded nature of the CuCl/HCl electrolyzer (left) and I-V curve representing
the stable current density (right). ..................................................................................... 53
Figure 3- 4. Variation of experimentally obtained DP as a function of operational time. ....... 53
Figure 3- 5. Equivalent circuit model with the simulation of the experimental data
obtained at the overpotential of 0.2 V. ............................................................................. 55
Figure 3- 6. EIS spectra at 0.2 V overpotential representing the degradation of the
CuCl/HCl electrolyzer with time. .................................................................................... 56
Page 9
ix
Figure 3- 7. Evolution of ohmic resistance over 168 h of operation. ....................................... 58
Figure 3- 8. Experimentally obtained EIS data at DP and overpotentials of 0.2 and 0.4 V. .... 59
Figure 3- 9. H2(g) production in CuCl/HCl electrolyzer using [2 mol/L CuCl(aq) + 7
mol•L-1 HCl(aq)] anolyte and 7 mol•L-1 HCl (aq) catholyte at 80 ºC ............................ 62
Figure 3- 10. Voltage efficiency of the CuCl/HCl electrolytic cell. The dotted line
represents the extrapolation to the theoretical efficiency at DP. ...................................... 63
Figure 4-1. Impedance spectra generated by liquid tin anode SOFC at 900 °C under argon
and hydrogen anode feeds. A 10 mV alternating potential is applied at a range of
frequencies 10 kHz to 50 mHz plotted (left) and high frequency close-up (right). ......... 81
Figure 4-2. Impedance spectra generated by the liquid tin anode SOFC at 900 °C under
coal. .................................................................................................................................. 82
Figure 4-3. Equivalent circuit models used in fitting LMA-SOFC: Argon and coal fed
LMA-SOFC model (top); Equivalent circuit model used to fit hydrogen fueled
LMA-SOFC (bottom). ..................................................................................................... 82
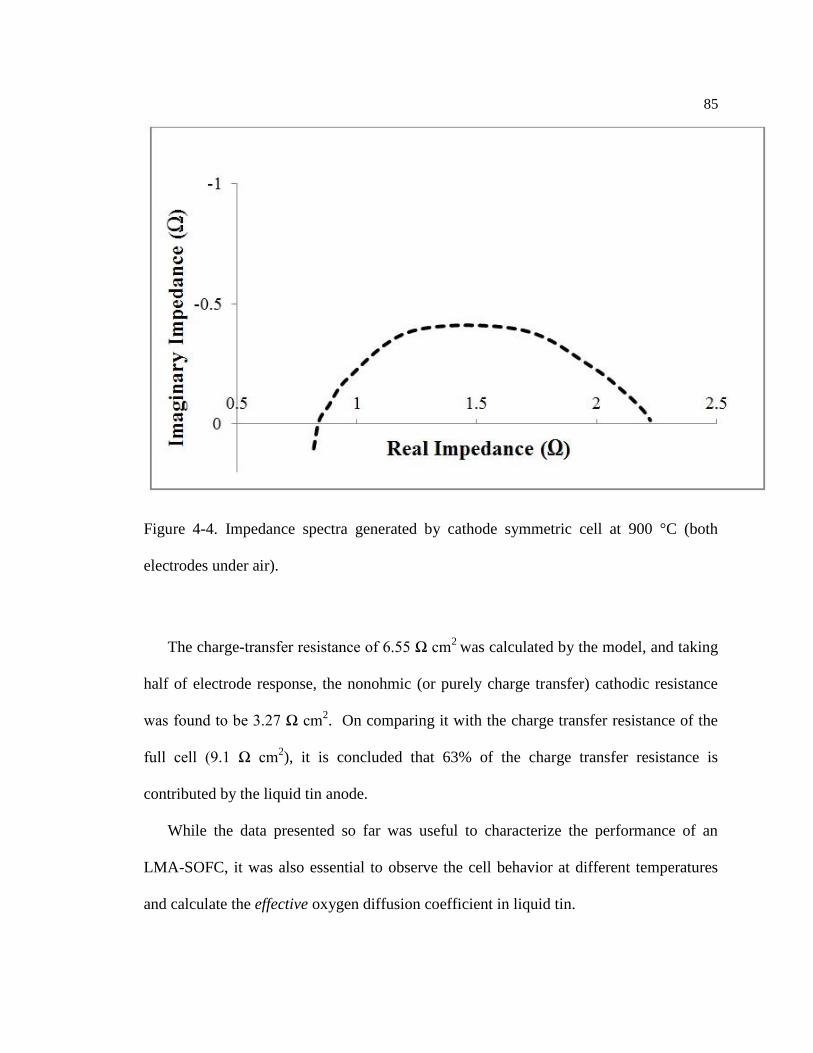
Figure 4-4. Impedance spectra generated by cathode symmetric cell at 900 °C (both
electrodes under air). ........................................................................................................ 85
Figure 4-5. Impedance spectra generated by liquid tin anode SOFC at different
temperatures under hydrogen anode feed. A 10 mV alternating potential is applied at
a range of frequencies 10 kHz to 50 mHz plotted (left) and high frequency close-up
(right). .............................................................................................................................. 86
Page 10
x
Figure 4-6. Equivalent circuit model with the addition of Warburg element (W) to
calculate the diffusion coefficient. ................................................................................... 87
Figure 4-7. Decline in current at 0.4 V over 10 polarization cycles. ....................................... 89
Figure 4-8. EIS spectra for the LMA-SOFC at OCP operating under hydrogen at 900 ºC
representing the degradation over time. ........................................................................... 90
Page 11
xi
LIST OF TABLES
TABLE 2-1. Ohmic Resistance for the EIS Data taken at 0 V ................................................ 39
Table 3-1. Parameters of equivalent circuit model shown in Figure 5 used in simulating
the CuCl/HCl electrolyzer individual reaction process related to the ohmic, charge-
transfer and mass-transfer resistances. ............................................................................. 56
Table 3-2. Percentage contribution of each resistance at overpotentials of 0.2 and 0.4 V. ..... 59
Table 3-3. Apparent Gibbs energy values of Reaction (2) species at 80 oC and 1 bar [20]. .... 65
Table 3-4. The activity coefficients of HCl(aq) at 80 oC and 1 bar as a function of
molality b [21] .................................................................................................................. 65
Table 3-5: Estimations of CuCl3-(aq) concentrations for the 168 hour test using measured
DP .................................................................................................................................... 68
Table 4-1. Area specific ohmic, charge transfer and mass transfer resistance values for
the cell operated under different fuels with the corresponding OCP. .............................. 83
Table 4-2. Time constants with the calculated values of diffusion coefficients at different
temperatures. .................................................................................................................... 88
Page 12
xii
ACKNOWLEDGEMENTS
First, I would like to express my sincere gratitude to my advisor, Dr. Serguei Lvov,
for his constant support, advice, and encouragement throughout my graduate study. I
really appreciate his timely help on different occasions and his great sense of humor,
which made my research enjoyable. Apart from a great scientist, he is a very good
teacher and I have greatly benefitted from his innovative techniques to learn different
areas of electrochemical engineering. His scientific attitude and accomplishments in the
area of electrochemical science and engineering always motivate me to grow as a
researcher.
I would also like to extend my sincere gratitude to Dr. Michael Hickner, Dr. Derek
Elsworth, and Dr. Jeremy Gernand for their support and serving as my committee
members. I am also thankful to Diane Espy and Shawn Vashaw for providing me
financial support during my final year.
I am extremely grateful to my labmates Rich Schatz, Derek Hall, Soohyun Kim and
Mark LaBarbera for supporting me in various projects and contributing to the
publications presented in this dissertation. I am thankful to Mark Fedkin and Justin Beck
for their constant advice on data analysis and interpretations.
Finally, I truly appreciate my family for their constant love. My parents (Subhash and
Promila), and my sisters (Ekta and Nidhi) have always provided me with their support
and encouragement. I would also like to thank all my friends in Penn State who made my
grad school life more enjoyable.
Page 13
Chapter 1
Introduction
1.1 Research Contributions and Motivation
1.1.1 Research Contribution
This dissertation presents contribution towards in-situ diagnosis of liquid metal anode
solid oxide fuel cells (LMA-SOFCs) and the CuCl/HCl electrolyzer using
Electrochemical Impedance Spectroscopy (EIS). The highlights of this dissertation are as
follows:
1. State-of-Health determination using EIS as an ageing protocol to study
performance degradation in the LMA-SOFC and CuCl/HCl electrolyzer.
2. Investigation of the transport mechanism of oxygen ions through the liquid tin
layer in the LMA-SOFC system.
3. Evaluation of the effect of operating parameters on the performance of CuCl/HCl
electrolyzer and LMA-SOFC
4. Development of equivalent circuit models to quantify the different voltage losses
during the operation of CuCl/HCl electrolyzer and LMA-SOFC.
1.1.2 Research Motivation
Page 14
14
Liquid metal anode solid oxide fuel cells have a huge potential to reduce greenhouse
emissions by efficiently utilizing coal as a source of energy production. Further, it has
added advantages over the conventional Ni-based anode SOFCs as the liquid metal anode
is tolerant to various impurities, has a better usage of the active surface area, and it can
operate as a metal-air battery in case of fuel starvation [1-3].
Liquid Tin Anode Solid Oxide Fuel Cells have gained significant attention recently
and the technology is commercialized by CellTech Power [3-7]. However, the
electrochemical reactions and transport processes within the liquid tin anode are not fully
understood yet [2]. Performance degradation of the LTA-SOFC due to build-up of the
oxide layer is also a big challenge in achieving the desired durability.
Hydrogen has long been considered as an alternative fuel because of its ability to
power fuel cells in zero-emission electric vehicles which are two to three times more
efficient that internal combustion engines [8, 9]. All major automobile companies like
Mercedes, Daimler AG, Honda, Hyundai and Toyota confirmed to have their fuel cell
vehicles for sale by 2015. Currently, 96% of hydrogen is produced from fossil fuels
resulting in CO2 emissions [10]. Thus, there is a need to devise eco-friendly friendly
hydrogen generation techniques to minimize the negative impact on the environment. The
CuCl/HCl thermochemical cycle is one of the most promising technologies for economic
production of hydrogen because of high efficiency and moderate temperature
requirements [10, 11]. However, the technology suffers from the durability issues due to
physical, chemical and electrochemical processes contributing to the degradation of the
system.
Page 15
15
Electrochemical Impedance Spectroscopy (EIS) has the potential to characterize the
performance of the LTA-SOFC and the CuCl/HCl electrolyzer, and more importantly,
diagnose the failure modes by separating the impedance contribution from different
components leading to degradation. EIS analysis, coupled with Linear Sweep
Voltammetry (LSV), provides accurate estimates of the State of Health (SOH), calculates
the electrochemical and transport parameters, and provides insight into the reaction
mechanisms at different electrodes.
1.2 Background
1.2.1 Electrochemical Impedance Spectroscopy
EIS is a powerful characterisation technique for investigating the mechanisms of
electrochemical reactions, diagnosing the failure modes, and to explore the properties of
different electrode materials. It is used to characterize cell limitations and distinguish
between processes occurring on different time-scales. EIS studies the voltage response
when a small amplitude Alternative Current (AC) current is imposed to the system.
The EIS characterization technique has been widely employed towards the
development and characterization of fuel cells [12-22]. The power of this technique lies
in its ability to distinguish, in the frequency domain, the individual contributions of
charge-transfer, mass-transfer and ohmic losses [23-25]. Despite its high potential and
applicability to all fuel cells and electrolyzers, data interpretation is sometimes difficult.
Interpretation of the EIS data requires a model representing the physically meaningful
Page 16
16
parameters relevant to the system, and an assessment of the stochastic error structure. The
most common approach to simulate the experimental data is the development of
equivalent circuits, consisting of an arrangement of different electrical elements and
having the same frequency response than the one obtained by EIS tests. The most
commonly used equivalent circuit elements are:
1. Resistors - The impedance of a resistor is independent of frequency and
has no imaginary component. The current through a resistor stays in phase with the
voltage across the resistor.
2. Capacitors - A capacitor's impedance decreases as the frequency is raised.
Capacitors also have only an imaginary impedance component.
3. Constant Phase Elements (CPE) - It is encountered frequently in solid
state electrochemistry, however no general physical interpretation has not been
established yet. The CPE behaviour of interfaces has been ascribed to a fractal nature
(special geometry of the roughness) of the interface.
4. Warburg Element - Diffusion can create an impedance known as the
Warburg impedance. At high frequencies the Warburg impedance is small since
diffusing reactants don't have to move very far. At low frequencies the reactants have
to diffuse farther, thereby increasing the Warburg impedance. On a Nyquist plot, it
appears as a line with a slope of 0.5.
5. Gerischer Element – This form of impedance is similar to the Warburg
impedance in the high frequency region, but in the low frequency region the
dispersions are distinctly different. This transfer function is derived from Fick’s
Page 17
17
second law by including a reaction term, thus representing the mixed kinetic and
diffusion controlled systems.
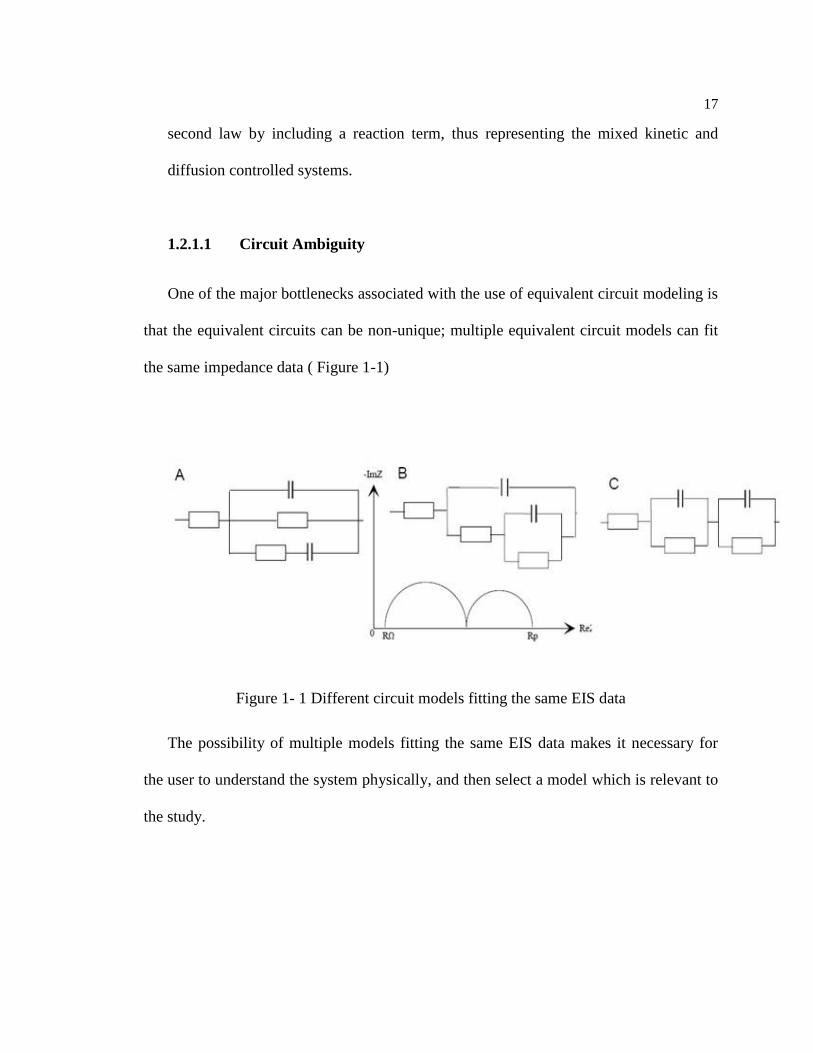
1.2.1.1 Circuit Ambiguity
One of the major bottlenecks associated with the use of equivalent circuit modeling is
that the equivalent circuits can be non-unique; multiple equivalent circuit models can fit
the same impedance data ( Figure 1-1)
Figure 1- 1 Different circuit models fitting the same EIS data
The possibility of multiple models fitting the same EIS data makes it necessary for
the user to understand the system physically, and then select a model which is relevant to
the study.
Page 18
18
1.2.1.2 Fitting Algorithms
The complex nonlinear least squares (CNLS) method [26] is one of the most common
methods to fit the EIS data. The commercial fitting program, ZView, which was used to
simulate the EIS data considered in this study uses the CNLS method. In order to
minimize the CNLS fitting functions, chi-squared (χ2) algorithm [27] was used. The
CNLS method is based on the assumption that the experimental EIS data is contaminated
by only random errors (Gaussian in nature). The presence of errors of any other
characters significantly effects the reliability of the fitting results. The convergence of the
CNLS procedure depends on many factors. The algorithm may stop at a “local
minimum”, characterized by a large χ2 . In such cases, changing the initial value of the
model’s parameter and/or an instantaneous change of its character from free to fixed
could be helpful. The smaller the value of χ2, the better is the (statistical) goodness of the
fit.
1.2.1.3 Initial Data Analysis: Kramers-Kronig Transformations
Before carrying out a detailed analysis of the EIS data and fitting it to an equivalent
circuit model, it is necessary to validate the data internally. The Kramers-Kronig (K-K)
relations are used to evaluate the data quality [28]. The K-K relations state that the real
part of the EIS data can be obtained by an integration of the imaginary part and vice
versa.
The K-K relations will always hold for EIS data that is linear, causal, and stable [29].
If the experimental real and imaginary data do not comply with the K-K relations, the
Page 19
19
data violates one of the necessary conditions for EIS measurements and the experimental
system should be further refined. There is no point in fitting the non K-K compliant data
to a circuit model, and hence, K-K analysis of data should always be carried out before
interpreting any physical meaning from it.
1.2.2 Liquid Metal Anode Solid Oxide Fuel Cells
High temperature Solid Oxide Fuel Cells are very efficient electrochemical energy
conversion devices that convert that convert the chemical energy stored in fuels to
electrical power. Even with the capability to scale up the technology, durability and
performance degradation due to impurities mixed with the fuel are a huge cause of
concern [30-33].
The operation with LMA-SOFC allows a variety of carbonaceous fuels to be used as
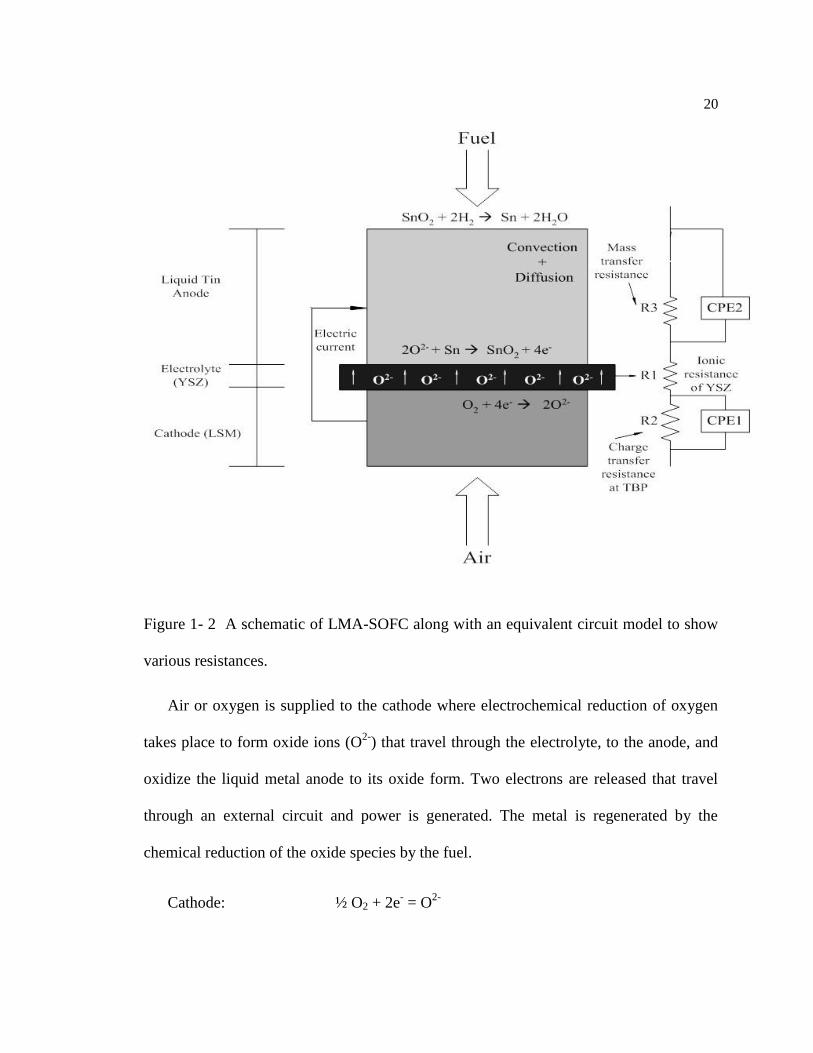
fuels, while remaining tolerant towards impurities in the fuel. A schematic of the LMA-
SOFC, along with an electrical circuit model is shown in Figure 1-2.
Page 20
20
Figure 1- 2 A schematic of LMA-SOFC along with an equivalent circuit model to show
various resistances.
Air or oxygen is supplied to the cathode where electrochemical reduction of oxygen
takes place to form oxide ions (O2-
) that travel through the electrolyte, to the anode, and
oxidize the liquid metal anode to its oxide form. Two electrons are released that travel
through an external circuit and power is generated. The metal is regenerated by the
chemical reduction of the oxide species by the fuel.
Cathode: ½ O2 + 2e- = O
2-
Page 21
21
Anode: Sn + 2O2-
= SnO2 + 4e-
2H2 + SnO2 = Sn + 2H2O
Being a relatively new and novel system, LMA SOFCs are still some way from being
fully commercialized due to unique engineering challenges associated with the system.
However, the processes happening in the liquid anode are not fully understood. There are
certain inconsistencies associated with the transport mechanism in the liquid anode and
little is known about the effective diffusion coefficients of oxygen. The objective of this
dissertation is to better understand the transport mechanism in liquid tin anode and
characterize the effect of different fuels using EIS.
1.2.3 CuCl/HCl Electrolytic Cell
In the CuCl/HCl electrolyzer, hydrogen is produced by the oxidation reaction of
CuCl(aq), upon applying electric potential in the presence of concentrated hydrochloric
acid. A schematic of the electrolyzer is shown in Figure 1-3 [34].
Page 22
22
Figure 1-3 Conceptual schematic of CuCl electrolysis with a proton exchange membrane;
adapted from [34]
At the anode, CuCl(aq) is oxidized to CuCl2(aq) and produces protons which diffuse
through the membrane are reduced to hydrogen at the cathode.
While the CuCl electrolyzer has obvious advantages of high efficiency and capability
to recycle all the materials, performance degradation and durability are still a big cause of
concern for its economic feasibility. There are little or no published data which separate
different voltage in the CuCl electrolyzer and show the desired performance for long
period of times. In this dissertation, the durability of the cell is demonstrated by meeting
the DOE’s target of running the system for 168 hours at 0.3 A cm-2
under 0.7 V. State-of-
Health (SOH) determination of the cell is studied by using EIS at different overpotentials
and key factors leading to the degradation of the system are quantified.
Page 23
23
1.3 Overview of the dissertation
Chapter 2 presents the analysis of the CuCl/HCl electrolyzer using EIS and LSV at
different operating conditions. The experimental data was collected at three different
temperatures and an equivalent circuit model was developed to observe the changes in
the ohmic, charge-transfer and mass transfer resistances at different temperatures. The
high efficiency of the cell at 80 ºC was attributed due to relatively lower ohmic and
charge-transfer resistances. The effect of temperature was more pronounced at 0.4 V of
applied compared to the data decomposition potential (DP). The measurements indicated
a higher charge transfer rate at 80 ºC and at high overpotentials. As the contact pressure
at the end plates has a direct effect on the ohmic resistance, an optimum value of contact
pressure was selected to minimize the ohmic losses without sacrificing on the effective
diffusion length.
Chapter 3 follows with the study on the durability of the CuCl/HCl electrolyzer in
long term operation after optimizing the parameters such as temperature, solutions
concentrations, flow rate and contact pressure at the end plates for maximum efficiency.
In-situ analysis was carried out using EIS to determine state of health of the cell and
characterize degradation over time.
Following the successful implementation of EIS as a diagnostic tool to study the
kinetic and mass-transfer properties in the CuCl/HCl electrolyzer, Chapter 4 deals with
the electrochemical characterization of liquid metal anode solid oxide fuel cells. EIS was
used to study the cell behavior at different temperatures and operating under different
fuels. An equivalent circuit model consisting of Warburg element was developed to
Page 24
24
model the mass transfer resistance and calculate effective oxygen diffusion coefficients.
Further, the transport mechanism in the liquid tin layer was studied and performance
degradation was attributed mainly due to build-up of the tin dioxide layer.
Chapter 5 presents the conclusions and future work.
Page 25
25
Chapter 1 References
1. Abernathy, H., et al., Basic properties of a liquid tin anode solid oxide fuel cell.
Journal of Power Sources, 2011. 196(10): p. 4564-4572.
2. Gemmen, R., et al. Fundamentals of Liquid Tin Anode Solid Oxide Fuel Cell
(LTA-SOFC) Operation. in Ceramic Engineering and Science Proceedings. 2009.
3. Jayakumar, A., J. Vohs, and R. Gorte, Molten-metal electrodes for solid oxide fuel
cells. Industrial & Engineering Chemistry Research, 2010. 49(21): p. 10237-
10241.
4. Tao, T., Novel Fuel Cells for Coal Based Systems. 2011, Celltech Power, Llc.
5. Tao, T., et al., Liquid tin anode solid oxide fuel cell for direct carbonaceous fuel
conversion. ECS Transactions, 2007. 5(1): p. 463-472.
6. Tao, T., et al., Anode polarization in liquid tin anode solid oxide fuel cell. ECS
Transactions, 2007. 7(1): p. 1389-1397.
7. Tao, T.T., et al., Liquid tin anode SOFC for coal conversion and sulfur tolerance.
ECS Transactions, 2012. 41(12): p. 125-135.
8. Chalk, S.G. and J.F. Miller, Key challenges and recent progress in batteries, fuel
cells, and hydrogen storage for clean energy systems. Journal of Power Sources,
2006. 159(1): p. 73-80.
Page 26
26
9. Ellis, M.W., M.R. Von Spakovsky, and D.J. Nelson, Fuel cell systems: efficient,
flexible energy conversion for the 21st century. Proceedings of the IEEE, 2001.
89(12): p. 1808-1818.
10. Balashov, V.N., et al., CuCl electrolysis for hydrogen production in the Cu–Cl
thermochemical cycle. Journal of the Electrochemical Society, 2011. 158(3): p.
B266-B275.
11. Naterer, G., et al., Clean hydrogen production with the Cu–Cl cycle–progress of
international consortium, I: experimental unit operations. International Journal of
Hydrogen Energy, 2011. 36(24): p. 15472-15485.
12. Andreaus, B., A. McEvoy, and G. Scherer, Analysis of performance losses in
polymer electrolyte fuel cells at high current densities by impedance
spectroscopy. Electrochimica acta, 2002. 47(13): p. 2223-2229.
13. Andreaus, B. and G. Scherer, Proton-conducting polymer membranes in fuel
cells—humidification aspects. Solid State Ionics, 2004. 168(3): p. 311-320.
14. Barbucci, A., et al., Characterisation of composite SOFC cathodes using
electrochemical impedance spectroscopy. Analysis of Pt/YSZ and LSM/YSZ
electrodes. Electrochimica Acta, 2002. 47(13): p. 2183-2188.
15. Ciureanu, M., S. Mikhailenko, and S. Kaliaguine, PEM fuel cells as membrane
reactors: kinetic analysis by impedance spectroscopy. Catalysis Today, 2003.
82(1): p. 195-206.
16. Ciureanu, M. and R. Roberge, Electrochemical impedance study of PEM fuel
cells. Experimental diagnostics and modeling of air cathodes. The Journal of
Physical Chemistry B, 2001. 105(17): p. 3531-3539.
Page 27
27
17. De Sena, D., E. Ticianelli, and E. Gonzalez, Modelistic interpretation of the
power response of a polymer electrolyte fuel cell. Electrochimica acta, 1998.
43(24): p. 3755-3760.
18. Jørgensen, M.J., S. Primdahl, and M. Mogensen, Characterisation of composite
SOFC cathodes using electrochemical impedance spectroscopy. Electrochimica
Acta, 1999. 44(24): p. 4195-4201.
19. Macdonald, J.R. and E. Barsoukov, Impedance spectroscopy: theory, experiment,
and applications. History, 2005. 1: p. 8.
20. Schiller, C., et al., Validation and evaluation of electrochemical impedance
spectra of systems with states that change with time. Physical Chemistry
Chemical Physics, 2001. 3(3): p. 374-378.
21. Schiller, C., et al., Relaxation impedance as a model for the deactivation
mechanism of fuel cells due to carbon monoxide poisoning. Physical Chemistry
Chemical Physics, 2001. 3(11): p. 2113-2116.
22. Wagner, N., et al., Electrochemical impedance spectra of solid-oxide fuel cells
and polymer membrane fuel cells. Electrochimica Acta, 1998. 43(24): p. 3785-
3793.
23. Cruz-Manzo, S., P. Rama, and R. Chen, Impedance Study on Oxygen Diffusion
Through Fuel Cell Cathode Catalyst Layer at High Current. Journal of the
Electrochemical Society, 2010. 157(12): p. B1865-B1871.
24. Malevich, D., et al., Investigation of charge-transfer and mass-transport
resistances in PEMFCs with microporous layer using electrochemical impedance
Page 28
28
spectroscopy. Journal of The Electrochemical Society, 2009. 156(2): p. B216-
B224.
25. O’Hayre, R., et al., A sharp peak in the performance of sputtered platinum fuel
cells at ultra-low platinum loading. Journal of Power Sources, 2002. 109(2): p.
483-493.
26. Sadkowski, A., CNLS fits and Kramers–Kronig validation of resonant EIS data.
Journal of Electroanalytical Chemistry, 2004. 573(2): p. 241-253.
27. Kromp, A., Model-based Interpretation of the Performance and Degradation of
Reformate Fueled Solid Oxide Fuel Cells. 2013: KIT Scientific Publishing.
28. Urquidi-Macdonald, M., S. Real, and D.D. Macdonald, Applications of
Kramers—Kronig transforms in the analysis of electrochemical impedance data—
III. Stability and linearity. Electrochimica Acta, 1990. 35(10): p. 1559-1566.
29. Orazem, M.E. and B. Tribollet, Electrochemical impedance spectroscopy. Vol.
48. 2011: John Wiley & Sons.
30. Yokokawa, H., et al., Fundamental mechanisms limiting solid oxide fuel cell
durability. Journal of Power Sources, 2008. 182(2): p. 400-412.
31. Matsuzaki, Y. and I. Yasuda, The poisoning effect of sulfur-containing impurity
gas on a SOFC anode: Part I. Dependence on temperature, time, and impurity
concentration. Solid State Ionics, 2000. 132(3): p. 261-269.
32. Offer, G.J., et al., Thermodynamics and kinetics of the interaction of carbon and
sulfur with solid oxide fuel cell anodes. Journal of the American Ceramic Society,
2009. 92(4): p. 763-780.
Page 29
29
33. Kurokawa, H., et al., Y-doped SrTiO< sub> 3</sub> based sulfur tolerant anode
for solid oxide fuel cells. journal of power Sources, 2007. 164(2): p. 510-518.
34. Kim, S., et al., Advanced CuCl electrolyzer for hydrogen production via the Cu-
Cl thermochemical Cycle. ECS Transactions, 2011. 35(32): p. 257-265.
Page 30
30
Chapter 2
Diagnosis and Modeling of the CuCl Electrolyzer Using Electrochemical Impedance
Spectroscopy
The text for this chapter was originally published for the Electrochemical Society
Transactions as “Diagnosis and Modeling of the CuCl Electrolyzer Using
Electrochemical Impedance Spectroscopy”, Sanchit Khurana, Derek Hall, Rich Schatz,
Serguei N. Lvov, ECS Transactions 53 (9), 41-50.
Preface to Chapter 2
This chapter is a study of the effect of operating parameters on the performance of the
CuCl electrolyzer. Experimental EIS data analysis and equivalent circuit modeling were
used to observe the change in ohmic resistance and investigate the reaction kinetics at
different temperatures. The high performance observed in the V-I data at 80 ºC is
corroborated by the AC impedance analysis which shows the decrease in overall
impedance as the temperature was increased from 40 to 80 ºC. The effect of contact
pressure at the end plates of the MEA was also studied and an optimum value was found.
Page 31
31
Abstract
A CuCl electrolytic cell was operated with a single-layer pressed Nafion 117 membrane
at different temperatures to quantify the effect of temperature on the overall performance.
Polarization curves and EIS data were taken at 40, 60 and 80 ºC to observe the changes in
ohmic, charge-transfer and interfacial resistance. Our research showed a significant
increase in the cell performance as the temperature was increased from 40 to 80 ºC.
While the polarization data were used to observe the overall increase in the current
density in a specific range of applied potential, the corresponding EIS data showed a
decrease in the ohmic and charge transfer resistance. It was also observed that pressure
applied on the end plates during cell assembly has a significant effect on the ohmic
resistance. An optimum pressure of 6.3 psi (bolt torque: 20 Nm) showed the best
performance. This paper demonstrates how changes in the signature of EIS spectra with
temperature reflect the cell performance.
Introduction
Electrochemical Impedance Spectroscopy (EIS) is identified as one of the most
promising in-situ diagnostic method to better understand and characterize the irreversible
changes in the chemical and/or transport properties of an electrochemical system. It is
based on the principle that a small alternating potential is applied to the cell at different
frequencies, and the response in alternating current is measured. While the Cu-Cl
thermochemical cycle is among the most attractive technologies proposed for hydrogen
Page 32
32
production, its commercialization requires an insight on the main causes of degradation
in the performance. EIS is getting more popular because of its potential for in-situ and
quantitative analysis method for electrochemical systems (1-5). Other studies have been
reported to analyze the fuel cell components individually by EIS (6-9). The application of
EIS has been extended to stack-diagnosis for PEM fuel cells (10-12) starting from single-
cell diagnosis. The concept of symmetric cell has also been used to separate the anode
and cathode impedance by measuring anode and full cell impedance data (1, 12-14).
The Cu-Cl thermochemical cycle, a novel H2 producing technology, has been studied
because of the moderate temperature requirements and high efficiency (15-21).
Significant improvement in voltage and current efficiencies of the CuCl electrolyzer, a
key component of the cycle, have been obtained recently (22, 23). In spite of all the
proven merits and its strong capabilities to diagnose an electrochemical system, EIS has
not been reported to analyze the performance of the Cu-Cl electrolyzer operating under
different conditions. There is little or no published literature to describe the effects of
assembly torque on the performance of the CuCl electrolyzer. In this study, we convolute
the EIS spectra of the cell using equivalent circuit modeling approach and report the
optimum value of the clamping torque as 20 Nm corresponding to the lowest ohmic
resistance.
Page 33
33
Experimental
Preparation of MEA
Nafion 117 polymer membrane was used to fabricate the MEA. The membrane was
pretreated by the following steps to remove the organic and inorganic contaminants
before being used in the electrolyzer. First, the membrane was soaked in 3 wt % H2O2
solution at 80 °C, followed by soaking in 80 °C DI-water to remove traces of H2O2. Then,
the membrane was soaked in 1 mol L-1
H2SO4 (aq). Finally, the membrane was soaked in
in DI-water at 80 °C to remove any residual H2SO4 (aq). The membrane was placed in
each solution for 1 h. The membrane was dried overnight in a desiccator and hot-pressed
at 93.33 °C before being allowed to cool at the room temperature. Two 5 cm2 carbon-
cloth electrodes, painted with 4 mg cm-2
of XC-72 R catalyst with 20 % Pt (0.8 mg cm-2
Pt), were placed on each side of the membrane before installing in the electrolyzer.
Operation and stability of a single cell
The CuCl electrolysis can be represented by the following reaction:
2 CuCl (aq) + 2 HCl (aq) → 2 CuCl2 (aq) + H2 (g)
The general concept of the CuCl electrolysis using a proton-conducting membrane is
shown in Figure 2-1. However, it should be noted that the anodic reaction only represents
Page 34
34
a possible mechanism and does not reflect the anolyte chemistry, which could involve
various intermediate species (15).
Figure 2- 1Conceptual schematic of CuCl electrolysis with a proton exchange membrane;
adapted from (15)
Two 5-cm2 graphite blocks having serpentine flow channels were obtained from
Electrochem Inc. and used as the end plates. 2 mol CuCl (s) dissolved in 7 mol L
-1 HCl
(aq), and 7 mol L-1
HCl (aq), were fed into the anode and the cathode electrodes
respectively. A schematic diagram of the experimental set-up is shown in Figure 2-2. The
cell was maintained at 80 °C during the experiment and the solutions were pumped at a
flow rate of 130 ml min-1
. Variable values of clamping torques –10, 15 and 20 Nm --
were applied on the end plate bolts which correspond to 3.2, 4.7 and 6.3 psi pressure
values respectively. The objective was to ensure good electrical contact between the
loose components of the MEA.
Page 35
35
Figure 2- 2 Schematic of the CuCl electrolyzer system describing the processes in the
CuCl electrolysis system. T-1: catholyte recirculation tank; T-2: anolyte recirculation
tank; T-3: H2 gas collection tank; T-4: displacement tank; T-5: vapor diffuser tank
Electrochemical Impedance Spectroscopy
For EIS measurements, 10 mV of voltage perturbation was applied by sweeping the
frequency from 0.01 Hz-50 kHz with 10 points per decade interval. The data were
obtained at 0 V vs cathode, and under an applied potential of 0.4 V. A delay of 2 minutes
was applied between each measurement in order to allow the cell reaching the steady-
state. Consistency and quality of data were established by Kramers-Kronig validation.
Oil Bath
PI
T-3
P-1
P-2
T-2 T-5T-4
V-4
V-2
Vac
V-6
T-6T-7
V-8
V-5
V-9
V-7
Ve
nt
Ve
nt
Ar Line
TC-1
TC-2
Scale
V-10 T-1
T-1 – CuCl/HCl recirc tank
T-2 – HCl recirc tank
T-3 – Vapor diffusor
T-4 – H2 gas collection tank
T-5 – D.I. Water displacement tank
T-6 – Vacuum catch tank
T-7 – D.I. water Supply (vac line)
C-1 – CuCl Regeneration Column
C-2 – CaSO4 Desiccation Column
C-1
V-12
PI
C-2
EC
CELL TC-3
TC
-4
V-1
TC
-5
V-3
V-14
Sample
Port
V-11
Page 36
36
Linear Sweep Voltammetry (LSV)
The LSV data were taken with a scan rate of 10 mV s-1
to obtain the current density
values for the 0-0.7 V potential range and hydrogen measurements were carried at 0.7 V.
The LSV polarization curves were obtained before and after EIS measurements to ensure
that the cell characteristics were not changed.
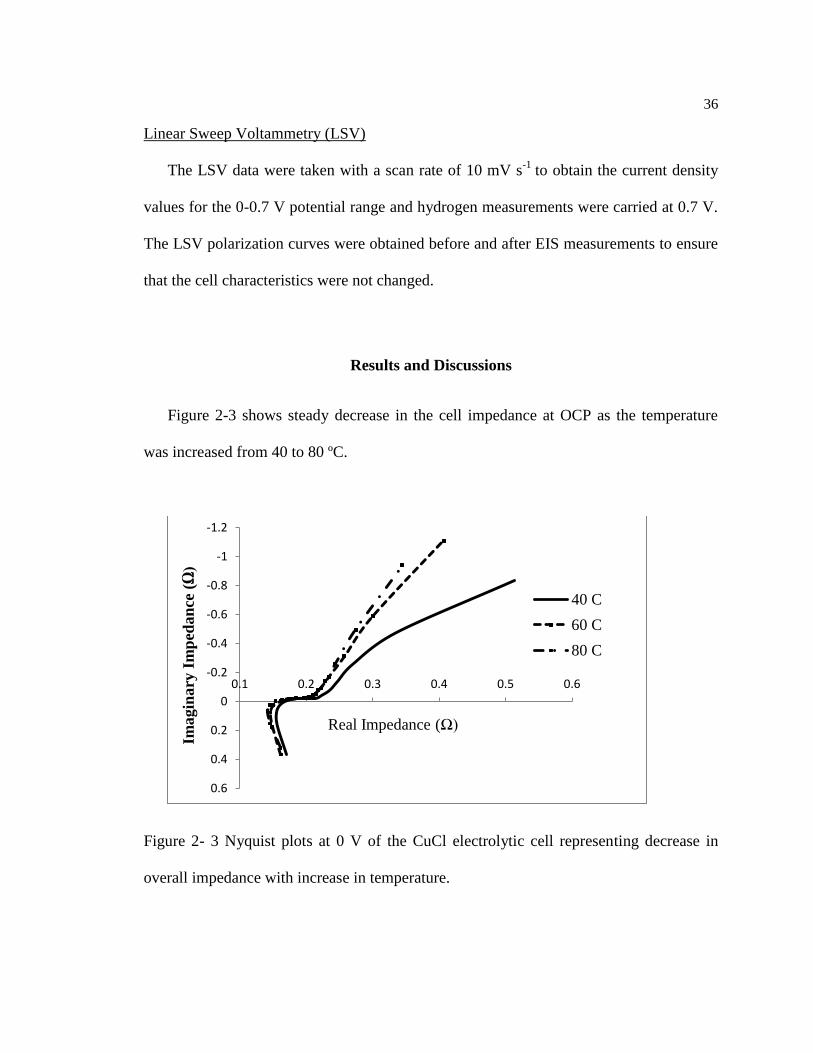
Results and Discussions
Figure 2-3 shows steady decrease in the cell impedance at OCP as the temperature
was increased from 40 to 80 ºC.
Figure 2- 3 Nyquist plots at 0 V of the CuCl electrolytic cell representing decrease in
overall impedance with increase in temperature.
-1.2
-1
-0.8
-0.6
-0.4
-0.2
0
0.2
0.4
0.6
0.1 0.2 0.3 0.4 0.5 0.6
Imag
inary
Im
ped
an
ce (
Ω)
Real Impedance (Ω)
40 C
60 C
80 C
Page 37
37
Figure 2-4 represents the corresponding LSV curves where an increase in the current
density is observed.
Figure 2- 4 Polarization curves showing the increase in the current density as the
temperature was raised from 40 to 80 ºC
An equivalent circuit model (as shown in Figure 2-5) was used to simulate the
experimental data and quantify the physical parameters to observe the change in system
performance with temperature.
0
0.1
0.2
0.3
0.4
0.5
0.6
0 0.2 0.4 0.6 0.8 1
Cu
rren
t D
ensi
ty (A
cm
-2)
Potential (V)
40°C
60°C
80°C
Page 38
38
Figure 2- 5. Equivalent circuit model used to simulate the experimental data: Rohm
represents the ohmic resistance of the cell, Rct; charge transfer resistance, and Rm;
interfacial resistance
The model consists of Rohm; which is the high frequency intercept of the kinetic loop
with the real axis, and represents the ohmic resistance of the cell, Rct; charge transfer
resistance, which is calculated by the difference between the maximum value of the high
frequency resistance (RmaxHF ) and the ohmic resistance (RmaxHF – Rohm), and Rm;
interfacial resistance. The constant phase elements (CPEs) were incorporated in place of
capacitors to account for the inhomogeneity in the system. The CPE is defined by two
values; CPE-T and CPE-P. Mathematically, it is expressed as: Z= 1/(T(wp)0.5
), where w
is the angular frequency of the AC signal, T (CPE-T) is capacitance and P (CPE-P) is
non-homogeneity constant. The circuit model precisely fits the experimental data, as
shown in Figure 2-6, and the fit converged satisfactorily (chi-squared < 5 10-4
).
Page 39
39
Figure 2- 6. Experimental data and the simulation results
Further, the model was validated by Kramers-Kronig transformation for internal
consistency. As shown in Table 2-1, the ohmic resistance of the membrane decreases
from 0.15 Ω to 0.137 Ω as the temperature was increased from 40 to 80 ºC.
TABLE 2-1. Ohmic Resistance for the EIS Data taken at 0 V
Temperature Ohmic Resistance (Ω)
40 ºC 0.150
60 ºC 0.140
80 ºC 0.137
The effect of temperature on the system was more pronounced when the cell was
operating under an applied potential as this state involves contribution from all physical
processes. A similar but separate test was performed when the cell was operating under
-1
-0.8
-0.6
-0.4
-0.2
0
0.2
0.1 0.3 0.5
Imagin
ary
Im
ped
an
ce (
Ω)
Real Impedance (Ω)
Experimental data
Fit result
Page 40
40
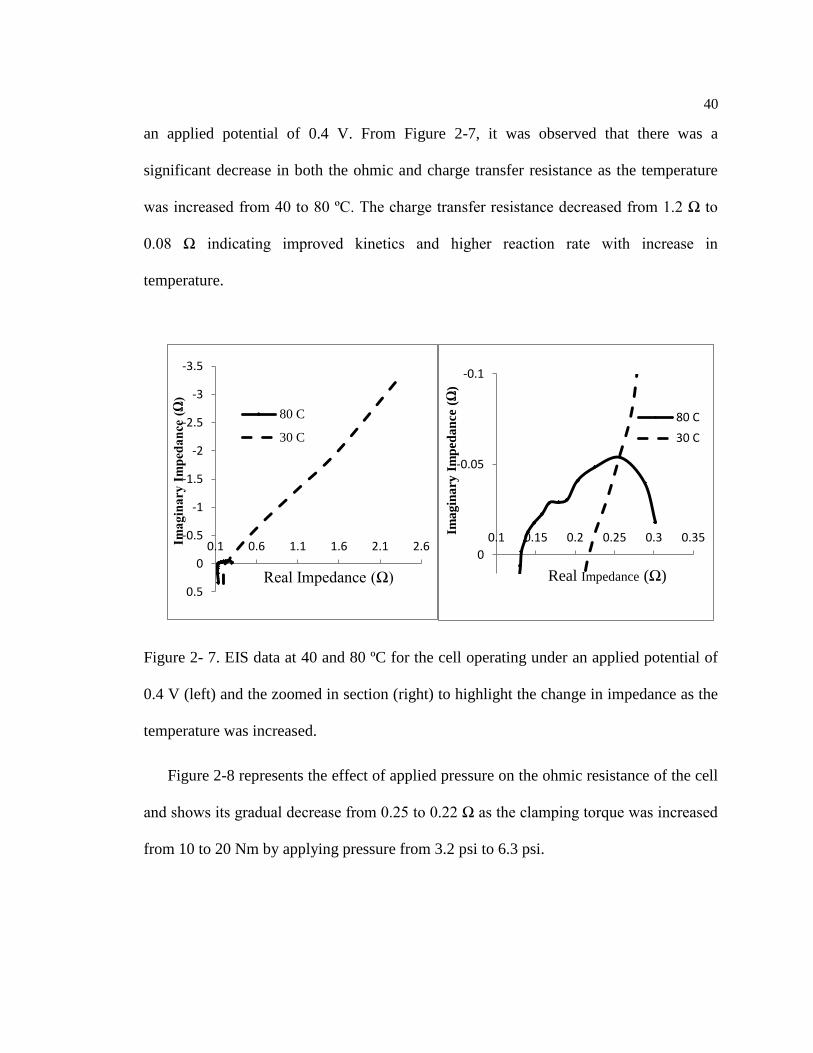
an applied potential of 0.4 V. From Figure 2-7, it was observed that there was a
significant decrease in both the ohmic and charge transfer resistance as the temperature
was increased from 40 to 80 ºC. The charge transfer resistance decreased from 1.2 Ω to
0.08 Ω indicating improved kinetics and higher reaction rate with increase in
temperature.
Figure 2- 7. EIS data at 40 and 80 ºC for the cell operating under an applied potential of
0.4 V (left) and the zoomed in section (right) to highlight the change in impedance as the
temperature was increased.
Figure 2-8 represents the effect of applied pressure on the ohmic resistance of the cell
and shows its gradual decrease from 0.25 to 0.22 Ω as the clamping torque was increased
from 10 to 20 Nm by applying pressure from 3.2 psi to 6.3 psi.
-3.5
-3
-2.5
-2
-1.5
-1
-0.5
0
0.5
0.1 0.6 1.1 1.6 2.1 2.6Ima
gin
ary
Im
ped
an
ce (
Ω)
Real Impedance (Ω)
80 C
30 C
-0.1
-0.05
0
0.1 0.15 0.2 0.25 0.3 0.35Ima
gin
ary
Im
ped
an
ce (
Ω)
Real Impedance (Ω)
80 C
30 C
Page 41
41
Figure 2- 8. The figure shows the decrease in ohmic resistance as the clamping torque
was increased from 10 to 20 Nm by altering the applied pressure from 3.2 psi to 6.3 psi.
The corresponding polarization curves reflecting an increase in the current density are
shown in Figure 2-9.
-2.5
-2
-1.5
-1
-0.5
0
0.5
0 0.5 1 1.5 2 2.5
Imagin
ary
Im
ped
an
ce (
Ω)
Real Impedance (Ω)
3.2 psi
4.7 psi
6.3 psi
Page 42
42
Figure 2- 9. Polarization curves representing increase in the overall performance as the
clamping torque was increased by altering the applied pressure
However, it should also be noted that excessive pressure may result in reduced length
of path for effective mass transfer and result in the decrease in efficiency. Thus, 6.3 PSI
(20 Nm) represents the optimum value of applied pressure as the ohmic resistance did not
decrease after further increasing the pressure.
0
0.05
0.1
0.15
0.2
0.25
0.3
0.35
0.4
0 0.2 0.4 0.6 0.8
Curr
ent
Den
isit
y
(A c
m-2
)
Applied Potential (V)
3.2 psi
4.7 psi
6.3 psi
Page 43
43
Conclusions
The Cu-Cl electrolyzer was operated at different temperatures and EIS was
successfully applied to monitor the system behavior with changes in temperature. An
equivalent circuit model was used to fit the experimental EIS data and it was concluded
that the ohmic resistance of the membrane decreased with the increase in temperature. A
significant decrease in the charge transfer resistance was also observed and this was
attributed to the improved kinetics at high temperatures. Experimental results
demonstrated that the contact resistance between interfaces was heavily dependent on
clamping torque and an optimum applied pressure of 6.3 psi (bolt torque: 20 Nm) was
selected based on the ohmic resistance measurements.
Acknowledgements
The authors gratefully acknowledge the financial support of this work by U.S.
Department of Energy’s Office of Energy Efficiency and Renewable Energy via a
subcontract with Argonne National Laboratory. We thank Drs. Mark Fedkin, Michele
Lewis and Shabbir Ahmed for their useful feedbacks on the obtained data.
Page 44
44
Chapter 2 References
1. Aravind, Ouweltjes, Schoonman, J. Electrochem. Soc., 156 (12), 1417 (2009).
2. T. Müller, P.M. Urban, J. Power Sources, 75, 139 (1998).
3. J.-P. Jiard, N. Glandut, P. Landaud, B. Le Gorrec, C. Montella, Electrochim. Acta, 48,
555 (2003).
4. D. Larrain, J. Van herle, and D. Favrat, J. Power Sources, 161, 392 (2006)
5. J. I. Gazzarri and O. Kesler, J. Power Sources, 167, 100 (2007).
6. Piela, R. Fields, P. Zelenay, J. Electrochem. Soc., 153, A1902 (2006).
7. K. Furukawa, K. Okajima, M. Sudoh, J. Power Sources, 139, 9 (2005).
8. J.-H. Kim, H.-I. Lee, S.-A. Hong, H.Y. Ha , J. Electrochem. Soc., 152, A2345 (2005).
9. H. Fukunaga, T. Ishida, N. Teranishi, C. Arai, K. Yamada, Electrochim. Acta, 49,
2123 (2004).
10. X.Z. Yuan, J.C. Sun, H.J. Wang, J.J. Zhang, J. Power Sources, 161, 929 (2006).
11. X.Q. Yan, M. Hou, L.Y. Sun, D. Liang, Q. Shen, H.F. Xu, P.W. Ming, B.L. Yi,
Int. J. Hydrogen Energy, 32, 4358 (2007).
12. W.H. Zhu, R.U. Payne, B.J. Tatarchuk, J. Power Sources, 168, 211 (2007).
13. S.J. Andreasen, J.L. Jespersen, E. Schaltz, S.K. Kær, Fuel Cells 9 (2009).
14. Chen, J. Liu, K. Amine, J. Power Sources, 96, 321 (2001).
15. V Balashov, R Schatz, E Chalkova, N Akinfiev, M V. Fedkin, S N. Lvov, J.
Electrochem. Soc., 158 (3), B266 (2011).
Page 45
45
16. S.Kim, R. Schatz, S. Khurana, M. Fedkin, C. Wang, S.N. Lvov, ECS Trans 35
(32), 257 (2011).
17 G.F. Naterer, V.N. Daggupati, G. Marin, K.S. Gabriel, and Z.L. Wang, Int. J.
Hydrogen Energ., 33, 5451 (2008).
18 G.F. Naterer, K. Gabriel, Z.L. Wang, V.N. Daggupati, and R. Gravelsins, Int. J.
Hydrogen Energ., 33, 5439 (2008).
19 G. Naterer, S. Suppiah, M. Lewis, K. Gabriel, I. Dincer, M.A. Rosen, M. Fowler,
G.Rizvi, E.B. Easton, B.M. Ikeda, M.H. Kaye, L. Lu, I. Pioro, P. Spekkens, P.
Tremaine, J. Mostaghimi, J. Avsec, and J. Jiang, Int. J. Hydrogen Energ., 34, 2901
(2009).
20. G.F. Naterer, S. Suppiah, L. Stolberg, M. Lewis, Z. Wang, V. Daggupati, K. Gabriel,
I. Dincer, M.A. Rosen, P. Spekkens, S.N. Lvov, M. Fowler, P. Tremaine, J.
Mostaghimi, E.B. Easton, L. Trevani, G. Rizvi, B.M. Ikeda, M.H. Kaye, L. Lu, I.
Pioro, W.R. Smith, E. Secnik, J. Jiang, J. Avsec, Int. J. Hydrogen Energ., 35, 10905
(2010)
21. M. Lewis and S.N. Lvov, Electrolyzer Development for the Cu-Cl
http://www.hydrogen.energy.gov/pdfs/review12/pd013_lewis_2012_o.pdf (2012)
22. S. Lvov, R. Schatz, S. Kim, S. Khurana, A. Morse, M. Chung, and Mark
Fedkin, Abstract #1816, ECS Meeting, Honolulu PRiME 2012.
23. R. Schatz, S. Kim, S. Khurana, M. Fedkin, and S. Lvov, ECS Transactions, 49, 153-
164 (2013).
Page 46
46
Chapter 3
State of Health of the CuCl electrolyzer during a 168 h test
This text for this chapter was originally prepared for the International Journal of
Hydrogen Energy as “State of Health of the CuCl electrolyzer during a 168 h test”,
Sanchit Khurana, Derek Hall, Rich Schatz, Mark Fedkin, Serguei N. Lvov. The paper
was submitted June 2014.
Preface to Chapter 3
Chapter 3 demonstrates the ability of the electrolyzer to operate for 168 hours at the
current density of 0.3 A cm-2
under 0.7 V. In-situ EIS measurements help to track the
evolution of ohmic resistance and characterize the degradation mechanisms. The effect of
applied voltage on the EIS signature is presented which is followed by the theoretical
calculation of the OCP of the system.
Page 47
47
Abstract
A state-of-health test of the CuCl/HCl electrolytic cell was carried out by maintaining a
constant current density of 0.3 A cm-2
for 168 h at 80 °C and ambient pressure. While the
most common method used to characterize the electrochemical performance of a CuCl
electrolytic cell is to record current-voltage (I-V curves), it is also essential to separate the
electrochemical and ohmic components of the polarization curve. In our study, the AC
impedance characteristics of a single cell were studied along with the DC polarization
curves. After the durability test, the potential required to maintain the cell at 0.3 A cm-2
increased from 630 mV of the fresh membrane electrode assembly (MEA) to 710 mV due
to some degradation processes in the electrolytic cell. Quantitative analysis of the
performance decay was carried out by Electrochemical Impedance Spectroscopy (EIS).
EIS measurements showed an increase in the area specific ohmic resistance of the MEA
from 0.6 Ω cm2
to 0.85
Ω cm
2 and area specific charge-transfer resistance from 0.61 Ω
cm2 to 0.8 Ω cm
2 measured at an overpotential of 0.2 V. The degradation in the cell is
attributed to the decrease in membrane conductivity and an increase in the charge-transfer
resistance.
Keywords:
Hydrogen Production; Performance Degradation; Electrochemical Impedance
Spectroscopy; CuCl/HCl thermochemical cycle
Page 48
48
Introduction
There is growing interest in studying the Cu-Cl thermochemical cycle for generating
hydrogen as the technology has about four times lower decomposition potential of the
CuCl/HCl electrolytic cell as compared to water electrolysis [1] as well as significantly
lower temperature requirements compared to other thermochemical cycles along with a
better overall efficiency [2,3]. While the Cu-Cl thermochemical cycle is among the most
attractive technologies proposed for hydrogen production, it is essential to study the
performance degradation in order to meet the DOE’s target of producing hydrogen at the
cost of $6/kg by 2015 and further reducing it to $4/kg by 2025 [4].
Electrochemical Impedance Spectroscopy (EIS) is a powerful diagnostic method that
helps to better understand the degradation mechanisms in electrochemical systems as the
technique can provide information on individual cell potential losses. EIS has a great
prospective to quantitatively analyze electrochemical systems [5,6,7] and extract the
electrochemical cell components [8,9]. Recently, few authors have applied EIS to study
the characteristics of the CuCl/HCl electrolytic cell [1, 10, 11] but there is no published
data to characterize and separate the components leading to degradation in the CuCl/HCl
electrolytic cell. In this study, we quantify the contribution of different physical processes
to the main losses in the electrolyzer and investigate the main cause of degradation over
time. An in situ EIS approach has been used to monitor the evolution of both the ohmic
and charge-transfer resistances with time at different applied potentials.
Page 49
49
Experimental
Cell preparation
In the investigated membrane electrode assembly (MEA), Nafion 117 ionomer
membrane was used. The pretreatment method was the same as discussed previously
[12]. Two 5 cm2 carbon-cloth electrodes, painted with 4 mg cm
-2 of XC-72 R catalyst
(0.8 mg cm-2
Pt), were applied to each side of the membrane without hot pressing. Two
85 cm2 graphite blocks having serpentine flow channels were obtained from Electrochem
Inc. and used as the end plates. A solution of 2 mol of CuCl(s) in 7 mol L-1
HCl(aq) was
the anolyte and 7 mol L-1
HCl(aq) was the catholyte. The experimental system which was
used was similar to our previous studies [12].
The cell was maintained at 80 °C during the experiment and the solutions were
pumped at a flow rate of 130 ml min-1
. For stable operation, a constant current density of
0.3 A cm-2
was maintained for 168 h. The test was semi-continuous, as the solutions were
replaced every night to avoid any possible precipitation of CuCl(s) resulting from the
increase in concentration of CuCl(aq), and the experiment was paused every night for 6-8
hours. However, it should be noted that the cell was maintained at a temperature of 80 °C
for the whole test period and the effective duration for which the membrane was soaked
in the HCl(aq) at 80 °C was over 400 h.
Electrochemical characterization
Electrochemical characterization of the cell was performed by EIS in the frequency
range from 10 mHz to 50 kHz with 15 points per decade interval. EIS was used to keep a
Page 50
50
periodic track of degradation with time and observe the effect of applied potential. The
data were obtained at the decomposition potential (DP) and at overpotentials of 0.2, 0.4
and 0.5 V. Before starting each EIS measurement, the cell was pre-polarized for at least 3
minutes at the measured potential to reach a steady state. The current densities before and
after measurement were recorded to prove stability of the cell during the test time. For
continuous monitoring of the ohmic resistance with time, measurements were taken
periodically after every 4 h. Consistency and quality of data were established by
Kramers-Kronig validation [13]. The Kramers-Kronig transformation constrains the real
and imaginary components of the impedance for systems that satisfy the conditions of
causality, linearity and stability. Polarization curves, using liner sweep voltammetry
(LSV) were obtained after every 4 h to observe the cell behavior over a potential range
from 0 to 0.7 V and observe the maximum current density at 0.7 V.
Membrane conductivity
The conductivity of the pretreated, Nafion 117 membrane was obtained using a
through-plane glass clip conductivity cell [12] with the active area of 0.74 cm2.
The cell consists of parallel disk electrodes and measurements were performed in a 7
mol L-1
HCl(aq) solution. The membrane was equilibrated with a [2 mol L-1
CuCl(aq) + 7
mol L-1
HCl(aq)] for 20 h and the cell conductance was measured at atmospheric pressure
and ambient temperature of 25 °C. EIS was used to calculate the conductivity using
Gamry electrochemical system and data were taken in a frequency range of 30 - 500 kHz.
The resistance of the pre-pressed Nafion 117 membrane was obtained as the difference
between the high frequency intercept obtained with and without the membrane.
Page 51
51
Results and Discussions
AC impedance analysis and polarization curves
LSV measurements were carried out periodically and Figure 3-1. shows the steady
decrease in the current density of the cell over time from 0.46 A cm-2
at the beginning, to
0.31 A cm-2
at the end of the test at the applied potential of 0.7 V.
Figure 3- 1. Decrease in the current density during the 168 h test.
Since the electrolyzer was operated in daily cycles and the anolyte solution was
diluted every night, it is important to observe the daily trend in the system performance to
reflect the DP changes as well as in the consumption of Cu (I). Figure 3-2 represents the
gradual decrease in the total impedance of the cell (left) at DP over 16 hours of operation
on the first day, and a corresponding increase in the current density was observed (right).
0.25
0.30
0.35
0.40
0.45
0.50
0 50 100 150 200
Time (h)
Cu
rren
t D
ensi
ty (
A c
m-
Page 52
52
Figure 3- 2. Gradual change in the EIS spectra at DP during a 16 h daily cycle (left) and
I-V curve showing the corresponding increase in the current density with time (right) as
the cell impedance decreased.
However, as shown in Figure 3-3, in the end of testing there was no significant
decrease in the total impedance, and correspondingly, the current density did not improve
over time. This is attributed to the fact that the DP decreased during every 16 h of daily
cycles in the first 6 days of testing and reached a stable value in the concluding phases
(Figure 3-4). The lower value of the DP and the dynamic behavior of the system in the
initial phases is believed due to a freshly packed regeneration column and freshly
prepared anolyte solution resulting in more efficient conversion of Cu2+
aqueous species
to Cu+ aqueous species.
Page 53
53
Figure 3- 3. EIS spectra obtained at DP in the concluding phase of the test representing
the degraded nature of the CuCl/HCl electrolyzer (left) and I-V curve representing the
stable current density (right).
Figure 3- 4. Variation of experimentally obtained DP as a function of operational time.
0.15
0.18
0.21
0.24
0 4 8 12 16
-ED (
V)
Duration (h)
Day 1
Day 6
Day 11
Page 54
54
The obtained impedance spectra were described by an equivalent circuit model of the
elementary impedance elements. The circuit represents various impedance elements as
physical representation of the membrane, charge-transfer and mass-transfer resistances.
Figure 3-5 represents the equivalent circuit model along with the simulation results for
the experimental EIS data obtained at 0.2 V overpotential.
The model consists of Rohm, which is the high frequency intercept of the impedance
semi-cycle with the real axis and represents the ohmic resistance of the cell, Rct, which is
the charge transfer resistance calculated by the difference between the maximum value of
the high frequency resistance (RmaxHF ) and the ohmic resistance (RmaxHF – Rohm), and Rm,
which is the mass transfer resistance observed in the low-frequency region. The constant
phase elements (CPEs) were incorporated in place of capacitors to account for the
inhomogeneity in the system. The CPE is defined by two values, CPE-T and CPE-P.
Mathematically, it is expressed as Z= 1/(T√wP), where w is the angular frequency of the
AC signal. In the above abbreviations, CPE-T and CPE-P, T is capacitance and P is non-
homogeneity constant. The circuit model precisely fits the experimental data and the fit
converged satisfactorily. The chi-squared parameter [14], which quantifies the goodness
of fit, was < 8 10-4
.
Page 55
55
Figure 3- 5. Equivalent circuit model with the simulation of the experimental data
obtained at the overpotential of 0.2 V.
Figure 3-6 compares the EIS data taken at the overpotential of 0.2 V after 15, 90 and
156 h of operation and as shown in Table 3-1, the area specific ohmic resistance of the
membrane increased from 0.60 to 0.85 Ω cm2 over a period of 168 hours, while the
increase in the area specific charge-transfer area specific resistance was more pronounced
as it increased from 0.51 Ω cm2 to 0.80 Ω cm
2. The change in the mass-transfer area
specific resistance was not so significant as it only increased from 0.15 Ω cm2 to 0.18 Ω
cm2.
Page 56
56
Figure 3- 6. EIS spectra at 0.2 V overpotential representing the degradation of the
CuCl/HCl electrolyzer with time.
Table 3-1. Parameters of equivalent circuit model shown in Figure 5 used in simulating
the CuCl/HCl electrolyzer individual reaction process related to the ohmic, charge-
transfer and mass-transfer resistances.
Equivalent circuit element Fresh cell Degraded cell
(after 168 h of testing)
Area specific ohmic
resistance (Ω cm2)
0.60 0.85
Area specific charge-transfer
resistance (Ω cm2)
0.51 0.70
Area specific mass-transfer
resistance (Ω cm2)
0.15 0.18
One can see from the EIS results that the contribution of each component on the
performance degradation was as follows: ohmic resistance (41 %, 0.25 Ω cm2) > charge-
transfer resistance (37 %, 0. 19 Ω cm2) > mass-transfer resistance (20 %, 0.03 Ω cm
2).
-0.1
0
0.1 0.2 0.3 0.4
Imagin
ary
Im
ped
an
ce (
Ω)
Real Impedance (Ω)
t=15 h
t = 90 h
t = 156 h
Page 57
57
While the increase in the charge-transfer resistance is primarily related to the available
active surface area and an improvement in this regard has already been discussed
elsewhere [11], the possible reasons of the increase in ohmic resistance are decrease of
conductivity by chemical degradation and delamination between catalyst layer and
membrane. The mass transfer resistance is not a dominant parameter in degradation due
to the high flow rate and high concentrations of solutions.
Figure 3-7 represents the evolution of the ohmic resistance with time and the test can
be divided into three phases: (1) 0-90 h - where the ohmic resistance is relatively constant
and no significant degradation was observed, (2) 90-130 h – representing the progressive
membrane degradation where the ohmic resistance increased by 25 % in 40 h, and (3)
130-168 h – slow degradation, where the ohmic resistance showed a moderate decline
and the current density reached a stable value of 0.31 A cm-2
at the applied potential of
0.7 V.
Page 58
58
Figure 3- 7. Evolution of ohmic resistance over 168 h of operation.
While the continuous monitoring of the system over time helps to identify any
possible degradation, it is also essential to observe the cell behavior at different applied
potentials to find out the contribution of different parameters while the cell is operating
on-line. Figure 3-8 represents the EIS data at DP and at overpotentials of 0.2 and 0.4 V
after 90 h of testing.
0.10
0.11
0.12
0.13
0.14
0.15
0.16
0.17
0.18
0.19
0.20
0 50 100 150 200
Oh
mic
res
ista
nce
(Ω
)
Time (h)
Page 59
59
Figure 3- 8. Experimentally obtained EIS data at DP and overpotentials of 0.2 and 0.4 V.
As expected, the charge transfer resistance decreases from 0.6 to 0.35 Ω cm2
upon
increasing the overpotential from 0.2 to 0.4 V, while the mass-transfer resistance remains
same at 0.17 Ω cm2. This characteristic decrease in the charge-transfer resistance with
increasing applied potentials is attributed to the higher reaction rate at high
overpotentials. As shown in Figure Table 3-2, the mass-transfer resistance has a relatively
higher contribution towards total impedance at 0.4 V overpotential whereas the cell was
charge-transfer controlled at low overpotentials.
Table 3-2. Percentage contribution of each resistance at overpotentials of 0.2 and 0.4 V.
Equivalent circuit element Overpotential = 0.2 V Overpotential = 0.4 V
Ohmic resistance
contribution(%)
47 47
Charge-transfer resistance
contribution (%)
41 30
Mass-transfer resistance
contribution (%)
12 23
-0.1
0
0.1 0.2 0.3
Imagin
ary
Im
ped
an
ce (
Ω)
Real Impedance (Ω)
DecompositionPotential
Overpotential= 0.2 V
Overpotential=0.4 V
Page 60
60
Membrane Conductivity
The membrane conductivity, if properly measured, should be directly related to the ohmic
resistance (Rohm), and it is given by equation:
k = δ /(Rohm×A) (1)
where the membrane thickness, δ, in our studies was 0.0195 cm for the tested Nafion 117
membrane, and the exposed surface area (A) of the membrane was 5 cm2 in the
electrolyzer. The ohmic resistance of the membrane was also determined separately by
the single through-plane conductivity cell (Rcon) and was found to be 0.89 Ω. The active
area in the single conductivity cell was 0.74 cm2. Putting these values in (1), the
conductivity of the membrane is calculated as 0.029 S cm-1
. The ohmic resistance
calculated from the equivalent circuit model used to simulate the electrolyzer is 0.12 Ω.
Thus, the membrane conductivity in the electrolyzer using equation (1) comes out to be
0.032 S cm-1
. Therefore, we conclude that the ohmic resistance of the cell is the
resistance of the membrane and an increase in the ohmic resistance represents
degradation of the membrane. The small difference in the conductivities obtained using
two independent methods could be due to the contact resistance between the flow field
and the carbon cloth or other reasons.
Page 61
61
Electrolysis efficiency
The current efficiency, ηc in %, of the CuCl electrolyzer can be estimated from the
comparison between the experimentally produced amount of hydrogen, m[H2(exp)], per
unit of time and the theoretical rate of hydrogen gas generation at a particular current
density, m[H2(theor)], as calculated from Faraday’s law:
ηc = 100 × m[H2(exp)]/m[H2(theor)]
The average current efficiency calculated for all experimental points obtained from the
CuCl/HCl electrolyzer was always above 95 % (Figure 3-9), which indicates that the
hydrogen production reaction 2 H+(aq) + 2 e
− → H2(gas) was the only process taking
place at the electrolyzer cathode and, therefore, no parasitic reactions were apparent at
the cathode.
Page 62
62
Figure 3- 9. H2(g) production in CuCl/HCl electrolyzer using [2 mol/L CuCl(aq) + 7
mol•L-1 HCl(aq)] anolyte and 7 mol•L-1 HCl (aq) catholyte at 80 ºC
The voltage efficiency, ηv,, was estimated in this study as the percent ratio of the
experimentally obtained decomposition potential, -ED (exp) which was 0.18 V, to the
applied voltage, Eapp. The variation of voltage efficiency with increasing current density
is shown in Figure 3-10.
Page 63
63
Figure 3- 10. Voltage efficiency of the CuCl/HCl electrolytic cell. The dotted line
represents the extrapolation to the theoretical efficiency at DP.
The voltage efficiency decreases from 47.5 % at 0.1 A cm-2
to 32 % at 0.3 A cm-2
due
to the increased overall losses in the system at higher current densities. Consequently,
more efficient electrolysis is needed to overcome the voltage losses and increase the
voltage efficiency.
Experimental and Theoretical Decomposition Potential for the CuCl Electrolyzer
One of the significant sources of degradation in the cell performance during the
durability test was from rising the decomposition potential magnitude as the test
proceeded. One possible explanation for this increase is an increase in the permeation of
copper and copper chloride aqueous species through the membrane throughout the
0
20
40
60
80
100
0 0.05 0.1 0.15 0.2 0.25 0.3 0.35
Volt
age
effi
cien
cy (
%)
Current density (A cm-2)
Page 64
64
duration of the test. Further testing is needed to determine the possible origin of this
problem. Another explanation is an increase of Cu(II)(aq) species in the anolyte during
the electrolysis. To address this second possibility, the effect of the change in Cu(II)
concentration needed to change the decomposition potential was quantified. Predicting
trends of the decomposition potential for the CuCl/HCl electrolytic reaction requires
thermodynamic properties of the aqueous species present in the anolyte and catholyte
solutions. Using the Gibbs energy minimization approach described previously [1],
equilibrium activities of the CuClx complexes involved in the electrolytic reaction were
evaluated. Helgeson-Kirkham-Flowers (HFK) [1, 15] model values for calculating
apparent standard Gibbs energy values for aqueous species were collected from literature
for the following ionic species; Cl-(aq), Cu
+(aq), Cu(OH)2
-(aq), CuCl2
-(aq), CuCl3
2-(aq).
Cu2+
(aq), CuOH+(aq), HCuO2
-(aq), CuO2
2-(aq), CuCl
+(aq), CuCl3
-(aq) and CuCl4
2-(aq)
[15–17]. Neutral species considered were HClo(aq), CuOH
o(aq), CuCl
o(aq), CuO
o(aq)
and CuCl2o(aq) [18-20]. As the actual reaction for this electrolytic cell is not known, an
assumed reaction was selected. All decomposition potentials were calculated for the
following reaction:
CuCl32-
(aq) + H+(aq) = CuCl3
-(aq) + 0.5 H2(g) (2)
This reaction was selected because of its simplicity, i.e. least number of active
species, and the concentration of CuCl32-
(aq) is the dominant Cu(I) species in high
concentrations of HCl(aq) [21]. Though the actual reaction(s) may differ slightly, after
accounting for activity effects, all possible electrolytic reactions within this cell will have
Page 65
65
the same potential at equilibrium [22]. The apparent Gibbs energy values used for the
species in the reaction at 80 oC and 1 bar are summarized in the Table 3-3.
Table 3-3. Apparent Gibbs energy values of Reaction (2) species at 80 oC and 1 bar [20].
Species ΔGi / (kJ/mol)
CuCl32-
(aq) -382.70
CuCl3-(aq) -315.98
H2(g) -7.33
H+(aq) 0
Using the values in Table 3, the Gibbs energy of reaction at unit activity in the infinitely
dilute solutions (molal standard state) is 68.056 kJ/mol with a standard cell potential of -
0.654 V, which is very different from the experimentally measured cell potential of -0.12
V.
As demonstrated previously [21,23], highly concentrated HCl(aq) solutions have
activity coefficients considerably larger than unity. Therefore, in addition to the values of
the standard Gibbs free energy of reaction, the activity coefficients should be considered
for the catholyte and anolyte solutions composed of highly concentrated HCl(aq). To
account for the non-ideality of the charged species within the aqueous phase, the mean
activity coefficients of HCl(aq) solution can be used because HCl(aq) is the dominating
electrolyte. The activity coefficients, γ±, for a wide range of concentrations from 1 to 11
mol kg-1
HCl(aq) solutions are available from 25 to 80 oC [22].
Table 3-4. The activity coefficients of HCl(aq) at 80 oC and 1 bar as a function of
molality b [21]
b / (mol/kg) γ±
Page 66
66
7.93 3.225
9.251 4.197
10.092 4.860
11.102 5.650
The equation used to model the mean activity coefficient of the dominant electrolyte
using experimental data was the third approximation of the Debye-Hückel theory [24]
( ) | |√
√ (
) (3)
Here 55.51 is the number of moles of water in one kilogram of water, bt = ∑bi refers to
the sum of molalities for all of the solute species, A and B are the Debye-Huckel
parameters [25], z+ and z- are the charge of the anion and cation, respectively, in the
dominant electrolyte, is the empirical radius of the aqueous component, C is the
empirical parameter of the supporting electrolyte [HCl(aq)] and Im is the ionic strength of
the solution on the molal scale. For these calculations, 0.45 nm was used for the
parameter of each species considered.
In order to predict trends with the decomposition potential, cell conditions and
species activities were needed for calculations. Cell temperature was held constant at 80
oC and pressure was 1 bar. The solution in contact with the anode was 2.49 mol of
CuCl(s) in 8.71 mol kg-1
HCl(aq) anolyte. The cathode was in contact with 7.75 mol kg-1
of HCl(aq) catholyte with a gas blanket of H2(g) at 1 bar of pressure. Using Gibbs energy
minimization [26], the [2.49 mol of CuCl(s) + 8.71 mol kg-1
HCl(aq)] anolyte should
have CuCl32-
(aq) and CuCl3-(aq) concentrations of 2.47 mol kg
-1 and 5.53 10
-8 mol kg
-1,
respectively. Furthermore, the resulting ionic strength of the solution was determined to
Page 67
67
be 11.18 mol/kg. With these operating conditions, the Nernst equation of the CuCl/HCl
electrolytic cell expressed by the following electrochemical diagram:
(Cathode,-) Cu|Pt|HCl(aq, 7.75 mol kg-1
),H2(g,1 bar) || CuCl32-
(aq, 2.47 mol/kg), CuCl3-
(aq, 5.53 10-8
mol/kg), HCl(aq, 8.71 mol/kg)|Cu (Anode,+) (4)
can be given as:
(
(
)
(
) ) (5)
where is the standard Gibbs energy of reaction, n is the electron number in the
reaction, F is Faraday’s constant of 96485 C/mol, R the molar gas constant of 8.3145
J/(mol K), T is the thermodynamic temperature in K, is the molality of the i-th species,
vi is the stoichiometric coefficient of the i-th species, is the activity coefficient of the i-
th species, (
) is the product of the reactant activities and (
) is the
product of the product activities taking into account the stoichiometric coefficient vi.
Using Eq. (5), apparent Gibbs energy values from Table 3, the mean activity coefficients
from Table 4, and composition of anolyte and catholyte given in Diagram (4), the Gibbs
energy of reaction (2), ΔrG, was calculated to be 8.39 kJ/mol and, therefore, the
theoretical DP is -0.087 V.
When compared to the experimental values measured, the theoretical DP was slightly
lower. One reason for the deviation between the theoretical and experimental DP was that
the concentration of the Cu(II)Clx(aq) species in the anolyte was not readily known
Page 68
68
throughout the test. Furthermore, the presence of the regeneration column ensures the
values of the Cu(II)Clx(aq) species were very low (b < 1 mmol kg-1
). This was justified
by the clear to faint yellow fluid leaving the electrolytic cell. Still, this presented an issue
for predicting the decomposition potential of the electrolytic cell. Therefore, we used the
experimental DP measurements to estimate the CuCl3-(aq) concentrations. Experimental
DP measurements, E(cell), were measured for a series of points during the test. As pH and
hydrogen gas pressure was constant throughout the test, the cathode potential, E(cathode),
could be considered relatively constant. By calculating the cathode potential, E(anode) was
determined from the conditions outlined above and the E(cell) values measured. Potential
values for the anode , cathode and cell are displayed in Table 3-4.
Using the Gibbs free energy values and the activities obtained from literature values, it is
possible to estimate the CuCl3-(aq) concentrations needed to obtain the E(anode) values
displayed in Figure Table 3-5. Table 3-5 displays the estimated CuCl3-(aq) values
expected throughout the duration of the test, assuming the deviation in the cell potential
is due entirely to the presence of additional copper concentration.
Table 3-5: Estimations of CuCl3-(aq) concentrations for the 168 hour test using measured
DP
Duration/h
E(cell)=
E(anode) - E(cathode)/V
E(cathode)/V E(anode)/V bCuCl3-(aq)/μmol kg-1
0 -0.180 -0.096 -0.276 1.15±0.05
90 -0.190 -0.096 -0.286 1.60±0.05
Page 69
69
120 -0.230 -0.096 -0.326 6.00±0.25
168 -0.245 -0.096 -0.341 9.70±0.25
Results from these calculations indicate that the decomposition potential could depend
strongly on fluctuations in the Cu(II) species due to an increased permeation through
membrane.
Conclusions
The Cu-Cl electrolyzer was operated for 168 h and a goal to maintain the cell at 0.3 A
cm-2
under 0.7 V was successfully met. EIS was applied to monitor the system behavior
over time and an equivalent circuit model was used to quantify the physical parameters
contributing to the overall impedance of the cell. It was concluded that the primary cause
of degradation during the 168 h of operation was the increase in the ohmic and charge-
transfer resistances. The through-plane conductivity cell proved to be a reliable and time-
efficient set up to calculate the membrane conductivity and screen new and existing
membranes before testing in the electrolyzer. Electrochemical kinetics was improved at
higher overpotentials, as the first loop shows in the EIS spectrum, which is related to the
charge-transfer resistance, decreased with increasing the applied potential. A rise in the
DP was observed with an increase in the total impedance over time and a thermodynamic
analysis was carried out to estimate the parameters effecting the DP. A current efficiency
of greater than 95 % was maintained throughout the experiment which confirms that
there were no side reactions taking place in the cell. The test summarizes the
Page 70
70
effectiveness of EIS as an aging protocol and it is recommended that it should be more
widely employed towards the development of the CuCl electrolyzer to characterize the
degradation mechanisms.
Acknowledgement
The authors gratefully acknowledge the financial support of this work by U.S.
Department of Energy’s Office of Energy Efficiency and Renewable Energy via a
subcontract with Argonne National Laboratory. We thank Drs. Michele Lewis and
Shabbir Ahmed for useful feedback on the obtained results.
Page 71
71
Chapter 3 References
1) Balashov, V., Schatz, R., Chalkova, E., Nikolay, A., Fedkin, M., and Lvov, S. N.,
CuCl Electrolysis for Hydrogen Production in the Cu–Cl Thermochemical Cycle, J.
Electrochem. Soc., 158, 2011, B266-B275.
2) Suppiah S, Stolberg L, Boniface H, Tan G, McMahon S, York S, et al., Canadian
nuclear hydrogen R&D programme: development of the medium-temperature CueCl
cycle andcontributions to the high-temperature sulphureiodine cycle. Nuclear production
of hydrogen, fourth information exchange meeting, Oakbrook, Illinois, USA; April 14–
16, 2010, 77-86.
3). G.F. Naterer, S. Suppiah, M. Lewis, K. Gabriel, I. Dincer, M.A. Rosen et al.., Recent
Canadian advances in nuclear-based hydrogen production and the thermochemical CueCl
cycle Int J Hydrogen Energy, 34 (2009), 2901–2917.
4) G.F. Naterer, S. Suppiah, L. Stolberg et al., Progress of international program on
hydrogen production with the copper–chlorine cycle, Int J Hydrogen Energy, 39 (2014),
2431–2435.
5). J.T. Müller, P.M. Urban., Characterization of direct methanol fuel cells by ac
impedance spectroscopy, J. Power Sources, 75 (1998), 139-143.
6) J.C. Amphlett, B.A. Peppley, E. Halliop, A. Sadiq, The effect of anode flow
characteristics and temperature on the performance of a direct methanol fuel cell, J.
Power Sources, 96 (2001), 204-213.
Page 72
72
7) J.-P. Diard, N. Glandut, P. Landaud, B. Le Gorrec, C. Montella, Electrochim. Acta, A
method for determining anode and cathode impedances of a direct methanol fuel cell
running on a load, 48 (2003), 555-562.
8) J.T. Müller, P.M. Urban, W.F. Hölderich, Impedance studies on direct methanol fuel
cell anodes, J. Power Sources, 84 (1999), 157-160.
9) H. Fukunaga, T. Ishida, N. Teranishi, C. Arai, K. Yamada, Electrochim. Acta,
Impedance of vapor feed direct methanol fuel cells—polarization dependence of
elementary processes at the anode, 49 (2004), 2123-2129.
10) S. Khurana, D.M. Hall, R.S. Schatz, S.N. Lvov, Diagnosis and Modeling of the CuCl
Electrolyzer Using Electrochemical Impedance Spectroscopy , ECS Trans, 53 (2013),
41–50.
11) D.M. Hall, R.S. Schatz, E.G. LaRow, S.N. Lvov, CuCl/HCl Electrolyzer Kinetics for
Hydrogen Production via Cu-Cl Thermochemical Cycle , ECS Trans, 58 (2013), 15–25.
12) R. Schatz, S. Kim, S. Khurana, M. Fedkin, S.N. Lvov, High Efficiency CuCl
Electrolyzer for Cu-Cl Thermochemical Cycle ECS Trans, 50 (2013), 153–164.
13) E. Barsoukov, J.R. MacDonald, Impedance Spectroscopy, ISBN 0-471-64749-7,
Wiley, 2005.
14) Xiao-Zi (Riny) Yuan, Chaojie Song, Haijiang Wang, Jiujun Zhang, Electrochemical
Impedance Spectroscopy in PEM Fuel Cells: Fundamentals and Applications, ISBN-10:
1848828454, Springer, 2010.
Page 73
73
15) H.C. Helgeson, D.H. Kirkham, Theoretical Prediction of The Thermodynamic
Behavior of Aqueous Electrolytes at High Pressures and Temperatures: II. Debye-Huckel
Parameters for Activity Coefficients and Relative Partial Molal Properties , Am. J. Sci.
274 (1974), 1199–1261.
16) H.K. Helgeson, D.H. Kirkham, G.C. Flowers, Theoretical prediction of the
thermodynamic behavior of aqueous electrolytes at high pressures and temperatures:
Calculation of activity coefficients, osmotic coefficients, and apparent molal and standard
and relative partial molal properties to 600°C , Am. J. Sci. 281 (1981), 1249-1516.
17) E.L. Shock, D.C. Sassani, D.A. Sverjensky, Inorganic species in geologic fluids:
Correlations among standard molal thermodynamic properties of aqueous ions and
hydroxide complexes., Geochim. Cosmochim. Acta. 61 (1997), 907–950.
18) N.N. Akinfiev, A.V. Zotov, Thermodynamic description of chloride, hydrosulfide,
and hydroxo complexes of Ag(I), Cu(I), and Au(I) at temperatures of 25–500 °C and
pressures of 1– 2000 bar., Geochemistry Int. 39 (2001), 990 – 1006.
29) E.L. Shock, H.C. Helgeson, Calculation of the thermodynamic and transport
properties of aqueous species at high pressures and temperatures: Correlation algorithms
for ionic species and equation of state predictions to 5 kb and 1000°C, Geochim.
Cosmochim. Acta. 52 (1988), 2009–2036.
Page 74
74
20) V. Pokrovskii, Calculation of the standard partial molal thermodynamic properties
and dissociation constants of aqueous HCl and HBr at temperatures to 1000 ° C and
pressures to 5 kbar, Geochim. Cosmochim. Acta. 63 (1999), 1107–1115.
21) Sverjensky, D. A.; Shock, E. L.; Helgeson, H. C., Prediction of the thermodynamic
properties of aqueous metal complexes to 1000 degrees C and 5 kb., Geochim.
Cosmochim. Acta (1997), 61, 1359–1412.
22) Hall, D. M.; Akinfiev, N.;, LaRow, E.; Schatz, R.; Lvov, S. N.; Thermodynamics and
Efficiency of a CuCl(aq)/HCl(aq) Electrolyzer. Electrochimica Acta. (2014, submitted)
23) A. Cerqutti, P. Longhi, T. Mussini, Thermodynamics of Aqueous Hydrochloric Acid
from E.M.F.’s of Hydrogen-Chlorine Cells, J. Chem. Eng. Data. 13 (1968), 458.
24) J.I. Partanen, P.M. Juusola, K.P. Vahteristo, A.J.G. Mendonça, Re-evaluation of the
Activity Coefficients of Aqueous Hydrochloric Acid Solutions up to a Molality of 16.0
mol·kg−1 Using the Hückel and Pitzer Equations at Temperatures from 0 to 50 °C, J.
Solution Chem. 36 (2007) 39–59.
25) R.A. Robinson, R.H. Stokes, Electrolyte Solutions, Revised Se, Butterworths,
London, 1970.
26) Shvarov, Y. V., HCh:New potentialities for the thermodynamic simulation of
geochemical systems offered by windows, Geochemistry Int. (2008), 46, 834–839.
Page 75
75
Chapter 4
Performance analysis and characterization of a liquid tin anode solid oxide fuel cell
This text for this chapter was originally prepared for the Journal of Power Sources as
“Performance analysis and characterization of a liquid tin anode solid oxide fuel cell”, S.
Khurana, M. LaBarbera, M. Fedkin, S. Lvov, H. Abernathy, and K. Gerdes. This paper
was submitted July 2014.
Preface to Chapter 4
Chapter 4 details the operation of a liquid tin anode solid oxide fuel cell in the battery
mode and as a fuel cell utilizing hydrogen and coal as fuels. The experimental design of
the novel LMA SOFC system is followed by the EIS data analysis to study the transport
and electrochemical properties of the reactions in the liquid anode. The development of a
cathode symmetry cell helps in separating the impedance contributions from the two
electrodes. Equivalent circuit modeling of the data provides quantitative information on
the oxygen diffusivity in the liquid anode.
Page 76
76
Abstract
A liquid tin anode solid oxide fuel cell is constructed and investigated under different
operating conditions. Electrochemical Impedance Spectroscopy (EIS) is used to reflect the
effect of fuel feed as the EIS spectra changes significantly on switching the fuel from argon
to hydrogen. A cathode symmetric cell is used to separate the impedance from the two
electrodes, and the results indicate that a major contribution to the charge-transfer and mass-
transfer impedance arises from the anode. The OCP of 0.841 V for the cell operating under
argon as a metal-air battery indicates the formation of a SnO2 layer at the electrolyte/anode
interface. The increase in the OCP to 1.1 V for the hydrogen fueled cell shows that H2
reduces the SnO2 film effectively. The effective oxygen diffusion coefficients are calculated
using the Warburg element in the equivalent circuit model for the experimental EIS data, and
the values of 1.9 10-3
cm2 s
-1 at 700 ºC, 2.3 10
-3 cm
2 s
-1 at 800 ºC and 3.5 10
-3 cm
2 s
-1 at 900
ºC are similar to the previously obtained experimental results. Further, the performance
degradation over time is attributed to the irreversible conversion of Sn to SnO2 resulting from
galvanic polarization.
Keywords:
Solid Oxide Fuel Cell; Liquid Metal Anode; Electrochemical Impedance
Spectroscopy; Equivalent Circuit Modeling, Warburg Impedance, Metal-Air Battery
Introduction
With the continuous increase in the world’s energy demands, it has been predicted
that fossil fuels will remain the primary source of energy for the next two decades [1, 2].
Page 77
77
Higher process efficiency systems are required to better utilize coal as a power source
while minimizing CO2 release to the environment. Solid Oxide Fuel Cells (SOFCs) are
capable of generating electrical power from the oxidation of a variety of gaseous and
liquid hydrocarbons [3-5]. However, the performance degradation due to impurities is
still a cause of concern. Also, carbon deposition on the anode remarkably degrades the
cell performance by reducing the effective surface area in conventional SOFCs [3-7].
There is growing interest in the development of Liquid Metal Anode Solid Oxide
Fuel Cells (LMA-SOFCs) [8-22], as the technology is tolerant to fuel contaminants, has a
better usage of the active surface area, and is capable of operating in a battery mode in
case of fuel starvation [8, 9]. While significant efforts have been made to study the
kinetics and thermodynamics of an LMA-SOFC system [8], and various anode materials
have been tested [12, 15], the mechanism of transport of oxygen ions through the liquid
tin anode under the presence of different fuels has not been conclusive so far.
Electrochemical Impedance Spectroscopy (EIS) is a powerful tool that can be used to
characterize the cell performance and distinguish between processes occurring on
different time scales [23-25]. Numerous efforts have been made to study the different
arcs observed in the EIS spectra and relate them to the physical processes. The low
frequency arc is attributed to the diffusion or mass-transfer controlled processes [26-29],
while the first arc in the high frequency region is believed to be arising from the charge-
transfer processes [30, 31]. Despite the large number of results available for EIS analysis
of conventional SOFCs, there are no published records of a detailed interpretation of EIS
data for the LTA-SOFC system. As an extension to our previous work where preliminary
EIS data analysis was presented [15], this study is focused on the quantitative analysis of
Page 78
78
the effect of fuel feed and separating the impedance contributed by the liquid anode. The
Open Circuit Potential (OCP) analysis of the cell operating under different fuels provides
insight into the reaction mechanisms and indicates the efficiency of the reduction of SnO2
to Sn under different conditions. The effective oxygen diffusion coefficients calculated
from the Warburg impedance observed in the EIS data are in close agreement with the
previous results [9], and confirm that the performance improvements in the LTA-SOFC
rely heavily on minimizing the transport losses in the liquid Sn layer.
Experimental
Cell preparation
The primary goal of this study was to analyze the impedance and transport properties
in the liquid tin and not to develop a prototype for maximum performance. Accordingly,
a relatively thick electrolyte was used in order to have a robust system that could support
variable tin loadings. The experimental system in this study was similar to the one
previously used in our work [15], and utilized a YSZ crucible as the electrolyte. The
thickness and base diameter of the crucible were 2.54 cm and 0.15 cm, respectively.
Lanthanum strontium manganite (LSM) paste, which consists of La0.8Sr0.2MnO3
suspended in terpenol (Fuel Cell Materials, LSM20-I), was used as the cathode and
painted at the outer surface of the crucible base. The cathode was then sintered onto the
crucible by heating from 25 to 1150 °C at a rate of 10 °C min-1
. The cell was maintained
at 1150 °C for 12 hours and then cooled at the same rate. Two gold leads (current
collector and voltage sensor) were attached to the LSM.
Page 79
79
The total volume of the crucible was 12.9 cm3 and it was partially filled with solid tin
shot (99.999 % Sigma Aldrich). For current collection, two rhenium wires were dipped
into the anode with an alumina-sheathed thermocouple after tin attained its melting
during heat-up. Rhenium was specifically chosen as a current collector as it does not
form an alloy with Sn. An alumina feed tube was supported above the anode for injection
of the additional anode material.
The LMA-SOFC described above was inserted into the top of a vertically oriented
Barnstead Thermolyne tubular furnace. A constant flow rate of 50 cm3 min
-1 was used for
both hydrogen and argon feeds at the anode. The measurements were performed using
Solartron Analytical 1470-E Potentiostat with a Solartron Analytical 1252-A frequency
response analyzer for EIS measurements.
Electrochemical testing
The liquid tin anode solid oxide fuel cell fueled by humidified hydrogen (3% H2O)
was heated from 25 to 900 °C at a rate of 10 °C min-1
. With the liquid anode and air-fed
cathode, the OCP of the cell was monitored for 3 hours and EIS measurements were
carried out periodically after every 30 min in the frequency range of 300 kHz - 50 mHz
with 15 points per decade interval. Following OCP measurements, the cell was subjected
to a series of 10 LSV measurements between OCP-0.4V during a ten-hour period.
Finally, impedance measurements were done at the OCP following the ten polarization
cycles. Kramers-Kronig transformations [32, 33] were used to validate the experimental
data and fitting was done using the complex nonlinear least squares (CNLS) method [32].
Page 80
80
Cathode symmetry cell
The difficulties involved in separating the impedance response using reference
electrodes for SOFCs are already documented [34-37], and hence, a cathode symmetric
cell was used to determine the impedance contributions from the membrane and cathode.
The base of a YSZ crucible was cut from the full crucible and both sides were painted
with LSM paste. The electrodes were sintered in a similar manner as described before.
Silver paste was used to attach two gold wires on both sides to permit four electrode
measurements.
The cathode symmetric cell was then put in an air fed furnace at 900 °C to monitor
OCP in order to ensure identical chemical activities at each electrode. EIS measurements
were carried out in the frequency range of 300 kHz to 50 mHz.
Results and discussion
AC impedance and OCP analysis
The LMA-SOFC was operated under hydrogen, argon and coal as the anode feeds. The
impedance spectra collected from the LMA-SOFC under hydrogen and argon at the OCP are
shown in Figure 4-1. The EIS data for the coal powered cell are shown separately in Figure
4-2 due to heavy overlapping with the results from the cell maintained under argon. The coal
used in this study was high volatility A-bituminous coal.
Page 81
81
Figure 4-1. Impedance spectra generated by liquid tin anode SOFC at 900 °C under argon
and hydrogen anode feeds. A 10 mV alternating potential is applied at a range of
frequencies 10 kHz to 50 mHz plotted (left) and high frequency close-up (right).
Page 82
82
Figure 4-2. Impedance spectra generated by the liquid tin anode SOFC at 900 °C under
coal.
Figure 4-3 represents the equivalent circuit models used to simulate the experimental
data and the fit converged satisfactorily. The chi-squared (χ2) parameter, representing the
goodness of the fit [38], was 5 10-4
.
Figure 4-3. Equivalent circuit models used in fitting LMA-SOFC: Argon and coal fed
LMA-SOFC model (top); Equivalent circuit model used to fit hydrogen fueled LMA-
SOFC (bottom).
The models consist of Rohm, which is the high frequency intercept with the real axis
corresponding to the ohmic resistance of the cell, and the two nonohmic impedance
components. The nonohmic impedance consists of: Rct, which is the charge transfer
resistance calculated by the difference between the maximum value of the high frequency
Page 83
83
resistance (RmaxHF ) and the ohmic resistance (RmaxHF – Rohm), and Rm, which is the mass
transfer resistance observed in the low-frequency region. The constant phase elements
(CPEs), first introduced by Cole and Cole [39], were incorporated to adjust the ideal
capacitive elements under realistic conditions. Mathematically, the impedance of a CPE
is defined as Z= 1/(Q(jw)p), where w is the angular frequency of the AC signal, Q is the
admittance constant, and p is an adjustment parameter whose typical value is between 0.5
and 1.0.
Table 4-1. shows the equivalent circuit modeling results for the cell operated under
different fuels along with their corresponding OCP.
Table 4-1. Area specific ohmic, charge transfer and mass transfer resistance values for
the cell operated under different fuels with the corresponding OCP.
Open Circuit
Potential (V)
Rohm (Ω cm2) Rct (Ω cm
2) Rm (Ω cm
2)
Hydrogen 1.1 4.33 9.1 162.1
Coal 0.885 3.02 1.98 -
Argon 0.841 2.85 1.86 -
The area specific charge transfer resistance increased from 1.86 to 9.1 Ω cm2 as the
anode feed was switched from argon to hydrogen, while the mass transfer was absent for
the cell operated under argon. This is mainly attributed to the fact that under an inert
atmosphere, the only electrochemical reaction would be the oxidation of tin at the
electrolyte/anode interface. The hydrogen-fed cell showed an additional mass transfer
resistance of 163.1 Ω cm2. The hydrogen fueled LMA-SOFC maintained an OCP of 1.1
V, and while under argon the OCP observed was 0.841 V. The OCP of 0.841 V generated
Page 84
84
by the cell under argon results from the oxidation of liquid tin to solid tin dioxide and is
nearly equal to the theoretical standard potential of 0.85 V for this reaction at 900 ºC. On
the other hand, the OCP of 1.1 V generated by the hydrogen fueled cell is similar to the
hydrogen Nernst potential at 900 ºC, indicating that the OCP was governed by the
oxidation of fuel. The area specific ohmic resistance of the cell also increased from 2.83
to 4.33 Ω cm2. Since hydrogen reduces SnO2 to Sn, one would expect to see a decline in
the ohmic resistance upon introducing hydrogen. However, this counterintuitive increase
in the ohmic resistance for the hydrogen fueled cell stems from the fact that the effective
diffusion length is reduced in the case of hydrogen fueled cell [8]. This leads to a higher
percentage of SnO2 which has a very low conductivity of 0.3 S cm-1
at 1000 ºC [40]. The
higher ohmic resistance of the hydrogen fueled cell also indicates the possibility of some
dissolved hydrogen.
It is interesting to note that OCP of the cell following coal injection was 0.885 V,
which is lower than the hydrogen fueled cell and higher that the cell operated under
argon. This indicates that the addition of carbon resulted in only a partial reduction of
SnO2, and while the LMA –SOFC system could utilize carbonaceous fuels, the most
efficient fuel remains hydrogen.
The results from the cathode symmetric cell are shown in Figure 4-4, and the model
shown in Figure 4-3 was used to fit the experimental data.
Page 85
85
Figure 4-4. Impedance spectra generated by cathode symmetric cell at 900 °C (both
electrodes under air).
The charge-transfer resistance of 6.55 Ω cm2
was calculated by the model, and taking
half of electrode response, the nonohmic (or purely charge transfer) cathodic resistance
was found to be 3.27 Ω cm2. On comparing it with the charge transfer resistance of the
full cell (9.1 Ω cm2), it is concluded that 63% of the charge transfer resistance is
contributed by the liquid tin anode.
While the data presented so far was useful to characterize the performance of an
LMA-SOFC, it was also essential to observe the cell behavior at different temperatures
and calculate the effective oxygen diffusion coefficient in liquid tin.
Page 86
86
Warburg impedance for the hydrogen fueled LMA-SOFC
Figure 4-5, shows the EIS data for the cell operating at 700, 800 and 900 ºC using
hydrogen as the anode feed.
Figure 4-5. Impedance spectra generated by liquid tin anode SOFC at different
temperatures under hydrogen anode feed. A 10 mV alternating potential is applied at a
range of frequencies 10 kHz to 50 mHz plotted (left) and high frequency close-up (right).
The equivalent circuit model shown in Figure 4-3, which was used to simulate the
hydrogen fueled EIS data was adopted because of its simplistic approach to interpret the
results, and more importantly, to maintain consistency in models while analyzing the
effect of fuel on the cell. However, the fitting was slightly improved (χ2
was 8 10-4
) upon
introducing the Warburg element, as a characteristic straight line is observed in the low
frequency region of the Nyquist plot for the hydrogen fueled cell. Figure 4-6 represents
Page 87
87
the modified equivalent circuit model and it was used to calculate the effective oxygen
diffusion coefficient.
Figure 4-6. Equivalent circuit model with the addition of Warburg element (W) to
calculate the diffusion coefficient.
Mathematically, the impedance of the Warburg element is described by:
1
1 1
1
1
1
tanh(( . ) )( )
( . )
w
w
P
w w
P
w
R s TW s
s T
where s is the Laplace complex frequency, RW1 is the finite resistance at low
frequencies, and PW1 is an exponent related with the roughness of the diffusion media.
TW1 is a time constant related the diffusion effects [41, 42] as:
Twl= L2/D
where L is the diffusion thickness, and D is the effective diffusion coefficient. The
diffusion thickness was measured experimentally to be 0.35 cm. The time constant, TW1,
was calculated from the Warbug element. Table 4-2 shows the values of time constant
and the calculated effective diffusion coefficients at different temperatures.
Page 88
88
Table 4-2. Time constants with the calculated values of diffusion coefficients at different
temperatures.
Operating temperature
(ºC)
Time constant (s) Diffusion coefficient (10-
3 cm
2 s
-1)
700 63 1.9
800 42 2.91
900 35 3.5
As expected, the diffusion coefficients increase with temperature. Also, it is important
to note that the effective diffusion coefficients are an order of magnitude higher than the
previously obtained experimental values [8], but are similar to the numbers obtained by
Gemmen et al.[9], where the diffusion coefficients were measured in the presence of
hydrogen. As corroborated from the fuel dependence EIS data, the effect of fuel has a
significant effect on the transport properties in liquid tin and greatly contributes to the
non-ohmic resistance of the cell.
Performance degradation in LMA-SOFC
In-situ EIS and LSV measurements were used to study the transient state and
performance degradation of the hydrogen fueled cell at 900 ºC. Figure 4-7 shows the
decline in current at 0.4 V over 10 polarization cycles from OCP-0.4 V.
Page 89
89
Figure 4-7. Decline in current at 0.4 V over 10 polarization cycles.
Figure 4-8 compares the EIS response of the fresh cell with the cycled cell. A huge
increase in the overall impedance was observed after operation.
Page 90
90
Figure 4-8. EIS spectra for the LMA-SOFC at OCP operating under hydrogen at 900 ºC
representing the degradation over time.
The decline in the current observed from Figure 74- stems from the significant
increase in the overall impedance over time. The increase in the ohmic resistance of the
cell from 4.33 to 42.1 Ω cm2
indicates the formation of a SnO2 layer which has a much
lower conductivity compared to Sn. The transient characteristics and an increase in
impedance upon cycling further demonstrates that the SnO2 layer formed by oxidation of
liquid Sn covered the electrolyte/anode interface and blocked the diffusion of oxygen
ions for further oxidation of molten tin. This results in the reduction of the usage of
available anode, thereby decreasing the overall efficiency.
Page 91
91
Summary
A liquid tin anode solid oxide fuel cell was developed and characterized to highlight
its capabilities operating under different fuels and at different temperatures. The cell
operating under hydrogen showed a unique EIS spectra, which was characteristic of a
diffusion controlled system. On the other hand, the EIS data for the cell maintained under
argon and operating as a metal-air battery confirms the absence of any significant mass-
transfer and the OCP of 0.841 V indicated the formation of SnO2. Consequently, this
oxide layer accumulated over the electrolyte surface and blocked the diffusional path of
oxygen ions resulting in the reduced active area. The cathode symmetry cell proved to be
a useful and reliable method to separate the impedance contributions from the two
electrodes. A comparison of the equivalent circuit parameters obtained from the full cell
and the symmetric cell revealed that the anode was the primary source of the nonohmic
resistance when the cell was operated under hydrogen feed. The effective oxygen
diffusion coefficients were calculated at different temperatures, and on comparing the
values with the previously established results, it was concluded that the higher diffusion
coefficient was due to the presence of hydrogen.
An OCP of 0.885 V obtained for the cell powered with coal suggests that the OCP
was governed by both Sn and C oxidation, and reduced only part of SnO2 formed in the
battery mode. The effective oxygen diffusion coefficients for the hydrogen fueled cell
were higher than the values reported in literature (where measurements were carried out
in the absence of hydrogen), and indicate reduction in the effective diffusion path length.
This leads to a relatively higher ratio of SnO2/Sn than compared to the argon or coal fed
Page 92
92
cell where the fuel diffusion was absent or insignificant. Consequently, the ohmic
resistance of the hydrogen fueled cell is highest and it decreases as the anode feed is
switched to argon. The performance degradation confirms that while the LTA-SOFC
system does have the capability to utilize a wide range of fuels and has a clear advantage
to operate in a battery mode, the resistance added by the formed SnO2 layer is the
primary cause of degradation and future work should be directed to minimize the losses
due to the oxide layer.
Acknowledgement
The authors gratefully acknowledge the financial support of this work by National
Energy Technology Laboratory (NETL).
Page 93
93
Chapter 4 References
[1] I.E. Agency, World Energy Outlook, (2008).
[2] I.E. Agency, World Energy Outlook, (2010).
[3] T.M. Gür, M. Homel, A.V. Virkar, Journal of Power Sources, 195 (2010) 1085-1090.
[4] Z. Zhou, C. Gallo, M. Pague, H. Schobert, S. Lvov, Journal of Power Sources, 133
(2004) 181-187.
[5] Z. Zhou, R. Kumar, S. Thakur, L. Rudnick, H. Schobert, S. Lvov, Journal of Power
Sources, 171 (2007) 856-860.
[6] R. Gorte, J. Vohs, Current Opinion in Colloid & Interface Science, 14 (2009) 236-
244.
[7] S. Singhal, High-temperature Solid Oxide Fuel Cells: Fundamentals, Design and
Applications: Fundamentals, Design and Applications, Elsevier, 2003.
[8] H. Abernathy, R. Gemmen, K. Gerdes, M. Koslowske, T. Tao, Journal of Power
Sources, 196 (2011) 4564-4572.
[9] R. Gemmen, H. Abernathy, K. Gerdes, M. Koslowske, W.A. McPhee, T. Tao, in:
Ceramic Engineering and Science Proceedings, 2009, pp. 37.
[10] A. Javadekar, A. Jayakumar, R.J. Gorte, J.M. Vohs, D. Buttrey, Journal of The
Electrochemical Society, 159 (2012) A386-A389.
[11] A. Jayakumar, R. Küngas, S. Roy, A. Javadekar, D.J. Buttrey, J.M. Vohs, R.J. Gorte,
Energy & Environmental Science, 4 (2011) 4133-4137.
[12] A. Jayakumar, S. Lee, A. Hornes, J. Vohs, R. Gorte, Journal of the Electrochemical
Society, 157 (2010) B365-B369.
Page 94
94
[13] A. Jayakumar, J. Vohs, R. Gorte, Industrial & Engineering Chemistry Research, 49
(2010) 10237-10241.
[14] M. LaBarbera, M. Fedkin, S. Lvov, ECS Transactions, 35 (2011) 2725-2734.
[15] M. LaBarbera, S. Khurana, M. Fedkin, S. Lvov, H. Abernathy, K. Gerdes, ECS
Transactions, 41 (2012) 103-113.
[16] W.A. McPhee, M. Boucher, J. Stuart, R.S. Parnas, M. Koslowske, T. Tao, B.A.
Wilhite, Energy & Fuels, 23 (2009) 5036-5041.
[17] G. Sikha, W.A. McPhee, Q. Zhang, M. Koslowske, T. Tao, R. White, ECS
Transactions, 17 (2009) 161-173.
[18] T. Tao, in, Celltech Power, Llc, 2011.
[19] T. Tao, L. Bateman, J. Bentley, M. Slaney, ECS Transactions, 5 (2007) 463-472.
[20] T. Tao, M. Slaney, L. Bateman, J. Bentley, ECS Transactions, 7 (2007) 1389-1397.
[21] T.T. Tao, M. Koslowske, J. Bentley, J. Brodie, C. MacKean, ECS Transactions, 41
(2012) 125-135.
[22] M. Koslowske, W. McPhee, L. Bateman, M. Slaney, J. Bentley, T. Tao, in: Ceramic
Engineering and Science Proceedings, 2009, pp. 27.
[23] P. Jasinski, T. Suzuki, F. Dogan, H.U. Anderson, Solid State Ionics, 175 (2004) 35-
38.
[24] M.J. Jørgensen, M. Mogensen, Journal of The Electrochemical Society, 148 (2001)
A433-A442.
[25] Y. Lin, Z. Zhan, J. Liu, S.A. Barnett, Solid State Ionics, 176 (2005) 1827-1835.
[26] P. Aravind, J. Ouweltjes, J. Schoonman, Journal of The Electrochemical Society,
156 (2009) B1417-B1422.
Page 95
95
[27] B. Boukamp, M. Verbraeken, D. Blank, P. Holtappels, Solid State Ionics, 177 (2006)
2539-2541.
[28] T. Jacobsen, P.V. Hendriksen, S. Koch, Electrochimica Acta, 53 (2008) 7500-7508.
[29] Y. Qi, B. Huang, K.T. Chuang, Journal of Power Sources, 150 (2005) 32-47.
[30] A. Barbucci, M. Viviani, P. Carpanese, D. Vladikova, Z. Stoynov, Electrochimica
Acta, 51 (2006) 1641-1650.
[31] S. Jiang, J. Love, Y. Ramprakash, Journal of Power Sources, 110 (2002) 201-208.
[32] A. Sadkowski, Journal of Electroanalytical Chemistry, 573 (2004) 241-253.
[33] M. Urquidi-Macdonald, S. Real, D.D. Macdonald, Electrochimica Acta, 35 (1990)
1559-1566.
[34] S. Adler, Journal of The Electrochemical Society, 149 (2002) E166-E172.
[35] S. Adler, B. Henderson, M. Wilson, D. Taylor, R. Richards, Solid State Ionics, 134
(2000) 35-42.
[36] S. McIntosh, S.B. Adler, J.M. Vohs, R.J. Gorte, Electrochemical and Solid-State
Letters, 7 (2004) A111-A114.
[37] S. McIntosh, J. Vohs, R. Gorte, Journal of The Electrochemical Society, 150 (2003)
A1305-A1312.
[38] X.-Z. Yuan, C. Song, H. Wang, J. Zhang, Fundamentals and ApplicationsSpringer-
Verlag, London, (2010).
[39] K.S. Cole, R.H. Cole, The Journal of Chemical Physics, 9 (2004) 341-351.
[40] I. Barin, F. Sauert, E. Schultze-Rhonhof, W.S. Sheng, Thermochemical data of pure
substances, VCH Weinheim, 1993.
Page 96
96
[41] P. Jasinski, V. Petrovsky, T. Suzuki, H.U. Anderson, Journal of The Electrochemical
Society, 152 (2005) J27-J32.
[42] M. Levi, D. Aurbach, The Journal of Physical Chemistry B, 101 (1997) 4641-4647.
Page 97
Chapter 5
Summary
This dissertation details the author’s contribution towards the development on in-situ
diagnostics methods to characterize the performance of CuCl electrolyzer and liquid
metal anode solid oxide fuel cells. EIS measurements provide insight into the reaction
mechanisms and also used to diagnose failure modes impeding the long term durability
goals.
Chapter 1 presents the basic principles of CuCl electrolyzer and LMA SOFC along
with the fundamentals of EIS. The current requirements to develop the electrolyzer and
novel liquid metal anode fuel cells were discussed and the methodology of analyzing EIS
data using equivalent circuit models was studied.
Chapter 2 and 3 outline the operation, efficiency and durability of the CuCl
electrolyzer along with the engineering challenges involved with it. EIS analysis of the
electrolyzer for different operating conditions is presented and the optimized parameters
found from this study were used to test the system for durability. As confirmed by EIS
and LSV measurements, the degradation in performance was attributed to the decrease in
membrane conductivity. A detailed thermodynamic analysis of the CuCl electrolyzer was
done to estimate the OCP of the cell.
Chapter 4 presents the analysis of a liquid tin anode solid oxide fuel cell operating
under argon as a metal-air battery, and also operating as a fuel cell with hydrogen and
Page 98
98
coal as the fuels. The results from this this study were used to understand the reaction
mechanism in the liquid anode layer while also studying the transport properties under
different conditions.
Page 99
Chapter 6
Conclusions and Future Work
The results presented in this dissertation proved that the performance efficiency of the
CuCl electrolyzer is optimized at 80 ºC with 2 mol of CuCl(s) in 7 mol L
-1 HCl(aq) as
the anolyte and 7 mol L-1
HCl(aq) as the catholyte. Further the contact pressure of 6.3 psi
should be used at the end plates while preparing the MEA. EIS analysis of the continuous
operation of the cell confirmed that degradation in the cell is mainly due to the decrease
in membrane conductivity. The results strongly encourage the use of a through-plane
conductivity cell as an independent set-up con screen different membranes for their use in
the electrolyzer. The successful operation of the electrolyzer for 168 hours also met the
DOE’s long term goal in order to further invest in this technology. However, we still
believe that there is a scope of improvement to increase the longevity and performance of
the electrolyzer, with both mechanical and chemical modifications. Following points
should be considered and further investigated:
1. Development of new membranes with higher conductivity and lowe
permeation of Cu ions.
2. Optimization of the flow-field design would result in better distribution of
the current density and more efficient utilization of the active area.
Page 100
100
3. Designing a crystallizer to avoid precipitation of CuCl(s), which is
necessary for long term operation.
4. From the standpoint of cost efficiency, new catalyst materials should be
explored along with the techniques to apply on the electrodes aimed at
reduced catalyst loadings.
The results from the LTA-SOFC provide insight into the reaction mechanism and the
show the effect of different fuels. While the cell operated as a metal-air battery under
argon, introduction of coal in the anode feed slightly increased the OCP of the cell
resulting from the reduction of SnO2 to Sn. Upon introducing hydrogen as the fuel, the
OCP was further increased and maximum efficiency was observed. The results in this
dissertation proved that the nonohmic contributions in the total impedance of an LTA
SOFC are mainly due to the liquid tin anode. Further, the system was diffusion controlled
while the cell was operating under hydrogen and the effective oxygen diffusion
coefficients were in close agreement with the previously published results. This study
highlights the potential of EIS to study the degradation mechanisms as well as
investigating the mass transport and kinetics of the liquid tin anode solid oxide fuel cell.
The future work towards the development of liquid metal anode solid oxide fuel cell
systems should be directed on:
1. Improvement of oxygen transport within the liquid metal anode by increasing
oxygen solubility.
2. Analysis of surface tension, contact angle and vapor pressure of the liquid
metal.
Page 101
101
3. Obtaining better contact between liquid metal anode and the electrolyte to
optimize the contact area.
Page 102
VITA
Sanchit Khurana
Education
Ph.D. in Energy and Mineral Engineering (2010-2014)
PENNSYLVANIA STATE UNIVERSITY, University Park, PA
B.S in Chemical Engineering (2006-2010)
University School of Chemical Technology, India
Research Experience
Graduate Research Experience, The Pennsylvania State University, University Park
August 2010-August 2014
Battery Development Scientist (Co-op), EOS Energy Storage, Edison, NJ
April 2013-November 2013
Publications
“Performance Evaluation and Characterization of Liquid Metal Anode Solid Oxide
Fuel Cells”, S. Khurana, M. LaBarbera, M. Fedkin, S. Lvov, H. Abernathy, and K.
Gerdes, J. Power Sources (Submitted)
“State–of-Health of the CuCl electrolyzer during a 168 hour test”, Sanchit Khurana,
Rich Schatz, Soohyun Kim, Mark V. Fedkin, Serguei N. Lvov, International Journal
of Hydrogen Energy (Submitted)
“ Diagnosis and Modeling of the CuCl electrolyzer using Electrochemical Impedance
Spectroscopy”, Sanchit Khurana, Derek Hall, Rich Schatz,, Serguei N. Lvov, ECS
Transactions 53 (9), 41-50
M. LaBarbera, S. Khurana, M. Fedkin, S. Lvov, H. Abernathy, K. Gerdes, ECS
Transactions, 41 (2012) 103-113
“Advanced CuCl Electrolyzer for Hydrogen Production via the Cu-Cl
Thermochemical Cycle”, Kim S., Schatz R.S., Khurana S., Fedkin M.V., Wang C.
and Lvov S.N., Electrochemical Society Transactions (2011)
“Using Electrochemical Impedance Spectroscopy for Characterization of Hydrogen
Production in CuCl Electrolyzer:, Sanchit Khurana, Rich Schatz, Soohyun Kim,
Mark V. Fedkin, Serguei N. Lvov, WHEC, 2012
R. Schatz, S. Kim, S. Khurana, M. Fedkin, and S. Lvov, ECS Transactions, 153-
164, 49 (2013)