In Situ Exploration of Metallic Diaphragm Rupture in a Shock Tunnel Yasseen Abdel-Magied * Undergraduate Student, School of Mechanical and Mining Engineering, The University of Qld, 4067, Australia Dr. David E. Gildfind † Lecturer, School of Mechanical and Mining Engineering, The University of Qld, 4067, Australia Douglas Malcolm ‡ Workshop Manager, School of Mechanical and Mining Engineering, The University of Qld, 4067, Australia Impulse facilities are an essential apparatus in the study of hypersonic flight. The experimental measurements taken from experiments conducted in these facilities are used in the study of flow behaviour and the verification and validation of predictive computational fluid dynamic or analytical models. The impulse facility relies upon the rupture of a diaphragm separating gases in high pressure and low pressure tunnels to release the energy stored in the former as a brief hypersonic flow of gas. In the impulse labs at the University of Queensland, the rupture of diaphragms occurs over a period on the order of 100 microseconds; sufficiently long to have an undesirable non uniform influence on the flow behaviour. In the analysis of experimental data, a constant rate iris opening model is used to model to account for the influence of the diaphragms boundary condition. This model introduces uncertainty into the predictive models as it does not account for the variability of opening rate, opening dynamics and tends to rely approximations of total opening time. The purpose of this study is to improve the understanding and the ability to predict this boundary condition to facilitate the generation of more accurate models of impulse facility flows and in turn a higher degree of confidence in measured results used to quantify experimental results. An experimental study was carried out on the three (3) metre long Drummond Shock Tube using 0.6mm thick, 5 series aluminium diaphragms. The rupture dynamics of scored, pierced and pressure burst diaphragms were filmed with three (3) high speed cameras and analysis of the data was conducted in Adobe Photoshop and Illustrator. By comparing the results of the study to that observed in larger impulse facilities, a conceptual model which relates the resistance of the diaphragm to deformation may be related to the driving force from the facility to predict rupture behaviour. The next steps are to develop the pre-rupture finite element model (FEM) and to extend that to include simulations of diaphragm fracture with a vision to integrate this FEM into a Computational Fluid Dynamics (CFD) package where the dynamic deforming model may be used in the predictive models. Nomenclature R.T Rupture Time K Experimental Rupture Coefficient ρ material density * Mechanical and Aerospace Engineering Student ,The University of Queensland,St. Lucia, AIAA Student Member. † Supervisor to Research Project,Centre for Hypersonics, The University of Queensland,Australia ‡ Laboratory Technician,Department of Mechanical Engineering, The University of Queensland, Australia 1 of 12 American Institute of Aeronautics and Astronautics
Transcript
In Situ Exploration of Metallic Diaphragm Rupture in
a Shock Tunnel
Yasseen Abdel-Magied∗
Undergraduate Student, School of Mechanical and Mining Engineering, The University of Qld, 4067, Australia
Dr. David E. Gildfind†
Lecturer, School of Mechanical and Mining Engineering, The University of Qld, 4067, Australia
Douglas Malcolm‡
Workshop Manager, School of Mechanical and Mining Engineering, The University of Qld, 4067, Australia
Impulse facilities are an essential apparatus in the study of hypersonic flight. Theexperimental measurements taken from experiments conducted in these facilities are used inthe study of flow behaviour and the verification and validation of predictive computationalfluid dynamic or analytical models.
The impulse facility relies upon the rupture of a diaphragm separating gases in highpressure and low pressure tunnels to release the energy stored in the former as a briefhypersonic flow of gas.
In the impulse labs at the University of Queensland, the rupture of diaphragms occursover a period on the order of 100 microseconds; sufficiently long to have an undesirable nonuniform influence on the flow behaviour. In the analysis of experimental data, a constantrate iris opening model is used to model to account for the influence of the diaphragmsboundary condition. This model introduces uncertainty into the predictive models as itdoes not account for the variability of opening rate, opening dynamics and tends to relyapproximations of total opening time.
The purpose of this study is to improve the understanding and the ability to predictthis boundary condition to facilitate the generation of more accurate models of impulsefacility flows and in turn a higher degree of confidence in measured results used to quantifyexperimental results.
An experimental study was carried out on the three (3) metre long Drummond ShockTube using 0.6mm thick, 5 series aluminium diaphragms. The rupture dynamics of scored,pierced and pressure burst diaphragms were filmed with three (3) high speed cameras andanalysis of the data was conducted in Adobe Photoshop and Illustrator.
By comparing the results of the study to that observed in larger impulse facilities, aconceptual model which relates the resistance of the diaphragm to deformation may berelated to the driving force from the facility to predict rupture behaviour. The next stepsare to develop the pre-rupture finite element model (FEM) and to extend that to includesimulations of diaphragm fracture with a vision to integrate this FEM into a ComputationalFluid Dynamics (CFD) package where the dynamic deforming model may be used in thepredictive models.
Nomenclature
R.T Rupture TimeK Experimental Rupture Coefficientρ material density
∗Mechanical and Aerospace Engineering Student ,The University of Queensland,St. Lucia, AIAA Student Member.†Supervisor to Research Project,Centre for Hypersonics, The University of Queensland,Australia‡Laboratory Technician,Department of Mechanical Engineering, The University of Queensland, Australia
1 of 12
American Institute of Aeronautics and Astronautics
τ thicknessPR Pressure at RuptureI Inertiaθ angleM1 Applied momentM2 Resistive momenta Crack branch half gapb Radial crack x distance from wall to branchc Radial crack y distance from wall to branchA Area Opened
I. Introduction
The University of Queensland has invested extensively in it’s hypersonic research program and notably,research into SCRAMjet technology and re-entry vehicles. Numerical computational methods are used
to model and simulate what effect flight in supersonic and hypersonic regimes will have on a vehicle andconversely, what a vehicle must do to survive and perform optimally in such a regime. As is the case withall models, there is the need for verification through experimentation. In the field of hypersonic researchin Australia, this means ground testing facilities are required and for flight conditions, impulse facilities areused.
Figure 1. Barrel shock as represented byhickman 1 described as a simplification.
Impulse facilities generate a brief, high speed flow that isdirected over a model to simulate flow in hypersonic regime(Mach ≥ 5). There are several different types of impulse fa-cilities, but each configuration is based around a basic shocktunnel whereby a test gas is processed with a moving shockwavegenerated through the release of energy in a driver gas. Yet dueto the discrete nature of measurement devices, completely andreconstructing the behaviour in any Impulse facilities is notpossible so CFD simulations and analytical models of facilitiesare used to predict and reconstruct.
This report focuses on the behaviour of a single criticalcomponent found in Impulse facilities; the primary diaphragm.It influences shock formation distance, driver/driven gas mix-ing, vortices, acoustic noise and complex 3D shock structuresas demonstrated by White , Campbell et. al, Simpson et. al,Hickman et. al and Gooze et. al .3,4, 5, 1, 6 These disturbancecan also limit the operation of a facility by attenuating flow strength or vastly reducing flow uniformity 7
Diaphragm behaviours therefore must be simulated suitably to predict these flow characteristics in CFDmodels.
Current models of diaphragm opening used at the University of Queensland assume iris petal openingwith timing based on the Rothkopf and Low model ,8 essentially a generalised normalised curve of opening2. The model introduces uncertainty in predictive models of impulse facility behaviour as deviation fromthe stated assumptions will compound error due to the generalisation of the model.
The aim of this study is to better quantify and understand the rupture of metallic diaphragms in impulsefacilities to improve the predictive model. Eventually, this investigation is intended to improve this funda-mental boundary condition in numerical and analytical models of impulse facility flow processes which maybe used in designing new conditions or reconstructing test flows for unique tunnel and diaphragm configu-rations. This work will reduce one element of uncertainty. An experimental investigation of the behaviourof the primary diaphragm leading up to, and including, rupture was conducted in the Drummond reflectedshock tunnel that was modified to operate as a shock tunnel. Measurement of scored, pierced and over-pressure diaphragm rupture at various pressures has been conducted using high speed videography mountedexternally to the tube and an optical/illumination system that allowed for the observation of rupture in situ.
2 of 12
American Institute of Aeronautics and Astronautics
II. Background
Figure 2. Rothkopf and Low standardisedopening time of diaphragm compared withmeasured opening times. 2
Impulse facilities may be described as ”blast” (wind) tun-nels used for studying the influence of high speed and hightemperatures in hypersonic flight regimes .9,10 A simplifieddescription of the operation is that of an air cannon which isclosest to a shock tube; the pressure in a reservoir (drive tube)is built up then released rapidly from the through a barrel(shock tube) positioned down stream. Rather than acceleratea projectile, the gas down stream (test gas) is accelerated bythe driver gas and will flow through a test section betweenMach 3 to 30 where hypersonic flow phenomena may be testedand studied .11 The tunnels at the University of Queenslanduse diaphragm shock tubes whereby gas is compressed behinda diaphragm which acts as blowoff disc, releasing the highlycompressed gas when it ruptures. The University of Queens-land has four (4) impulse facilities. T4, a free piston reflected
shock tunnel, X3 and X2, both free piston expansion tubes and Drummond, a reflected shock tunnel .12
All have circular cross sections and are different lengths and diameters. The Drummond tunnel on whichthe experimentation is operated by pressurising a steel driver tube of fixed volume until the failure of thediaphragm. The X series and T4 tunnels use a free piston driver(s) that rapidly accelerates to 250 metresper second compressing and heating the driver gas .11,10 The X2 uses a compound piston setup whichexperiences peak accelerations of up to 3500g and deceleration of up to 14000g depending on conditions .8
These two methods of pre-rupture loading result in highly different loading conditions. The 3rd Volume ofthe Handbook on Shockwaves 7 provides information on the influence the configuation of the impulse facilitydownstream has on the gas.
Figure 3. Image of the Drummond Tunnel
A. Drummond Tunnel
Drummond has 3 metre long shock tube with an internal diametre of 62 mm. The steel driver is one metrelong and contains a pneumatic piercer. The diaphragm sits between the driver and shock tube and sealsthe ends of both tubes. Figure 3 shows the drummond tunnels configuration while figure 4 shows thediaphragm mounting surface on the driver and shock tube sides respectively. The reflected shock tunnelwas modified to be a shock tunnel through the replacement of the reflection structure and nozzle with astraight section at the end of the shocktube. This was done to facilitate the experimental observation ofrupture. As a result no seperation between the dumptank/test section and the shock tube existed in thissetup. Ordinarily the former is maintained near vaccuum pressure so that start up is rapid and the energyof the flow can be dissipated. The latter is maintained at a pressure to represent the atmosphere of a planet.
3 of 12
American Institute of Aeronautics and Astronautics
When the pressure differential across a diaphragm is sufficientthat the stress exceeds failure strength, the diaphragm will rup-ture. The greater the pressure differential between the pressurein the driver and shcok tube, the greater the shock speed 13
Prior to rupture, ductile metallic diaphragms deform and in-flate forming hemispherical profiles.
On Drummond this pre-rupture process occurs on a timescale on the order of a minute while in piston driven facilities itcan be between 10 milliseconds to 100 milliseconds dependingon the size and configuration of the facility .8 Figure 5 showsthe pressure trace ahead of a diaphragm during the criticalsection of a piston stroke. The peak is indicative of the timeof rupture while the brief spike ahead of this point representsthe significant loading time.
Figure 5. X2 diaphragm loading with the apexrepresenting rupture time and the sharp increaserepresenting significant loading time.
On the downstream side of the diaphragm, lower pres-sure test gas fills the chamber. In ordinary operation, thetest gas tube will be pumped down to between 16 kilo pas-cals and 35 kilo pascals The diaphragm responds to thepressure differential across it. Lower test gas pressuresresult in lower rupture pressures.
This following subsection details the models used tosimulate the behaviour of diaphragms. This section iswhere the research presented in this project is conducted.
C. Diaphragm rupture analytical and approxi-mate models
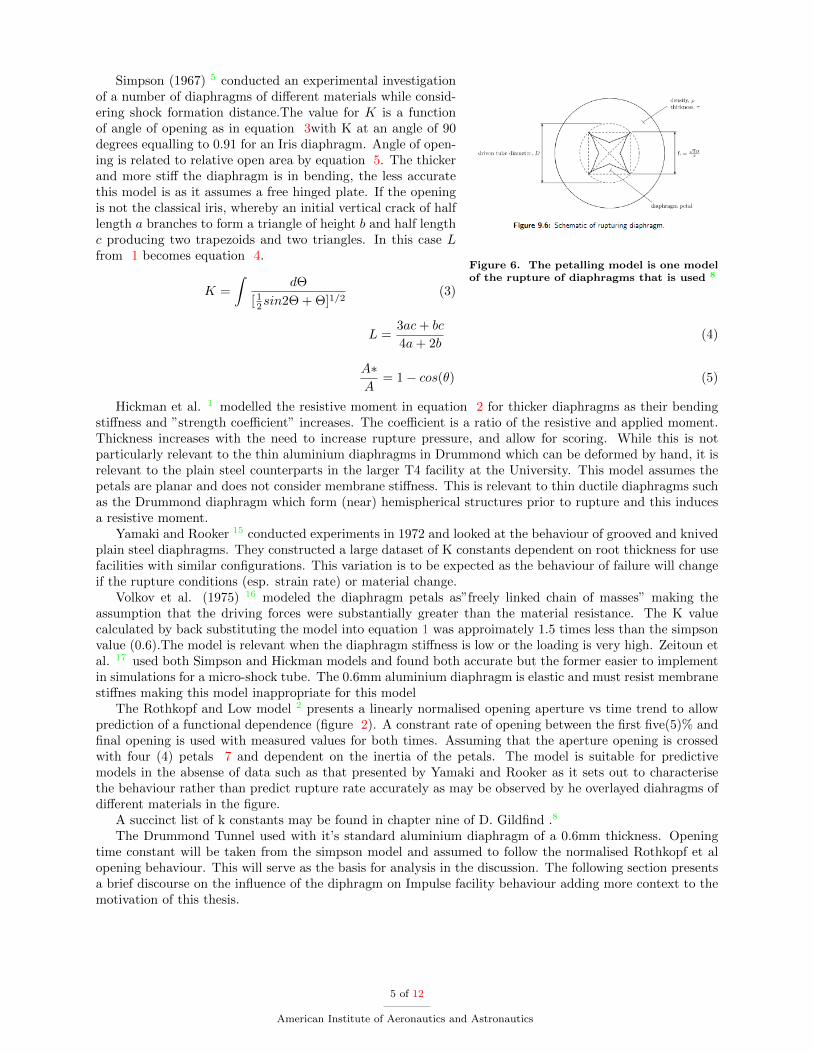
Over the past half century, multiple researchers havetaken different approaches to characterise and model di-aphragm rupture, opening time and interactions with theflow. The methods of rupture are overpressure or thoseinitiated by defects such as scoreline or perforations frompiercers or cuts from knife edges .14 A generalised rupture time equation was developed (equation 1) andis based on equation (2) which relates the inertia of an opening diaphragm petal to the resistive moment.Different researchers took different approaches to arrive at rupture coefficients however an iris opening styleis generally assumed (figure 6. In this profile, an initiating crack will form about the center of an inflateddiaphragm and propagate outward in a cross pattern forming 4 petals which will accelerate under pressureloading and fold back along the test tube wall .2
R.T = K(Lρτ
PR)
12 (1)
I ∗ d2θ
dt−M1 −M2 (2)
Roshko (1961) 14 observed diaphragm opening time for various specific materials and conditions using asharpened cross to initiate rupture. His research showed that very thin scribed diaphragms with thicknessdiameter ratios less that 0.1% may not fail along scribes. This introduces a degree of variation in overpressurerupture times and shapes. The Drummond tunnel diaphram is a 0.6 millimetre thick piece in a 62 millimetretube has a ratio of 1%, suggesting that expected not to rupture along score lines is probable.
Campbell (1964) 4 used an optical photography technique to measure the opening time and generated acharacteristic curve of the finite opening time for aluminium and copper diaphragms. Campbells researchshowed that the initial 20 % opening took around half the total opening time and that despite notching, thediaphragm burst unevenly.
4 of 12
American Institute of Aeronautics and Astronautics
Figure 6. The petalling model is one modelof the rupture of diaphragms that is used 8
Simpson (1967) 5 conducted an experimental investigationof a number of diaphragms of different materials while consid-ering shock formation distance.The value for K is a functionof angle of opening as in equation 3with K at an angle of 90degrees equalling to 0.91 for an Iris diaphragm. Angle of open-ing is related to relative open area by equation 5. The thickerand more stiff the diaphragm is in bending, the less accuratethis model is as it assumes a free hinged plate. If the openingis not the classical iris, whereby an initial vertical crack of halflength a branches to form a triangle of height b and half lengthc producing two trapezoids and two triangles. In this case Lfrom 1 becomes equation 4.
K =
∫dΘ
[ 12sin2Θ + Θ]1/2(3)
L =3ac+ bc
4a+ 2b(4)
A∗A
= 1 − cos(θ) (5)
Hickman et al. 1 modelled the resistive moment in equation 2 for thicker diaphragms as their bendingstiffness and ”strength coefficient” increases. The coefficient is a ratio of the resistive and applied moment.Thickness increases with the need to increase rupture pressure, and allow for scoring. While this is notparticularly relevant to the thin aluminium diaphragms in Drummond which can be deformed by hand, it isrelevant to the plain steel counterparts in the larger T4 facility at the University. This model assumes thepetals are planar and does not consider membrane stiffness. This is relevant to thin ductile diaphragms suchas the Drummond diaphragm which form (near) hemispherical structures prior to rupture and this inducesa resistive moment.
Yamaki and Rooker 15 conducted experiments in 1972 and looked at the behaviour of grooved and knivedplain steel diaphragms. They constructed a large dataset of K constants dependent on root thickness for usefacilities with similar configurations. This variation is to be expected as the behaviour of failure will changeif the rupture conditions (esp. strain rate) or material change.
Volkov et al. (1975) 16 modeled the diaphragm petals as”freely linked chain of masses” making theassumption that the driving forces were substantially greater than the material resistance. The K valuecalculated by back substituting the model into equation 1 was approimately 1.5 times less than the simpsonvalue (0.6).The model is relevant when the diaphragm stiffness is low or the loading is very high. Zeitoun etal. 17 used both Simpson and Hickman models and found both accurate but the former easier to implementin simulations for a micro-shock tube. The 0.6mm aluminium diaphragm is elastic and must resist membranestiffnes making this model inappropriate for this model
The Rothkopf and Low model 2 presents a linearly normalised opening aperture vs time trend to allowprediction of a functional dependence (figure 2). A constrant rate of opening between the first five(5)% andfinal opening is used with measured values for both times. Assuming that the aperture opening is crossedwith four (4) petals 7 and dependent on the inertia of the petals. The model is suitable for predictivemodels in the absense of data such as that presented by Yamaki and Rooker as it sets out to characterisethe behaviour rather than predict rupture rate accurately as may be observed by he overlayed diahragms ofdifferent materials in the figure.
A succinct list of k constants may be found in chapter nine of D. Gildfind .8
The Drummond Tunnel used with it’s standard aluminium diaphragm of a 0.6mm thickness. Openingtime constant will be taken from the simpson model and assumed to follow the normalised Rothkopf et alopening behaviour. This will serve as the basis for analysis in the discussion. The following section presentsa brief discourse on the influence of the diphragm on Impulse facility behaviour adding more context to themotivation of this thesis.
5 of 12
American Institute of Aeronautics and Astronautics
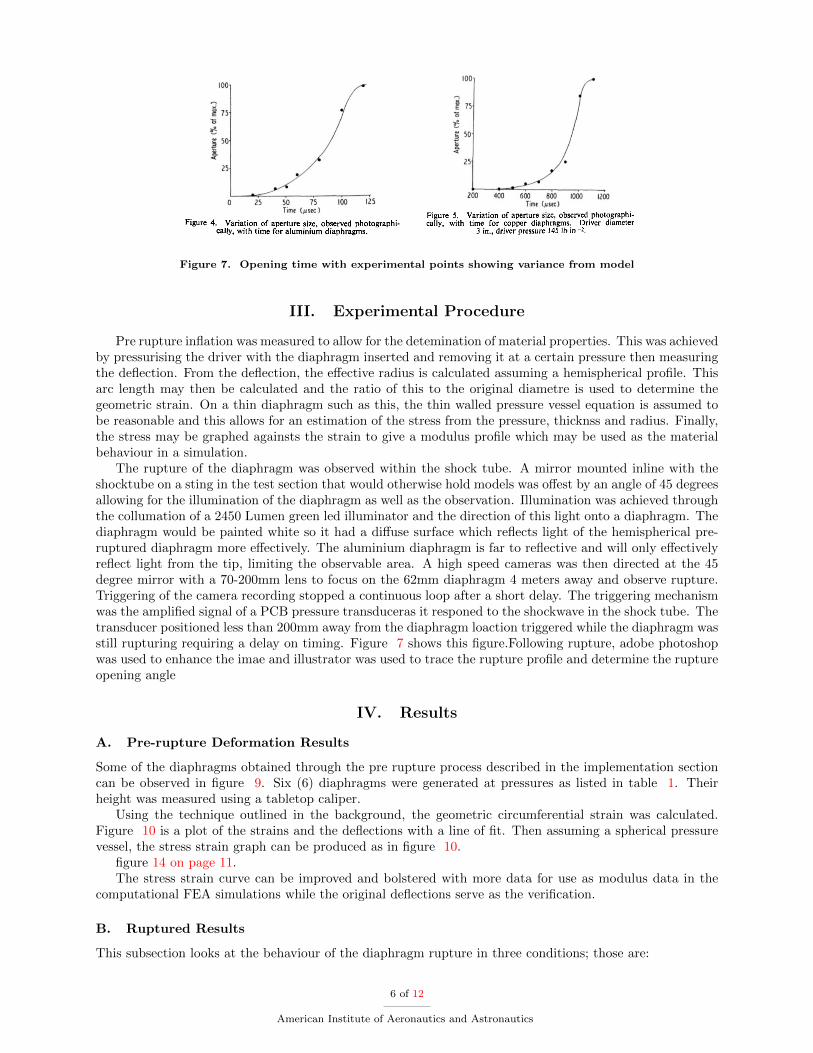
Figure 7. Opening time with experimental points showing variance from model
III. Experimental Procedure
Pre rupture inflation was measured to allow for the detemination of material properties. This was achievedby pressurising the driver with the diaphragm inserted and removing it at a certain pressure then measuringthe deflection. From the deflection, the effective radius is calculated assuming a hemispherical profile. Thisarc length may then be calculated and the ratio of this to the original diametre is used to determine thegeometric strain. On a thin diaphragm such as this, the thin walled pressure vessel equation is assumed tobe reasonable and this allows for an estimation of the stress from the pressure, thicknss and radius. Finally,the stress may be graphed againsts the strain to give a modulus profile which may be used as the materialbehaviour in a simulation.
The rupture of the diaphragm was observed within the shock tube. A mirror mounted inline with theshocktube on a sting in the test section that would otherwise hold models was offest by an angle of 45 degreesallowing for the illumination of the diaphragm as well as the observation. Illumination was achieved throughthe collumation of a 2450 Lumen green led illuminator and the direction of this light onto a diaphragm. Thediaphragm would be painted white so it had a diffuse surface which reflects light of the hemispherical pre-ruptured diaphragm more effectively. The aluminium diaphragm is far to reflective and will only effectivelyreflect light from the tip, limiting the observable area. A high speed cameras was then directed at the 45degree mirror with a 70-200mm lens to focus on the 62mm diaphragm 4 meters away and observe rupture.Triggering of the camera recording stopped a continuous loop after a short delay. The triggering mechanismwas the amplified signal of a PCB pressure transduceras it responed to the shockwave in the shock tube. Thetransducer positioned less than 200mm away from the diaphragm loaction triggered while the diaphragm wasstill rupturing requiring a delay on timing. Figure 7 shows this figure.Following rupture, adobe photoshopwas used to enhance the imae and illustrator was used to trace the rupture profile and determine the ruptureopening angle
IV. Results
A. Pre-rupture Deformation Results
Some of the diaphragms obtained through the pre rupture process described in the implementation sectioncan be observed in figure 9. Six (6) diaphragms were generated at pressures as listed in table 1. Theirheight was measured using a tabletop caliper.
Using the technique outlined in the background, the geometric circumferential strain was calculated.Figure 10 is a plot of the strains and the deflections with a line of fit. Then assuming a spherical pressurevessel, the stress strain graph can be produced as in figure 10.
figure 14 on page 11.The stress strain curve can be improved and bolstered with more data for use as modulus data in the
computational FEA simulations while the original deflections serve as the verification.
B. Ruptured Results
This subsection looks at the behaviour of the diaphragm rupture in three conditions; those are:
6 of 12
American Institute of Aeronautics and Astronautics
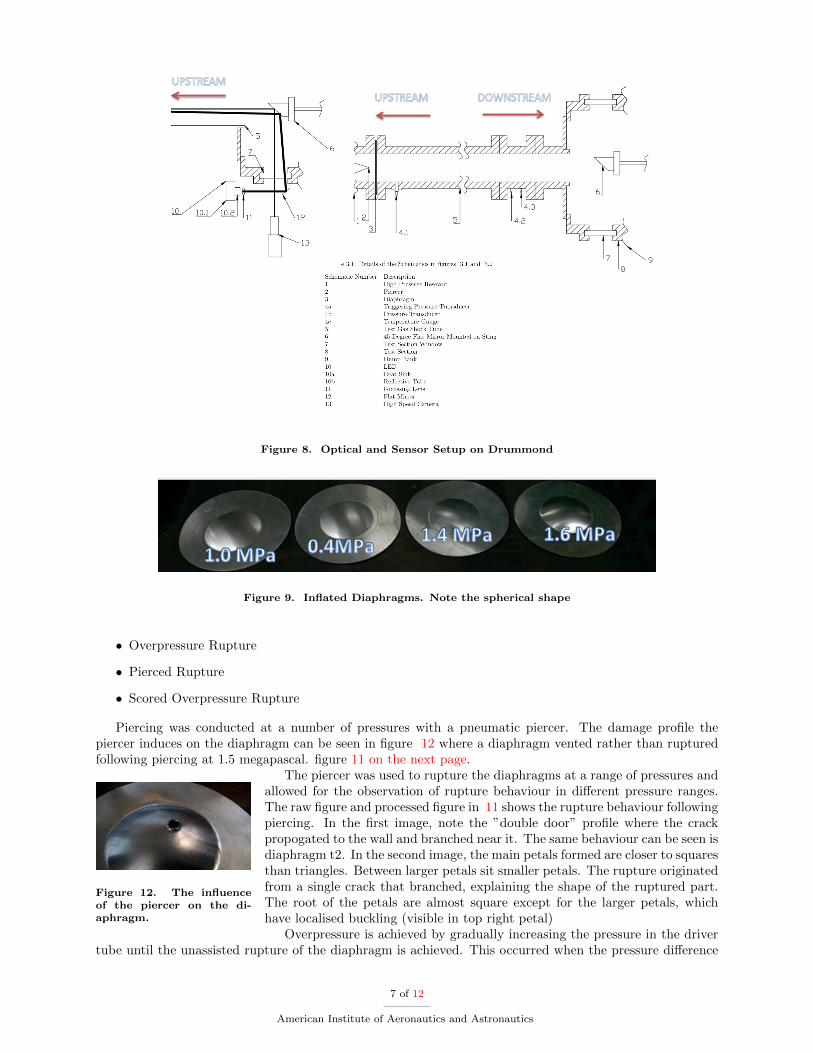
Figure 8. Optical and Sensor Setup on Drummond
Figure 9. Inflated Diaphragms. Note the spherical shape
• Overpressure Rupture
• Pierced Rupture
• Scored Overpressure Rupture
Piercing was conducted at a number of pressures with a pneumatic piercer. The damage profile thepiercer induces on the diaphragm can be seen in figure 12 where a diaphragm vented rather than rupturedfollowing piercing at 1.5 megapascal. figure 11 on the next page.
Figure 12. The influenceof the piercer on the di-aphragm.
The piercer was used to rupture the diaphragms at a range of pressures andallowed for the observation of rupture behaviour in different pressure ranges.The raw figure and processed figure in 11 shows the rupture behaviour followingpiercing. In the first image, note the ”double door” profile where the crackpropogated to the wall and branched near it. The same behaviour can be seen isdiaphragm t2. In the second image, the main petals formed are closer to squaresthan triangles. Between larger petals sit smaller petals. The rupture originatedfrom a single crack that branched, explaining the shape of the ruptured part.The root of the petals are almost square except for the larger petals, whichhave localised buckling (visible in top right petal)
Overpressure is achieved by gradually increasing the pressure in the drivertube until the unassisted rupture of the diaphragm is achieved. This occurred when the pressure difference
7 of 12
American Institute of Aeronautics and Astronautics
(a) strain and deflection graph (b) stress strain graph
Figure 10. Pre rupture graphs.
(a) Raw images from High Speed camera (b) Processed images from which the area ratio may be cal-culated
Figure 11. Diaphragm Rupture Captured with Phantom at 18000FPS
8 of 12
American Institute of Aeronautics and Astronautics
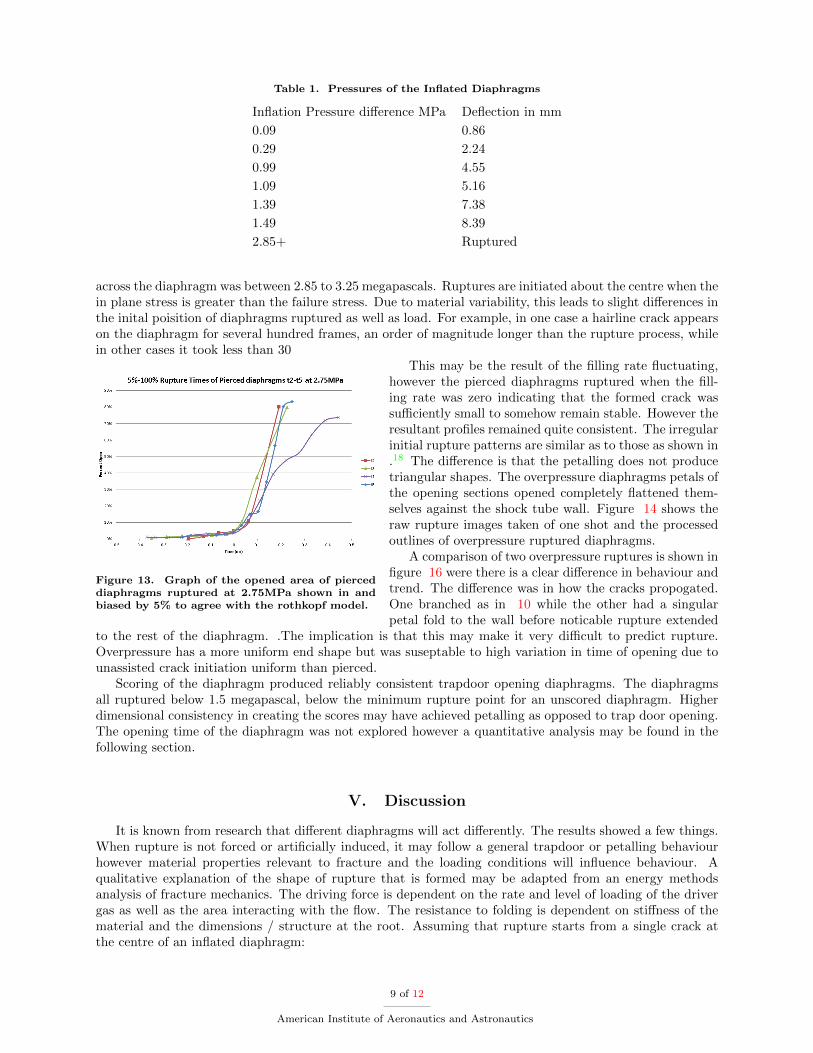
Table 1. Pressures of the Inflated Diaphragms
Inflation Pressure difference MPa Deflection in mm
0.09 0.86
0.29 2.24
0.99 4.55
1.09 5.16
1.39 7.38
1.49 8.39
2.85+ Ruptured
across the diaphragm was between 2.85 to 3.25 megapascals. Ruptures are initiated about the centre when thein plane stress is greater than the failure stress. Due to material variability, this leads to slight differences inthe inital poisition of diaphragms ruptured as well as load. For example, in one case a hairline crack appearson the diaphragm for several hundred frames, an order of magnitude longer than the rupture process, whilein other cases it took less than 30
Figure 13. Graph of the opened area of pierceddiaphragms ruptured at 2.75MPa shown in andbiased by 5% to agree with the rothkopf model.
This may be the result of the filling rate fluctuating,however the pierced diaphragms ruptured when the fill-ing rate was zero indicating that the formed crack wassufficiently small to somehow remain stable. However theresultant profiles remained quite consistent. The irregularinitial rupture patterns are similar as to those as shown in.18 The difference is that the petalling does not producetriangular shapes. The overpressure diaphragms petals ofthe opening sections opened completely flattened them-selves against the shock tube wall. Figure 14 shows theraw rupture images taken of one shot and the processedoutlines of overpressure ruptured diaphragms.
A comparison of two overpressure ruptures is shown infigure 16 were there is a clear difference in behaviour andtrend. The difference was in how the cracks propogated.One branched as in 10 while the other had a singularpetal fold to the wall before noticable rupture extended
to the rest of the diaphragm. .The implication is that this may make it very difficult to predict rupture.Overpressure has a more uniform end shape but was suseptable to high variation in time of opening due tounassisted crack initiation uniform than pierced.
Scoring of the diaphragm produced reliably consistent trapdoor opening diaphragms. The diaphragmsall ruptured below 1.5 megapascal, below the minimum rupture point for an unscored diaphragm. Higherdimensional consistency in creating the scores may have achieved petalling as opposed to trap door opening.The opening time of the diaphragm was not explored however a quantitative analysis may be found in thefollowing section.
V. Discussion
It is known from research that different diaphragms will act differently. The results showed a few things.When rupture is not forced or artificially induced, it may follow a general trapdoor or petalling behaviourhowever material properties relevant to fracture and the loading conditions will influence behaviour. Aqualitative explanation of the shape of rupture that is formed may be adapted from an energy methodsanalysis of fracture mechanics. The driving force is dependent on the rate and level of loading of the drivergas as well as the area interacting with the flow. The resistance to folding is dependent on stiffness of thematerial and the dimensions / structure at the root. Assuming that rupture starts from a single crack atthe centre of an inflated diaphragm:
9 of 12
American Institute of Aeronautics and Astronautics
Figure 15. Opened area of the diaphragm modelledwith the rothkopf model with the original simpsonmodel for opening in place
Figure 16. Opened area overpressure rupture di-aphragms
• trapdoor opening will occur as there is not enough energy to encourage complete removal of materialfrom the flow
• A high driving force relative to resistance will demand removal from the flow path. As the crack initallypropogates, it is effectively a large petal and due to the dimensions and shape is highly resistant tofolding to the wall of the shock tube is high.
– The petal can reduce in size by
∗ branches the crack to form rectangular and triangular peta
∗ The crack surfaces serve as the initiation point of new cracks resulting in more petals
– Even with more petals, high curvature at the base can introduce more strain. Relief is achievedby any of or a acombination of the following:
∗ Buckling about the root
∗ Circumferential tearing
∗ Formation of small petals near the base
Figure 14. Diaphragm Rupture Capturedwith Phantom at 24000 FPS at overpressureat 3.25MPA w/ 30KPa Back Pressure.
The diaphragm will rupture in the manner which relievesthe pressure effectively while requiring the lowest energy. Forexample, scored diaphragms offer a path of low resistance. Thindiaphragms such as the Drummond diaphragms are more likelyto buckle than thicker stronger equivalents such as the X2equivalents which will tear circumferentially. The formationof new crack surfaces is highly energy consuming so will likelyoccur with high loads applied.
This qualitative description of opening ties in appropriatelywith the opening time for the diaphragms. It was found thatwhat we have is quite accurate but precision is low as the be-haviour of diaphragms would differ. With artifical stress raisersmore predictability is achieved in the opening rate and dynam-ics. Thus acoustics can be better accounted for and are morelikely undesirable perturbations will be more predictable. Morepredictability will enable more accurate models to be devel-oped.
Future research should look at different scoring patternsand to adapt chemical engineering burst discs to the shocktube namely the selection of number of petals andthe use of alternative scoring outlines.
10 of 12
American Institute of Aeronautics and Astronautics
VI. Conclusion
The University of Queensland’s predictive models of impulse facilities use a simplified diaphragm openingmodel as a boundary condition. This model assumes a constant opening rate and an iris opening profiledesigned for use in the absence of more precise data. This thesis endeavored to quantify and better understandthe diaphragm rupture process in an effort to take the first steps in reducing uncertainty introduced by anapproximate model.
To achieve this goal, experiments were conducted where the rupture of diaphragms was measured usinga high speed camera in the Drummond shock tunnel. Scored, pierced and overpressure ruptured Aluminiumdiaphragms at pressure differentials of 1.4 mega pascals, 2.75 to 3.25 megapascal and greater than 3.25megapascal respectively was observed.
The observations carried out were on low pressure and strain rate loading conditions relative to largerfacilities ruptured at the University of Queensland. This allowed for the observation of the behavior changefrom trap door at low pressures to iris opening at high. Only scored diaphragms were consistent in theirbehaviour as a path for the initiation of the crack is provided. Pierced diaphragm rupturing at the samepressure would present composite ruptures of trapdoor and iris opening diaphragms, i.e double door opening.This behaviour of the diaphragm petals or door after initiation is related to the diaphragm’s resistance toremoval as a flow obstruction indluding its inertia and resitive moment and the load applied by the flow onthe diaphragm A stiffer diaphragm resists this force more intensely where stiffness is dependent on shape,thickness and material properties. The dynamics of opening of is influenced by the governed by the drive torelieve the stress as effectively as possible with the least expenditure of energy.
When a diaphragm ruptures initially, a single crack will appear at the center of the diaphragm. If there isiris scoring present and the driving force is sufficient, the cracks will propagate along the scores. Otherwise acrack may branch or form new cracks on the crack face creating petals. Creating crack faces expends energyand so the load must be high relative to material resistance for new surfaces to form. As the crack reachesthe walls of the diaphragm, its root curvature will give it an amount of membrane stiffness and the largerthe petal, the more stiffness it will have. To relieve the pressure, the root will fold to the wall, tear along itsboundaries reducing the membrane stiffness resistance or buckle and crumple to fold to the wall. If the loadis low, incomplete rupture can occur as the created hole provides sufficient pressure relief for the driver gas.
Despite this general rupture process, there was still variation in how the unique diaphragm behavedleading to variation in opening time Thus for the aim of reducing uncertainty using scored diaphragms isthe recommendation. Investigation of sealed slotted diaphragms such as those used in chemical engineeringapplications is also recommended as it provides an opportunity to even lower resistance diaphragms whilemaintaining rupture pressure for a given thickness
References
1Hickman, R. S., Farrar, L. C., and Kyser, J. B., “Behavior of burst diaphragms in shock tubes,” Physics of Fluids(1958-1988), Vol. 18, No. 10, 1975, pp. 1249–1252.
2Rothkopf, E. and Low, W., “Diaphragm opening process in shock tubes,” Physics of Fluids (1958-1988), Vol. 17, No. 6,1974, pp. 1169–1173.
3White, D. R., “Influence of diaphragm opening time on shock-tube flows,” Journal of Fluid Mechanics, Vol. 4, No. 6,1958, pp. 585–599.
4Campbell, G., Kimber, G., and Napier, D., “Bursting of diaphragms as related to the operation of shock tubes,” Journalof Scientific Instruments, Vol. 42, No. 6, 1965, pp. 381.
5Simpson, C., Chandler, T., and Bridgman, K., “Effect on shock trajectory of the opening time of diaphragms in a shocktube,” Physics of Fluids (1958-1988), Vol. 10, No. 9, 1967, pp. 1894–1896.
6Goozee, R. J., Jacobs, P. A., and Buttsworth, D. R., “Simulation of a complete reflected shock tunnel showing a vortexmechanism for flow contamination,” Shock waves, Vol. 15, No. 3-4, 2006, pp. 165–176.
7Ben-Dor, G., Igra, O., and Elperin, T., Handbook of Shock Waves, Three Volume Set , Elsevier Science, 2000.8Gildfind, D. E., Development of high total pressure scramjet flow conditions using the X2 expansion tube, Ph.D. thesis,
University of Queensland School of Mechanical and Mining Engineering, 2012.9Burn, R., “Shock Tubes and Shock Tunnels: Design and Experiments,” sep 2009.
10Gildfind, D. E., “Part 2: Hyper-sonic Ground Testing, Local surface inclination techniques and Viscous Hyper-sonicFlow,” Lecture Slides From MECH447.
11Stalker, R. J., “Modern developments in hypersonic wind tunnels,” Aeronautical journal , Vol. 110, No. 1103, 2006,pp. 21–40.
12of QLD, T. U., “Impulse Facilities,” 2015.
11 of 12
American Institute of Aeronautics and Astronautics
13Anderson, J., Modern Compressible Flow: With Historical Perspective, Aeronautical and Aerospace Engineering Series,McGraw-Hill Education, 2003.
14Roshko, A. and Baganoff, D., “A novel device for bursting shock-tube diaphragms,” Physics of Fluids, Vol. 4, No. 11,1961, pp. 1445–1446.
15Yamaki, Y., Rooker, J., Center, L. R., AERONAUTICS, N., and CENTER., S. A. L. S. V. L. R., Experimental Investi-gation of Circular, Flat, Grooved and Plain Steel Diaphragms Bursting Into a 30.5-centimeter-square Section, NASA technicalmemorandum, Defense Technical Information Center, 1972.
16Volkov, V., Parmon, V., and Tkachenko, B., “Process of opening of an inelastic diaphragm in a shock tube,” Journal ofApplied Mechanics and Technical Physics, Vol. 18, No. 4, 1977, pp. 506–509.
17Zeitoun, D. E. and Burtschell, Y., “NavierStokes Computations in Micro Shock Tubes,” Shock Waves, Vol. 15, No. 3,2006, pp. 241–246.
18Gaetani, P., Guardone, A., and Persico, G., “Shock tube flows past partially opened diaphragms,” Journal of FluidMechanics, Vol. 602, 2008, pp. 267–286.
12 of 12
American Institute of Aeronautics and Astronautics