IN-SITU LASER SPECTROSCOPY OF CO, CH 4 , AND H 2 O IN A PARTICLE LADEN LABORATORY-SCALE FLUIDIZED BED COMBUSTOR by Maximilian LACKNER, Gerhard TOTSCHNIG, Gerhard LOEFFLER, Hermann HOFBAUER, and Franz WINTER Original scientific paper UDC: 662.6/.9:544.45–912 BIBLID: 0354–9836, 6 (2002), 2, 13–27 The pyrolysis, devolatilization and char combustion of bituminous coal and biomass (beechwood, firwood) were investigated in a laboratory-scale fluidized bed combustor by tunable diode laser spectroscopy. Individual fuel particles were suspended in the freeboard of the unit. The bed temperature was 800 °C, the oxygen partial pressure 0 to 20 kPa (0-10 vol.%). Two Fabry Perot type tunable near infrared diode lasers were deployed for quantitative in-situ species concentration measurements. CH 4 and CO were measured simultaneously during devolatilization and char combustion in-situ 10 mm above the surface of the fuel particles as well as H 2 O using laser spectroscopy. Sand particles were passing the probing laser beam path. Besides the resonant absorption of the laser light by CO, CH 4 and H 2 O, severe and strongly transient non-resonant attenuation by partial blocking of the beam and beam steering effects occurred. By wavelength tuning the two laser sources, species concen- trations could be determined. The measured absorbances had to be corrected for the real temperature measured at the position of the probing laser beam. In addition, CO, CO 2 and O 2 were determined ex-situ by conventional methods. A spatial profile inside the FBC of major species (CH 4 , CO, CO 2 , O, H, OH) was calculated using a chemical kinetics program for a single fuel particle in a plug flow reactor geometry. The results were compared to the experimental findings. Good agreement was found. Tunable diode laser spectroscopy was found to be an apt method of determin- ing quantitative species concentrations of multiple gases in a high temperature multi phase environment. Key words: coal, biomass, in-situ laser spectroscopy, tunable diode laser, concentration measurements, devolatilization, pyrolysis, char combustion, carbon monoxide, methane, water, modeling Introduction Combustion of coal and, to a lesser extent, biomass, contributes strongly to the production of thermal and electrical power, a status which is not likely to change in the near future. Among the array of methods for advanced (coal) combustion, that is 13
Transcript
IN-SITU LASER SPECTROSCOPY OF CO, CH4, AND H2O IN A
PARTICLE LADEN LABORATORY-SCALE FLUIDIZED BED
COMBUSTOR
by
Maximilian LACKNER, Gerhard TOTSCHNIG, Gerhard LOEFFLER,Hermann HOFBAUER, and Franz WINTER
Original scientific paperUDC: 662.6/.9:544.45–912
BIBLID: 0354–9836, 6 (2002), 2, 13–27
The py rol y sis, devolatilization and char com bus tion of bi tu mi nous coal andbio mass (beechwood, firwood) were in ves ti gated in a lab o ra tory-scalefluidized bed combustor by tun able di ode la ser spec tros copy. In di vid ual fuel par ti cles were sus pended in the free board of the unit. The bedtem per a ture was 800 °C, the ox y gen par tial pres sure 0 to 20 kPa (0-10 vol.%).Two Fabry Perot type tun able near in fra red di ode la sers were de ployed forquan ti ta tive in-situ spe cies con cen tra tion mea sure ments.CH4 and CO were mea sured si mul ta neously dur ing devolatilization and charcom bus tion in-situ 10 mm above the sur face of the fuel par ti cles as well asH2O us ing la ser spec tros copy.Sand par ti cles were pass ing the prob ing la ser beam path. Be sides the res o nantab sorp tion of the la ser light by CO, CH4 and H2O, se vere and strongly tran sient non-resonant at ten u a tion by par tial block ing of the beam and beam steer ingef fects oc curred. By wave length tun ing the two la ser sources, spe cies con cen -tra tions could be de ter mined. The mea sured absorbances had to be cor rectedfor the real tem per a ture mea sured at the po si tion of the prob ing la ser beam. Inad di tion, CO, CO2 and O2 were de ter mined ex-situ by con ven tional meth ods.A spa tial pro file in side the FBC of ma jor spe cies (CH4, CO, CO2, O, H, OH)was cal cu lated us ing a chem i cal ki net ics pro gram for a sin gle fuel par ti cle in aplug flow re ac tor ge om e try. The re sults were com pared to the ex per i men talfind ings. Good agree ment was found.Tun able di ode la ser spec tros copy was found to be an apt method of de ter min -ing quan ti ta tive spe cies con cen tra tions of mul ti ple gases in a high tem per a turemulti phase en vi ron ment.
Combustion of coal and, to a lesser extent, biomass, contributes strongly to theproduction of thermal and electrical power, a status which is not likely to change in thenear future. Among the array of methods for advanced (coal) combustion, that is
13
low-cost at the least environmental impact, gasification •1• and fluidized bed combustion (FBC) •2• are two leading techniques.
This paper focuses on the latter.The fluidized bed technology has gained wide acceptance in many fields of
applications, e. g. catalytic cracking or mineral processing.The appropriation of a nearly isothermal environment with high heat transfer
efficiency to submerged objects and the fluid-like behavior which facilitates the mixingand handling of solids can also be exploited for combustion applications. A detailedassessment of criteria for and against fluidized bed firing is given in •3•.
A fluidized bed combustor (FBC), pressurized or circulating, represents a
multi-phase, hostile environment. Elevated pressures, high temperatures and soot, ash
and bed material particles present in the gas flow all pose severe problems for
experimental investigations. Yet it is interesting to gather process parameters either for
optimizing the performance or for controlling the process online •4•. Conventional
techniques often use intrusive suction probes for species concentration determinations.In this publication, the authors deploy in-situ tunable diode laser spectroscopy
to measure species concentrations directly in a laboratory fluidized bed combustor.Two lasers are used to quantitatively determine the concentrations of carbon
monoxide (CO), methane (CH4) and water (H2O) formed during pyrolysis, devolatiliza-tion and char combustion of a single fuel particle suspended in a laboratory-scalefluidized bed combustor.
Theory
Absorption spectroscopy is an established technique that is used to obtain
information on species concentrations right at the spot. The major advantages of in-situ
measurements are their supreme timeliness and the fact that sampling errors that are
likely with conventional methods are avoided. Optical methods like absorption
spectroscopy are intrinsically non-intrusive, which means that they do not influence the
system under investigation. This is especially relevant for instable species such as
radicals.Absorption spectroscopy is based on Lambert Beer’s law. Essentially, it states
that the number density (concentration times path length) of an absorbing species can be related to the attenuation of a light beam sent through the sample volume. Theabsorbance A is defined as A = ln(I0/I) with I0 being the initial light intensity (beforepassing the sample volume) and I the transmitted (attenuated) light intensity, the ratioI/I0 is also known as the transmittance T.
Absorption spectroscopy delivers path averaged results, which is not necessarily a disadvantage, since one is often interested in the overall performance of a combustordevice.
For a fixed wavelength, Lambert Beer’s law works as long as there are nointerferences.
14
THERMAL SCIENCE: Vol. 6 (2002), No. 2, pp. 13-27
Imagine now solid particles passing the beam path as in an FBC. Part of thelight attenuation comes from resonant absorption by the investigated species, however,another part of the initial light intensity is blocked or scattered by the solid particles. Thetwo effects cannot be discerned, and if the latter is neglected, too high an absorbance and hence too high a concentration of the absorber will be assumed.
This obstacle can be overcome by using a tunable light source, for instance atunable diode laser.
The implications of a measurement deloying a tunable light source isschematically depicted in Fig. 1.
The absorbance is not only determined at the center wavelength resulting froma transition, that is where the absorption coefficient is strongest, but also in the wings ofthe absorption feature. Usually, the absorbance is determined for the whole absorptionfeature well into the left and right adjacent areas of the absorption peak where noabsorption occurs.
By doing so, resonant absorption can be discerned from non-resonant effects.As for diode lasers, the wavelength can be tuned by changing the injection
current. As the injection current is raised, the wavelength shifts to higher values, too.Since the output power also increases with injection current, the baseline will be tiltedupwards. In Fig. 1(a), one can see the baseline I and the transmitted signal I0 (the curvewith the absorption ”dip” or peak) for the undisturbed case (grey lines). Undisturbedmeans that only the laser light hits the photodetector with its full energy.
15
Lackner, M., et. al.: In-situ Laser Spectroscopy of CO, CH4, and H2O in ...
Figure 1. Theory of tunable diode laser absorption spectroscopy (TDLAS)applied to hostile (combustion) systems. (a) schematically shows how
interferences can be dealt with by tuning the wavelength. (b) illustrates howthe transmission of a laser beam through a flame fluctuates with time
The black lines depict the same baseline I0 and transmitted signal I for adisturbed case.
First, as one can see, the whole signal has got an offset now. This offset mightresult from emissions of a flame also falling onto the detector system. Second, the height of the curves has receded. This decline in transmission might result from partial blocking of the beam (solid particles passing the beam path) or beam steering effects. Refractiveindex gradients caused, for instance, by flames in the sample volume will act as a lens and hence deflect the laser beam off the detector system. Since one deals with transientprocesses, the offset and the transmission will show a strong and uncorrelateddependence on time.
In Fig. 1(b), the transmission of the laser beam through a 100 mm long flame(stoichiometric, premixed methane/air mixture at 200 °C and 30 bar) is shown. Theabsorbance could be determined with as little as 3% total transmission.
Let us return to Fig. 1(a). When the absorbance A is determined as A = ln(I0/I)for the disturbed and the undisturbed case, the same value will be obtained in thisexample. I0 and I experience the same effects (non-resonant attenuation and offset bylight, e. g. a flame), hence the effects is compensated (calculation of the ratio I0/I).Compared to the absorption by a target species which occurs at a specific wavelength,the effects of non-resonant attenuation and offset do not show a marked dependence onthe wavelength, at least not within the narrow tuning range of a diode laser.
In a first approximation, the new baseline (that is for the disturbed case) can bedetermined mathematically by linear transformation y = kx + d (k for beam steering and beam blocking, d for the offset, with y being I0, disturbed and x being I0, undisturbed).
When the laser wavelength is tuned over the absorption peak of the targetspecies faster than the time scale on that the experimental noise occurs, the investigatedsystem seemingly comes to a standstill and can be probed by this method, which is alsoknown as tunable diode laser absorption spectroscopy (TDLAS). Details on rapidtuning to probe (combustion) systems with strongly transient behavior can be found in[5].
16
THERMAL SCIENCE: Vol. 6 (2002), No. 2, pp. 13-27
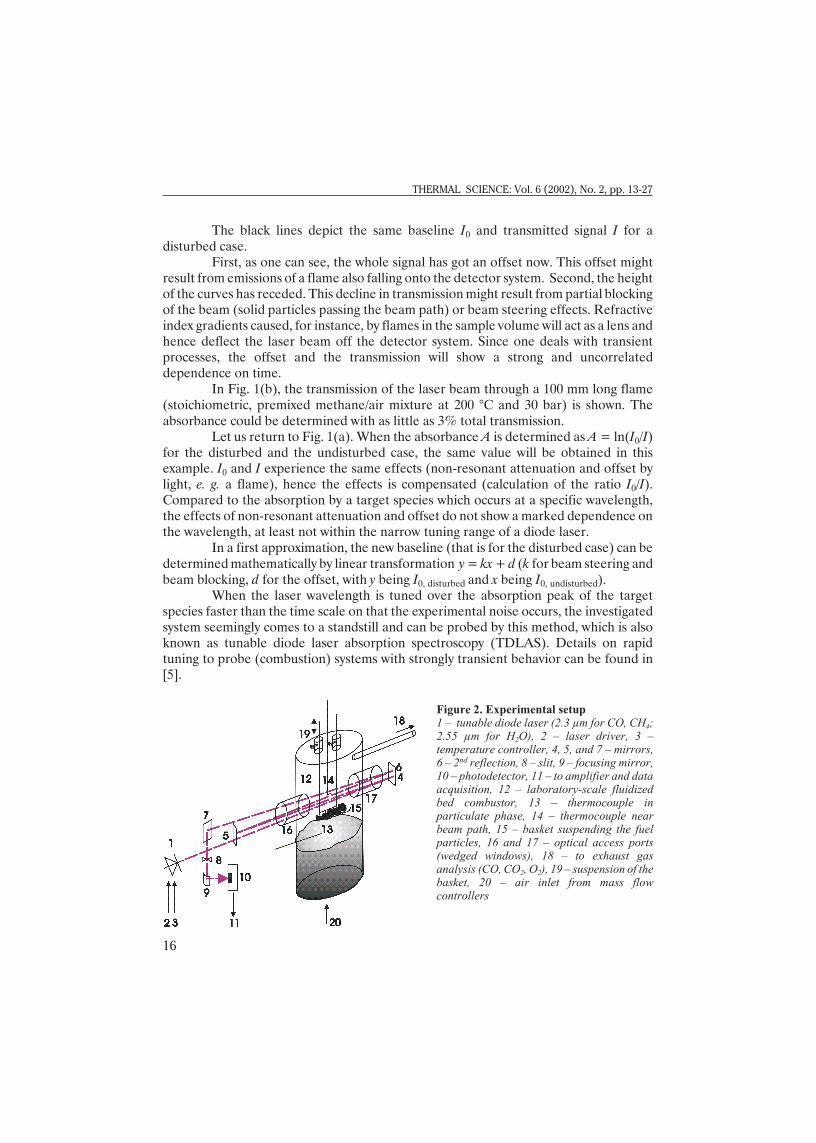
Fig ure 2. Ex per i men tal setup1 – tun able di ode la ser (2.3 µm for CO, CH4;2.55 µm for H2O), 2 – la ser driver, 3 –tem per a ture con trol ler, 4, 5, and 7 – mir rors,6 – 2nd re flec tion, 8 – slit, 9 – fo cus ing mir ror,10 – photodetector, 11 – to am pli fier and data ac qui si tion, 12 – lab o ra tory-scale fluidizedbed combustor, 13 – ther mo cou ple inpar tic u late phase, 14 – ther mo cou ple nearbeam path, 15 – bas ket sus pend ing the fuelpar ti cles, 16 and 17 – op ti cal ac cess ports(wedged win dows), 18 – to ex haust gasanal y sis (CO, CO2, O2), 19 – sus pen sion of the bas ket, 20 – air in let from mass flowcon trol lers
Experimental
Laboratory-scale fluidized bed combustor (FBC)
In this study, carbon conversion of biomass and coal was investigated by in-situlaser spectroscopy of major species (CO, CH4 and H2O) in a laboratory-scale fluidizedbed combustor (see [6] for details on the unit).
Figure 2 schematically shows the FBC and the experimental setup around it.Korean bituminous coal was used alongside beech wood (a typical hard wood)
and fir wood (a typical softwood representative) in the test runs (see Table 1 for analysisof the composition).
Table 1. Proximate and ultimate analysis of the fuels
Beech wood Fir wood Bituminous coal
Proximate analysis
Volatile matter [wt.%] 80.7 80.8 30.6
Moisture [wt.%] 6.8 6.8 1.6
Ash content [wt.%] 0.4 0.2 15.2
Fixed carbon [wt.%] 12.1 12.1 52.6
Ultimate analysis (water, ash free)
Carbon [wt.%] 46.4 45.7 66.0
Hydrogen [wt.%] 6.3 6.3 4.1
Nitrogen [wt.%] 0.0 0.0 1.3
Oxygen [wt.%] by diff. 47.3 48.0 28.6
The FBC essentially consists of an upright tube made of refractory steel (68 mm inner diameter, 380 mm height) sealed by a lid on the top. The unit can be electricallyheated from room temperature to approximately 1100 °C. The bed material was quartzsand (315-400 mm). The gas coming from two mass flow controllers, one for air, the other for nitrogen, entered the FBC from the bottom through a porous frit. The flow rate was20.0 l/min. (STP), which results in a superficial velocity of 331 mm/s at 800 °C(uncertainty 0.2 mm /s). The superficial velocity is defined as the velocity of the gases inthe FBC and was obtained by dividing the flow by the diameter of the reactor. Theexhaust gas exists laterally 75 mm below the lid. The lid contains two rods that protrudeinwards towards the bottom of the FBC. A basket made of wire to hold fuel particles isattached to the two rods. It can be adjusted in its height. The lid, the two rods and thebasket are firmly attached to each other and can be taken off the FBC easily. The basketis placed in the freeboard section of the FBC in the middle of the steel tubeapproximately 110 mm from the top lid. Since the experiments were conducted in the
17
Lackner, M., et. al.: In-situ Laser Spectroscopy of CO, CH4, and H2O in ...
freeboard, the bed height is not relevant and was thus not determined. Basically, asimple tube with a heated gas stream could also have been used to provide ahomogeneous temperature environment (decoupling of temperature and combustion).At the height of this basket, the unit has got two windows. A thin NiCrNi thermocouple(type K) is attached to the basket above the position of the particle. Another, thickerNiCrNi thermocouple (type K) is placed in the particulate phase of the FBC to regulatethe temperature. The time response of the upper thermocouple was determined as 2-3 s.The heat-up of the particles themselves was delayed by 19 s (at 800 °C) because ofcooling effects by the metallic parts holding the particle.
The laser beam of the probing laser is sent through the two windows into theFBC 10 mm above the particle under investigation lying in the basket. The distance wasmeasured from the surface of the fuel particles to the laser beam. Altogether, theprobing laser beam passes the sample volume four times (total path length 4·68 mm ~~280 mm).
The four beams were aligned horizontally with the least lateral distancepossible. The maximum beam diameter was determined to be approximately 3 mm.Since the aperture of the detector was smaller than the beam diameter and since a tightiris was used in order to prevent the photodetector from being saturated by the infraredemission of the flame and the heated FBC walls, the probed volume was smaller than itwould result from the beam diameter.
The swelling behavior of the samples and the fact that the fuel regresses withtime were considered to be of minor importance here so that a constant distance of thelaser beam to the surface could be assumed.
The lasers are used to determine the concentrations of CO, CH4 and H2Oabove the fuel particles during pyrolysis, devolatilization and char combustion. Thetemperature above the particle is also recorded. CO, CO2, and O2 are determined ex-situby conventional techniques (non-dispersive infrared analyzer and a paramagneticmethod, respectively).
For each experiment, a fuel sample (1.0 g of coal, approximately 4 chucks,aligned in a row, and 0.5 g of biomass in the shape of a cylindrical stick, respectively) wasplaced on the basket outside the FBC and attached by a thin wire. The length of the fuelparticles was approximately 55 mm. Then the basket was inserted into the FBC to startthe measurement. The alignment of the fuel particle was parallel to the probing laserbeam. An InSb semiconductor detector was used in conjunction with a homemadeamplifier and a focusing mirror. An iris was used to reduce the emissions from the flame(leading to saturation of the detector). The detector signal was digitized on a personalcomputer using a 12 bit 125 MS/s data acquisition board.
A LabView™ program was written for data acquisition and processing. Theabsorbances for CO, CH4 and H2O were calculated online and converted intoconcentrations.
Laser measurement system
Two room temperature continuous wave InGaAsSb/AlGaAsSb quantum wellridge diode lasers were used. One of the lasers was 500 mm long and emitted at 2.55 mm
18
THERMAL SCIENCE: Vol. 6 (2002), No. 2, pp. 13-27
(H2O), the other one measured 250 mm in length and emitted at 2.3 mm (CO and CH4).The device is described in detail elsewhere (•7, 8•).
Diode lasers can be wavelength tuned in a narrow range by either varying theirtemperature (at constant current) or by varying their injection current (at constant laserheat sink temperature). Temperature tuning permits to access a broader wavelengthrange, but is comparatively slow. Current tuning, on the other hand, is fast, but tuningcannot be achieved very far. Therefore, the center wavelength of the laser is usuallymatched to the position of a suitable absorption line belonging to the absorbing speciesby choosing an appropriate temperatureof the laser, and wavelength tuning isachieved by current tuning.
This laser was operated at 16.0 °C.The current was tuned from 0-160 mA by a linearly increasing current ramp at 300Hz. As the current was linearly ramped,the laser wavelength shifted, in anapproximation, linearly too.
Figure 3 shows the characteristiccurve of the laser. The output power hasbeen plotted as a function of injectioncurrent. The first laser in this study is 250 mm long and emits at 2.3-2.35 mm. Thesecond laser is longer (500 mm) and startslasing at 2.55 mm and switches to 2.3 mmat higher injection currents.
1e-1hh is the notation for therecombination first electron to heavyhole transition in the quantum well,2e-2hh is the notation for anotherquantum state transition.
Within the tuning range of the 2.3 mmdiode laser, several absorption lines ofCO and CH4 could be observed. There-fore, it was possible to monitor twospecies simultaneously by using only onediode laser.
In Fig. 4 the two peaks that werechosen for CO and CH4 are shown.
Figure 5 shows the peak for thedetermination of H2O using the 2.55 mmdiode laser. One can see the transition of1e-1hh lasing action to 2e-2hh at about140 mA (compare Fig. 3). In fact, a double
19
Lackner, M., et. al.: In-situ Laser Spectroscopy of CO, CH4, and H2O in ...
Figure 3. Output power of the diode laseremitting at 2.3-2.35 µm to measure CO andCH4 and 2.55 µm for H2O as a function of
injection current. The wavelength increaseswith increasing injection current
Figure 4. Absorption peaks of CO and CH4
that were chosen for quantitative speciesconcentration measurements.
The laser wavelength was scannedaround 2.3 to 2.35 µm
These requirements have to be matched with the availability of diode lasers. It is therefore not possible to always use two or three standard wavelengths for
each species. The monitored transition depends on the problem and has to be chosenproperly. Only one laser was used at a time. By combing the two laser beams, thesimultaneous detection of all three species would have been possible. For sake ofsimplicity, however, this was not done within the scope of these measurements.
The absorbance A is proportional to the number density of the target molecule:A(l) = k(l)· l· c with l being the wavelength, k(l) the absorption coefficient, l the pathlength and c the concentration of the absorber.
The absorption coefficient is not a constant, but depends strongly on thetemperature. This dependence was determined experimentally for CO and CH4 bymeasuring the absorbance at a fixed concentration (10%) of the gas inside the FBC atdifferent temperatures ranging from 25 to 1100 °C. For the calibration of the H2O signalwith temperature, a heated quartz cell was sued.
The laser beam was sent through the FBC 10 mm above the coal. Duringdevolatilization and char combustion, the temperature of the air along the beam pathabove the coal will not equal the bed temperature. It was found to exceed the ambientbed temperature by up to 200 °C. Therefore, the temperature at the position of the laserbeam had to be determined and the measured absorbances corrected for thetemperature.
20
THERMAL SCIENCE: Vol. 6 (2002), No. 2, pp. 13-27
peak was used – Fig. 5(a). Thespectrum was recorded with 2.3% water vapor (background airhumid- ity of 75% at 26.1 °C) over apath length of 440 mm at 300 °C.The laser was ramped from 0 to 170mA. The insert (b) shows a fit(Voigt line shape function) for thetwo peaks. (c) gives the residual.
For the selection of a suitableabsorption peaks the following as-pects have to be considered:
· No mode hops of the diode laserat the wavelength of the transi-tion,
· Suitable strength of the absorptionline,
· No interference by other species,and
· Suitable and known temperaturedependence of the absorptionpeak.
Figure 5. (a) shows the double peak of H2O that wasused in the test runs for quantitative evaluation. One
can see where the laser switches. The insert (b)shows a fit (Lorentz) of the peak with the residual
being given in (c)
The two opposing windows through which the laser beam passed the FBC weremade of wedged fused silica. Wedged windows were preferred to plane parallel onesbecause they prevent the unwanted appearance of fringes due to optical interferences.These fringes, known as the etalon effect, are caused by multiple inadvertent reflectionsbetween parallel surfaces. They disturb sensitive absorption spectroscopicmeasurements •9•. In the exhaust duct, approximately 300 mm from the exit of the FBC,gas samples were continuously taken and analysed online for carbon monoxide (CO),carbon dioxide (CO2) and oxygen (O2). These ex-situ determinations were carried out inaddition to the in-situ measurements of H2O, CO and methane (CH4) by the laser. Aparamagnetic method was used for O2 (range 0-20 vol.%, absolute accuracy 0.1%), CO(range 0-6000 ppm, absolute accuracy 5 ppm), and CO2 (range 0-20 vol.%, absoluteaccuracy 0.1%), were determined by a non-dispersive infrared technique. The delayintroduced by the 7.5 m long plastic tube was 12 s. This delay was considered by shiftingand superimposing the timescales of the in-situ and ex-situ measurements correspondingly.
Results and discussion
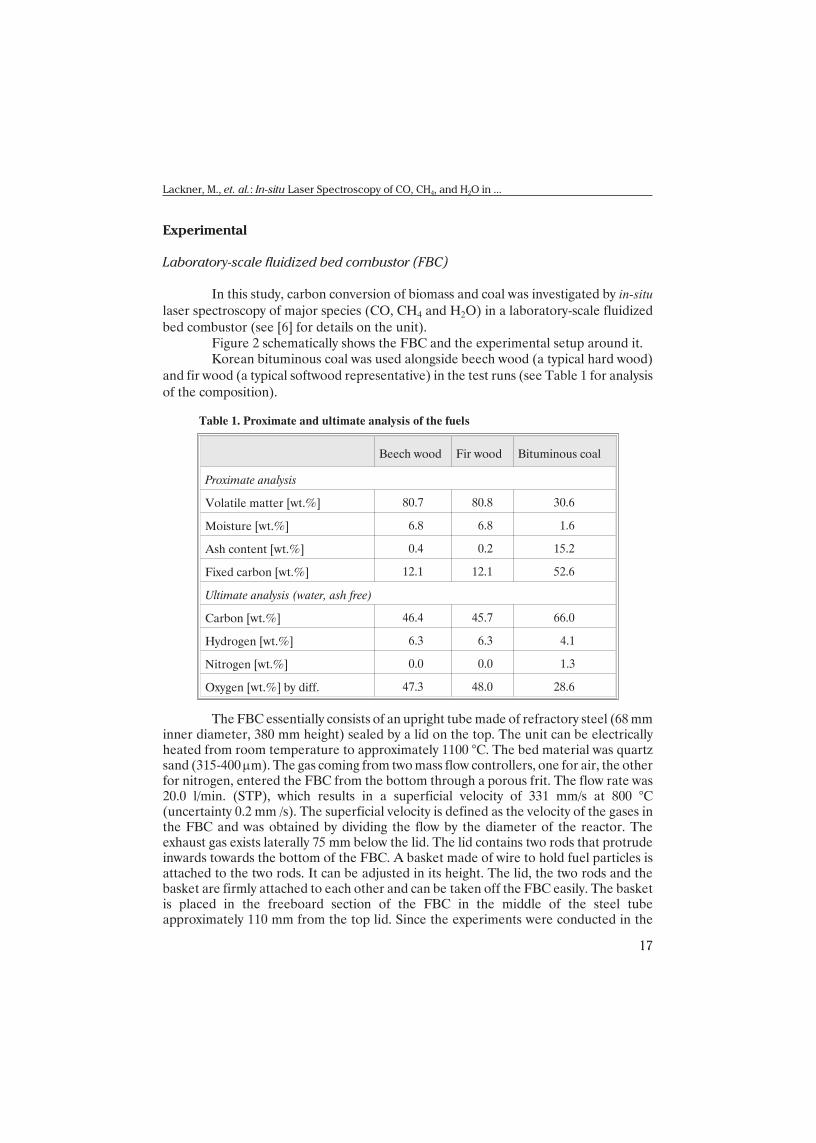
Measurements inside the fluidized bed combustor were repeated at least threetimes to check for the reproducibility of the results. The temperature profile over thefluidized bed combustor was studied prior to the experiments and found to behomogeneous. Tunable diode laser absorption spectroscopy is based on line-of-sightabsorption of targeted rovibrational transitions. The measurements present an averageof the concentration profile over the entire pathway. This fact does not constitute aproblem here, though, since ho-mogeneous conditions along thelaser beam path were ensured. The row of coal particles (four to fivepieces) was approximately 55 mm long and 10 mm wide. The sticks of beech wood (3 mm diameter)and fir wood (cross section 3 times5 mm²) were also 55 mm long.With an inner diameter of thefluidized bed combustor of 68 mmand the zone of volatile releasebeing approximately 10 times 55mm in cross section, the dilution ofthe species can be estimated to be1:7.
In Fig. 6(a), the temperatureabove the coal particles at theheight of the traversing laser beam(i. e. 10 mm above the coal) isshown.
21
Lackner, M., et. al.: In-situ Laser Spectroscopy of CO, CH4, and H2O in ...
Figure 6. Determination of the concentration fromthe raw absorbance data, depicted for CO. (a) showsthe temperature 10 mm above the burning particle atthe position of the laser beam. (b) gives the raw datain terms of the absorbance. In (c) the concentration
of CO is shown
The relatively slow rise of the temperature curve is due to cooling by the basketand the two supporting metallic rods. One can see that the flame temperature exceedsthe bed temperature by approximately 100 °C.
Figure 6 shows the data processing of a test run. In Fig. 6(a), the temperature abovethe particle is shown. In Fig. 6(b), the measured absorbance of CO has been plotted as afunction of time.
The insertion process (which itself takes 1-2 s) provides a comfortable means ofdetermining the start of the experiment. As the basket with the fuel sample traverses thelaser beam path shortly before reaching its final position, the absorbance goes up sharply (no transmission). Note the sharp ”peak” at t = 0. One can see that the absorbance isvery noisy.
Besides the resonant absorption of laser light at the wavelengths of themolecular transitions, the transmission through the FBC fluctuates strongly over time.The hot interior of the FBC produces blackbody radiation. According to Planck’s law,the peak intensity location at 800 °C is at 2.70 mm with the total intensity beingapproximately 24 kW/m². The response curve of the detector ranges from 1 to 10 mm.The fraction of radiation contained in this domain is approximately 0.93. The fraction ofradiation in the visible wavelength range (0.4 to 0.7 mm) is less 10–5. So a constant offset by the background radiation will be observed.
In addition, the emissions from the flame in the infrared region also fall ontothe detector.
These preceding two effects increase the light intensity.Several effects also reduce the transmission. Beam steering is the effect that
(temperature gradients that translate into) refractive index gradients act as a lens for theprobing laser beam and make it change its position. As a result, the laser light intensityhitting the detector will fluctuate. Also, solid particles passing the beam path will partlyobstruct the laser and reduce the transmission. Sand particles that reach the freeboardregion of the FBC where the experiments were conducted hence also cause fluctuationsof the transmission.
It was observed that during combustion, especially under reduced oxygenpartial pressures, that soot caused blocking of the windows. This layer of soot broughtthe transmission several times close to zero. The minimum in transmission coincideswith the maximum devolatilization rate. Subsequently, the slow burning of the soot inthe hot gas stream reconstituted the full transmission of the windows.
All these effects are non-correlated and cause the laser light intensity fallingonto the detector to vary vigorously.
As pointed out in the section on the theoretical background, the laser has totune over an entire absorption feature faster than the timescale on which experimentalnoise (flickering of the flame, sand particles passing the beam) occurs.
The reason why this approach works is that all major non-resonant effectsdescribed here do not show a strong dependence on the wavelength, but the absorptionpeaks do.
At scan rates of 300 Hz as set in these experiments, this requirement is simplynot fulfilled. Therefore, as the beam gets deflected from the detector or partially
22
THERMAL SCIENCE: Vol. 6 (2002), No. 2, pp. 13-27
blocked, an absorption value that is too high is obtained. However, by averaging the rawdata – Fig. 6(b), one gets a smooth curve – Fig. 6(c). In order to directly obtainquantitative results without the need for averaging, it is necessary to tune over theselected absorption feature(s) faster than the time scale of the fluctuations. In Fig. 2(b),the shortest spikes in the transmission are on the order of 1 ms.
They stem from beam steering effects and solid particles passing the beam path. By scanning the laser wavelength over the absorption line with repetition rates fasterthan 1000 Hz, the system seemingly comes to a standstill. All non-resonant effects onlymanifest themselves by a constant attenuation of the laser light plus an offset. Both caneasily be subtracted as shown above. A special type of tunable diode lasers, so-calledvertical-cavity surface emitting lasers (VCSELs), possesses the ability of extremely fastwavelength modulation. Modulation frequencies of up to 5 MHz and the application ofthese lasers to spectroscopy have been demonstrated •5•. Therefore, these devices areapt for probing extremely transient environments, for instance particle laden gas flows as encountered in this publication.
The concentration history of CO measured in-situ closely above the coal asdepicted in Fig. 6(c) has also been temperature corrected to display correct values.
Be fore devolatilization ended, flame ex tinc tion was ob served. The lower de tec -tion limit at 800 °C was de ter mined to be 0.2 vol.% (ap prox i mately 500 ppm·m) for COand CH4. It could have beenim proved by us ing a sen si tivede tec tion tech nique in steadof sim ple ab sorp tion spec tros -copy, the most com mon onesbe ing wave length mod u la tionspec tros copy (WMS) and fre -quency mod u la tion spec tros -copy (FMS) •10•. At lowertem per a tures ap proach ingroom tem per a ture, the de tec -tion limit im proves due to thefact that the in ten sity of these lected ab sorp tion linesrises.
Experimental findings
In Fig. 7(a) the con cen tra -tion his tory of wa ter va por 10mm above the fuel par ti cles(mea sured at 2.55 mm) isshown for all three fu els. InFig. 7(b) tests with beechwood (a 55 mm long cy lin dri -
23
Lackner, M., et. al.: In-situ Laser Spectroscopy of CO, CH4, and H2O in ...
Figure 7. Experimental data of a typical test run with the2.55 µm H2O laser (bed temperature 800 °C, oxygen partial pressure 10 kPa (10 vol.%), distance 10 mm.
(a) shows the H2O concentration histories of the differentfuels. The double peak might stem from drying and
subsequent water generation. (b) shows a fuel sample thatwas burned at once (solid curve) and pyrolized and
subsequently burned in oxygen (lowest curve, no doublepeak)
cal par ti cle, 3 mm di am e ter, mass 0.25 g) was used. The gas flow was 20.0 l/min at roomtem per a ture or 72.5 l/min at 800 °C in side the re ac tor. For the com bus tion test, pure airwas used, the ox y gen par tial pres sure be ing 20 kPa. For the pyrolyis test, an iden ti calsam ple was ex posed to a pure ni tro gen gas flow. Af ter 90 s, the gas flow was changed to10% ox y gen (also 20 l/min). This sub se quent com bus tion is shown by the third curve.There is no dou ble peak ob serv able. It can there fore be as sumed that the first peak in the com bus tion test stems from dry ing, whereas the sec ond re sults from chem i cal re ac tionform ing wa ter. In •11• the ef fect of dry ing, devola- tilization and char com bus tion was in -ves ti gated by intra-particle tem per a tures.
The lower detection limit at 800 °C was 0.02% for a path length of 0.28 m. Thiscorresponds to 50 ppm·m. Since the absorbance of the selected peak also decreases from room temperature to 800 °C, the detection limit at ambient conditions would also behigher.
Figure 8 shows concentration histories of CO (measured with the 2.3 mm diodelaser) for all fuels 10 mm above the particles. The bed temperature was 800 °C, theoxygen partial pressure 10 kPa, the gas flow 20.0 l/min. at room temperature. In contrastto the water vapor histories shown in Fig. 7(a), it is now easily possible to discerndevolatilization (the first, steep peak) from the subsequent char combustion phase.Since char combustion lasts much longer for the coal (750 s in contrast to less than 150 sfor the biomass fuels), an insert is shown for coal.
Turbulence was not considered in the evaluation of the experimental data,though the experiments were carried out in the wake region of the particles in the gasflow. Mixing effects lead to dilution and concentration peak broadening, but these factswere considered to be of minor importance here.
24
THERMAL SCIENCE: Vol. 6 (2002), No. 2, pp. 13-27
Figure 8. Experimental data of a typical test run with the 2.3 µmCH4 and CO laser (bed temperature 800 °C, oxygen partial
pressure 10 kPa (10 vol.%), distance 10 mm
Comparison of the laser measurements with calculations
In Fig. 9, the experimental results are compared with calculated values. For the calculations a modified version of a model for a single fuel particle
burning in a laboratory-scale fluidised bed •12• is used. Due to the easy implementationthe model of van den Bleek et al. •13• was modified. In this work only the reactionsongoing in the freeboard downstream the fuel particle are considered.
The freeboard is considered to be a plug flow reactor. The temperature profilewithin the freeboard is taken from measurements and given as input to the calculations.
During devolatilization and char combustion respectively the measured releaserates of carbon were applied for the model. All species were assumed to be releasedproportional to the carbon.
During char combustion it was assumed that the primary products are CO andH2O. Assuming an H/C ratio of 1 in the char, H2O was released proportional to thecarbon. This ratio was varied within a reasonable range of 0.5 to 2 without any significanteffect on the predicted emissions.
A limitation of the model is that it only works one-dimensionally. Gas flow thatpasses the fuel particles at the borders cannot be considered. Due to the chosendimensions, however, this can be neglected here.
Details on the modelling are given elsewhere •14•.
25
Lackner, M., et. al.: In-situ Laser Spectroscopy of CO, CH4, and H2O in ...
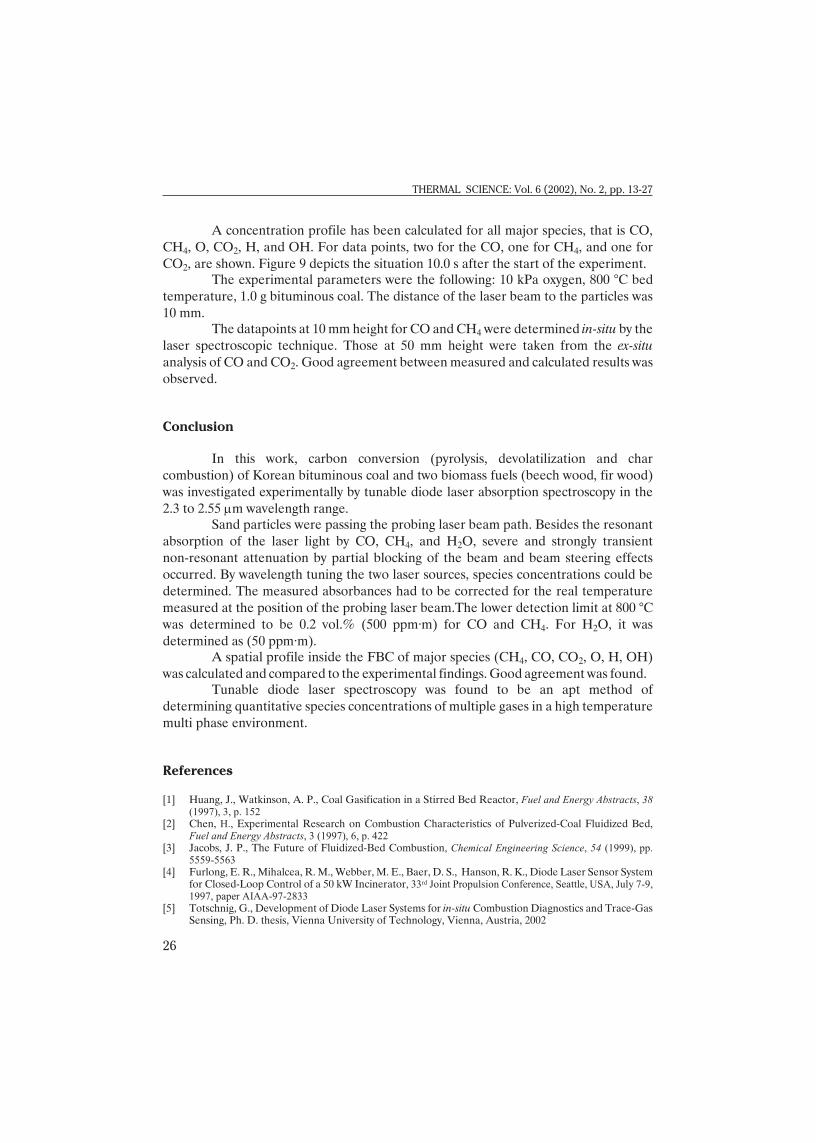
Figure 9. Comparison of experimental data on CO and CH4 withmodeling. The calculation of the spatial species distribution was
performed for t = 10 s after the insertion of the particle. Experimentalparameters: bed temperature 800 °C, oxygen partial pressure 10 kPa
(10 vol.%), distance 10 mm
A concentration profile has been calculated for all major species, that is CO,
CH4, O, CO2, H, and OH. For data points, two for the CO, one for CH4, and one for
CO2, are shown. Figure 9 depicts the situation 10.0 s after the start of the experiment. The experimental parameters were the following: 10 kPa oxygen, 800 °C bed
temperature, 1.0 g bituminous coal. The distance of the laser beam to the particles was
10 mm. The datapoints at 10 mm height for CO and CH4 were determined in-situ by the
laser spectroscopic technique. Those at 50 mm height were taken from the ex-situ
analysis of CO and CO2. Good agreement between measured and calculated results was
observed.
Conclusion
In this work, carbon conversion (pyrolysis, devolatilization and char
combustion) of Korean bituminous coal and two biomass fuels (beech wood, fir wood)
was investigated experimentally by tunable diode laser absorption spectroscopy in the
2.3 to 2.55 mm wavelength range.Sand particles were passing the probing laser beam path. Besides the resonant
absorption of the laser light by CO, CH4, and H2O, severe and strongly transient
non-resonant attenuation by partial blocking of the beam and beam steering effects
occurred. By wavelength tuning the two laser sources, species concentrations could be
determined. The measured absorbances had to be corrected for the real temperature
measured at the position of the probing laser beam.The lower detection limit at 800 °C
was determined to be 0.2 vol.% (500 ppm·m) for CO and CH4. For H2O, it was
determined as (50 ppm·m).A spatial profile inside the FBC of major species (CH4, CO, CO2, O, H, OH)
was calculated and compared to the experimental findings. Good agreement was found.Tunable diode laser spectroscopy was found to be an apt method of
determining quantitative species concentrations of multiple gases in a high temperature
multi phase environment.
References
[1] Huang, J., Watkinson, A. P., Coal Gasification in a Stirred Bed Reactor, Fuel and Energy Abstracts, 38(1997), 3, p. 152
[2] Chen, H., Experimental Research on Combustion Characteristics of Pulverized-Coal Fluidized Bed,Fuel and Energy Abstracts, 3 (1997), 6, p. 422
[3] Jacobs, J. P., The Future of Fluidized-Bed Combustion, Chemical Engineering Science, 54 (1999), pp.5559-5563
[4] Furlong, E. R., Mihalcea, R. M., Webber, M. E., Baer, D. S., Hanson, R. K., Diode Laser Sensor Systemfor Closed-Loop Control of a 50 kW Incinerator, 33rd Joint Propulsion Conference, Seattle, USA, July 7-9,1997, paper AIAA-97-2833
[5] Totschnig, G., Development of Diode Laser Systems for in-situ Combustion Diagnostics and Trace-GasSensing, Ph. D. thesis, Vienna University of Technology, Vienna, Austria, 2002
26
THERMAL SCIENCE: Vol. 6 (2002), No. 2, pp. 13-27
[6] Lackner, M., Totschnig, G., Winter, F., Maiorov, M. A., Garbuzov, D. Z., Connolly, J. C., In situ LaserMeasurements of CO and CH4 Close to the Surface of a Burning Single Fuel Particle, Meas. Sci. Technol.13 (2002), pp. 1545-1551
[7] Garbuzov, D., Menna, R., Maiorov, M., Lee, H., Khalfin, V., DiMarco, L., Capewell, D., Martinelli, R.,Gelenky, G., Connolly; J., 2.3-2.7 µm Room Temperature CW-Operation of InGaAsSb/AlGaAsSbBroad-Contact and Single-Mode Ridge-Waveguide SCH-QW Diode Lasers, Proceedings of SPIE (Society ofPhoto-Optical Instrumentation Engineers), 1999, Vol. 3628, pp. 124-129
[8] Donetsky, D. V., Westerfeld, D., Belenky, G. L., Martinelli, R. U., Garbuzov, D. Z., Connolly, J. C.,Extraordinarily Wide Optical Gain Spectrum in 2.2-2.5 µm In(Al)GaAsSb/GaSb Quantum-WellRidge-Waveguide Lasers, Journal of Applied Physics, 90 (2001), 8, pp. 4281-4283
[9] Wang, J., Maiorov, M., Jeffries, J. B., Garbuzov, D. Z., Connolly, J. C., Hanson, R. K., Remote Sensing of COin Vehicle Exhausts Using 2.3 µm Diode Lasers, Measurement Science and Technology, 11 (2000), pp.1576-1584
[10] Pavone, F. S., Inguscio, M., Simultaneous Detection of CO and CO2 Using a Semiconductor DFB Diode Laserat 1578 mm, Appl. Phys. B, 56 (1993), pp.118–122
[11] Winter, F., Prah, M. E., Hofbauer, H., Intra-Particle Temperatures under Fluidized Bed Combustor Conditions: the Effect of Drying, Devolatilization and Char Combustion, Combust. Flame, 108 (1997), pp. 302-314
[12] Löffler, G., Wartha, C., Winter, F., Hofbauer, H., NOx and N2O Formation Mechanisms – A Detailed ChemicalKinetic Modeling Study on a Single Fuel Particle in a Laboratory-Scale Fluidized Bed, J. Energy Res. Techn.,23 (2001), 3, pp. 228-235
[13] van den Bleek, C. M., Brem, G., Grubor, B., Johnsson, J. E., Jones, R. F., Langer, V., Verweyen, N., Documentation of the IEA-AFBC Model, Version 1.1, (Ed. G. Brem), TNO Apelddorn, The Netherlands, 1990
[14] Lackner, M., Loeffler, G., Totschnig, G., Winter, F., Hofbauer, H., Carbon Conversion of Solid Fuels inthe Freeboard of a Laboratory-Scale Fluidized Bed Combustor (FBC) – Application of in-situ LaserSpectroscopy, for submission in Fuel, 2002
Authors’ address:
M. Lackner, G. Totschnig, G. Loeffler,H. Hofbauer, F. WinterInstitute of Chemical EngineeringVienna University of TechnologyGetreidemarkt 9/166A-1060 Wien, Austria