In-Situ MVA of CO 2 Sequestration Using Smart Field Technology FE - 0001163 Shahab D. Mohaghegh Petroleum Engineering & Analytics Research Lab (PEARL) West Virginia University U.S. Department of Energy National Energy Technology Laboratory Carbon Storage R&D Project Review Meeting Developing the Technologies and Infrastructure for CCS August 20-22, 2013
Transcript
In-Situ MVA of CO2 Sequestration Using Smart
Field Technology FE - 0001163
Shahab D. Mohaghegh Petroleum Engineering & Analytics Research Lab (PEARL)
West Virginia University U.S. Department of Energy
National Energy Technology Laboratory Carbon Storage R&D Project Review Meeting
Developing the Technologies and Infrastructure for CCS August 20-22, 2013
2
Presentation Outline
• Introduction • Reservoir Simulation Model • Intelligent Leakage Detection System (ILDS) • Accomplishments • Summary
Objective • Develop an in-situ CO2 leak detection technology based on
the concept of Smart Fields. – Using real-time pressure data from permanent downhole gauges to
estimate the location and the rate of CO2 leakage.
CO2 Leakage(X,Y,Q) Artificial
Intelligence & Data Mining
Industrial Advisory Committee (IAC)
• Project goes through continuous peer-review by an Industrial Review Committee.
• Meetings:
– November 6th 2009 : • Conference call • Site selection criteria
– November 17th 2009: • A meeting during the Regional Carbon Sequestration Partnership Meeting in Pittsburgh • Selection of a suitable CO2 sequestration site
– November 18th 2011: • Reporting the modeling process to IAC
– February 16th 2012: • Reporting the modeling process to NETL/DOE
– April 18th 2013: • Reporting project’s progress to NETL/DOE
Name Affiliation Neeraj Gupta Battelle Dwight Peters Schlumberger George Koperna ARI Grant Bromhal DOE-NETL Richard Winschel CONSOL
Background
Citronelle
Injected Fluid: Carbone Dioxide Depth of Injection Well:11,800ft Depths & Geological Name of Interval: 9,400-10500 ft (Paluxy Formation)
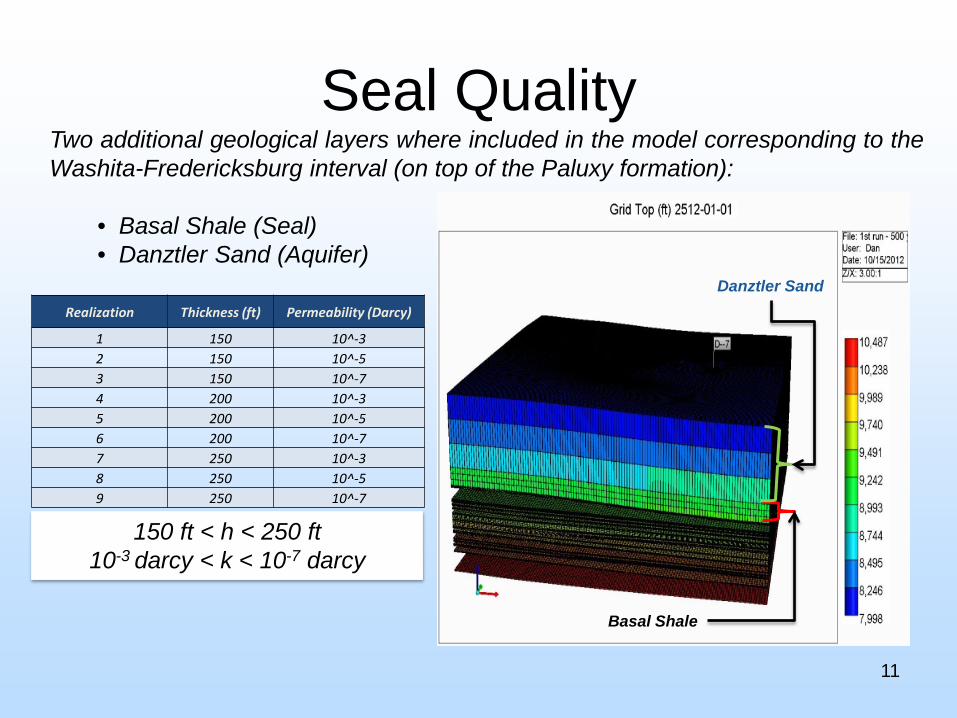
Two additional geological layers where included in the model corresponding to the Washita-Fredericksburg interval (on top of the Paluxy formation):
• Basal Shale (Seal) • Danztler Sand (Aquifer)
Seal Quality
12
Grid refinement of the basal shale simulation layers: Grid was refined vertically into 75 to 125 simulation layers to generate grid-blocks with thickness of 2 ft.
Seal Quality
13
0
50
100
150
200
250
1 2 3 4 5 6 7 8 9
Dep
th o
f inv
asio
n (ft
)
Realizations
Depth of invasion of CO2 within the Basal Shale (all realizations)
Descriptive Statistics Mean 0.091 Standard Error 0.0047 Median 0.092 Mode 0 Standard Deviation 0.062 Sample Variance 0.0038 Kurtosis -1.31 Skewness 0.029 Range 0.195 Minimum 0 Maximum 0.195 Sum 15.38 Count 168
Noise Level = 0.08 Psi Distribution = Normal (Gaussian)
De-noising Process
31
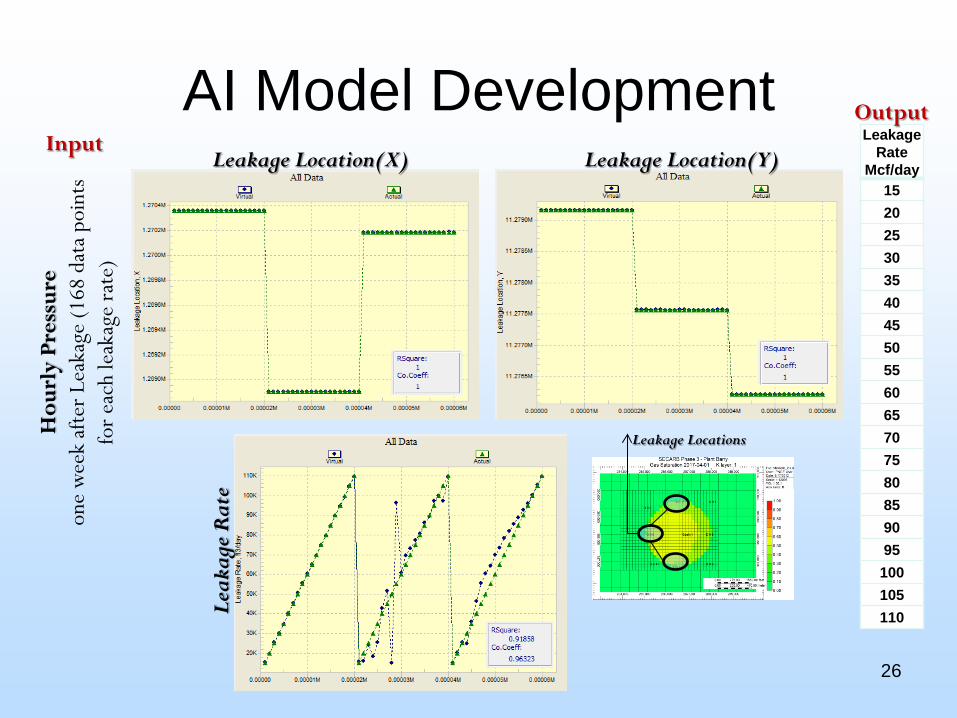
Training with De-Noised Data
32
Leakage Location(X) Leakage Location(Y)
Leakage Rate
33
0
0.2
0.4
0.6
0.8
1
0 1000 2000 3000
∆P(
Psi)
Time(hour)
0
0.2
0.4
0.6
0.8
1
0 500 1000 1500 2000 2500
∆P
(Psi
)
Time(hour)
De-noising
Summarization
Descriptive Statistics Mean 0.091532 Kurtosis -1.31344 Standard Error 0.004755 Skewness 0.029047 Median 0.091797 Range 0.194824 Mode 0 Minimum 0 Standard Deviation 0.061636 Maximum 0.194824
Sample Variance 0.003799 Sum 15.37744
Leakage Location
Leakage Rate
Noisy Pressure Data
The Interface Development
35
Accomplishments to Date
• Geological model was developed. • Reservoir Simulation Model was developed. • Impact of Relative Perms of Trapping Mechanism was
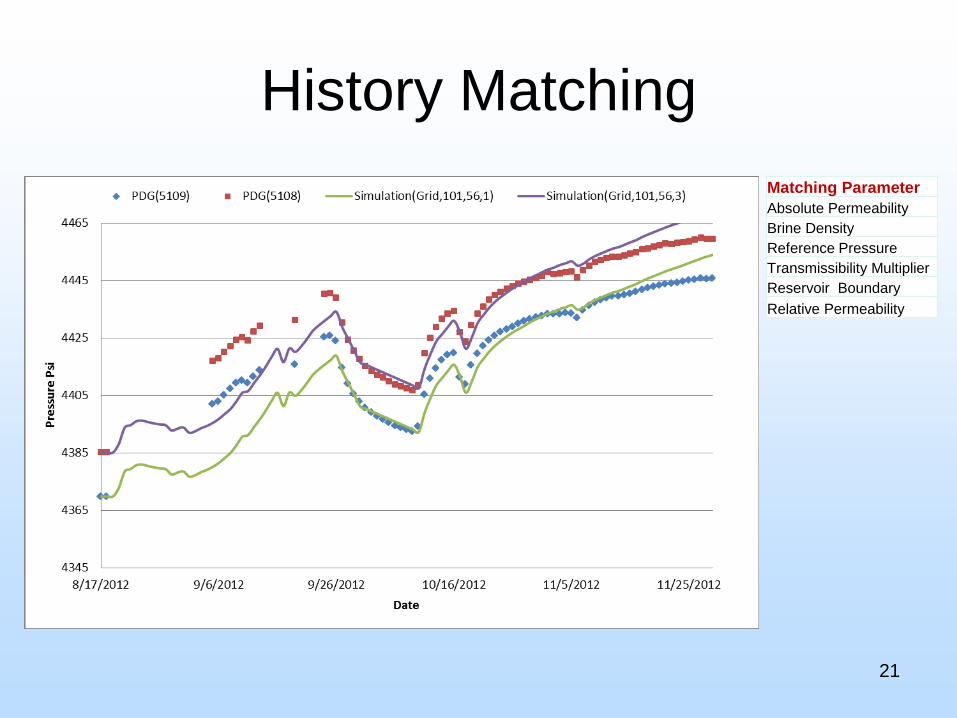
determined • Seal Quality and Integrity was studied • Sensitivity analysis was performed • Reservoir Simulation Model was history matched • Intelligent Leakage Detection System (ILDS) was designed
and developed. – Initial Design – Validated for Simple Reservoir System – Validated for Simple Leakage System
• High Frequency data was cleansed and summarized • ILDS interface was developed
Summary
• Key Findings: - Location and amount of CO2 leakage can be detected and quantified, rather quickly, using continuous monitoring of the reservoir pressure. - Pattern recognition capabilities of Artificial Intelligence and Data Mining may be used as a powerful deconvolution tool.
– Lessons Learned(proof of concept): - Development of an Intelligent Leakage Detection System (ILDS) is initiated for detection and quantification of CO2 leakage.
– Future Plans: - Increase the robustness of ILDS by: + Using history matched model + Examining impact of different boundary conditions, + Including more sources of leakage(like Cap rock Leakage) + Examining detection of simultaneous multiple leakages.
Bibliography List peer reviewed publications generated from
project per the format of the examples below • Journal, one author:
– Gaus, I., 2010, Role and impact of CO2-rock interactions during CO2 storage in sedimentary rocks: International Journal of Greenhouse Gas Control, v. 4, p. 73-89, available at: XXXXXXX.com.
• Journal, multiple authors: – MacQuarrie, K., and Mayer, K.U., 2005, Reactive transport modeling in fractured
rock: A state-of-the-science review. Earth Science Reviews, v. 72, p. 189-227, available at: XXXXXXX.com.
• Publication: – Bethke, C.M., 1996, Geochemical reaction modeling, concepts and applications: New
York, Oxford University Press, 397 p.
38
Appendix Benefit to the Program
• Program goals : – Develop technologies to demonstrate that 99 percent
of injected CO2 remains in the injection zones.
• Benefits statement: – This project is developing the next generation of
intelligent software that takes maximum advantage of the data collected using “Smart Fields” technology to continuously and autonomously monitor and verify CO2 sequestration in geologic formations. This technology will accommodate in-situ detection and quantification of CO2 leakage in the reservoir.
Appendix Project Overview:
Goals and Objectives • Goals and objectives in the Statement of Project:
– This project proposes developing an in-situ CO2 Monitoring and Verification technology based on the concept of “Smart Fields”. This technology will identify the approximate location and amount of the CO2 leakage in the reservoir in a timely manner so action can be taken and ensure that 99 percent of the injected CO2 remains in the injection zone.
– Success Criteria and Decision Points:
– There are a total of 10 milestones (and 4 sub-Milestone) in this project. – Decision points come at the end of quarters 4 (Milestone 2.2) and 15
(Milestone 6). At the decision points a “go” or “no go” decision on the continuation of the project is made based on the accomplishments of the project up to that point.
Appendix Organization Chart
Main Contributors (Research & Development): Alireza Haghighat, Alireza Shahkarami, Daniel Moreno, Najmeh Borzoui, and Yasaman Khazaeni. Full Time Research Associate: Vida Gholami,
Task 1: Program Management and Reporting Task 2: Site Selection Subtask 2.1: Establishing the Industrial Review Committee Subtask 2.2: Developing Site Selection Criteria Task 3: Reservoir Data Collection and Base Reservoir Model Construction Subtask 3.1: Selection of Reservoir Modeling Software
Task 2: Site Selection Subtask 2.3: Selecting a Site Task 3: Reservoir Data Collection and Base Reservoir Model Construction Subtask 3.2: Collect data
Task 3: Reservoir Data Collection and Base Reservoir Model Construction Subtask 3.3: Use Collected Data to Develop a Geological Model Subtask 3.4: Assessing the need for Up-scaling the Geological Model
Task 3: Reservoir Data Collection and Base Reservoir Model Construction Subtask 3.5: Import the Geological Model into the Flow Model Subtask 3.6: Flow Model Testing
Task 4: Sensitivity Analysis of the Reservoir Simulation Model Subtask 4.1: Building multiple heterogeneous porosity maps based on logs from existing wells in the formation. Subtask 4.2: Defining different Porosity Permeability correlations and building different geological realizations of the reservoir. Subtask 4.3: Comparing different realizations of the reservoir and ranking them based on injectivity.
Task 5: Simulating CO2 Leakage and Realistic Downhole Pressure Data Subtask 5.1: Simulation of CO2 Leakage
August 22, 2013
Task 5: Simulating CO2 Leakage and Realistic Downhole Pressure Data Subtask 5.2:High Frequency Data Streams Generation Task 6: Developing Techniques for Handling High Frequency Data Subtask 6.1: Processing of High Frequency Data Streams – Data Cleansing
Task 5: Simulating CO2 Leakage and Realistic Downhole Pressure Data Subtask 5.3:Transmission of Data from Modeled Pressure Gauges Task 7: Performing Pattern Recognition Analysis Subtask 7.1: Key Performance Indicators Using Fuzzy Set Theory
Task 5: Simulating CO2 Leakage and Realistic Downhole Pressure Data Subtask 5.4:Emulation of Field Data Using Data Stream Distortion Task 7: Performing Pattern Recognition Analysis Subtask 7.2: Data Partitioning for Neural Network Modeling
Task 6: Developing Techniques for Handling High Frequency Data Subtask 6.2: Processing of High Frequency Data Streams – Data Summarization
Task 6: Developing Techniques for Handling High Frequency Data
Subtask 6.3: Preparation of High Frequency Data for Pattern Recognition
Task 8: Testing and Validation of CO2 Leak Detection in a Homogeneous Reservoir
Task 7: Performing Pattern Recognition Analysis
Subtask 7.4: Neural Network Training and Calibration Subtask 7.5: Neural Network Validation Subtask 7.6: Neural Network Model Analysis
Task 9: Integrating CO2 Injection and History Matching the Model
Subtask 9.2: In Situ CO2 Behavior Validation Subtask 9.3: Model Integrity Verification
Milestone Timelines Milestone log
Title Description Related task or subtask Completion Date
Budget Period 1
Milestone 1.1 Advisory Board Meeting Advisory board should get together for a meeting (or conference call) to select a site for the project. Subtask 2.1 End of First Quarter
Milestone 1.2 Site Selection A site must be selected for the project. Subtask 2.2, 2.3 End of Second Quarter
Milestone 2.1 Data collection Completion of geologic and production data collection Subtask 3.2 End of Third Quarter
Milestone 2.2 Completion of geological model Completion of geologic/geo-cellular model Subtask 3.3 End of Fourth Quarter
Milestone 2.3 Completion of the base model Completion and testing the base flow model Subtask 3.6 End of Fifth Quarter
Milestone 3 Sensitivity Analysis Completion of the sensitivity analysis on the reservoir model Subtask 4.3 End of Sixth Quarter
Budget Period 2 Milestone 4.1 CO2 Leakage Modeling Model realistic CO2 leakage from the formation Subtask 5.1 End of Eighth Quarter
Milestone 4.2 Downhole pressure modeling Model realistic real-time downhole pressure measurements. Subtask 5.2, 5.3, 5.4 End of Eleventh Quarter
Milestone 5 Handling High Frequency Data Developing techniques for handling high frequency data Subtask 6.1, 6.2, 6.3 End of Thirteenth Quarter
Milestone 6 Pattern recognition Completing pattern recognition analysis Subtask 7.1, 7.2, 7.3, 7.4, 7.5, 7.6 End of Fifteenth Quarter
Milestone 7 Application to Homogeneous system Completing of analysis and application to Homogeneous system Task 8 End of Fifteenth Quarter
Milestone 8 CO2 Injection Modeling Completion of modeling the CO2 injection. Subtask 9.3 End of Fifteenth Quarter
Milestone 9 Application to Heterogeneous system Completing of analysis and application to Heterogeneous system Task 10 End of Sixteenth Quarter
Milestone 10 Build Program Interface Completion of Software Package Task 11 End of Sixteenth Quarter