Scholars' Mine Scholars' Mine Masters Theses Student Theses and Dissertations Summer 2017 In situ pH determination based on the NMR analysis of ¹H-NMR In situ pH determination based on the NMR analysis of ¹H-NMR signal intensities and ¹⁹F-NMR chemical shifts signal intensities and ¹ F-NMR chemical shifts Ming Huang Follow this and additional works at: https://scholarsmine.mst.edu/masters_theses Part of the Physical Chemistry Commons Department: Department: Recommended Citation Recommended Citation Huang, Ming, "In situ pH determination based on the NMR analysis of ¹H-NMR signal intensities and ¹⁹F- NMR chemical shifts" (2017). Masters Theses. 7867. https://scholarsmine.mst.edu/masters_theses/7867 This thesis is brought to you by Scholars' Mine, a service of the Missouri S&T Library and Learning Resources. This work is protected by U. S. Copyright Law. Unauthorized use including reproduction for redistribution requires the permission of the copyright holder. For more information, please contact [email protected].
Transcript
Scholars' Mine Scholars' Mine
Masters Theses Student Theses and Dissertations
Summer 2017
In situ pH determination based on the NMR analysis of ¹H-NMR In situ pH determination based on the NMR analysis of ¹H-NMR
signal intensities and ¹⁹F-NMR chemical shifts signal intensities and ¹ F-NMR chemical shifts
Ming Huang
Follow this and additional works at: https://scholarsmine.mst.edu/masters_theses
Part of the Physical Chemistry Commons
Department: Department:
Recommended Citation Recommended Citation Huang, Ming, "In situ pH determination based on the NMR analysis of ¹H-NMR signal intensities and ¹⁹F-NMR chemical shifts" (2017). Masters Theses. 7867. https://scholarsmine.mst.edu/masters_theses/7867
This thesis is brought to you by Scholars' Mine, a service of the Missouri S&T Library and Learning Resources. This work is protected by U. S. Copyright Law. Unauthorized use including reproduction for redistribution requires the permission of the copyright holder. For more information, please contact [email protected].
Figure 1.1.Structure of the modified tripeptide Z-Ala-Pro-Phe-[2-13C]-glyoxal (Z = benzyloxy-carbonyl) bonded to an enzyme (upper structure) in equilibrium with its deprotonated, anionic form (lower structure) according to ref. [2]. Numbers refer to the 13C chemical shifts in ppm .............................................................................................................6
Figure 1.2.13C NMR spectra of the enzyme-bonded modified tripeptide Z-Ala-Pro-Phe-[2-13C]-glyoxal (100.7 – 103.8 ppm) and its deprotonated form (107.6 – 107.8 ppm) at different pH values (from ref. [2]) ...............8
Figure 1.3.Stacked plot of the NMR signals from the protons in meta position to each other of a mixture of 4-hydroxypyridine and cytosine at different pH values (from ref. [1] ) .............................................................8
Figure 2.1.1H chemical shift changes of different functional groups in deuterated chloroform (CDCl3). The chemical shift difference between the CH2-group signal and the OH-group signal of ethylene glycol can be used to determine the sample temperature [47]. ................15
Figure 2.2.19F chemical shift changes of pentafluorobenzene (C6F5H) and sodium fluoride (NaF) signals in aqueous solution at temperture between 300 and 325K .............................................................................16
Figure 2.3. The 19F NMR chemical shift changes of sodium flouride (NaF) and trifluoroacetic acid (CF3COOH) in aqueous solution as a function of temperature between 300 and 325K. ....................................................17
Figure 2.4. In situ NMR pH measurement device composed of (a) 5-mm NMR tube with sample and pH micro-sensor compound, (b) 250-µm capillary tube with chemical-shift reference compound (c) 75-µm capillary tube with temperature-sensing compound, (d) 1-mm NMR-tube to hold the capillary tubes (b) and (c), and (e) Teflon plugs to align the 1-mm NMR tube (d) ....................................................20
Figure 2.5. NMR sample tube in the magnetic radiofrequency field (B1) of Helmholtz saddle coils, which are typically used in superconducting NMR magnets. The B1 field is homogeneous in direction and amplitude as well as perpendicular to B0 in a limited volume of the sample (light orange). ........................................................22
Figure 2.6. Schematic of a Sphere NMR tube .............................................................24
Figure 2.7.1H NMR spectrum of ethanol (4.8 Vol%) dissolved in acetone-d6 in a Sphere NMR tube ..................................................................................26
viii
Figure 2.8.Schematics to illustrate the use of Doty susceptibility plugs in standard 5-mm NMR tubes ......................................................................27
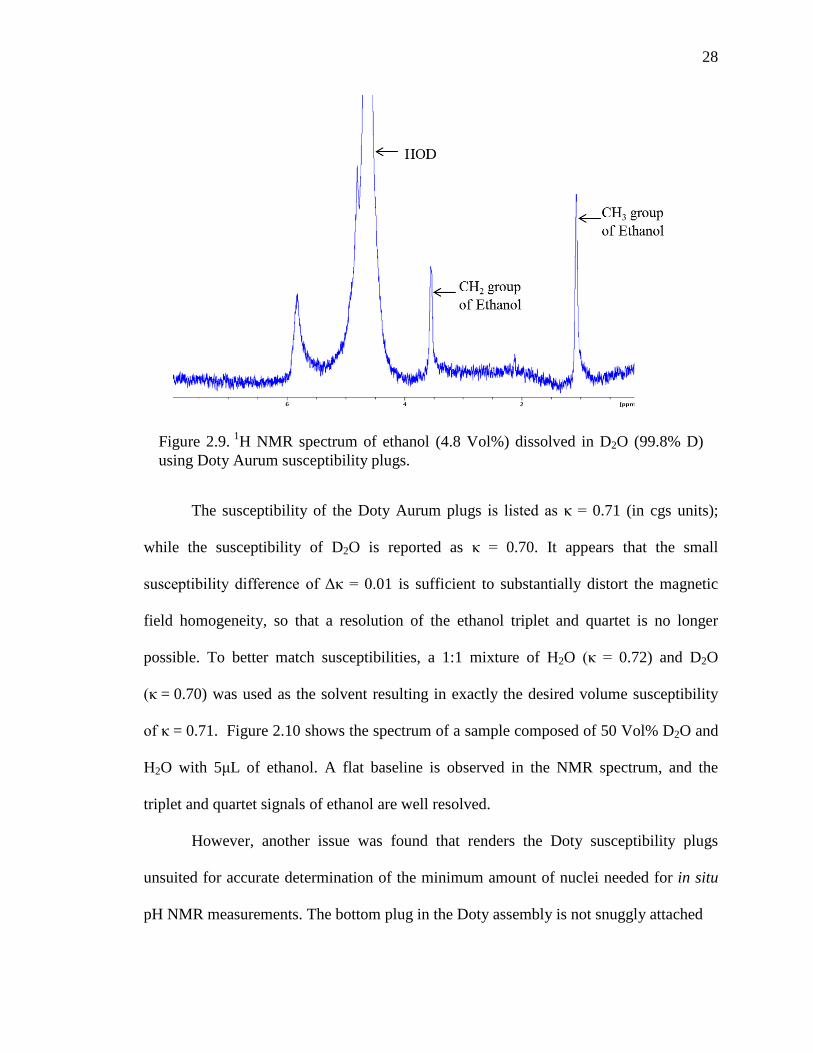
Figure 2.9.1H NMR spectrum of ethanol (4.8 Vol%) dissolved in D2O (99.8% D) using Doty Aurum susceptibility plugs. ..............................................28
Figure 2.10.1H NMR spectrum of ethanol dissolved in a 50 Vol% D2O/H2O solution using Doty susceptibility plugs ..................................................29
Figure 2.11.Schematic of Shigemi tube. A) length of NMR tube, B) inner diameter of Shigemi NMR sample tube, B’) outer diameter of tube insert, slightly smaller than B, C) length of susceptibility-matched hard glass enclosure, D) outer diameter of upper hard glass plug, a touch smaller than B. ................................................................................30
Figure 2.12.1H NMR spectrum of a 4.8 Vol% ethanol (94%, commercial grade) D2O (99.8% D) solution in a susceptibility-matched Shigemi tube ........31
Figure 2.13.Setup for Shigemi tube experiments: the Shigemi tube was filled with a precisely measured 0.40 mg ethanol in 833.0 mg D2O solution, resulting in sample height of 2 mm. The sample was originally positioned in the center of Helmholtz saddle coil. In subsequent experiments, the sample volume was moved down or up from the center of coil in steps of 1 mm. .............................................32
Figure 2.14.Normalized integration values of the ethanol CH3-group in a 2-mm cylindrical sample height as a function of sample position, where the origin (distance = 0 mm) indicates the center of the Helmholtz saddle coils ...............................................................................................34
Figure 2.15.1H NMR spectrum obtained from a single-scan experiment of 0.1086 mL from a solution of 0.40 mg ethanol in 833.0 mg D2O in a Shigemi tube. The SNR was determined to be 130:1 ............................35
Figure 3.1.Structural difference of the pH indicator phenolphthalein depending on the pH (ref.) ........................................................................................38
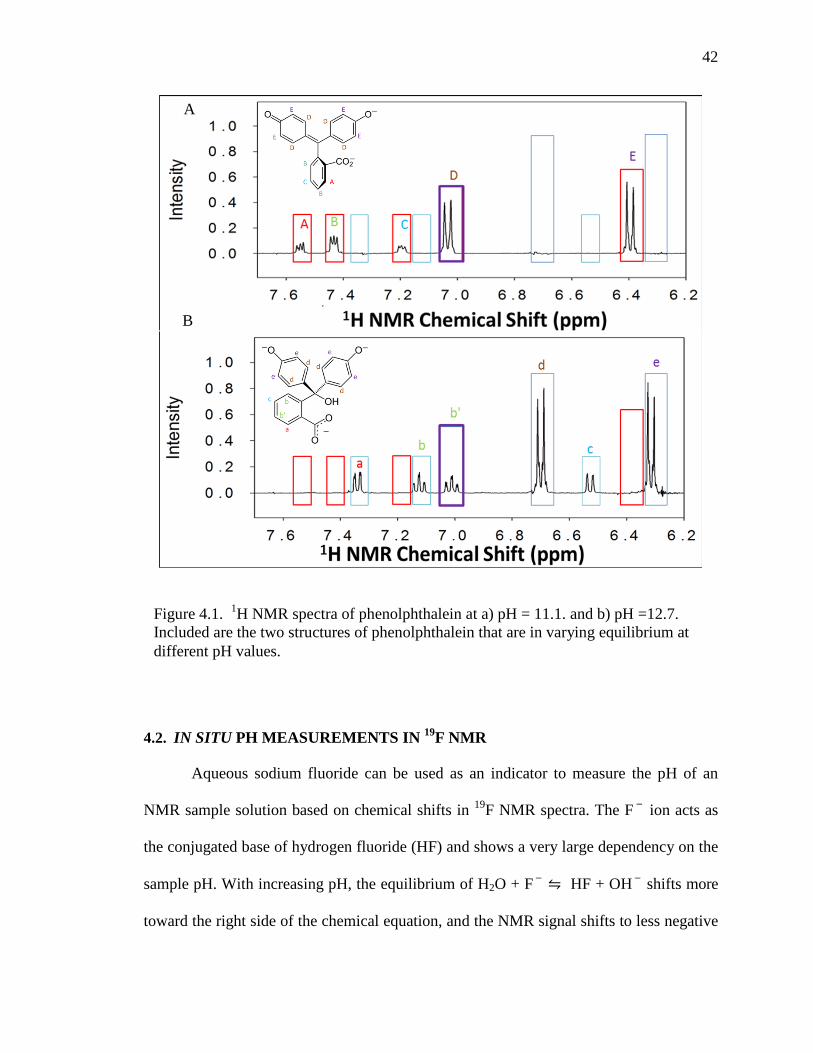
Figure 4.1. 1H NMR spectra of phenolphthalein at a) pH = 11.1. and b) pH =12.7. Included are the two structures of phenolphthalein that are in varying equilibrium concentrations at different pH values ..................42
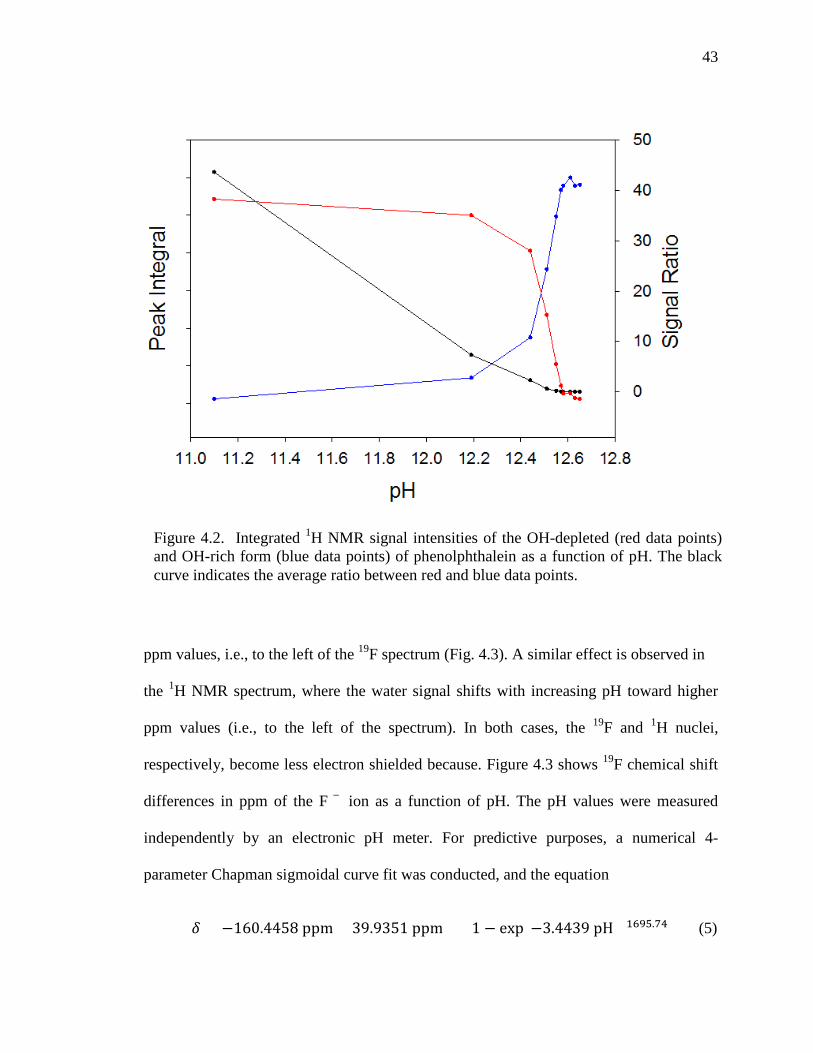
Figure 4.2.Integrated 1H NMR signal intensities of the OH-depleted (red data points) and OH-rich form (blue data points) of phenolphthalein as a function of pH. The black curve indicates the average ratio between red and blue data points…… .....................................................43
Figure 4.3.19F chemical shift (ppm) of the pH micro-sensor compound NaF in aqueous solution as a function of pH .......................................................44
ix
Figure 4.4.19F NMR spectra of pentafluorododecan-3-ol and micro-sensor compound NaF in aqueous solution at two ranges of pH (acidic and basic). .................................................................................................45
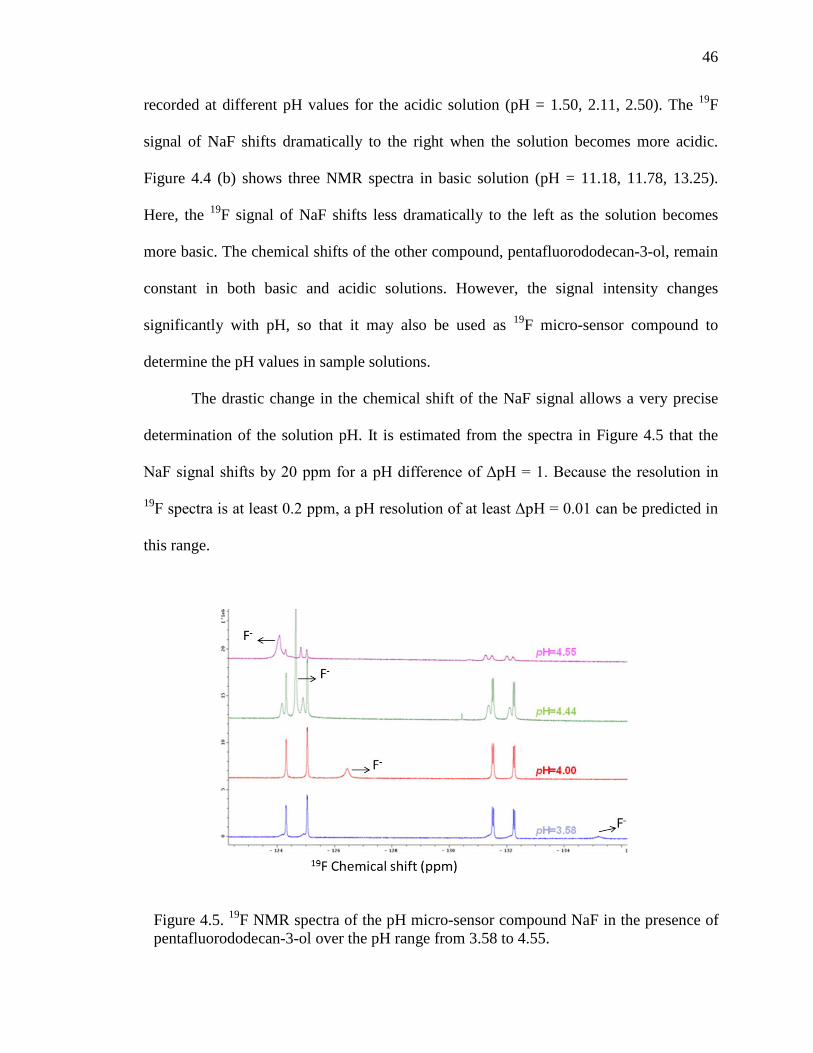
Figure 4.5.19F NMR spectra of the pH micro-sensor compound NaF in the presence of pentafluorododecan-3-ol over the pH range from 3.58 to 4.55 .......................................................................................................46
Figure 4.6. Experimentally derived changes in the chemical shift difference between the 19F NMR signals of NaF and trifluoroacetic acid (CF3COOH) at different temperatures from 300 K to 330 K ...................48
1. INTRODUCTION
1.1. THE NEED FOR IN SITU NMR pH MEASUREMENTS
The determination of pH plays a significant role in some NMR investigations,
particularly when the pH changes throughout the course of a reaction that occurs inside
the NMR sample tube. Importantly, in situ NMR pH measurements can give insights into
chemical structures, conformations, or reaction mechanisms, as well as provide
information about the properties of materials for physical, chemical, and biological
applications [3-5].
For example, to better understand the physicochemical processes during the
hydrothermal crystallization of gels, pH values have been measured in situ by 13C NMR
during the formation of SAPO-34 (silicoaluminophosphate) in the presence of
hydrofluoric acid [6]. Another example of in situ NMR pH measurements is the
determination of the extracellular pH of solid tumors in mice using 19F and 31P probes.
The results provide clinical information useful for tumor diagnosis and the selection of
therapies [7].
All NMR pH measurements are based on NMR-sensitive molecules for which
the NMR spectrum changes along with the pH. However, it is still a challenge to use in
situ NMR for the precise, accurate, and reasonably fast determination of pH as a function
of time. On the contrary, conventional pH meters would require the removal of NMR
tubes from the NMR magnet which may not be suitable for in situ pH measurement in
fast-changing environments. It is also known that other factors influence the pH value of
a test sample such as temperature, pressure, or humidity. For NMR-based in situ pH
measurements, the chemical that is used as pH micro-sensor compound may change the
2
pH value in the original sample, leading to systematic measurement errors. Hence there is
a need for the development of standardized in situ NMR pH measurement devices that
offer great precision and reliability. The following section summarizes and evaluates
various methods that have been used for in situ NMR pH measurements.
1.2. pH MEASUREMENTS
The abbreviation “pH” originates from a description by German scientists for the
“potency of hydrogen ion concentration” (Potenz der Wasserstoffionenkonzentration).
More completely, it describes the inverse of the power of [H+], which stands for the H+
concentration. In its mathematical definition, pH is therefore equal to the negative
logarithmic value of the H+ concentration,
pH = − log[H+] (1)
Alternatively, pH can be defined as the negative logarithmic value of the
hydronium ion (H3O+) concentration [1]. A hydronium ion is a hydrogen ion bonded to a
water molecule, so that
pH = − log[H3O+] (2)
In practice, the pH of a solution is determined by measuring parameters that depend on,
or that are proportional to the solution’s H+ concentration [1].
1.2.1. pH Paper. A simple, quick, and inexpensive approach for pH measurement
in liquids is provided by using pH papers. With pH paper it is possible to measure pH to
an accuracy of about ± 0.2 to ± 0.5 [8]. Accordingly, pH paper only provides a rough
3
estimate (order of magnitude) of the H+ concentration but rarely an exact value.
Moreover, pH paper is not well-suited to reach a solution inside a typical NMR tube of
7 – 8” length.
1.2.2. pH Electrodes. Another common method to determine pH values is the
use of pH electrodes. Those electrodes play a very important role in performing precise
pH determinations and are responsible for most pH measurements in chemical
experimentation and scientific publications. Among the available pH electrodes, glass
electrodes are most common. In glass electrodes, differences in H+ concentrations
between a standard solution inside and a sample solution outside a thin glass membrane
create an electromotive force [9]. The voltage (difference in electrical potential)
generated by this electromotive force is proportional to the difference in H+
concentrations and is calibrated by at least two reference buffer solution of known H+
concentrations.
Glass electrodes require substantial care and maintenance. For example, to
generate an electromotive force that accurately reflects the difference in pH inside and
outside of the glass membrane, the glass electrode must be kept very clean and
regenerated with a reference solution after every use. Other factors such as reference
junction blockages, electrolyte loss, glass bulb contaminations and the use of incorrect
calibration buffers can all contribute to poor performance or calibrations curves [10, 11].
In addition, the temperature of a sample will also affect the electrode potential of a glass
electrode. Hence, if there is a temperature gradient between the electrode and the sample,
the pH will not be accurately determined [11].
4
Many different types of pH electrodes are available such as half-cell electrodes
electrodes [18], sure-flow electrodes [19], and triode pH electrodes [20]. It is important to
consider the specific electrode features and recognize its compatibility with the sample
being measured. Since not only the electrode potential but also the pH itself depends on
the temperature, a triode pH electrode should be used in measurements where
temperature is most critical. Triode pH electrodes make it possible to monitor sample
temperatures simultaneously to electrode potentials and automatically adjust for
temperature differences in a sample [21].
The pH measurement with glass electrodes is particularly challenging in very low
and in very high ionic-strength samples. Special devices and calibration procedures are
needed for these scenarios. For example, in high ionic-strength samples a fast-flowing,
low-resistance electric junction as well as a high electrolyte salt concentration in the pH
reference solution is needed [16]. It is also advisable to use a double-junction electrode in
these cases, which will protect the reference electrode from salt intrusion. For best
results, all calibration standards and sample temperatures should be kept within 2 °C of
each other [22].
There are glass electrodes commercially available which are especially designed
for pH measurement in NMR tubes. NMR tubes typically come in 3 mm, 5 mm, and 10
mm diameters, and are between 7” and 8” long. The NMR pH electrodes have their pH-
sensitive glass tip mounted on a long, small-diameter rod that conveniently fits inside an
NMR tube. However, these NMR pH meters come at a relatively high cost ($400 - $600)
5
[23], and the NMR tube still needs to be ejected from the NMR probe prior to the
measurement. Ejecting the NMR tube for each pH measurement is not only inconvenient,
but may disturb consecutive NMR measurements in a series of investigations, where the
pH is supposed to be monitored simultaneously or interleaved with the NMR
experiments.
1.2.3. Spectroscopic in situ pH Measurements. In addition to pH paper and pH
electrodes, a pH value can also be calculated from spectroscopic data, such as UV/Vis
absorbance [24], NMR signal intensities [2], or NMR chemical shifts [25, 26]. In situ
NMR pH meters are based on specific chemicals, so-called micro-sensor compounds, that
are added to the sample solution and show pH-dependent changes in signal intensities or
chemical shifts.
1.2.3.1. pH Measurement based on NMR signal intensity. To measure pH of a
sample solution by evaluating signal intensities in an NMR spectrum, the integrated
intensity of at least one signal must be proportional to the number of hydrogen ions (or
hydroxide ions) in the solution. An integrated intensity refers to the area under the peak
and is often called “peak integral”. An unknown pH of a sample solution can be
determined from a calibration of peak integrals with solutions of known pH values.
Only one report was found in the literature [2] where a reliable pH measurement
based on NMR signal intensities was described. The report stated that the bio-organic
compound Z-Ala-Pro-Phe-glyoxal bonded to an enzyme exists in a protonated (neutral)
and a deprotonated (anionic) form (Fig. 1.1). The two forms are in pH-dependent
equilibrium within the range of pH = 3.3 to 6.9 (pKa ~ 5.3). The equilibrium shifts in
favor of the protonated form in more acidic solutions and to the deprotonated form in less
6
acidic solutions. This shift can be observed from the 13C peak integrals of the isotope-
labeled Z-Ala-Pro-Phe-[2-13C]-glyoxal-enzyme complex, i.e., a compound that is 13C
labeled in the 2-carbon position of the glyoxal group (Figure 1.1). Because peak integrals
are directly proportional to the number of atoms, the ratio of the peak integrals directly
reflect the ratio of the protonated to deprotonated form. Outside this range, only one of
the two forms (protonated for pH < 3.3, or deprotonated for pH > 6.9) exists in sufficient
concentration, and only the signal of this one form is observed.
Outside the range of pH = 3.3 to 6.9, the signals of only one form of the Z-Ala-
Pro-Phe-[2-13C]-glyoxal-enzyme compound is observed (pH > 6.9, deprotonated form;
pH < 3.3, protonated form) and the 13C peak integrals don’t change with pH. Within the
Figure 1.1. Structure of the modified tripeptide Z-Ala-Pro-Phe-[2-13C]-glyoxal (Z = benzyloxy-carbonyl) bonded to an enzyme (upper structure) in equilibrium with its deprotonated, anionic form (lower structure) according to ref. [2]. Numbers refer to the 13C chemical shifts in ppm.
7
range of pH = 3.3 to 6.9, the peak integral of the protonated, isotope-labeled form (δ =
100.7 ppm) decreases with increasing pH while the peak integral of the deprotonated
form (δ = 107.8 ppm) increases (Figure 1.2).
It is noted that, in addition to the peak integral, the chemical shifts in this example
also change. The change is more pronounced for the protonated form where the 13C
signal shifts from δ = 100.7 ppm (at pH = 3.3) to δ = 103.8 ppm (at pH = 6.9); it is less
pronounced in the deprotonated form where it only shifts from δ = 107.6 ppm to
δ = 107.8 ppm as the pH changes from 3.3 to 6.9. It is further noted that the 13C isotope-
labeled signals become broader in the middle of the pH-sensitive range (pH ~ 4 to 5). The
fact that the 13C isotope-labeled signals become broader and that the signals shift toward
each other in the pH-sensitive range is an additional indication for the dynamics of an
equilibrium where the NMR signals broaden because of a limited lifetime of the
exchanging partners, i.e., the protonated and deprotonated species.
1.2.3.2.pH measurement based on NMR chemical shift. To measure pH of a
sample solution by evaluating chemical shifts in an NMR spectrum [27], the position of a
resonance signal must change depending on the pH of the solution. Many literature
reports are available where a reliable pH measurement based on NMR chemical shifts is
described. For example, the chemical shifts of the protons in the meta position to each
other of 4-hydroxypyridine and cytosine in a mixture of the two compounds change
considerably within the range of pH = 9.5 to pH = 13.5 (Figure 1.3) [1]. Outside this
range, the NMR chemical shift does not change.
8
Figure 1.2. 13C NMR spectra of the enzyme-bonded modified tripeptide Z-Ala-Pro-Phe-[2-13C]-glyoxal (100.7 – 103.8 ppm) and its deprotonated form (107.6 – 107.8 ppm) at different pH values (from ref. [2]).
Figure 1.3. Stacked plot of the NMR signals from the protons in meta position to each other of a mixture of 4-hydroxypyridine and cytosine at different pH values (from ref. [1] ).
9
Because many NMR signals shift in their resonance frequency (even though the
shift may be small) with changing environments and reaction conditions, a pH
dependency of a chemical shifts must be measured against a standard for which the
chemical shift is not affected by a changing pH [28, 29]. Alternatively, if the pH-
dependency of a compound’s chemical shift is known, a calibration curve of pH versus
chemical shift can be used to accurately predict the pH of an unknown solution.
In many cases, it has been suggested to add specific pH-sensitive chemicals
(NMR pH micro-sensor compounds) to a solution [30] for which the chemical shift
dependency on pH is known. In 1H NMR spectroscopy, examples of such chemicals are
acetic acid (CH3CO2H), chloroacetic acid (CH2ClCO2H) or dichloroacetic acid
(CHCl2CO2H) for pH ~ 0 to 4 [31], formic acid (HCO2H) or sodium formate (HCO2Na)
for pH ~ 0 to 5 [32], and TRISH+ (tris(hydroxymethyl)aminomethane (CH2OH)3CNH+)
for pH ~ 5 to 10 [33].
Chemical-shift-dependent NMR measurements of pH values may not only be
conducted with proton NMR but also with NMR of other nuclei such as 13C, 15N, 19F, or
31P. Essentially, any NMR-sensitive nucleus that is in close proximity to a pH-sensitive
proton of a weak acid or weak base can function as an “indirect” pH micro-sensor [34].
For example, sodium malate, sodium citrate, and the dipeptide carnosine were shown to
be effective 13C NMR micro-sensor compounds for different pH ranges [35].
Furthermore, 13C signals of sodium carbonate, sodium bicarbonate, or dissolved carbon
dioxide were used to measure pH values from 9 to 12 [36, 37]. The amino acid histidine
has been used in 15N spectroscopy to provide information about pH in the range from 6 to
9.7 [38]. Inorganic phosphate is the most commonly used pH micro-sensor in 31P NMR
10
[39], which has also been used to measure pH in biological cells [40]. Other known 31P-
NMR micro-sensors are glucose-6-phosphate, other sugar phosphates [41], or [N-(P,P-
phosphonic acid [31]. The latter is particularly interesting because it can be used for a
rather large range of pH from 0 to 12. The chemical shift of inorganic fluoride was used
with 19F NMR spectroscopy to determined renal tubular cellular pH values from pH ~ 5.6
to 8.0 [42]. Fluorine compounds are particularly interesting as NMR micro-sensors
because 19F spectroscopy is often used to provide direct, non-invasive measurements of
the metabolism of fluorinated drugs such as those used in cancer treatments [43]. A series
of nontoxic, fluorinated amino acids and their methyl esters have been used to measure
intracellular pH in human peripheral blood lymphocytes by 19F NMR [44].
Monofluoromethylaniline and trifluoromethylaniline show a single resonance in 19F
NMR which can be used to measure pH values from 6 to 9.7 [45]. Other fluorinated
anilines and p-fluoroanilines were used as micro-sensors for pH values from 0 to 1 [44].
While these aniline compounds take time to adjust to an external pH value, 19F
spectroscopy with plain fluoride ions (F-) is known to give rapid results in the range of
pH from 1.5 to 4.5 [46].
In conclusion, NMR micro-sensors used to measure pH values in situ in an NMR
tube while recording NMR spectra are based on specific chemicals that are added to the
sample solution showing pH-dependent changes in signal intensities or chemical shifts.
There are several advantages of using such in situ NMR micro-sensors: (a) there is no
need to eject a sample tube from the NMR magnet for the pH measurement, (b) the pH
measurement can be recorded as spectral imprimatur, i.e., in the same spectrum that is
11
used for structural analysis, (c) it is convenient to determine the pH values from peaks
recorded in an NMR spectrum that is automatically saved in the sample’s data file, and
(d) the pH of a solution can be recorded during the course of a reaction conducted and
monitored in situ in the NMR magnet.
Finally, however, it must be mentioned that the temperature of a solution plays an
important role for the pH and its measurements. In NMR, the temperature has not only an
influence on the pH, but often also on the chemical shift of the micro-sensor and
sometimes even on the range of pH that is accessible through NMR. For example, 13C
spectroscopy with morpholine as micro-sensor was used to measure pH values from 5.5
to 7.3 at room temperature [6], while the range of 7.3 to 10.3 was accessible at 120 °C
[6].
1.3. RESEARCH OBJECTIVES
The main objective of this thesis is to develop a protocol for an accurate in situ
NMR pH measurement that utilizes the spectra of small and quantifiable amount of pH
micro-sensor compounds. The micro-sensor compounds used for in situ NMR analysis
must change their chemical shift or signal intensities depending on the pH of the solution
so that the pH may be determine according to a calibration curve. Specific objectives
include:
1) Development of an in situ NMR pH measurement device that utilizes micro-
sensor compounds in the test sample solution.
2) Including an independent external reference for absolute calibration of the
NMR chemical shift in the device.
12
3) Including a known external temperature-sensing NMR reference to adjust for
temperature-dependent chemical-shift changes
4) Utilizing detailed quantitative NMR to calculate the minimum amount of
micro-sensor compound needed for in situ NMR pH measurement, thus minimizing the
effect of the micro-sensor compound on the pH of the solution.
13
2. METHODOLOGY
2.1. IN SITU NMR pH MEASUREMENT DEVICE
The in situ NMR pH measurement device developed in this thesis consists of
three parts. The first part is a standard reference solution which provides an absolute
chemical-shift reference for the in situ NMR pH measurements. The reference solution is
intended to satisfy two criteria: (1) the chemical shift should be constant under changing
pH conditions and (2) the chemical shift should be constant under changing temperatures.
The second part of the NMR pH meter is a compound that can be used to determine the
temperature of the NMR sample in situ. This is usually accomplished by measuring a
temperature-dependent chemical-shift difference between two peaks of the same
compound. [47] The third part is the actual pH micro-sensor compound.
Due to the inherent insensitivity of NMR signals, a rather sizeable amount of pH
detector molecules is generally necessary to acquire NMR signals with a sufficient
single-to-noise ratio. However, a large amount of detector molecules can significantly
influence the pH of a sample solution. Therefore, to ensure accurate measurement of the
pH, an NMR-sensitive pH detector molecule must be considered which can be used in
very small and quantifiable amounts. The following sections explain in detail the
compounds and components that were used in this work to construct a highly sensitive
and accurate in situ NMR pH meter.
2.1.1. Standard Reference Solution. As mentioned before, in situ NMR pH
measurement devices are based on specific chemicals (pH micro-sensor compounds) that
are added to the sample solution showing pH-dependent changes in signal intensities or
chemical shifts (Section 1.2.3.1 and 1.2.3.2). When signal intensities are used to
14
determine pH values, a quantitative standard (qNMR standard) is needed to calibrate the
signal intensities, and a chemical-shift standard is needed when the pH is measured based
on differences in chemical shifts. The reference intensities or chemical-shift standards
should be independent of the sample pH. This can be accomplished by using an external
reference that is not in contact but measured together with the sample solution. In this
work, a capillary tube (250 µm i.d., 360 µm o.d.) filled with a reference material was
always inserted concentrically into standard 5-mm NMR sample tubes to provide an
external reference.
Another important feature for the reference solution is that the signal intensities or
the chemical shifts, respectively, must be insensitive to temperature. For example,
literature and independent measurements show that the 1H chemical shift of the CH3-
group of methanol or the CH2-group of ethylene glycol are less dependent on temperature
(< 3.0 × 10⁻³ ppm/K, Figure 2.1) while the OH-group signals of methanol or ethylene
glycol are very temperature sensitive (> 7.9 × 10⁻³ ppm/K) [50]. The reason for this
dependency is that the extent of hydrogen bonding among the OH-groups is temperature
dependent. At higher temperatures there is less extensive hydrogen bonding resulting in a
higher electron density around the OH-groups. Changing electronic orbital angular
momentums and electron density contributions from excited vibrational and rotational
states at higher temperature may also contribute to variations in chemical shifts. The
higher electron density leads to an increased shielding of the OH proton and an upfield
shift of the OH resonance in the direction of the aliphatic CH3 and CH2 signals. Because
of the temperature sensitivity of the 1H resonances of the OH-group and the relative
stability of the 1H resonances of the CH2-groups and CH3-groups, methanol and ethylene
15
glycol have been used as standards for chemical shift calibration and, simultaneously, to
determine the temperature of the sample (see Section 2.1.2).
In an attempt to find the chemical shift of a functional group that exhibits a very
small temperature dependence, 1H NMR experiment were performed with solutions of
ethylene glycol dissolved in deuterated chloroform (CDCl3) as various temperatures. As
evident from Figure 2.1, the chemical-shift change of the ethylene glycol CH2 groups
with temperature is relatively small (2.997 × 10⁻³ ppm/K); however, the change in
chemical shift of the HOD signal is even smaller (0.875 × 10⁻³ ppm/K). HOD is formed
Figure 2.1. 1H chemical shift changes of different functional groups in deuterated chloroform (CDCl3). The chemical shift difference between the CH2-group signal and the OH-group signal of ethylene glycol can be used to determine the sample temperature [50].
16
by partial deuteration of H2O molecules due to an exchange of hydrogen with deuterium
atoms from the CDCl3 solvent molecules. Because the slope of the chemical shift vs.
temperature is smallest for the HOD signal, HOD could be used as preferred reference
signal for NMR measurements such as the in situ pH determination studied here.
For 19F NMR spectroscopy, it is rather difficult to find chemical compounds with
an NMR signature that is nearly independent of temperature. For example, even in the
gas phase where molecules are considered most independent of external influences, 19F
chemical shifts of the compounds CF3CF3, CF3Br, CF3Cl, and CHF3 change noticeably
(> 1.80 × 10⁻³ ppm/K) when the temperature is raised from 260 to 360 K [47]. Moreover,
as determined experimentally and shown in Figure 2.2, the 19F chemical shifts of
pentafluorobenzene (C6F5H) and sodium fluoride (NaF) in aqueous solution change
drastically (22.5 × 10⁻³ ppm/K and 56.8 × 10⁻³ ppm/K, respectively) when the
temperature is raised by only 25 K from 300 to 325 K.
Figure 2.2. 19F chemical shift changes of pentafluorobenzene (C6F5H) and sodium fluoride (NaF) signals in aqueous solution at temperture between 300 and 325K.
17
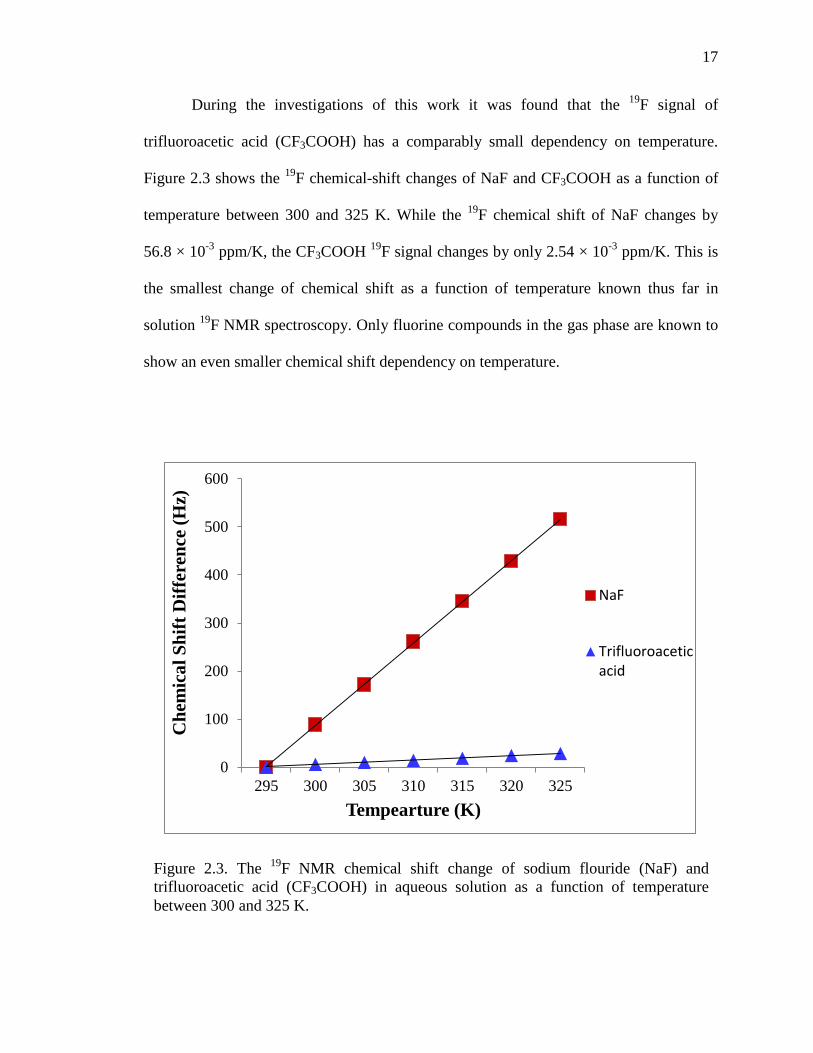
During the investigations of this work it was found that the 19F signal of
trifluoroacetic acid (CF3COOH) has a comparably small dependency on temperature.
Figure 2.3 shows the 19F chemical-shift changes of NaF and CF3COOH as a function of
temperature between 300 and 325 K. While the 19F chemical shift of NaF changes by
56.8 × 10⁻³ ppm/K, the CF3COOH 19F signal changes by only 2.54 × 10⁻³ ppm/K. This is
the smallest change of chemical shift as a function of temperature known thus far in
solution 19F NMR spectroscopy. Only fluorine compounds in the gas phase are known to
show an even smaller chemical shift dependency on temperature.
0
100
200
300
400
500
600
295 300 305 310 315 320 325
Che
mic
al S
hift
Diff
eren
ce (H
z)
Tempearture (K)
NaF
Trifluoroaceticacid
Figure 2.3. The 19F NMR chemical shift change of sodium flouride (NaF) and trifluoroacetic acid (CF3COOH) in aqueous solution as a function of temperature between 300 and 325 K.
18
It is noted that the 2.54 × 10⁻³ ppm/K chemical shift change for the CF3 signal in
trifluoroacetic acid (CF3COOH) is equivalent to a 0.31 × 10⁻³ % relative shift in a 19F
NMR spectrum, which typically spans 800 ppm (367.3 Hz equals 1 ppm in a 400 MHz
NMR spectrum) while the 0.875 × 10⁻³ ppm/K chemical shift change of HOD in CDCl3 is
equivalent to a 7.29 × 10⁻³ % in a typical 12 ppm 1H NMR spectrum (400 Hz equal 1 ppm
in a 400 MHz NMR spectrum). The chemical shifts in both cases, HOD for 1H
spectroscopy and CF3COOH for 19F spectroscopy, may be considered insensitive to
temperature and can most often be neglected. As such, HOD in CDCl3 is a good
chemical-shift reference for in situ 1H NMR pH measurements while neat trifluoroacetic
acid is a good chemical-shift reference for 19F NMR pH measurements.
2.1.2. In situ NMR Temperature Measurements. Methanol and ethylene
glycol have been used as NMR thermometer [48-50], i.e., as temperature-sensing
compounds in 1H NMR spectroscopy. Temperature sensing molecules in NMR
spectroscopy must have a chemical shift difference between two signals that changes
with temperature according to a known functionality. While this functionality may be
preferred to be linear, any such relationship between the chemical shifts of two functional
groups and the sample temperature can be determined from a temperature calibration
curve. For example, Methanol is known as temperature sensing molecule for sample
temperatures between 178 and 330 K [50]. The calibration relationship is:
𝑇𝑇[K] = 409.0 − 36.54 ∆𝛿𝛿 − 21.85 (∆𝛿𝛿)2 (3)
where ∆𝛿𝛿 is the chemical shift difference between the two functional groups in ppm.
Ethylene glycol is another well-known temperature-sensing compound that can be
used at sample temperatures between 273 and 416 K. The corresponding equation to
19
calculate temperature shows a linear relationship [50] according to:
𝑇𝑇[𝐾𝐾] = 466.5 − 102.00 ∆𝛿𝛿 (4)
2.1.3. pH Micro-sensor Compounds. In situ NMR pH measurements are based
on specific chemicals, so-called micro-sensor compounds, that are added to the sample
solution and that show pH-dependent changes in signal intensities or chemical shifts. To
ensure the least interference of the pH micro-sensor compound with the pH of the
solution and thus warrant an accurate measurement of the sample pH, highly NMR-
sensitive pH micro-sensor compounds should be considered that can be used in very
small amounts. An investigation was conducted to determine the minimal amount of
micro-sensor compound that is needed to observe 1H and 19F NMR spectra without a
significant influence on the pH of the sample solution.
The investigation consisted of three steps: a) special NMR tubes were used to
determine the absolute concentration of the pH micro-sensor compound, b) experiments
were designed to determine the range of strong and homogeneous radiofrequency field
(B1 field) in the active sample volume, and c) the minimum number of nuclei needed for
NMR pH measurements in 1H and 19F experiments was determined. From the minimum
number of nuclei, it should generally be possible to calculate the influence of the micro-
sensor compound on the pH of the sample considering the acid/conjugated base
equilibrium of the micro-sensor compound and the quantity of the sample tested.
Figure 2.4 shows the newly developed in situ NMR pH measuring device
consisting of: (a) a 5-mm NMR tube filled with the NMR sample solution and the pH
micro-sensor compound, (b) a capillary tube (250-μm i.d. 350-μm o.d.) filled with
20
trifluoroacetic acid as chemical-shift reference, (c) a capillary tube (75-μm i.d. 150-μm
o.d.) filled with ethylene glycol or methanol as a temperature-sensing compound. As
shown in Fig. 2.3, the small capillary tube (c) is placed inside the larger capillary tube
(b). They are both mounted inside a separate 1-mm tube (d) that is then placed inside the
5-mm NMR tube (a).
This assembly is preferred because the 1-mm NMR tube (d) can easily be placed
concentrically along the long axis of the 5-mm NMR tube (a) using commercially
Figure 2.4. In situ NMR pH measurement device composed of (a) 5-mm NMR tube with sample and pH micro-sensor compound, (b) 250-µm capillary tube with chemical-shift reference compound (c) 75-µm capillary tube with temperature-sensing compound, (d) 1-mm NMR-tube to hold the capillary tubes (b) and (c), and (e) Teflon plugs to align the 1-mm NMR tube (d).
21
available Teflon plugs (e). It was found that the 75-µm capillary tube sample volume (c)
is sufficient for observing the resonances of ethylene glycol and methanol in 1H NMR
spectra acquired with typical parameters. Trifluoroacetic acid, however, requires a larger
capillary tube sample volume to be observed in both 1H and 19F NMR spectra.
2.2. NMR COIL- ACTIVE SAMPLE VOLUME
Figure 2.5 shows schematically how an NMR sample tube is positioned inside the
Helmholtz saddle coil of a typical superconducting NMR magnet. The coil is part of a
tuned circuit that delivers the radiofrequency (RF) pulses to the sample and detects the
RF response from the sample.
RF fields delivered by and detected from the coil must ideally be perpendicular to
the static magnetic field (B0) for maximum NMR sensitivity. The most efficient way to
deliver and detect RF fields is to use horizontally mounted solenoid coils. However,
horizontal coils would require the probe to be removed from the magnet when samples
are exchanged. A less efficient but more convenient assembly is the vertical Helmholtz
saddle coil as shown in Figure 2.4. The Helmholtz saddle coil generates a region of
nearly strong and homogeneous magnetic field perpendicular to B0, which allows NMR
sample tubes to be conveniently inserted into and ejected from the probe with a
pneumatic system [9, 51].
2.3. QUANTITATIVE NMR
Quantitative NMR (qNMR) refers to the use of NMR spectroscopy to determine
absolute amounts and concentrations of one or more chemical species in solution [52].
22
Conducting qNMR properly to a very high precision takes some special considerations.
In one-dimensional single-pulse NMR spectroscopy without hyperpolarization or
polarization transfer from or to other nuclei, the area under an NMR peak is directly
proportional to the number of NMR-active nuclei in the sample. The sample
concentration can therefore be deducted by comparison to signals from compounds of
known concentrations. Because the NMR response is equal for all nuclei of the same type
Figure 2.5: NMR sample tube in the magnetic radiofrequency field (B1) of Helmholtz saddle coils, which are typically used in superconducting NMR magnets. The B1 field is homogeneous in direction and amplitude as well as perpendicular to B0 in a limited volume of the sample (light orange).
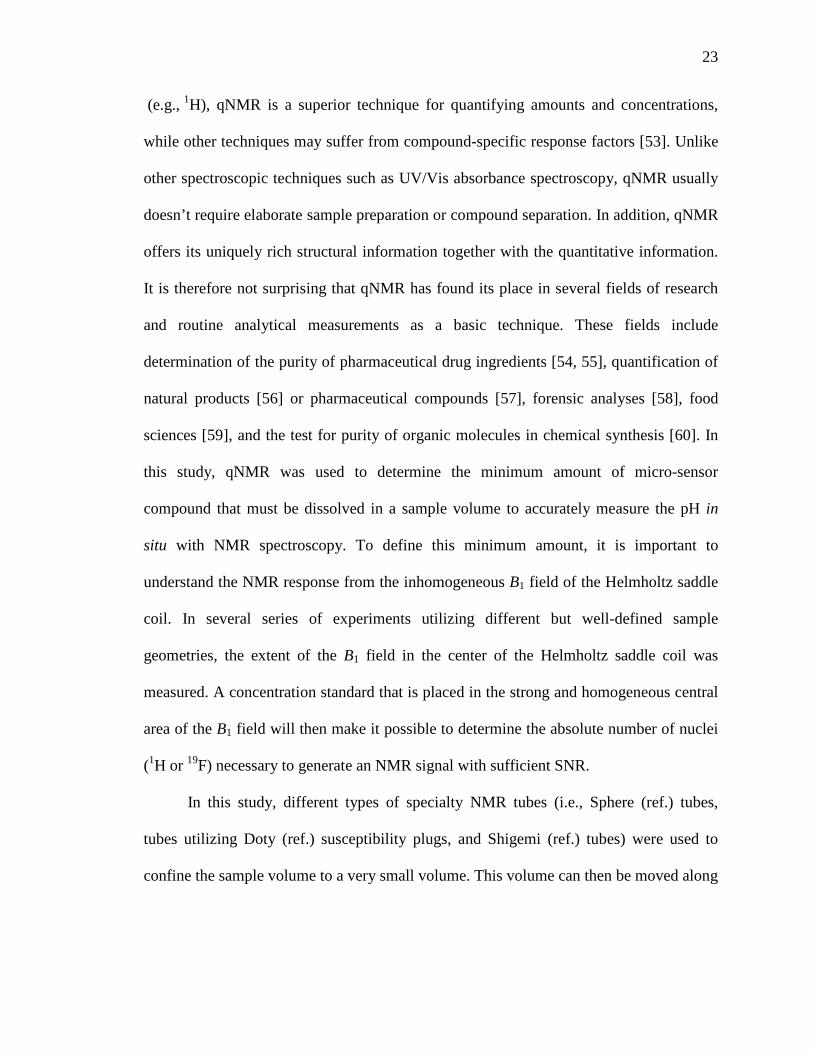
23
(e.g., 1H), qNMR is a superior technique for quantifying amounts and concentrations,
while other techniques may suffer from compound-specific response factors [53]. Unlike
other spectroscopic techniques such as UV/Vis absorbance spectroscopy, qNMR usually
doesn’t require elaborate sample preparation or compound separation. In addition, qNMR
offers its uniquely rich structural information together with the quantitative information.
It is therefore not surprising that qNMR has found its place in several fields of research
and routine analytical measurements as a basic technique. These fields include
determination of the purity of pharmaceutical drug ingredients [54, 55], quantification of
by Shigemi Inc. They are made from a special type of chemically inert hard glass and can
be purchased as matched to the magnetic susceptibility of different standard solvents.
Accordingly, different solvents require different tubes. A Shigemi tube consists of an
outer NMR tube (5 mm o.d.) and a tube insert (4.1 mm o.d.) that fits snuggly into the
outer tube. [64]
Figure 2.10. 1H NMR spectrum of ethanol dissolved in a 50 Vol% D2O/H2O solution using Doty susceptibility plugs.
30
Figure 2.12 shows a high-resolution 1H NMR spectrum of a solution prepared by
dissolving 5 μL of ethanol (94%, commercial grade) in 100 µL D2O (99.8% D). The
sample is completely and exclusively contained in the sample area of the Shigemi tube,
i.e, the sample is placed between of the suceptibility-matched hard-glass parts of the
Shigemi tube. The NMR spectrum exhibits a flat baseline and well-resolved J-couplings
of the ethanol’s CH2 quartet and CH3 triplet. Because the lower hard-glass area is
permanently fused with the NMR tube, no material can creep below the intended sample
volume. As a result, the Shigemi tube delivers the best results for the qNMR applications
in this work.
Figure 2.11. Schematic of Shigemi tube. A) length of NMR tube, B) inner diameter of Shigemi NMR sample tube, B’) outer diameter of tube insert, slightly smaller than B, C) length of susceptibility-matched hard glass enclosure, D) outer diameter of upper hard glass plug, a touch smaller than B.
31
2.3.4. Minimum Number of 1H and 19F Nuclei for qNMR Measurements.
From the discussion of the different types of specialty NMR tubes (Sections 2.3.1 –
2.3.3), the Shigemi tube was found to perform best for a determination of the minimum
number of NMR-active nuclei (e.g., protons in 1H NMR). In addition, the Shigemi tube
sample volume can easily be positioned in the center of the strong and homogeneous B1
field of the NMR probe.
A series of NMR experiments was conducted to determine the region of the
strong and homogenous B1 field. Figure 2.13 shows the principal setup for these
experiments, which were executed as follows: a) 0.40 mg ethanol was dissolved in
Figure 2.12. 1H NMR spectrum of a 4.8 Vol% ethanol (94%, commercial grade) D2O (99.8% D) solution in a susceptibility-matched Shigemi tube.
Sample: Ethanol in D2O (sample height:
32
833.0 mg D2O leading to 0.796 mL solution. b) 0.1086 mL of this solution was placed
between the hard-glass upper plug and the fixed hard-glass bottom of the Shigemi tube
leading to a 2.0-mm cylindrical sample height, c) the Shigemi tube was positioned in the
NMR probe such that the sample volume is placed in the center of the probe’s Helmholtz
saddle coils, d) a 1H-NMR spectrum was recorded. e) the sample volume was moved in
steps of 1 mm down from the center of the coil and another NMR spectrum recorded. f)
step e) was repeated until the sample reached 16 mm below the center of the coil, g) the
sample was re-positioned in the coils’ center, and again, a NMR spectrum was recorded,
h) steps e) and f) were repeated but this time by moving the sample up in steps of 1 mm
until the sample reached 16 mm above the coils’ center.
Figure 2.13. Setup for Shigemi tube experiments: the Shigemi tube was filled with a precisely measured 0.40 mg ethanol in 833.0 mg D2O solution, resulting in sample height of 2 mm. The sample was originally positioned in the center of Helmholtz saddle coil. In subsequent experiments, the sample area was moved down or up from the center of coil in steps of 1 mm.
33
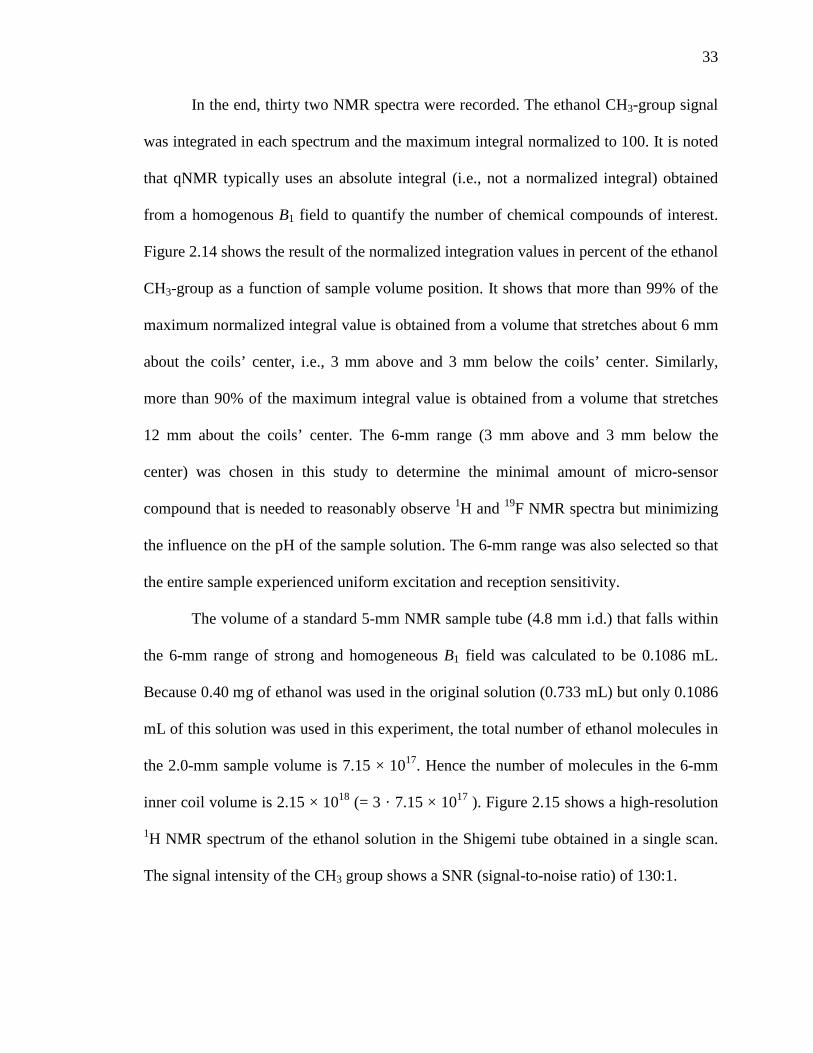
In the end, thirty two NMR spectra were recorded. The ethanol CH3-group signal
was integrated in each spectrum and the maximum integral normalized to 100. It is noted
that qNMR typically uses an absolute integral (i.e., not a normalized integral) obtained
from a homogenous B1 field to quantify the number of chemical compounds of interest.
Figure 2.14 shows the result of the normalized integration values in percent of the ethanol
CH3-group as a function of sample volume position. It shows that more than 99% of the
maximum normalized integral value is obtained from a volume that stretches about 6 mm
about the coils’ center, i.e., 3 mm above and 3 mm below the coils’ center. Similarly,
more than 90% of the maximum integral value is obtained from a volume that stretches
12 mm about the coils’ center. The 6-mm range (3 mm above and 3 mm below the
center) was chosen in this study to determine the minimal amount of micro-sensor
compound that is needed to reasonably observe 1H and 19F NMR spectra but minimizing
the influence on the pH of the sample solution. The 6-mm range was also selected so that
the entire sample experienced uniform excitation and reception sensitivity.
The volume of a standard 5-mm NMR sample tube (4.8 mm i.d.) that falls within
the 6-mm range of strong and homogeneous B1 field was calculated to be 0.1086 mL.
Because 0.40 mg of ethanol was used in the original solution (0.733 mL) but only 0.1086
mL of this solution was used in this experiment, the total number of ethanol molecules in
the 2.0-mm sample volume is 7.15 × 10¹⁷. Hence the number of molecules in the 6-mm
inner coil volume is 2.15 × 10¹⁸ (= 3 · 7.15 × 1017 ). Figure 2.15 shows a high-resolution
1H NMR spectrum of the ethanol solution in the Shigemi tube obtained in a single scan.
The signal intensity of the CH3 group shows a SNR (signal-to-noise ratio) of 130:1.
34
When the solution is diluted by a factor of 20, the SNR of the CH3 group will
change to 6.5:1. Even though this is a low value, an NMR signal at this SNR is still
sufficient to be observed and used for qNMR.
After the dilution by a factor of 20, the number of ethanol molecules that remain
in the 6-mm sample area is 1.07 × 10¹⁷ (= 2.15 × 10¹⁸ / 20). An increased number of
scans in an NMR experiment lead to a SNR that increases by the square root of the
number of scans.
Figure 2.14. Normalized integration values of the ethanol CH3-group in a 2-mm cylindrical sample height as a function of sample position, where the origin (distance = 0 mm) indicates the center of the Helmholtz saddle coils.
35
For example, when the number of scan is increased from 1 to 64, the SNR will
increase by a factor of 8 (i.e., from 6.5:1 to 52:1). However, there is a trade-off between
the number of scans and the time it takes to run an NMR experiment. For fast-changing
pH values, 64 scans (which take about 5 min to run the experiment) was found reasonable
for most NMR-pH studies. Conducting a 64-scan experiment makes it possible to reduce
the number of molecules that lead to a reasonable SNR in the NMR spectrum by another
factor of 8; accordingly the number of molecules can be reduced to 1.34 × 10¹⁶
(= 1.07 × 10¹⁷ / 8). Because the CH3 group of ethanol contains three 1H nuclei, the
number of nuclei contributing to the NMR signal in the 6-mm coil volume is actually
Figure 2.15. 1H NMR spectrum obtained from a single-scan experiment of 0.1086 mL from a solution of 0.40 mg ethanol in 833.0 mg D2O in a Shigemi tube. The SNR was determined at 130:1.
36
4.02 × 10¹⁶ (= 3 · 1.34 × 1016). Hence, 4.02 × 10¹⁶ is the minimum number of protons (or:
fluorine atoms) in the strong and homogeneous B1 field of a 400-MHz NMR magnet to
be observed and used for pH measurements.
37
3. MATERIALS AND METHODS
3.1. MATERIALS
3.1.1. pH Micro-sensor Compound Based on Changes in NMR Signal Intensity.
Aldrich, St. Louis, MO, USA) can be used as NMR pH micro-sensor compound in
aqueous solution. The signal intensities of all aromatic protons change in the range of
pH = 11.1 to 12.7, which renders the phenolphthalein system a primary paradigm for in
situ monitoring of pH by NMR spectroscopy with the advantage of a spectral pH
imprimatur. Figure 3.1 shows the two structures of phenolphthalein that are in an
equilibrium that shifts with the sample pH. Within the range of pH = 11.1 to 12.7, the
peak integrals of the left structure in Figure 3.1 decreases with increasing pH, while the
peak integrals of the right structure increases. Outside this range, only one of the two
types of phenolphthalein exists in sufficient concentration, and only the signals of this
one structures is observed. For comparison and calibration, the pH of the solution was
independently measured by using a pH electrode. The integral ratio of the peaks from the
two structures were determined and correlated to the values measured with the pH
electrode.
3.1.2. pH Micro-sensor Compound Based on NMR Chemical Shifts. Sodium
fluoride (NaF) was used as the NMR micro-sensor compound to measure the pH of
solutions based on chemical shifts. The 19F chemical shift of the F ion in sodium fluoride
solution changes with pH in two separate ranges, i.e., from pH = 1.0 to 4.0 and again from
pH = 11.0 to 14.0. Thus, the NaF solution system provides the paradigm of a spectral pH
imprimatur for in situ monitoring of pH by 19F NMR spectroscopy.
38
3.2. INSTRUMENTATION, KEY PARAMETERS, AND PROCEDURES
In our experiments, NMR data were acquired from two different NMR
spectrometers, a Bruker Avance III 400-MHz spectrometer using a 5-mm inverse
broadband probe with z-axis gradient and a Varian INOVA 400-MHz spectrometer using
a standard 5-mm broadband probe with z-axis gradient. The experiments were conducted
using a predefined 90° pulse program (parameter: pulprog = zg) without sample spinning.
A relaxation delay of d1 = 5 s was used for the in situ NMR pH measurements, while a
delay of d1 = 15 s was used for the qNMR measurements. The in situ NMR pH
measurements were acquired with 4 scans while the qNMR experiments were conducted
with 16 scans. No automatic phasing and signal integration routines were used for the
experiments conducted here because the current spectrometer software did not achieve
satisfactorily phased spectra with flat baselines. The following sequence of data
manipulations provided consistent results with high reproducibility and accuracy.
Figure 3.1. Structural difference of the pH indicator phenolphthalein depending on the pH (ref.).
pH = 11.1-12.6 pH = 12.2-12.7
39
3.2.1. NMR Signal Acquisition and Data Processing. A conventional Fast
Fourier transformation (FFT) of the recorded free induction decay (FID) data was
conducted. The line broadening (parameter: lb) was set to an exponential, matched line-
broadening value of lb = 0.3 Hz and a 1:1 zero filling of the FID data was applied; an
automatic phase correction (procedure: apk) of the spectral data was performed and, if
necessary, an additional manual phase correction was conducted based on the intensity of
the 13C satellite signals; the signal integral was calculated by the integration procedure of
the spectrometer software; if needed, subsequent corrections to the integral were
performed interactively through the BIAS and SLOPE functions until flat integration
lines were obtained to the right and to the left of the NMR signal.
3.2.2. Phenolphthalein 1H Experimental Procedures. In this series of
experiments, 7.7 mg of phenolphthalein was dissolved in 600 μL of D2O (99.8% D) and
an NMR spectrum was recorded. Thereafter, 3 μL of a 0.01 M NaOH solution in D2O
was added and another NMR spectrum recorded. This procedure was repeated until a
total of 30 μL of the 0.01 M NaOH solution was added. The spectra of the
phenolphthalein sample solutions at different pH values were recorded with the Varian
400-MHz high-field NMR spectrometer. NMR peaks of phenolphthalein were integrated
and compared with each other. For independent calibration, the pH values of the different
solutions were also measured with an electronic pH meter. The pH values from the
electronic pH meter were correlated with the 1H phenolphthalein peak integrals of the in
situ NMR pH measurements.
3.2.3. Sodium Fluoride 19F Experimental Procedures. In the 19F experiments,
the Bruker 400-MHz high-field NMR spectrometer was used to record NMR spectra of
40
NaF sample solutions at different pH values. The chemical shifts of the F- peaks at
various pH values were calibrated with standard measurements of the same solutions with
an electronic pH meter. As shown in Fig. 2.3. and mentioned in Chapter 2, the in situ NaF
NMR measurements also included temperature-sensing molecules and a standard external
reference solution. Thus, in this series of experiments the actual temperature was also
determined by NMR.
41
4. RESULTS
4.1. IN SITU PH MEASUREMENTS IN 1H NMR
The well-known pH indicator molecule Phenolphthalein, i.e., 3,3-Bis(4-hydroxy-
phenyl)-isobenzofuran-1(3H))-one, can also be used as an indicator to determine the pH
of a sample solution based on the change in NMR signal intensities. The 1H signal
intensities of phenolphthalein change as the phenolphthalein equilibrium changes from
the OH-depleted structure to the OH-rich structure (Fig. 4.1) in the range from pH = 11.1
to pH = 12.7. The resonances for the OH-depleted structure are marked by the four red
boxes while the five blue boxes indicate the NMR peaks of phenolphthalein in the OH-
rich form. Only one box (purple box) applies to both structures; however, the signal in
this box changes from a doublet to a triplet as the structure adds the OH-group. At values
below pH = 11.1, only signals from the OH-depleted form are recorded, while at values
above pH = 12.7, only signals from the OH-rich form are obtained. Between pH = 11.1
and pH = 12.7, the 1H signal intensities of both forms are visible and a precise
determination of pH is possible. The varying proportions of the phenolphthalein 1H
signals are shown in Figure 4.2.
From the red plots in Figure 4.2, it is evident that the signal integral of NMR
peaks reaches a maximum when 6 μL of the NaOH solution was added (pH = 12.2) to the
phenolphthalein sample solution. By adding more NaOH solution, the signal integrals of
the OH-depleted form of phenolphthalein decrease while the signal integrals of the OH-
rich form increase. The ratio between the red and blue data points is shown as a black
line, which can be used as a calibration curve to measure the pH of the solution.
42
4.2. IN SITU PH MEASUREMENTS IN 19F NMR
Aqueous sodium fluoride can be used as an indicator to measure the pH of an
NMR sample solution based on chemical shifts in 19F NMR spectra. The F ion acts as
the conjugated base of hydrogen fluoride (HF) and shows a very large dependency on the
sample pH. With increasing pH, the equilibrium of H2O + F ⇋ HF + OH
shifts more
toward the right side of the chemical equation, and the NMR signal shifts to less negative
Figure 4.1. 1H NMR spectra of phenolphthalein at a) pH = 11.1. and b) pH =12.7. Included are the two structures of phenolphthalein that are in varying equilibrium at different pH values.
A
B
43
ppm values, i.e., to the left of the 19F spectrum (Fig. 4.3). A similar effect is observed in
the 1H NMR spectrum, where the water signal shifts with increasing pH toward higher
ppm values (i.e., to the left of the spectrum). In both cases, the 19F and 1H nuclei,
respectively, become less electron shielded because. Figure 4.3 shows 19F chemical shift
differences in ppm of the F ion as a function of pH. The pH values were measured
independently by an electronic pH meter. For predictive purposes, a numerical 4-
parameter Chapman sigmoidal curve fit was conducted, and the equation
Figure 4.2. Integrated 1H NMR signal intensities of the OH-depleted (red data points) and OH-rich form (blue data points) of phenolphthalein as a function of pH. The black curve indicates the average ratio between red and blue data points.
44
was found to best fit the experimental data in the acidic range from pH = 1 to pH = 4. A
standard 4-parameter sigmoidal curve fit according to the equation
𝛿𝛿 = −118.8817 ppm + 20.5341 ppm
�1+exp�14.5302−pH0.4292 ��
(6)
was found to best fit the experimental data in the basic range pH = 11 to pH = 14.
Figure 4.4 shows NMR spectra of two compounds, pentafluorododecan-3-ol and
NaF, in aqueous solution. Both molecules can be used as pH micro-sensor compound;
however, while NaF is chemical-shift sensitive with respect to pH, the 19F signals of
pentafluorododecan-3-ol show intensity dependence. A series of NMR experiments was
Figure 4.3. 19F chemical shift (ppm) of the pH micro-sensor compound NaF in aqueous solution as a function of pH.
45
conducted to determine the chemical shift of the 19F signal of NaF at different pH values
from acidic to basic. The solution was prepared from 7.0 mg of NaF and 7.7 mg of
pentafluorododecan-3-ol dissolved in 600 μL of D2O (99.8% D). After recording the 19F
NMR spectrum, 2.5 μL of 0.1 M hydrochloric acid (HCl) was added changing the pH
from 10.00 (original solution) to 3.48. Another 19F NMR spectrum was recorded and
again 2.5 μL of 0.1 M HCl added. This time, the pH value changed from 3.48 to 3.17.
This procedure was repeated 3 more times until the pH finally reached pH = 1.50. In
another series of experiments 2.5 μL of 0.5 M NaOH was added so that the pH changed
from 10.00 (original solution) to 11.19. Again, a 19F NMR spectrum was recorded and
further 2.5 μL of 0.5 M NaOH added, changing the pH from 11.19 to 11.49. The
procedure was repeated 3 more times with recording NMR spectra after each step. The
final pH value reached pH = 13.25. Figure 4.4(a) shows three of the NMR spectra
F-
F-
F-
F-
F-
F-
B A
Figure 4.4 19F NMR spectra of pentafluorododecan-3-ol and micro-sensor compound NaF in aqueous solution at two ranges of pH (acidic and basic).
46
recorded at different pH values for the acidic solution (pH = 1.50, 2.11, 2.50). The 19F
signal of NaF shifts dramatically to the right when the solution becomes more acidic.
Figure 4.4 (b) shows three NMR spectra in basic solution (pH = 11.18, 11.78, 13.25).
Here, the 19F signal of NaF shifts less dramatically to the left as the solution becomes
more basic. The chemical shifts of the other compound, pentafluorododecan-3-ol, remain
constant in both basic and acidic solutions. However, the signal intensity changes
significantly with pH, so that it may also be used as 19F micro-sensor compound to
determine the pH values in sample solutions.
The drastic change in the chemical shift of the NaF signal allows a very precise
determination of the solution pH. It is estimated from the spectra in Figure 4.5 that the
NaF signal shifts by 20 ppm for a pH difference of ΔpH = 1. Because the resolution in
19F spectra is at least 0.2 ppm, a pH resolution of at least ΔpH = 0.01 can be predicted in
this range.
Figure 4.5. 19F NMR spectra of the pH micro-sensor compound NaF in the presence of pentafluorododecan-3-ol over the pH range from 3.58 to 4.55.
47
4.3. TEMPERATURE-DEPENDENT ADJUSTMENTS FOR 19F NMR pH MEASUREMENTS
To accurately determine the pH of a sample solution with NMR spectroscopy, it is
important to consider the temperature dependence of the chemical shift of 1H and 19F
NMR signals (Section 2.1.1). It is adviseable to measure the temperature together with
the pH in an NMR experiment. As mentioned earlier (Section 2.1.2), ethylene glycol or
methanol are appropriate temperature micro-sensor NMR compounds, which should be
added to the sample solution for in situ temperature determination.
Figure 4.6 shows experimentally derived changes in the chemical-shift difference
between the 19F NMR signals of NaF and trifluoroacetic acid (CF3COOH), i.e., in the
variable ∆(∆𝛿𝛿) . Room temperature (298 K) was set as the reference point for this
calibration, i.e., ∆(∆𝛿𝛿)298 K = 0 ppm. As reported in Section 2.1.1, the 19F signal of
trifluoroacetic acid shows very little temperature dependence and therefore was chosen as
a temperature-independent standard for 19F NMR measurements.
The temperature-dependent change in the chemical shift difference between the
NaF and trifluoroacetic acid signals follows a linear equation given by
∆(∆𝛿𝛿) = −16.67 ppm + 0.0556 𝑇𝑇 �ppmK� (7)
which is valid for the temperature range from 300 K to 330 K. Equation (7) can be used
to adjust for temperature-dependent chemical-shift changes. Accurate pH determinations
are therefore conducted by subtracting ∆(∆𝛿𝛿) from the experimentally determined 19F
chemical shift of NaF.
48
0
0.2
0.4
0.6
0.8
1
1.2
1.4
1.6
295 300 305 310 315 320 325 330
Diff
eren
ce in
Che
mic
al S
hift
D
iffer
ence
(∆(∆
δ)
Temperature (K)
Figure 4.6. Experimentally derived changes in the chemical shift difference between the 19F NMR signals of NaF and trifluoroacetic acid (CF3COOH) at different temperatures from 300 K to 330 K.
49
5. CONCLUSION
It has been demonstrated that phenolphthalein can be used as a 1H NMR pH
mirco-sensor compound in the range of pH = 11.2 to pH = 12.7. In this range, the signal
amplitudes of phenolphthalein strongly depend on the pH of the solution. A calibration
curve was established by the ratio of signal integrals from the OH-depleted form to the
OH-rich form of phenolphthalein as a function of pH. The pH value was measured
independently by an electronic pH meter.
It has also been demonstrated that NaF (sodium fluoride) can be used as pH
mirco-sensor compound in two different pH ranges (i.e., pH = 1.00 - 4.00 and pH = 11.00
- 14.00). The chemical shift of the 19F NMR signals of NaF exhibit a strong dependency
on the pH in these ranges, so that an accuracy of 0.01 in the pH value can easily be
achieved. For example, in the 400 MHz spectrometer used in this investigation, the 19F
chemical shift of NaF changed by more than 180 Hz when the pH was varied by only
0.01 from pH = 2.20 to 2.21.
Because compounds that are added to an aqueous solution may have an influence on
the pH and actually change its value, it is essential that the amount of NMR micro-sensor
compound added to the sample solution is minimized. Several quantitative NMR
(qNMR) experiments were conducted to determine the minimum amount of micro-sensor
compound that can be used for an in situ NMR pH experiment. For the qNMR
experiments, three types of specialized NMR tubes were chosen. Spherical NMR tubes
confine the entire NMR sample to a small spherical volume that can be placed in
different areas along the magnetic z axis inside the NMR probe. They can be used to
determine the inner, strongest, and most homogeneous portion of the RF coil’s B1 field.
50
Similar measurements can be achieved with Doty susceptibility plugs or Shigemi tubes.
The Shigemi tubes were found to show the best performance with respect to resolution
and signal-to-noise ratio (S/N). The B1 field strength along the magnetic z axis was
measured by the absolute signal intensity of the CH3-group signal of ethanol in
deuterated water (D2O). A range of 6 mm length along the magnetic z axis in the center
of coil was found to fall within 99% of the strongest B1 field. By reducing the
concentration of the sample solution and by additional stoichiometric calculations, a
minimum number of 4.02 × 10¹⁶ nuclei (1H or 19F) was found sufficient to observe NMR
signals in a 400-MHz NMR spectrometer.
A new in situ NMR pH measuring device was developed consisting of a 5-mm
NMR tube filled with the NMR sample solution and the pH micro-sensor compound. A
250-μm i.d. capillary tube filled with trifluoroacetic acid as chemical-shift reference and
a 75-μm i.d. capillary tube filled with ethylene glycol or methanol as temperature-sensing
compound were inserted into a 1-mm NMR tube, which was then placed into the center
of the 5-mm NMR tube and held concentrically in place by small Teflon plugs. Using the
calculated minimum number of nuclei needed for the in situ pH micro-sensor compound,
a 19F NMR signal of NaF was observed in five-minute experiments with only 64 scans.
For most accurate pH measurements with the new measuring device, it is essential
to know the temperature of the sample as well as the temperature dependence of the
chemical shifts of the pH-sensing NMR signals. Several temperature-dependent NMR
experiments were conducted and used to establish calibration curves, through which an
influence of temperature on the chemical shift can be corrected. After correction it can be
assumed that the chemical-shift differences are based only on variations in the pH. For
51
19F NMR spectroscopy, the signal of the trifluoroacetic acid CF3 group was found to have
the least temperature-dependent chemical-shift variations. This quality renders it a
superior, independent standard for temperature correction curves. Because the pH micro-
sensor compound for 1H NMR spectroscopy (phenolphthalein) is based on signal-
intensity changes rather than changes in the chemical shift, an independent temperature-
sensing compound may not be as necessary to correct for temperature-based chemical-
shift variations. However, the largely temperature independent 1H signal of the CH2 group
of ethylene glycol may be used as standard in 1H NMR spectroscopy.
52
BIBLIOGRAPHY
[1] G. Orgován and B. Noszál, "Electrodeless, accurate pH determination in highly basic media using a new set of 1 H NMR pH indicators," Journal of pharmaceutical and biomedical analysis, vol. 54, pp. 958-964, 2011.
[2] A. Djurdjevic-Pahl, C. Hewage, and J. P. G. Malthouse, "13C-NMR study of the inhibition of δ-chymotrypsin by a tripeptide-glyoxal inhibitor," Biochemical Journal, vol. 362, pp. 339-347, 2002.
[3] C. Gerardin, M. In, L. Allouche, M. Haouas, and F. Taulelle, "In situ pH probing of hydrothermal solutions by NMR," Chemistry of materials, vol. 11, pp. 1285-1292, 1999.
[4] S. Mori, S. M. Eleff, U. Pilatus, N. Mori, and P. van Zijl, "Proton NMR spectroscopy of solvent‐saturable resonances: A new approach to study pH effects in situ," Magnetic resonance in medicine, vol. 40, pp. 36-42, 1998.
[5] F. Taulelle, M. Haouas, C. Gerardin, C. Estournes, T. Loiseau, and G. Ferey, "NMR of microporous compounds: from in situ reactions to solid paving," Colloids and Surfaces A: Physicochemical and Engineering Aspects, vol. 158, pp. 299-311, 1999.
[6] Ø. B. Vistad, D. E. Akporiaye, F. Taulelle, and K. P. Lillerud, "Morpholine, an in situ 13C NMR pH meter for hydrothermal crystallogenesis of SAPO-34," Chemistry of materials, vol. 15, pp. 1650-1654, 2003.
[7] A. S. Ojugo, P. M. McSheehy, D. J. McIntyre, C. McCoy, M. Stubbs, M. O. Leach, et al., "Measurement of the extracellular pH of solid tumours in mice by magnetic resonance spectroscopy: a comparison of exogenous 19F and 31P probes," NMR in Biomedicine, vol. 12, pp. 495-504, 1999.
[9] G. Facey. (2008, March 17, 2008). University if Ottawa NMR Facility Blog.
[10] "Measuring pH of Concentrated Samples," Water Analysis Instruments, Thermo Fisher Scientific2014.
[11] D. Harvey, pH electrodes: Thermo Scientific, 2014.
[12] J. A. Illingworth, "A common source of error in pH measurements," Biochemical Journal, vol. 195, pp. 259-262, 1981.
[13] Y. Wei, K. F. Hsueh, and G. W. Jang, "A study of leucoemeraldine and effect of redox reactions on molecular weight of chemically prepared polyaniline," Macromolecules, vol. 27, pp. 518-525, 1994.
[14] Y. Shiau, P. Fernandez, M. J. Jackson, and S. McMonagle, "Mechanisms maintaining a low-pH microclimate in the intestine," American Journal of Physiology-Gastrointestinal and Liver Physiology, vol. 248, pp. G608-G617, 1985.
[15] H. Deligianni and L. T. Romankiw, "In situ surface pH measurement during electrolysis using a rotating pH electrode," IBM Journal of Research and Development, vol. 37, pp. 85-95, 1993.
[16] M. Dillon, "Measurement of plasma renin activity by semi-micro radioimmunoassay of generated angiotensin I," Journal of clinical pathology, vol. 28, pp. 625-630, 1975.
[17] T. A. Balisky and S. S. Patel, "Electrode refilling mechanism," ed: Google Patents, 2005.
[18] P. G. Righetti and T. Caravaggio, "Isoelectric points and molecular weights of proteins: A table," Journal of Chromatography A, vol. 127, pp. 1-28, 1976.
[19] D. Fortin, B. Davis, and T. Beveridge, "Role of Thiobacillus and sulfate-reducing bacteria in iron biocycling in oxic and acidic mine tailings," FEMS Microbiology Ecology, vol. 21, pp. 11-24, 1996.
[20] E. Clarke and A. H. Baldwin, "Responses of wetland plants to ammonia and water level," Ecological Engineering, vol. 18, pp. 257-264, 2002.
[21] K. Popov, H. Rönkkömäki, and L. H. Lajunen, "Guidelines for NMR measurements for determination of high and low pKa values (IUPAC Technical Report)," Pure and applied chemistry, vol. 78, pp. 663-675, 2006.
[23] N. Incooperate. (2016). pH Electrodes for NMR Sample Tubes.
[24] T. H. Nguyen, T. Venugopala, S. Chen, T. Sun, K. T. Grattan, S. E. Taylor, et al., "Fluorescence based fibre optic pH sensor for the pH 10–13 range suitable for corrosion monitoring in concrete structures," Sensors and Actuators B: Chemical, vol. 191, pp. 498-507, 2014.
[25] R. M. B. Silverstein, G. C. Morrill, T. C. R. M. Silverstein, G. C. Bassler, and T. C. Morrill, Spectrometric identification of organic compounds, 1974.
[26] O. K. Baryshnikova, T. C. Williams, and B. D. Sykes, "Internal pH indicators for biomolecular NMR," Journal of biomolecular NMR, vol. 41, pp. 5-7, 2008.
54
[27] U. F. Röhrig and D. Sebastiani, "NMR chemical shifts of the rhodopsin chromophore in the dark state and in bathorhodopsin: A hybrid QM/MM molecular dynamics study," The Journal of Physical Chemistry B, vol. 112, pp. 1267-1274, 2008.
[28] A. M. Weljie, J. Newton, P. Mercier, E. Carlson, and C. M. Slupsky, "Targeted profiling: quantitative analysis of 1H NMR metabolomics data," Analytical chemistry, vol. 78, pp. 4430-4442, 2006.
[29] M. Tiainen, H. Maaheimo, M. Niemitz, P. Soininen, and R. Laatikainen, "Spectral analysis of 1H coupled 13C spectra of the amino acids: Adaptive spectral library of amino acid 13C isotopomers and positional fractional 13C enrichments," Magnetic Resonance in Chemistry, vol. 46, pp. 125-137, 2008.
[30] J. Zhang, C. Lin, Z. Feng, and Z. Tian, "Mechanistic studies of electrodeposition for bioceramic coatings of calcium phosphates by an in situ pH-microsensor technique," Journal of Electroanalytical Chemistry, vol. 452, pp. 235-240, 1998.
[31] Z. Szakács, G. Hägele, and R. Tyka, "1 H/31 P NMR pH indicator series to eliminate the glass electrode in NMR spectroscopic pK a determinations," Analytica chimica acta, vol. 522, pp. 247-258, 2004.
[32] S. Moret, P. J. Dyson, and G. Laurenczy, "Direct, in situ determination of pH and solute concentrations in formic acid dehydrogenation and CO 2 hydrogenation in pressurised aqueous solutions using 1 H and 13C NMR spectroscopy," Dalton Transactions, vol. 42, pp. 4353-4356, 2013.
[33] M. Ryan, T. Liu, F. W. Dahlquist, and O. H. Griffith, "A catalytic diad involved in substrate-assisted catalysis: NMR study of hydrogen bonding and dynamics at the active site of phosphatidylinositol-specific phospholipase C," Biochemistry, vol. 40, pp. 9743-9750, 2001.
[34] H.-M. Kao and C. P. Grey, "Probing the Brønsted and Lewis Acidity of Zeolite HY: A 1H/27Al and 15N/27Al TRAPDOR NMR Study of Monomethylamine Adsorbed on HY," The Journal of Physical Chemistry, vol. 100, pp. 5105-5117, 1996.
[35] J. V. Shanks, "In situ NMR systems," Current issues in molecular biology, vol. 3, p. 15, 2001.
[36] C.-C. Tai, J. Pitts, J. C. Linehan, A. D. Main, P. Munshi, and P. G. Jessop, "In situ formation of ruthenium catalysts for the homogeneous hydrogenation of carbon dioxide," Inorganic chemistry, vol. 41, pp. 1606-1614, 2002.
[37] P. Wipf and S. Ribe, "Zirconocene-zinc transmetalation and in situ catalytic asymmetric addition to aldehydes," The Journal of Organic Chemistry, vol. 63, pp. 6454-6455, 1998.
55
[38] T. L. Legerton, K. Kanamori, R. L. Weiss, and J. D. Roberts, "Measurements of cytoplasmic and vacuolar pH in Neurospora using nitrogen-15 nuclear magnetic resonance spectroscopy," Biochemistry, vol. 22, pp. 899-903, 1983.
[39] R. B. Moon and J. H. Richards, "Determination of intracellular pH by 31P magnetic resonance," Journal of Biological Chemistry, vol. 248, pp. 7276-7278, 1973.
[40] J. K. Roberts, N. Wade-Jardetzky, and O. Jardetsky, "Intracellular pH measurements by phosphorus-31 nuclear magnetic resonance. Influence of factors other than pH on phosphorus-31 chemical shifts," Biochemistry, vol. 20, pp. 5389-5394, 1981.
[41] G. Bloch, J. Chase, M. Avison, and R. Shulman, "In Vivo31P NMR measurement of glucose‐6‐phosphate in the rat muscle after exercise," Magnetic resonance in medicine, vol. 30, pp. 347-350, 1993.
[42] S. Adler, E. Shoubridge, and G. Radda, "Estimation of cellular pH gradients with 31P-NMR in intact rabbit renal tubular cells," American Journal of Physiology-Cell Physiology, vol. 247, pp. C188-C196, 1984.
[43] A. Stevens, P. Morris, R. Iles, P. Sheldon, and J. Griffiths, "5-fluorouracil metabolism monitored in vivo by 19F NMR," British journal of cancer, vol. 50, p. 113, 1984.
[44] C. J. Deutsch and J. S. Taylor, "Intracellular pH as Measured by 19F NMRa," Annals of the New York Academy of Sciences, vol. 508, pp. 33-47, 1987.
[45] K. Wade, J. Troke, C. Macdonald, I. Wilson, and J. Nicholson, "19F NMR studies of the metabolism of trifluoromethylaniline," in Bioanalysis of Drugs and Metabolites, Especially Anti-Inflammatory and Cardiovascular, ed: Springer, 1988, pp. 383-388.
[46] J. B. Gerken, "Measurement of pH by NMR spectroscopy in concentrated aqueous fluoride buffers," Journal of fluorine chemistry, vol. 132, pp. 68-70, 2011.
[47] C. J. Jameson, ed. University of Illinois at Chicago: Cynthia J. Jameson.
[48] K. Gademann, B. Jaun, D. Seebach, R. Perozzo, L. Scapozza, and G. Folkers, "Temperature‐Dependent NMR and CD Spectra of β‐Peptides: On the Thermal Stability of β‐Peptide Helices–Is the Folding Process of β‐Peptides Non‐cooperative?," Helvetica chimica acta, vol. 82, pp. 1-11, 1999.
[49] J. R. Lyerla, C. S. Yannoni, and C. A. Fyfe, "Chemical applications of variable-temperature CPMAS NMR spectroscopy in solids," Accounts of Chemical Research, vol. 15, pp. 208-216, 1982.
56
[50] D. S. Raiford, C. L. Fisk, and E. D. Becker, "Calibration of methanol and ethylene glycol nuclear magnetic resonance thermometers," Analytical Chemistry, vol. 51, pp. 2050-2051, 1979.
[51] F. D. Doty, G. Entzminger, J. Kulkarni, K. Pamarthy, and J. P. Staab, "Radio frequency coil technology for small‐animal MRI," NMR in Biomedicine, vol. 20, pp. 304-325, 2007.
[52] C. Simmler, J. G. Napolitano, J. B. McAlpine, S.-N. Chen, and G. F. Pauli, "Universal quantitative NMR analysis of complex natural samples," Current opinion in biotechnology, vol. 25, pp. 51-59, 2014.
[53] L. Chi, "CapPack devices for enhanced qNMR measurements in 1 H NMR spectroscopy," 2015.
[54] R. Espina, L. Yu, J. Wang, Z. Tong, S. Vashishtha, R. Talaat, et al., "Nuclear magnetic resonance spectroscopy as a quantitative tool to determine the concentrations of biologically produced metabolites: implications in metabolites in safety testing," Chemical research in toxicology, vol. 22, pp. 299-310, 2008.
[55] G. F. Pauli, T. Godecke, B. U. Jaki, and D. C. Lankin, "Quantitative 1H NMR. Development and potential of an analytical method: an update," Journal of natural products, vol. 75, pp. 834-851, 2012.
[56] X. Liu, M. X. Kolpak, J. Wu, and G. C. Leo, "Automatic analysis of quantitative NMR data of pharmaceutical compound libraries," Analytical chemistry, vol. 84, pp. 6914-6918, 2012.
[57] P. A. Hays, "Proton nuclear magnetic resonance spectroscopy (NMR) methods for determining the purity of reference drug standards and illicit forensic drug seizures," Journal of Forensic Science, vol. 50, pp. JFS2005124-19, 2005.
[58] P. Maes, Y. B. Monakhova, T. Kuballa, H. Reusch, and D. W. Lachenmeier, "Qualitative and quantitative control of carbonated cola beverages using 1H NMR spectroscopy," Journal of agricultural and food chemistry, vol. 60, pp. 2778-2784, 2012.
[59] P. Lacy, R. T. McKay, M. Finkel, A. Karnovsky, S. Woehler, M. J. Lewis, et al., "Signal intensities derived from different NMR probes and parameters contribute to variations in quantification of metabolites," PloS one, vol. 9, p. e85732, 2014.
[60] S. Mahajan and I. P. Singh, "Determining and reporting purity of organic molecules: why qNMR," Magnetic Resonance in Chemistry, vol. 51, pp. 76-81, 2013.