In-situ Photoelectron Microspectroscopy and Imaging of Electrochemical Processes at the Electrodes of a Self-driven Cell Benedetto Bozzini 1 , Matteo Amati 2 , Luca Gregoratti 2 & Maya Kiskinova 2 1 Dipartimento di Ingegneria dell’Innovazione, Universita ` del Salento, via Monteroni, 73100 Lecce – Italy, 2 Elettra-Sinctrotrone Trieste S.C.p.A., S.S. 14, km 163.5 in Area Science Park, 34149 Trieste-Basovizza – Italy. The challenges in development of solid oxide fuel cells (SOFCs) are reducing their dimensions and increasing their efficiency and durability, which requires physicochemical characterization at micro-scales of the device components during operation conditions. Recently, the unique potential of scanning photoelectron microscopy (SPEM) has been demonstrated by in-situ studies of externally-driven SOFCs, which mimic real devices. Here we overcome the gap between model and real systems using a single-chamber NijYSZjMn SOFC, supporting a range of self-driven electrochemical reactions in variable gas environments and temperatures. The reported SPEM results, obtained during spontaneous electrochemical processes occurring in reactive gas ambient, demonstrate the chemical evolution of electrodic material, in particular the lateral distribution of the oxidation state and the induced local potential, clearly marking out the electrochemically most active micro-regions of the Ni anode. E lectrochemistry is strongly contributing to the current energetic agenda aiming at efficient, renewable and eco-sustainable generation, conversion and storage of electrical energy. Although the mechanisms of energy conversion and storage are different, a common feature in devices such as fuel cells, batteries, ultracapa- citors and photoelectrochemical cells is that all important processes occur at the electrode/electrolyte interface. Indeed, the most commonly used current–voltage (I–V) characteristics provide information about the overall electrochemical reaction, but for improving the electrode efficiency and impeding degradation processes, cor- relative knowledge about the status of electrode surface under realistic operating conditions is of fundamental importance. In this respect, photoelectron spectroscopy (PES) has long been recognized as a powerful tool for understanding and solving important issues relevant to operation of electrochemical devices, where the perform- ance is strongly dependent on the electrode surface status 1 . The recent in-situ photoelectron spectroscopy (PES) studies of model SOFCs with lateral resolution ranging from few tens of mm 2,3 , to a sub-mm 4–7 , have provided a wealth of information about the electrochemical, mass transport and side processes occurring in operating devices. Chiefly, due to experimental difficulties, the electrodic reactions in these studies were driven by an external power source using proper polarization levels. In brief, the obtained results have revealed the evolution of the electrode chemical state and electrochemical activity across the electrode/electrolyte interfaces, as well as the occurrence of undesired irreversible processes reducing the durability of the device components, such as temperature- and potential-promoted changes in the electrode microstructure and corrosion, mass transport of interconnect and electrode constituents and deposition of contaminants. Unfortunately, in such model extern- ally-driven systems the coupling between the anodic and cathodic phenomena, which plays a crucial role in the real self-driven cells in terms of efficiency and durability, are intrinsically excluded. This inspired the present ‘under operando’ investigation with a self-driven cell, where the potentials at the electrodes are natural con- sequence of electric current generated by electrochemical processes controlled by the gas (H 2 or H 2 1 O 2 ) reactant ambient. Relevant to the present study, but both methodologically and experimentally different as an approach, is the reported evolution of the oxidation states of Ni electrodes in externally-driven SOFCs. In these studies reversible oxidation-reduction processes were induced independently of the gas ambient only by changing the sign of the applied bias 5,6,8 . OPEN SUBJECT AREAS: FUEL CELLS SURFACE SPECTROSCOPY ELECTROCATALYSIS CHARACTERIZATION AND ANALYTICAL TECHNIQUES Received 22 March 2013 Accepted 16 August 2013 Published 4 October 2013 Correspondence and requests for materials should be addressed to B.B. (benedetto. [email protected]) or M.K. (maya. kiskinova@elettra. trieste.it) SCIENTIFIC REPORTS | 3 : 2848 | DOI: 10.1038/srep02848 1
Transcript
In-situ Photoelectron Microspectroscopyand Imaging of ElectrochemicalProcesses at the Electrodes of aSelf-driven CellBenedetto Bozzini1, Matteo Amati2, Luca Gregoratti2 & Maya Kiskinova2
1Dipartimento di Ingegneria dell’Innovazione, Universita del Salento, via Monteroni, 73100 Lecce – Italy, 2Elettra-SinctrotroneTrieste S.C.p.A., S.S. 14, km 163.5 in Area Science Park, 34149 Trieste-Basovizza – Italy.
The challenges in development of solid oxide fuel cells (SOFCs) are reducing their dimensions andincreasing their efficiency and durability, which requires physicochemical characterization at micro-scalesof the device components during operation conditions. Recently, the unique potential of scanningphotoelectron microscopy (SPEM) has been demonstrated by in-situ studies of externally-driven SOFCs,which mimic real devices. Here we overcome the gap between model and real systems using asingle-chamber NijYSZjMn SOFC, supporting a range of self-driven electrochemical reactions in variablegas environments and temperatures. The reported SPEM results, obtained during spontaneouselectrochemical processes occurring in reactive gas ambient, demonstrate the chemical evolution ofelectrodic material, in particular the lateral distribution of the oxidation state and the induced localpotential, clearly marking out the electrochemically most active micro-regions of the Ni anode.
Electrochemistry is strongly contributing to the current energetic agenda aiming at efficient, renewable andeco-sustainable generation, conversion and storage of electrical energy. Although the mechanisms of energyconversion and storage are different, a common feature in devices such as fuel cells, batteries, ultracapa-
citors and photoelectrochemical cells is that all important processes occur at the electrode/electrolyte interface.Indeed, the most commonly used current–voltage (I–V) characteristics provide information about the overallelectrochemical reaction, but for improving the electrode efficiency and impeding degradation processes, cor-relative knowledge about the status of electrode surface under realistic operating conditions is of fundamentalimportance. In this respect, photoelectron spectroscopy (PES) has long been recognized as a powerful tool forunderstanding and solving important issues relevant to operation of electrochemical devices, where the perform-ance is strongly dependent on the electrode surface status1. The recent in-situ photoelectron spectroscopy (PES)studies of model SOFCs with lateral resolution ranging from few tens of mm2,3, to a sub-mm4–7, have provided awealth of information about the electrochemical, mass transport and side processes occurring in operatingdevices. Chiefly, due to experimental difficulties, the electrodic reactions in these studies were driven by anexternal power source using proper polarization levels. In brief, the obtained results have revealed the evolutionof the electrode chemical state and electrochemical activity across the electrode/electrolyte interfaces, as well asthe occurrence of undesired irreversible processes reducing the durability of the device components, such astemperature- and potential-promoted changes in the electrode microstructure and corrosion, mass transport ofinterconnect and electrode constituents and deposition of contaminants. Unfortunately, in such model extern-ally-driven systems the coupling between the anodic and cathodic phenomena, which plays a crucial role in thereal self-driven cells in terms of efficiency and durability, are intrinsically excluded. This inspired the present‘under operando’ investigation with a self-driven cell, where the potentials at the electrodes are natural con-sequence of electric current generated by electrochemical processes controlled by the gas (H2 or H2 1 O2)reactant ambient. Relevant to the present study, but both methodologically and experimentally different as anapproach, is the reported evolution of the oxidation states of Ni electrodes in externally-driven SOFCs. In thesestudies reversible oxidation-reduction processes were induced independently of the gas ambient only by changingthe sign of the applied bias5,6,8.
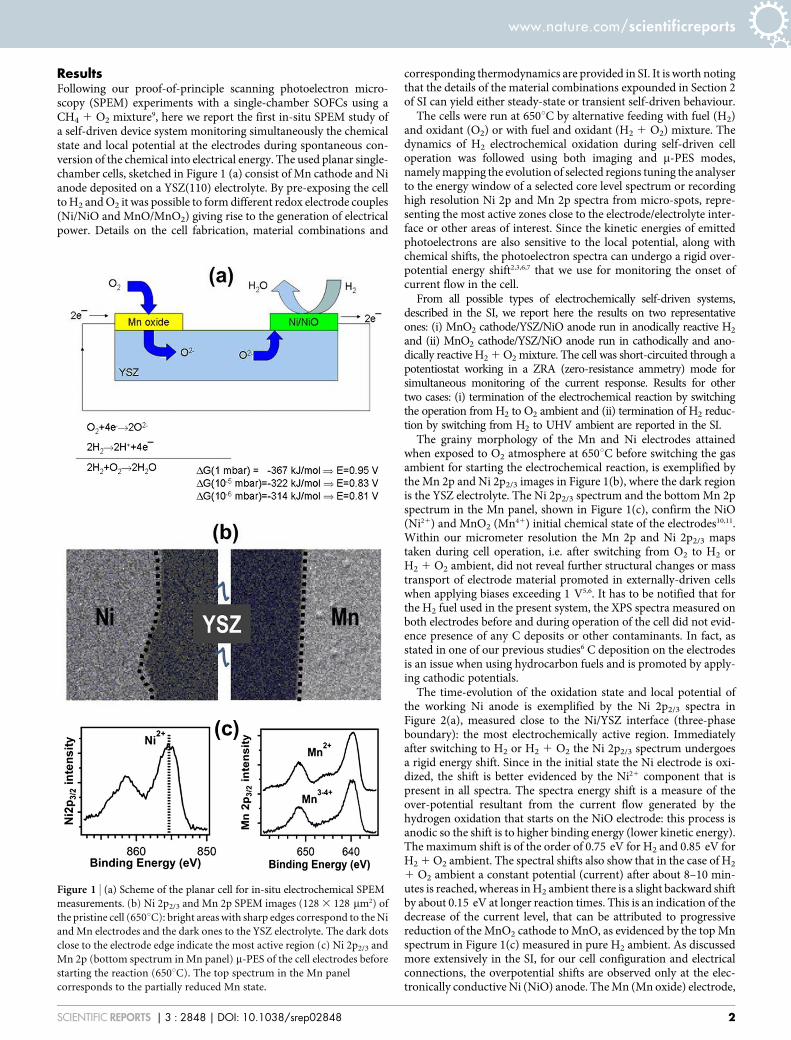
ResultsFollowing our proof-of-principle scanning photoelectron micro-scopy (SPEM) experiments with a single-chamber SOFCs using aCH4 1 O2 mixture9, here we report the first in-situ SPEM study ofa self-driven device system monitoring simultaneously the chemicalstate and local potential at the electrodes during spontaneous con-version of the chemical into electrical energy. The used planar single-chamber cells, sketched in Figure 1 (a) consist of Mn cathode and Nianode deposited on a YSZ(110) electrolyte. By pre-exposing the cellto H2 and O2 it was possible to form different redox electrode couples(Ni/NiO and MnO/MnO2) giving rise to the generation of electricalpower. Details on the cell fabrication, material combinations and
corresponding thermodynamics are provided in SI. It is worth notingthat the details of the material combinations expounded in Section 2of SI can yield either steady-state or transient self-driven behaviour.
The cells were run at 650uC by alternative feeding with fuel (H2)and oxidant (O2) or with fuel and oxidant (H2 1 O2) mixture. Thedynamics of H2 electrochemical oxidation during self-driven celloperation was followed using both imaging and m-PES modes,namely mapping the evolution of selected regions tuning the analyserto the energy window of a selected core level spectrum or recordinghigh resolution Ni 2p and Mn 2p spectra from micro-spots, repre-senting the most active zones close to the electrode/electrolyte inter-face or other areas of interest. Since the kinetic energies of emittedphotoelectrons are also sensitive to the local potential, along withchemical shifts, the photoelectron spectra can undergo a rigid over-potential energy shift2,3,6,7 that we use for monitoring the onset ofcurrent flow in the cell.
From all possible types of electrochemically self-driven systems,described in the SI, we report here the results on two representativeones: (i) MnO2 cathode/YSZ/NiO anode run in anodically reactive H2
and (ii) MnO2 cathode/YSZ/NiO anode run in cathodically and ano-dically reactive H2 1 O2 mixture. The cell was short-circuited through apotentiostat working in a ZRA (zero-resistance ammetry) mode forsimultaneous monitoring of the current response. Results for othertwo cases: (i) termination of the electrochemical reaction by switchingthe operation from H2 to O2 ambient and (ii) termination of H2 reduc-tion by switching from H2 to UHV ambient are reported in the SI.
The grainy morphology of the Mn and Ni electrodes attainedwhen exposed to O2 atmosphere at 650uC before switching the gasambient for starting the electrochemical reaction, is exemplified bythe Mn 2p and Ni 2p2/3 images in Figure 1(b), where the dark regionis the YSZ electrolyte. The Ni 2p2/3 spectrum and the bottom Mn 2pspectrum in the Mn panel, shown in Figure 1(c), confirm the NiO(Ni21) and MnO2 (Mn41) initial chemical state of the electrodes10,11.Within our micrometer resolution the Mn 2p and Ni 2p2/3 mapstaken during cell operation, i.e. after switching from O2 to H2 orH2 1 O2 ambient, did not reveal further structural changes or masstransport of electrode material promoted in externally-driven cellswhen applying biases exceeding 1 V5,6. It has to be notified that forthe H2 fuel used in the present system, the XPS spectra measured onboth electrodes before and during operation of the cell did not evid-ence presence of any C deposits or other contaminants. In fact, asstated in one of our previous studies6 C deposition on the electrodesis an issue when using hydrocarbon fuels and is promoted by apply-ing cathodic potentials.
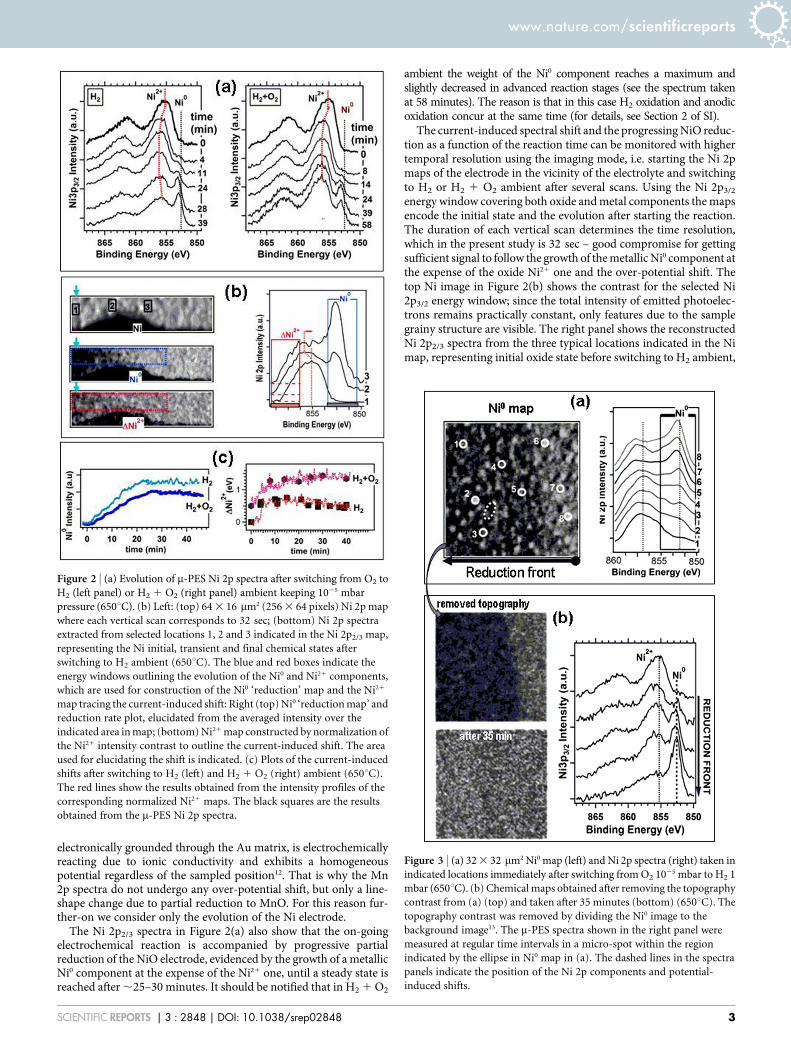
The time-evolution of the oxidation state and local potential ofthe working Ni anode is exemplified by the Ni 2p2/3 spectra inFigure 2(a), measured close to the Ni/YSZ interface (three-phaseboundary): the most electrochemically active region. Immediatelyafter switching to H2 or H2 1 O2 the Ni 2p2/3 spectrum undergoesa rigid energy shift. Since in the initial state the Ni electrode is oxi-dized, the shift is better evidenced by the Ni21 component that ispresent in all spectra. The spectra energy shift is a measure of theover-potential resultant from the current flow generated by thehydrogen oxidation that starts on the NiO electrode: this process isanodic so the shift is to higher binding energy (lower kinetic energy).The maximum shift is of the order of 0.75 eV for H2 and 0.85 eV forH2 1 O2 ambient. The spectral shifts also show that in the case of H2
1 O2 ambient a constant potential (current) after about 8–10 min-utes is reached, whereas in H2 ambient there is a slight backward shiftby about 0.15 eV at longer reaction times. This is an indication of thedecrease of the current level, that can be attributed to progressivereduction of the MnO2 cathode to MnO, as evidenced by the top Mnspectrum in Figure 1(c) measured in pure H2 ambient. As discussedmore extensively in the SI, for our cell configuration and electricalconnections, the overpotential shifts are observed only at the elec-tronically conductive Ni (NiO) anode. The Mn (Mn oxide) electrode,
Figure 1 | (a) Scheme of the planar cell for in-situ electrochemical SPEMmeasurements. (b) Ni 2p2/3 and Mn 2p SPEM images (128 3 128 mm2) of
the pristine cell (650uC): bright areas with sharp edges correspond to the Ni
and Mn electrodes and the dark ones to the YSZ electrolyte. The dark dots
close to the electrode edge indicate the most active region (c) Ni 2p2/3 and
Mn 2p (bottom spectrum in Mn panel) m-PES of the cell electrodes before
starting the reaction (650uC). The top spectrum in the Mn panel
electronically grounded through the Au matrix, is electrochemicallyreacting due to ionic conductivity and exhibits a homogeneouspotential regardless of the sampled position12. That is why the Mn2p spectra do not undergo any over-potential shift, but only a line-shape change due to partial reduction to MnO. For this reason fur-ther-on we consider only the evolution of the Ni electrode.
The Ni 2p2/3 spectra in Figure 2(a) also show that the on-goingelectrochemical reaction is accompanied by progressive partialreduction of the NiO electrode, evidenced by the growth of a metallicNi0 component at the expense of the Ni21 one, until a steady state isreached after ,25–30 minutes. It should be notified that in H2 1 O2
ambient the weight of the Ni0 component reaches a maximum andslightly decreased in advanced reaction stages (see the spectrum takenat 58 minutes). The reason is that in this case H2 oxidation and anodicoxidation concur at the same time (for details, see Section 2 of SI).
The current-induced spectral shift and the progressing NiO reduc-tion as a function of the reaction time can be monitored with highertemporal resolution using the imaging mode, i.e. starting the Ni 2pmaps of the electrode in the vicinity of the electrolyte and switchingto H2 or H2 1 O2 ambient after several scans. Using the Ni 2p3/2
energy window covering both oxide and metal components the mapsencode the initial state and the evolution after starting the reaction.The duration of each vertical scan determines the time resolution,which in the present study is 32 sec – good compromise for gettingsufficient signal to follow the growth of the metallic Ni0 component atthe expense of the oxide Ni21 one and the over-potential shift. Thetop Ni image in Figure 2(b) shows the contrast for the selected Ni2p3/2 energy window; since the total intensity of emitted photoelec-trons remains practically constant, only features due to the samplegrainy structure are visible. The right panel shows the reconstructedNi 2p2/3 spectra from the three typical locations indicated in the Nimap, representing initial oxide state before switching to H2 ambient,
Figure 2 | (a) Evolution of m-PES Ni 2p spectra after switching from O2 toH2 (left panel) or H2 1 O2 (right panel) ambient keeping 1025 mbarpressure (650uC). (b) Left: (top) 64 3 16 mm2 (256 3 64 pixels) Ni 2p map
where each vertical scan corresponds to 32 sec; (bottom) Ni 2p spectra
extracted from selected locations 1, 2 and 3 indicated in the Ni 2p2/3 map,
representing the Ni initial, transient and final chemical states after
switching to H2 ambient (650uC). The blue and red boxes indicate the
energy windows outlining the evolution of the Ni0 and Ni21 components,
which are used for construction of the Ni0 ‘reduction’ map and the Ni21
map tracing the current-induced shift: Right (top) Ni0 ‘reduction map’ and
reduction rate plot, elucidated from the averaged intensity over the
indicated area in map; (bottom) Ni21 map constructed by normalization of
the Ni21 intensity contrast to outline the current-induced shift. The area
used for elucidating the shift is indicated. (c) Plots of the current-induced
shifts after switching to H2 (left) and H2 1 O2 (right) ambient (650uC).
The red lines show the results obtained from the intensity profiles of the
corresponding normalized Ni21 maps. The black squares are the results
obtained from the m-PES Ni 2p spectra.
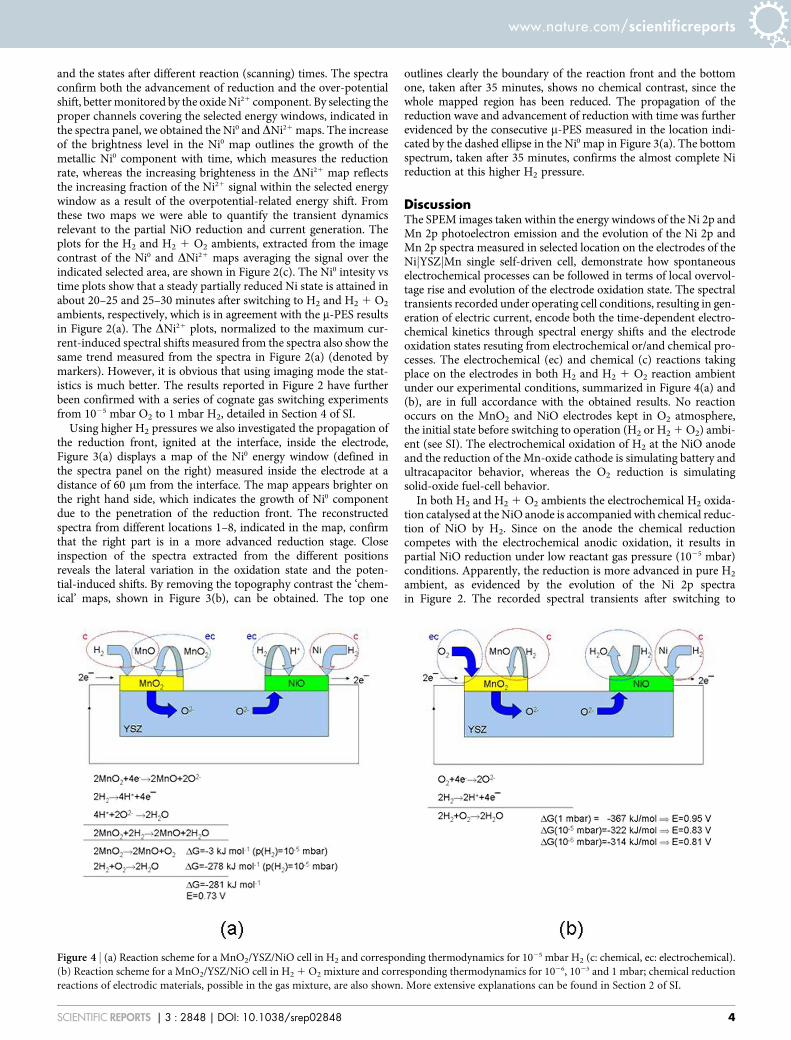
Figure 3 | (a) 32 3 32 mm2 Ni0 map (left) and Ni 2p spectra (right) taken inindicated locations immediately after switching from O2 1025 mbar to H2 1mbar (650uC). (b) Chemical maps obtained after removing the topography
contrast from (a) (top) and taken after 35 minutes (bottom) (650uC). The
topography contrast was removed by dividing the Ni0 image to the
background image13. The m-PES spectra shown in the right panel were
measured at regular time intervals in a micro-spot within the region
indicated by the ellipse in Ni0 map in (a). The dashed lines in the spectra
panels indicate the position of the Ni 2p components and potential-
and the states after different reaction (scanning) times. The spectraconfirm both the advancement of reduction and the over-potentialshift, better monitored by the oxide Ni21 component. By selecting theproper channels covering the selected energy windows, indicated inthe spectra panel, we obtained the Ni0 and DNi21 maps. The increaseof the brightness level in the Ni0 map outlines the growth of themetallic Ni0 component with time, which measures the reductionrate, whereas the increasing brighteness in the DNi21 map reflectsthe increasing fraction of the Ni21 signal within the selected energywindow as a result of the overpotential-related energy shift. Fromthese two maps we were able to quantify the transient dynamicsrelevant to the partial NiO reduction and current generation. Theplots for the H2 and H2 1 O2 ambients, extracted from the imagecontrast of the Ni0 and DNi21 maps averaging the signal over theindicated selected area, are shown in Figure 2(c). The Ni0 intesity vstime plots show that a steady partially reduced Ni state is attained inabout 20–25 and 25–30 minutes after switching to H2 and H2 1 O2
ambients, respectively, which is in agreement with the m-PES resultsin Figure 2(a). The DNi21 plots, normalized to the maximum cur-rent-induced spectral shifts measured from the spectra also show thesame trend measured from the spectra in Figure 2(a) (denoted bymarkers). However, it is obvious that using imaging mode the stat-istics is much better. The results reported in Figure 2 have furtherbeen confirmed with a series of cognate gas switching experimentsfrom 1025 mbar O2 to 1 mbar H2, detailed in Section 4 of SI.
Using higher H2 pressures we also investigated the propagation ofthe reduction front, ignited at the interface, inside the electrode,Figure 3(a) displays a map of the Ni0 energy window (defined inthe spectra panel on the right) measured inside the electrode at adistance of 60 mm from the interface. The map appears brighter onthe right hand side, which indicates the growth of Ni0 componentdue to the penetration of the reduction front. The reconstructedspectra from different locations 1–8, indicated in the map, confirmthat the right part is in a more advanced reduction stage. Closeinspection of the spectra extracted from the different positionsreveals the lateral variation in the oxidation state and the poten-tial-induced shifts. By removing the topography contrast the ‘chem-ical’ maps, shown in Figure 3(b), can be obtained. The top one
outlines clearly the boundary of the reaction front and the bottomone, taken after 35 minutes, shows no chemical contrast, since thewhole mapped region has been reduced. The propagation of thereduction wave and advancement of reduction with time was furtherevidenced by the consecutive m-PES measured in the location indi-cated by the dashed ellipse in the Ni0 map in Figure 3(a). The bottomspectrum, taken after 35 minutes, confirms the almost complete Nireduction at this higher H2 pressure.
DiscussionThe SPEM images taken within the energy windows of the Ni 2p andMn 2p photoelectron emission and the evolution of the Ni 2p andMn 2p spectra measured in selected location on the electrodes of theNijYSZjMn single self-driven cell, demonstrate how spontaneouselectrochemical processes can be followed in terms of local overvol-tage rise and evolution of the electrode oxidation state. The spectraltransients recorded under operating cell conditions, resulting in gen-eration of electric current, encode both the time-dependent electro-chemical kinetics through spectral energy shifts and the electrodeoxidation states resuting from electrochemical or/and chemical pro-cesses. The electrochemical (ec) and chemical (c) reactions takingplace on the electrodes in both H2 and H2 1 O2 reaction ambientunder our experimental conditions, summarized in Figure 4(a) and(b), are in full accordance with the obtained results. No reactionoccurs on the MnO2 and NiO electrodes kept in O2 atmosphere,the initial state before switching to operation (H2 or H2 1 O2) ambi-ent (see SI). The electrochemical oxidation of H2 at the NiO anodeand the reduction of the Mn-oxide cathode is simulating battery andultracapacitor behavior, whereas the O2 reduction is simulatingsolid-oxide fuel-cell behavior.
In both H2 and H2 1 O2 ambients the electrochemical H2 oxida-tion catalysed at the NiO anode is accompanied with chemical reduc-tion of NiO by H2. Since on the anode the chemical reductioncompetes with the electrochemical anodic oxidation, it results inpartial NiO reduction under low reactant gas pressure (1025 mbar)conditions. Apparently, the reduction is more advanced in pure H2
ambient, as evidenced by the evolution of the Ni 2p spectrain Figure 2. The recorded spectral transients after switching to
Figure 4 | (a) Reaction scheme for a MnO2/YSZ/NiO cell in H2 and corresponding thermodynamics for 1025 mbar H2 (c: chemical, ec: electrochemical).(b) Reaction scheme for a MnO2/YSZ/NiO cell in H2 1 O2 mixture and corresponding thermodynamics for 1026, 1025 and 1 mbar; chemical reduction
reactions of electrodic materials, possible in the gas mixture, are also shown. More extensive explanations can be found in Section 2 of SI.
operation conditions, represent the time-dependent electrochemicalkinetics through overvoltage-induced spectral shifts, recorded bothin the spectral and imaging modes. Note the very good agreementbetween the numbers predicted for the potential generated from theelectrochemical reaction and the one measured from the spectralshifts and reported in Figure 2(c). Another very important findingis that there is no correlation between the oxidation state of the anoderesulting from the chemical reaction (reduction by H2 in the presentsystem) and the potential generated from the electrochemical reac-tion: it is evident comparing the reduction rate and potential changesmanifested by the plots in Figure 2(c). The results show that thepotential reaches a maximum within 5–10 minutes whereas thesteady state reduction state is attained after 25–30 minutes. Thiscan be attributed to the fact that the steady state is determined bythe competition between chemical reduction rate and anodic oxida-tion rate.
The MnO2 cathode can undergo electrochemical reduction toMnO while catalyzing O2 reduction: the O22 ions, released to YSZ,move to the anode to produce water reacting with H1. MnO2 can alsoundergo reduction in H2 ambient, but the MnO is the stable form inH2 environment, as confirmed by our measurements and detailed inSection 2 of the Supplementary Information (SI) and referencestherein contained.
These first SPEM results obtained following in-situ the evolutionof chemical state and local potential at the electrodes of a NijYSZjMnsingle self-driven cell have shed light on competing electrochemicaland chemical processes occurring in real electrochemical devicesgenerating electrical current. They demonstrate the great potentialof the advanced experimental approach we used, to gain insight intoelectrochemical and chemical processes taking place in energy con-version systems, which could guide the design of next-generationdevices with improved performance.
MethodsThe experiments were performed with the SPEM operated at Elettra-SincrotroneTrieste14. The SPEM imaging mode can map the elemental, chemical state and chargedistribution by collecting photoelectrons emitted within a selected kinetic energywindow, covered by the 48 channels of the detector, while raster-scanning the spe-cimen with respect to the microprobe. Each detector channel measures electrons withspecific kinetic energy, which provides 48 images and also allows the reconstructionof the spectrum corresponding to this window from a selected micro-area. The betterspectral resolution (0.18 eV) of the second microspot PES mode (m-PES) providesmore precise information for the chemical state and local potential with lateralresolution down to 100 nm15. Electrochemical measurements were made with a PARpotentiostat.
1. Corcoran, C. J. et al. Application of XPS to study electrocatalysts for fuel cells.J. Power Sources 195, 7856–7879 (2010).
2. Zhang, C. et al. Measuring fundamental properties in operating solid oxideelectrochemical cells by using in situ X-ray photoelectron spectroscopy. NatureMaterials 9, 944–949 (2010).
3. Zhang, C. et al. Multielement Activity Mapping and Potential Mapping in SolidOxide Electrochemical Cells through the use of operando XPS. ACS Catal. 2,229722304 (2012).
4. Bozzini, B. et al. Soft X-ray imaging and spectromicroscopy: new insights inchemical state and morphology of key components in operating fuel cells.Chemistry-A European Journal 18, 10196–10210 (2012).
5. Bozzini, B. et al. In-situ X-ray spectromicroscopy investigation of the materialstability of SOFC metal interconnects in operating electrochemical cell.ChemSusChem 4, 1099–1103 (2011).
6. Bozzini, B. et al. Micro scale evolution of surface chemistry and morphology of thekey components in operating hydrocarbon-fuelled SOFC. J. Phys. Chem. C 116,23188–23193 (2012).
7. Bozzini, B. et al. In situ electrochemical X-ray spectromicroscopy investigation ofthe reduction/reoxidation dynamics of Ni-Cu Solid Oxide Fuel Cell anodicmaterial in contact with a Cr interconnect in 2 3 1026 mbar O2. J. Phys. Chem. C116, 7243–7248 (2012).
8. El Galbaly, F., McCarty, K. F., Bluhm, H. & McDaniel, A. H. Oxidation stages of Nielectrodes in solid oxide fuel cell environments. Phys. Chem.Chem. Phys 15,8334–8341 (2013).
9. Bozzini, B. et al. In situ photoelectron microspectroscopy during the operation of asingle-chamber SOFC. Electrochem. Comm. 24, 104–107 (2012).
10. Biesinger, M. C. et al. X-ray photoelectron spectroscopic chemical statequantification of mixed nickel metal, oxide and hydroxide systems. Surf. InterfaceAnal. 42, 324–332 (2009).
11. Biesinger, M. C. et al. Resolving surface chemical states in XPS analysis of first rowtransition metals, oxides and hydroxides: Cr, Mn, Fe, Co and Ni. Appl. Surf. Sci.257, 2717–2730 (2011).
12. Benaissa, M., Jose-Yacaman, M., Xiao, T. D. & Strutt, P. R. Microstructural studyof hollandite-type MnO2 nano-fibers. Appl. Phys. Lett. 70, 2120–2122 (1997).
13. Gunther, S., Kolmakov, A., Kovac, J. & Kiskinova, M. Artefact formation inscanning photoelectron emission microscopy. Ultramicroscopy 75, 35–51 (1998).
14. http://www.elettra.trieste.it/elettra-beamlines/escamicroscopy.html date of access:August 9th, 2013
15. Gregoratti, L. et al. 48-Channel electron detector for photoemission spectroscopyand microscopy. Rev. Scient. Instr. 75, 64–69 (2004).
Author contributionsB.B. and M.K. have contributed equally in elaborating the data, writing the main manuscriptand preparing the figures. M.A. and L.G. set up and run the ESCAmicroscopy beamline andcontributed to the quantitative elaboration of the XPS spectra and SPEM images. M.A., B.B.and L.G. performed the beamtime. B.B. designed and fabricated the electrochemical cells, incollaboration with the TASC Laboratory of Elettra.
Additional informationSupplementary information accompanies this paper at http://www.nature.com/scientificreports
Competing financial interests: The authors declare no competing financial interests.
How to cite this article: Bozzini, B., Amati, M., Gregoratti, L. & Kiskinova, M. In-situPhotoelectron Microspectroscopy and Imaging of Electrochemical Processes at theElectrodes of a Self-driven Cell. Sci. Rep. 3, 2848; DOI:10.1038/srep02848 (2013).
This work is licensed under a Creative Commons Attribution-NonCommercial-ShareAlike 3.0 Unported license. To view a copy of this license,