Turkish J. Eng. Env. Sci. 36 (2012) , 179 – 194. c T ¨ UB ˙ ITAK doi:10.3906/muh-1104-9 In-situ stress measurements by hydraulic fracturing method at Gotvand Dam site, Iran Reza ZIAIE MOAYED 1, ∗ , Ehsan IZADI 2 , Mohsen FAZLAVI 3 1 Civil Engineering Department, Imam Khomeini International University, Qazvin-IRAN e-mail: R [email protected]2 Civil Engineering Department, Imam Khomeini International University, Qazvin-IRAN 3 Earthquake Research Center, Tehran - IRAN Received: 13.04.2011 Abstract A set of hydraulic fracturing tests were conducted for determining in situ stresses in 10 inclined and vertical boreholes ranging in depth from 30 to 100 m at locations of hydropower plant tunnels of the Gotvand Dam site in the southwest of Iran. The rock in the studied area is formed by the sequence of sandstone, clay stone, and mudstone layers of the Aghajari (AJ) formation, and by thick conglomerate layers of the Bakhtiari (BK) formation. Note that the AJ formation is located underneath the BK formation. The in situ tests were carried out by using conventional systems with special high pressure rods and straddle packer tools. The tests were conducted both in fractured and intact rocks. The measurements yielded an orientation of the maximum horizontal stress of N 30 ◦ ± 5 ◦ (NE-SW), which is generally the same as directions indicated by focal mechanisms solutions from earthquakes and fault conditions in the location of the area studied. Key Words: Gotvand Dam, in situ stress, hydraulic fracturing test 1. Introduction Knowledge of field stresses is very important in many problems dealing with rocks in civil, mining, and petroleum engineering. The modern rock mechanics engineer has to be well acquainted with the basis of rock stresses and rock stress measurements. The need for understanding in situ stresses in rocks has been recognized by geologists and engineers for a long time and many methods have been proposed to measure these stresses since the early 20th century. Hydraulic injection stress measurements for determining in situ underground stresses are used in different areas such as dam and tunnel construction, earthquake prediction, and oil and gas source designing all over the world (Haimson and Fairhurst, 1970; Cornet and Julien, 1989; Ziaie Moayed et al., 2008; Jeffrey et al., 2010). The appeal of hydraulic fracturing test (HFT) for in situ stress measurements comes from its relatively simple operation and easy interpretation. This technique was first introduced by Clark in 1949. Then it was developed by Hubbert and Willis (1957), Scheidegger (1962), Kehle (1964), Fairhurst (1964), Haimson ∗ Corresponding author 179
1Civil Engineering Department, Imam Khomeini International University, Qazvin-IRANe-mail: R [email protected]
2Civil Engineering Department, Imam Khomeini International University, Qazvin-IRAN3Earthquake Research Center, Tehran - IRAN
Received: 13.04.2011
Abstract
A set of hydraulic fracturing tests were conducted for determining in situ stresses in 10 inclined and
vertical boreholes ranging in depth from 30 to 100 m at locations of hydropower plant tunnels of the Gotvand
Dam site in the southwest of Iran. The rock in the studied area is formed by the sequence of sandstone, clay
stone, and mudstone layers of the Aghajari (AJ) formation, and by thick conglomerate layers of the Bakhtiari
(BK) formation. Note that the AJ formation is located underneath the BK formation. The in situ tests
were carried out by using conventional systems with special high pressure rods and straddle packer tools.
The tests were conducted both in fractured and intact rocks. The measurements yielded an orientation of
the maximum horizontal stress of N 30◦ ± 5◦ (NE-SW), which is generally the same as directions indicated
by focal mechanisms solutions from earthquakes and fault conditions in the location of the area studied.
Key Words: Gotvand Dam, in situ stress, hydraulic fracturing test
1. Introduction
Knowledge of field stresses is very important in many problems dealing with rocks in civil, mining, and petroleumengineering. The modern rock mechanics engineer has to be well acquainted with the basis of rock stresses androck stress measurements. The need for understanding in situ stresses in rocks has been recognized by geologistsand engineers for a long time and many methods have been proposed to measure these stresses since the early20th century.
Hydraulic injection stress measurements for determining in situ underground stresses are used in differentareas such as dam and tunnel construction, earthquake prediction, and oil and gas source designing all over theworld (Haimson and Fairhurst, 1970; Cornet and Julien, 1989; Ziaie Moayed et al., 2008; Jeffrey et al., 2010).
The appeal of hydraulic fracturing test (HFT) for in situ stress measurements comes from its relativelysimple operation and easy interpretation. This technique was first introduced by Clark in 1949. Then itwas developed by Hubbert and Willis (1957), Scheidegger (1962), Kehle (1964), Fairhurst (1964), Haimson
∗Corresponding author
179
ZIAIE MOAYED, IZADI, FAZLAVI
and Fairhurst (1967 and 1970), Fairhurst (1974), and some others. This technique consists of creating ahydraulic fracture inside a borehole by injecting a fluid inside the sealed interval and determining the mechanicalcharacteristics of rock such as shut-in pressure of fractures and tensile strength of rock.
Different methods of fracturing such as hydraulic test on intact or preexisting fractures, sleeve fracturing,and hydro jacking are designed to study the behavior of principal stresses by means of hydraulic concepts(Baumgartner and Rummel, 1989).
Several studies have been carried out on hydraulic fracturing methods in Iran. Ajalloeian et al . (2011)reported the results and evaluation of hydraulic jacking and hydraulic fracturing tests conducted on the Aghajari(AJ) formation in different depths. Shadizadeh et al .(2009) performed hydraulic fracturing tests on a Bangestanreservoir site, Ahwaz. They performed an extreme test program to find the best layer to perform hydraulicfracturing tests. They stated that the Ilam formation could be a good candidate for this.
The aim of this study was to analyze and assess the results of hydraulic fracturing tests at the GotvandDam site, Iran, to determine the magnitude and orientation of the principal stresses.
2. General geology of the region
The Gotvand Dam site is located on the AJ and Bakhtiari (BK) formations as shown in Figure 1. AJ is mainlyformed by the sequence of brownish to grayish sandstones with clay stone inter-bedded layers and siltstones.The BK formation is generally formed by thick conglomerate layers with lime and silica cement. These thicklayers are generally separated by sandstone and claystone interbedded layers. The rock in the area studied ismainly formed by the sequence of AJ layers, especially the mudstone and siltstone layers. Furthermore, thefault is perpendicular to the dam axes (Ziaie Moayed et al., 2008).
Figure 1. Geological profile in dam axis.
3. Drilling and sampling
Borehole drillings and hydraulic fracturing tests were carried out at 3 separate stations of the hydropower planttunnels of the Gotvand Dam site. The locations of these stations (marked T2, YB, and LP) are shown inFigure 2.
180
ZIAIE MOAYED, IZADI, FAZLAVI
Figure 2. Locations of hydropower plant tunnels of the Gotvand Dam site and test stations of HFT.
Ten boreholes ranging in depth from 30 to 100 m were drilled to explore the features of undergroundlayers and to conduct hydraulic fracturing tests. More information related to the boreholes is given in Table1. A drilling machine (SD300) capable of drilling vertical and horizontal boreholes was used (Figure 3). Theapplied drilling method was continuous coring with a diameter of 101 mm.
Figure 1. Depth and orientation of the boreholes in Gotvand Dam for HFT.
No. Station Borehole DIPPlunge Borehole
Direction length (m)1
LPLPHF1 90 — 60
2 LPHF2 0 — 603 LPHF3 90 — 554
YBYBHF1 90 — 50
5 T2HF 90 — 100
Figure 3. Drilling machine (SD300) while drilling horizontal borehole.
The YB and T2 stations’ elevation is equal to the tunnel level and the LP station has a lower elevationthan river level. This difference between tunnel level and river level is about 80 m as illustrated in Figure 4.
As shown in Figure 4, the overburden of each station is equal to 70 m, 130 m, and 240 m for LP, YB,and T2 stations, respectively. It may be expected that the principal stress orientations are affected by themagnitudes of different overburden stresses at the stations.
181
ZIAIE MOAYED, IZADI, FAZLAVI
Tunnel level
River level
Terrain
T2 YB
LP
240 m
130 m
80 m70 m
Figure 4. Comparison between tunnel and river level at the LP, YB, and T2 stations.
4. Test equipment and methodology
The hydraulic fracturing test (HFT) and hydraulic test in pre-existing fracture (HTPF) at the Gotvand sitewere carried out using the main engineering equipment including:
• Three-piston electromotor pumps with controlled pressure capacity and flow of maximum 350 Pa and 1
m3 /s, respectively.
• Hydraulic fracturing double packer with 95 mm diameter with the capacity of maximum pressure of 450Pa.
• Ultrasonic flow meter
• Pressure sensor and data logger
• High pressure hoses and sealing rods capable of tolerating high water pressure
• Impression packer and pertinent items used to observe fractures and their orientation
• Borehole camera and compass
• Other accessories and tools such as container, winch, air compressor.
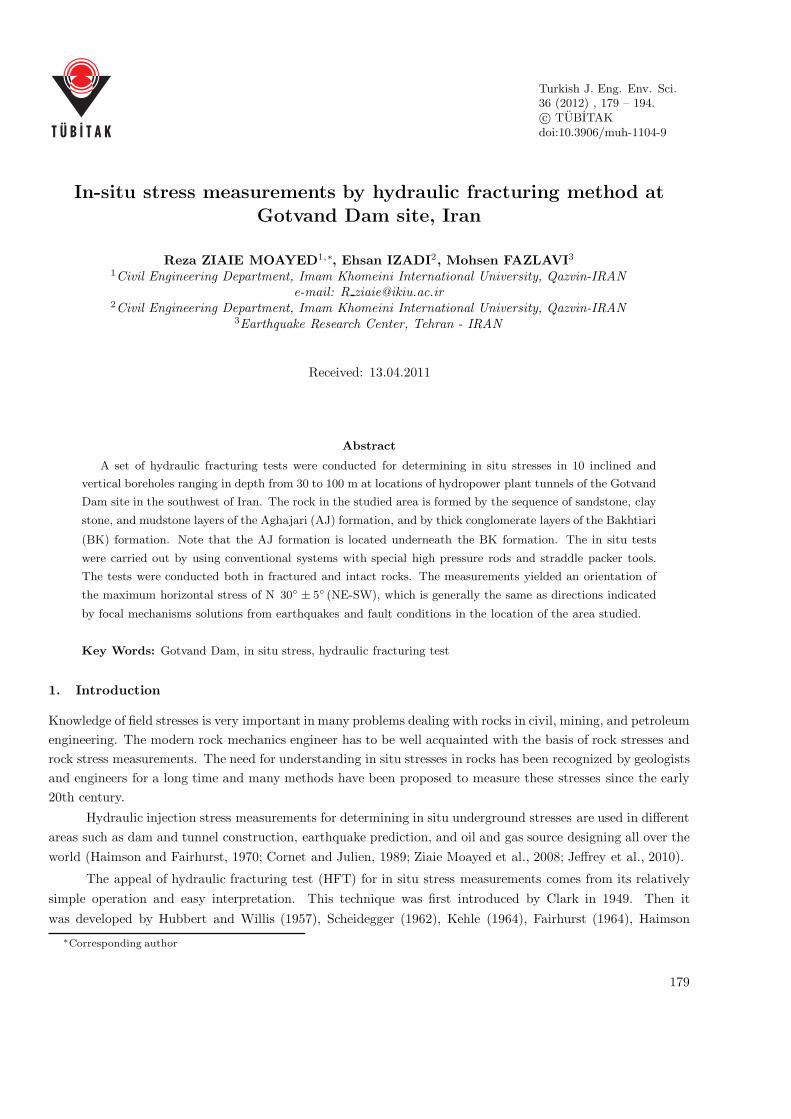
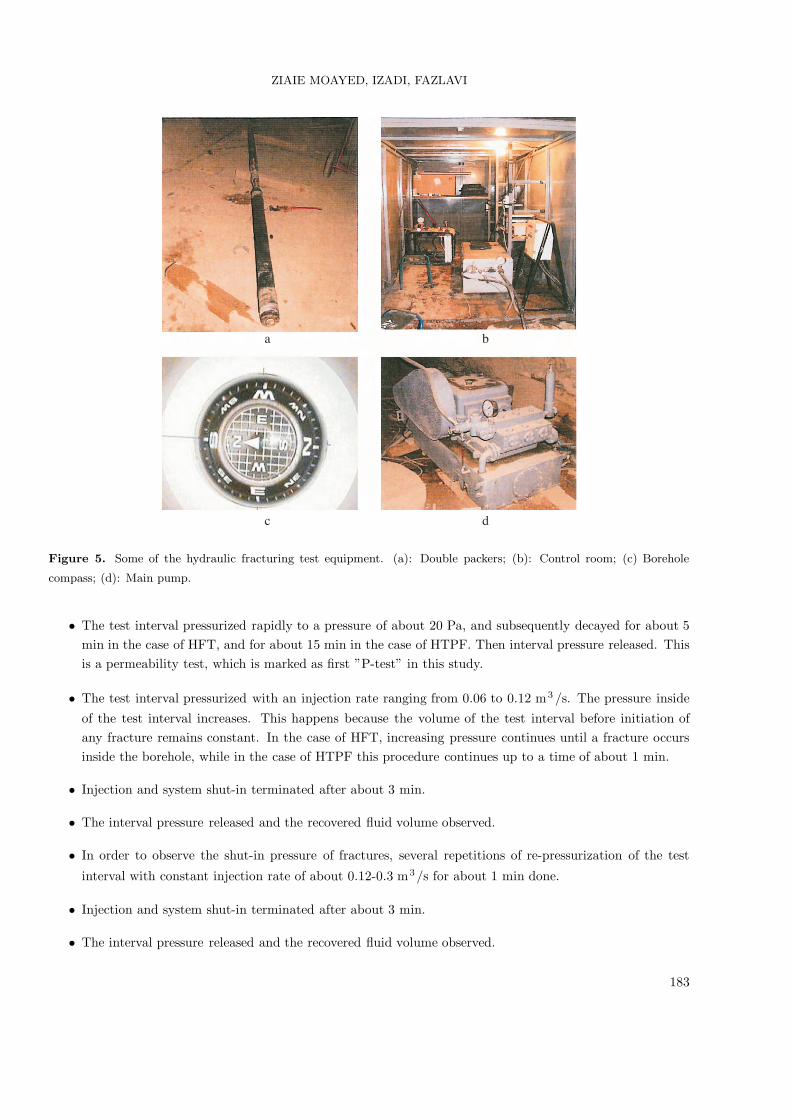
Some of the pieces of equipment used are shown in Figure 5.
The test procedure followed exactly the ASTM standard and ISRM suggested method (ASTM D4645,
1992; Haimson et al., 2003; Haimson and Cornet, 2003; Hanson, 2004).
Suitable test sections in each borehole were selected on the basis of the analysis of the rock core materialand borehole logs. For HFT, homogeneous borehole sections without visible fractures were selected and, forHTPF tests, fractured sections mainly with different spatial orientation were selected.
After the installation of the equipment and the packer to the desired depth, the tests started with thefollowing steps (Klee and Rummel, 2004):
• The packer inflated to a pressure of 49-59 Pa.
182
ZIAIE MOAYED, IZADI, FAZLAVI
a b
c d
Figure 5. Some of the hydraulic fracturing test equipment. (a): Double packers; (b): Control room; (c) Borehole
compass; (d): Main pump.
• The test interval pressurized rapidly to a pressure of about 20 Pa, and subsequently decayed for about 5min in the case of HFT, and for about 15 min in the case of HTPF. Then interval pressure released. Thisis a permeability test, which is marked as first ”P-test” in this study.
• The test interval pressurized with an injection rate ranging from 0.06 to 0.12 m3 /s. The pressure insideof the test interval increases. This happens because the volume of the test interval before initiation ofany fracture remains constant. In the case of HFT, increasing pressure continues until a fracture occursinside the borehole, while in the case of HTPF this procedure continues up to a time of about 1 min.
• Injection and system shut-in terminated after about 3 min.
• The interval pressure released and the recovered fluid volume observed.
• In order to observe the shut-in pressure of fractures, several repetitions of re-pressurization of the test
interval with constant injection rate of about 0.12-0.3 m3/s for about 1 min done.
• Injection and system shut-in terminated after about 3 min.
• The interval pressure released and the recovered fluid volume observed.
183
ZIAIE MOAYED, IZADI, FAZLAVI
• A step-rate injection test with stepwise increase in the injection flow-rate conducted and the correspondinginjection pressure observed.
• Injection and system shut-in terminated after about 3 min.
• The interval pressure released and the recovered fluid volume observed.
• The final step-rate test conducted as usually done for the classical Lugeon test, referred to in this studyas ”SP-test” (second permeability test).
• Finally, the packer deflated and prepared for the next test section.
5. Test results and discussion
5.1. Analysis and interpretation of HFT results
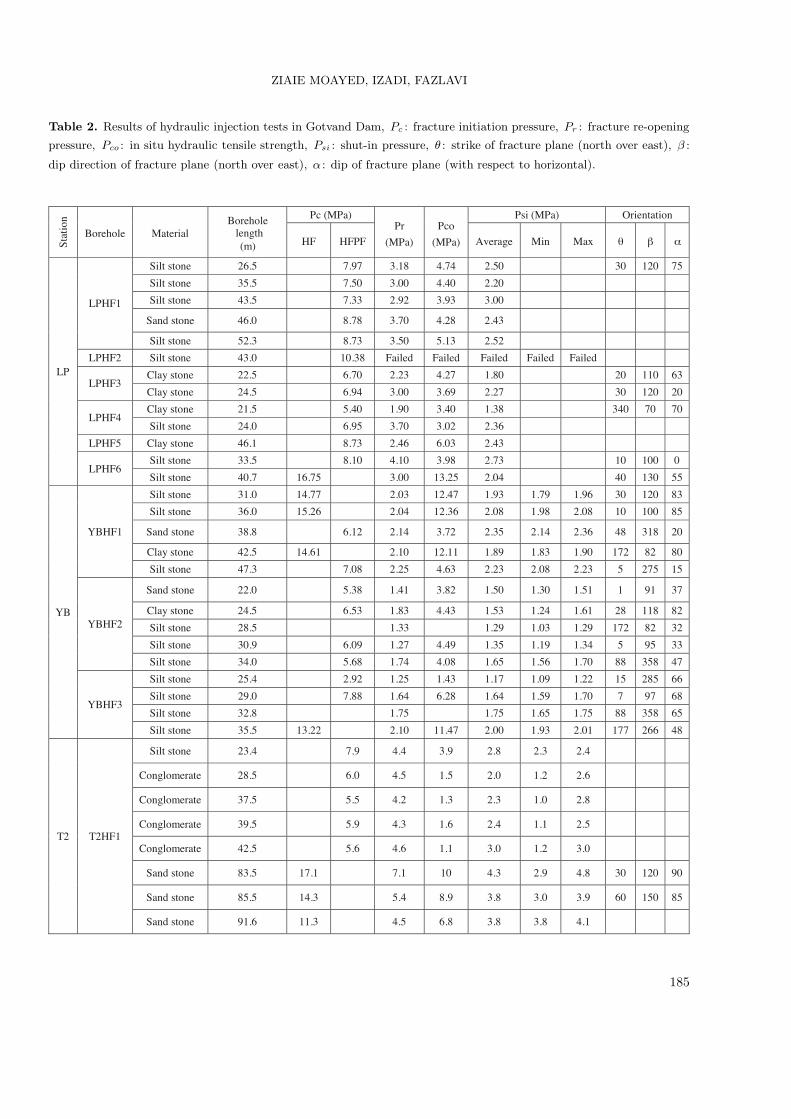
During each test, the injection pressure and injection flow rate and the recovered fluid volume were recordedby the digital data acquisition system. The derived parameters of HFT (breakdown pressure at the moment offracture initiation, Pc ; fracture re-opening pressure, Pr ; shut-in pressure, Psi ; and the resulting in situ tensilestrength, Pco) as well as the results of the impression packer tests (fracture strike direction, θ ; dip direction,
β ; and dip, α) in the boreholes are summarized in Table 2. It is important to note that during the tests forthe borehole no. LPHF2 the packer failed and the continuation of the test was interrupted; thus the completedata for LPHF2 are not available.
For instance, the analysis of the graphical test record at a depth of 36 m at the YB station, borehole no.YBHF1 is shown in Figure 6. In this diagram, the pressure-time plot and methods for determination of Pc ,Pr , and Pco are shown.
The shut-in pressure Psi was determined by the following 3 steps (Guo et al., 1993):
• The plot of pressure-injection flow-rate allows one to determine the exact pressure value at which thehydraulic flow terminates (Q = 0). Therefore, the P-Q plot yields an upper-limit estimate of the shut-in
pressure (Psi(max) in Table 2).
• A Muskat-type plot of the logarithm of the difference between the pressure P and an asymptotic pressurelevel Pa vs. time t yields the lower-limit of the shut-in pressure (Psi(min) in Table 2.) , assuming that
the linear part of the plot characterizes radial flow, i.e. the stimulated fracture is nearly closed.
• These 2 limits of shut-in pressure, which indicate acting stress normal to the fracture plane, mark atransition from a rapid linear pressure drop, observed immediately after shut-in, to the beginning of adiffusion-dominated slow pressure decrease. This transition can be determined by a tangent to the linearpressure decrease known inflection point in the pressure-time plot (Psi(average) in Table 2.). This approach
was proposed by Gronseth and Kry (1981).
The derived characteristic pressure data (Pc , Pr, Psi, Pco) against true vertical depth (TVD), are shown
graphically in Figure 7 to Figure 10, respectively. Note that the fracture initiation pressures of all the boreholesincreased with increase in depth.
184
ZIAIE MOAYED, IZADI, FAZLAVI
Table 2. Results of hydraulic injection tests in Gotvand Dam, Pc : fracture initiation pressure, Pr : fracture re-opening
pressure, Pco : in situ hydraulic tensile strength, Psi : shut-in pressure, θ : strike of fracture plane (north over east), β :
dip direction of fracture plane (north over east), α : dip of fracture plane (with respect to horizontal).
Sta
tion
Borehole Material Borehole
length(m)
Pc (MPa) Pr
(MPa)
Pco
(MPa)
Psi (MPa) Orientation
HF HFPF Average Min Max θ β α
LP
LPHF1
Silt stone 26.5 7.97 3.18 4.74 2.50 30 120 75
Silt stone 35.5 7.50 3.00 4.40 2.20
Silt stone 43.5 7.33 2.92 3.93 3.00
Sand stone 46.0 8.78 3.70 4.28 2.43
Silt stone 52.3 8.73 3.50 5.13 2.52
LPHF2 Silt stone 43.0 10.38 Failed Failed Failed Failed Failed
Figure 6. Graphical diagram of HFT result at the YB station at Gotvand Dam site (borehole no. YBHF1-depth:
36 m).
0
10
20
30
40
50
60
70
80
90
0 5 10 15 20
Dep
th (
m)
Pc (MPa)
LP Station
YB Station
T2 Station
0
10
20
30
40
50
60
70
80
90
0 2 4 6 8
Dep
th (
m)
Pr (MPa)
LP STation
YB Station
T2 Station
Figure 7. Breakdown pressure Pc at Gotvand Dam site. Figure 8. Fracture re-opening pressure (Pr) at Gotvand
Dam site.
186
ZIAIE MOAYED, IZADI, FAZLAVI
0
10
20
30
40
50
60
70
80
90
0 1 2 3 4 5
Dep
th (
m)
Psi (MPa)
LP Station
YB Station
T2 Station
0
10
20
30
40
50
60
70
80
90
0 5 10 15
Dep
th (
m)
Pco (MPa)
LP Station
YB Station
T2 Station
Figure 9. Shut-in pressure (Psi) at Gotvand Dam site. Figure 10. In situ tensile strength (Pco) at Gotvand Dam
site.
5.2. Tracing of the fracture
After completion of all HFT and HTPF, the straddle packer tool was replaced by the impression packer. Theimpression packer tests consisted of an inflation of the impression packer element to a pressure approximately20% above the fracture re-opening pressure for a time of about 30 min. After recovery of the packer tool tothe surface, the fracture trace is marked on the packer sleeve and reflected to a transparent plastic cover sheetwrapped around the packer. The captured pictures from the borehole camera and compass unit provide theorientation of the reference mark with respect to magnetic north. Examples of the fracture traces observedduring impression packer testing are shown in Figure 11.
Figure 11. Effect of HF crack on impression packer plastic cover at YB station of Gotvand.
187
ZIAIE MOAYED, IZADI, FAZLAVI
Using the above method, all the hydraulic fracturing tests and hydraulic injection tests in pre-existingfractures as well as impression packer tests for fracture orientation determination were carried out in the AJand BK formation boreholes.
5.3. Stress evaluation from hydraulic fracturing tests
To derive stresses from measurements in boreholes, it is necessary to consider the stress distribution around acircular hole subjected to far-field compressive stresses. This solution was first derived by Kirsch (1898). In thecase where the borehole axis is parallel to the maximum principal stress, the Hubbert and Willis formula forthe critical pressure Pc at the moment of fracture initiation is used (Hubbert and Willis, 1957; Haimson and
Fairhurst, 1970):
Pc = 3.Sh − SH + Pco − Pp (1)
where Sh and SH are the horizontal far-field principal stresses, Pco is the in situ tensile strength of the rock,and Pp is the pore pressure in the rock mass. Pc is often called the breakdown pressure during the hydraulic
fracturing process. It is assumed that the vertical stress is a principal stress and equal to the overburden stress,and the rock is homogeneous, isotropic, and initially impermeable, and that the induced fracture is orientedperpendicular to the minimum horizontal principal stress Sh . The last assumption yields:
Psi = Sh (2)
where Psi is the shut-in pressure to merely keep the fracture open after the pressurizing system. After pressurerelease, the fracture may close. It can be re-opened during subsequent pressure cycles at a pressure of:
Pr = 3.Sh − SH − Pp = Pc − Pco (3)
Using this linear elastic approach, the principal stresses can be expressed by the relations:
Sh = Psi
SH = 3.Psi − Pr − Pp
Sv = ρ.g.z
Pco = Pc − Pr
(4)
Thus, the stress analysis only requires knowledge of the rock mass density, ρ , the determination of characteristicpressure values in particular the shut-in pressure, Psi , and re-opening pressure, Pr , at depth z where the fractureis produced.
Considering the simple and idealistic assumptions used in the above approach, the determination ofstresses by Eqs. (4) may sometimes be questioned. This, in particular, applies to the assumptions on rock massisotropy.
The resulting minimum and intermediate principal stresses, Sh and SH , are listed in Tables 3 to 5,and are shown graphically in Figures 12 to 14, for stations LP, YB, and T2, respectively. For vertical stress
calculation an average value of about 2.480 g/cm3 was considered, according to the results of experiments onthe rock density.
188
ZIAIE MOAYED, IZADI, FAZLAVI
Table 3. Results of the stress evaluation using the Hubbert and Willis (1957) approach at the LP station, Gotvand
Dam.
BoreholeTest code
Borehole Sh SH SV θ for SHno. length (m) (MPa) (MPa) (MPa) (deg)
Figure 12. Principal stress interpretations at the LP station: (a) Principal stress vs. depth; (b) Horizontal stress
orientation vs. depth
0
5
10
15
20
25
30
35
40
45
50
0 2 4 6
Dep
th (
m)
Stress (MPa)
Sh
SH
Sv
0
5
10
15
20
25
30
35
40
45
50
0 60 120 180 240 300 360
Dep
th (
m)
Azimuth (0 for N)
Maximum Horizontal Stress
Minimum Horizontal Stress
Figure 13. Principal stress interpretations at the YB station: (a) Principal stress vs. depth; (b) Principal stress
orientation vs. depth.
190
ZIAIE MOAYED, IZADI, FAZLAVI
0
10
20
30
40
50
60
70
80
90
100
0 5 10
Dep
th (
m)
Stress (MPa)
Sh
SH
Sv
0
10
20
30
40
50
60
70
80
90
0 60 120 180 240 300 360
Dep
th (
m)
Azimuth (0 for N)
Maximum Horizontal Stress
Minimum Horizontal Stress
Figure 14. Principal stress interpretations at the T2 station: (a) Principal stress vs. depth; (b) Principal stress
orientation vs. depth.
Because of the lower elevation of the LP station with respect to the river level and less overburdencompared to the other stations, a horizontal stress is a maximum principal stress caused by tectonic effects.In contrast, at the YB and T2 stations, the vertical stress component is the maximum principal stress. In theother words, this study shows that at the lower penstock tunnels (LP station) the vertical stress, σv , due to thesmall weight of the overburden with given rock density is the intermediate principal stress, while in the tunnelslocated at the YB and T2 stations, σv is the maximum principal stress.
5.4. Maximum horizontal principal stresses orientation
The hydraulic fracturing tests were conducted in both fractured and intact rocks. Regarding the fracture planesbeing induced, the impression packer is used for determining the actual principal stresses. As shown in Table2., the measurements yield an orientation of the maximum horizontal stress, which is the same as most of theinduced and pre-existing fractures, with strike direction of N 30◦ ± 5◦ (NE-SW). This direction is generally the
same as directions indicated by focal mechanisms solutions from earthquakes (Figure 15). As shown in Figure16, the strike direction of the maximum horizontal principal stress is obtained perpendicular to the general faultextension in the test location.
191
ZIAIE MOAYED, IZADI, FAZLAVI
Figure 15. Directions indicated by HFT on Iranian focal mechanism solutions from earthquake map.
Figure 16. Directions indicated by HFT on Iranian fault system.
192
ZIAIE MOAYED, IZADI, FAZLAVI
6. Conclusions
The HFT results at the Gotvand Dam site can be summarized as follows:
• Results of all hydraulic fracturing tests showed that all of the HFT and HTPF parameters (Pc , Pr, Psi ,
and Pco) increase with depth.
• To evaluate the maximum, intermediate, and minimum principal stresses, the Hubbert and Willis formulawas used. The principal stress interpretations showed that due to the small weight of the overburden withgiven rock density at the LP station the vertical component of stress is the intermediate principal stressand a horizontal stress is a maximum principal stress caused by tectonic effects. In contrast, at the otherstations, because of such high overburden, the vertical stress component is the maximum principal stress.
• The measurements yield an orientation of the maximum horizontal stress with strike direction of N 30◦
± 5◦ (NE-SW). This direction is generally compatible with the directions indicated by focal mechanismssolutions from earthquakes. It is also found that the strike direction of most of the induced and pre-existingfractures are the same as the general fault extension in the test location.
References
Ajalloeian, R., Fatehi, L. and Ganjalipour, K., “Evaluation of Hydrojacking and Hydrofracturing Behaviour in Aghajari
Formation (Gotvand Dam Site Foundation), Iran”, Journal of Geology and Mining Research, 3, 46-53, 2011.
ASTM D4645, “Standard Test Method for Determination of In situ Stress in Rock Using the Hydraulic Fracturing
Method”, 1992.
Baumgartner, J. and Rummel, F., “Experience with “Fracture Pressurization Tests” as a Stress Measuring Technique
in a Jointed Rock Mass”, Int. J. of Rock Mech, Min. Sci. & Geomech. Abstr., 26, 661-671, 1989.
Cornet, F.H. and Julien, P.H., “Stress Determination from Hydraulic Test Data and Focal Mechanisms of Induced
Seismicity”, Int. J. Rock Mech. Min. Sci. & Geomech Abstr., 26, 235-248, 1989.
Gronseth, J.M. and Kry, P.R., “Instantaneous Shut-in Pressure and Its Relationship to the Minimum in Situ Stress”,
Proc. Workshop on Hydraulic Fracture Stress Measurements, Monterey, CA, 55-65, 1981.
Guo, F., Morgenstern, N.R. and Scott, J.D., “Interpretation of Hydraulic Fracturing Pressure: A Comparison of Eight
Methods Used to Identify Shut-in Pressure”, Int. J. Rock Mech. Min. Sci. & Geomech. Abstr., 30, 627-631, 1993.
Haimson, B.C. and Fairhurst, C., “In Situ Stress Determination at Great Depth by Means of Hydraulic Fracturing”,
Rock Mechanics—Theory and Practice, (ed.) W. H. Somerton, Am. Inst. Mining Engrg., 559-584, 1970.
Haimson, B.C. and Cornet, F.H., “ISRM Suggested Methods for Rock Stress Estimation—Part 3: Hydraulic Fracturing
(HF) and/or Hydraulic Testing of Pre-Existing Fractures (HTPF)”, Int. J. Rock Mech. & Min. Sci., 40, 1011-1020,
2003. Haimson, B.C., Lee, M.Y. and Song, I., “Shallow Hydraulic Fracturing Measurements in Korea Support Tectonic
and Seismic Indicators of Regional Stress”, Int. J. Rock Mech. & Min. Sci., 40 1243-1256, 2003.
Hanson, M.E., “The New Revised ASTM Standard and ISRM Suggested Method for Conducting Hydraulic Fracturing
In Situ Stress Measurements”, 57-OSE-A1150, 2004.
Hubbert, M.K. and Willis, D.G., “Mechanics of Hydraulic Fracturing”, American Institute of Mining, Metallurgical,
and Engineers Petroleum Transactions, 210, 153-166, 1957.
Jeffrey, R.G., Zhang, X. and Bunger, A.P., “Hydraulic Fracturing of Naturally Fractured Reservoirs”, Thirty-Fifth
Workshop on Geothermal Reservoir Engineering, Stanford University, Stanford, California, February 1-3, 2010. Avail-